
Fabrication of Cu-Al-Mn-Ti Shape Memory Alloys via Selective Laser Melting and Its Nano-Precipitation Strengthening


Abstract
1. Introduction
2. Materials and Methods
2.1. Materials
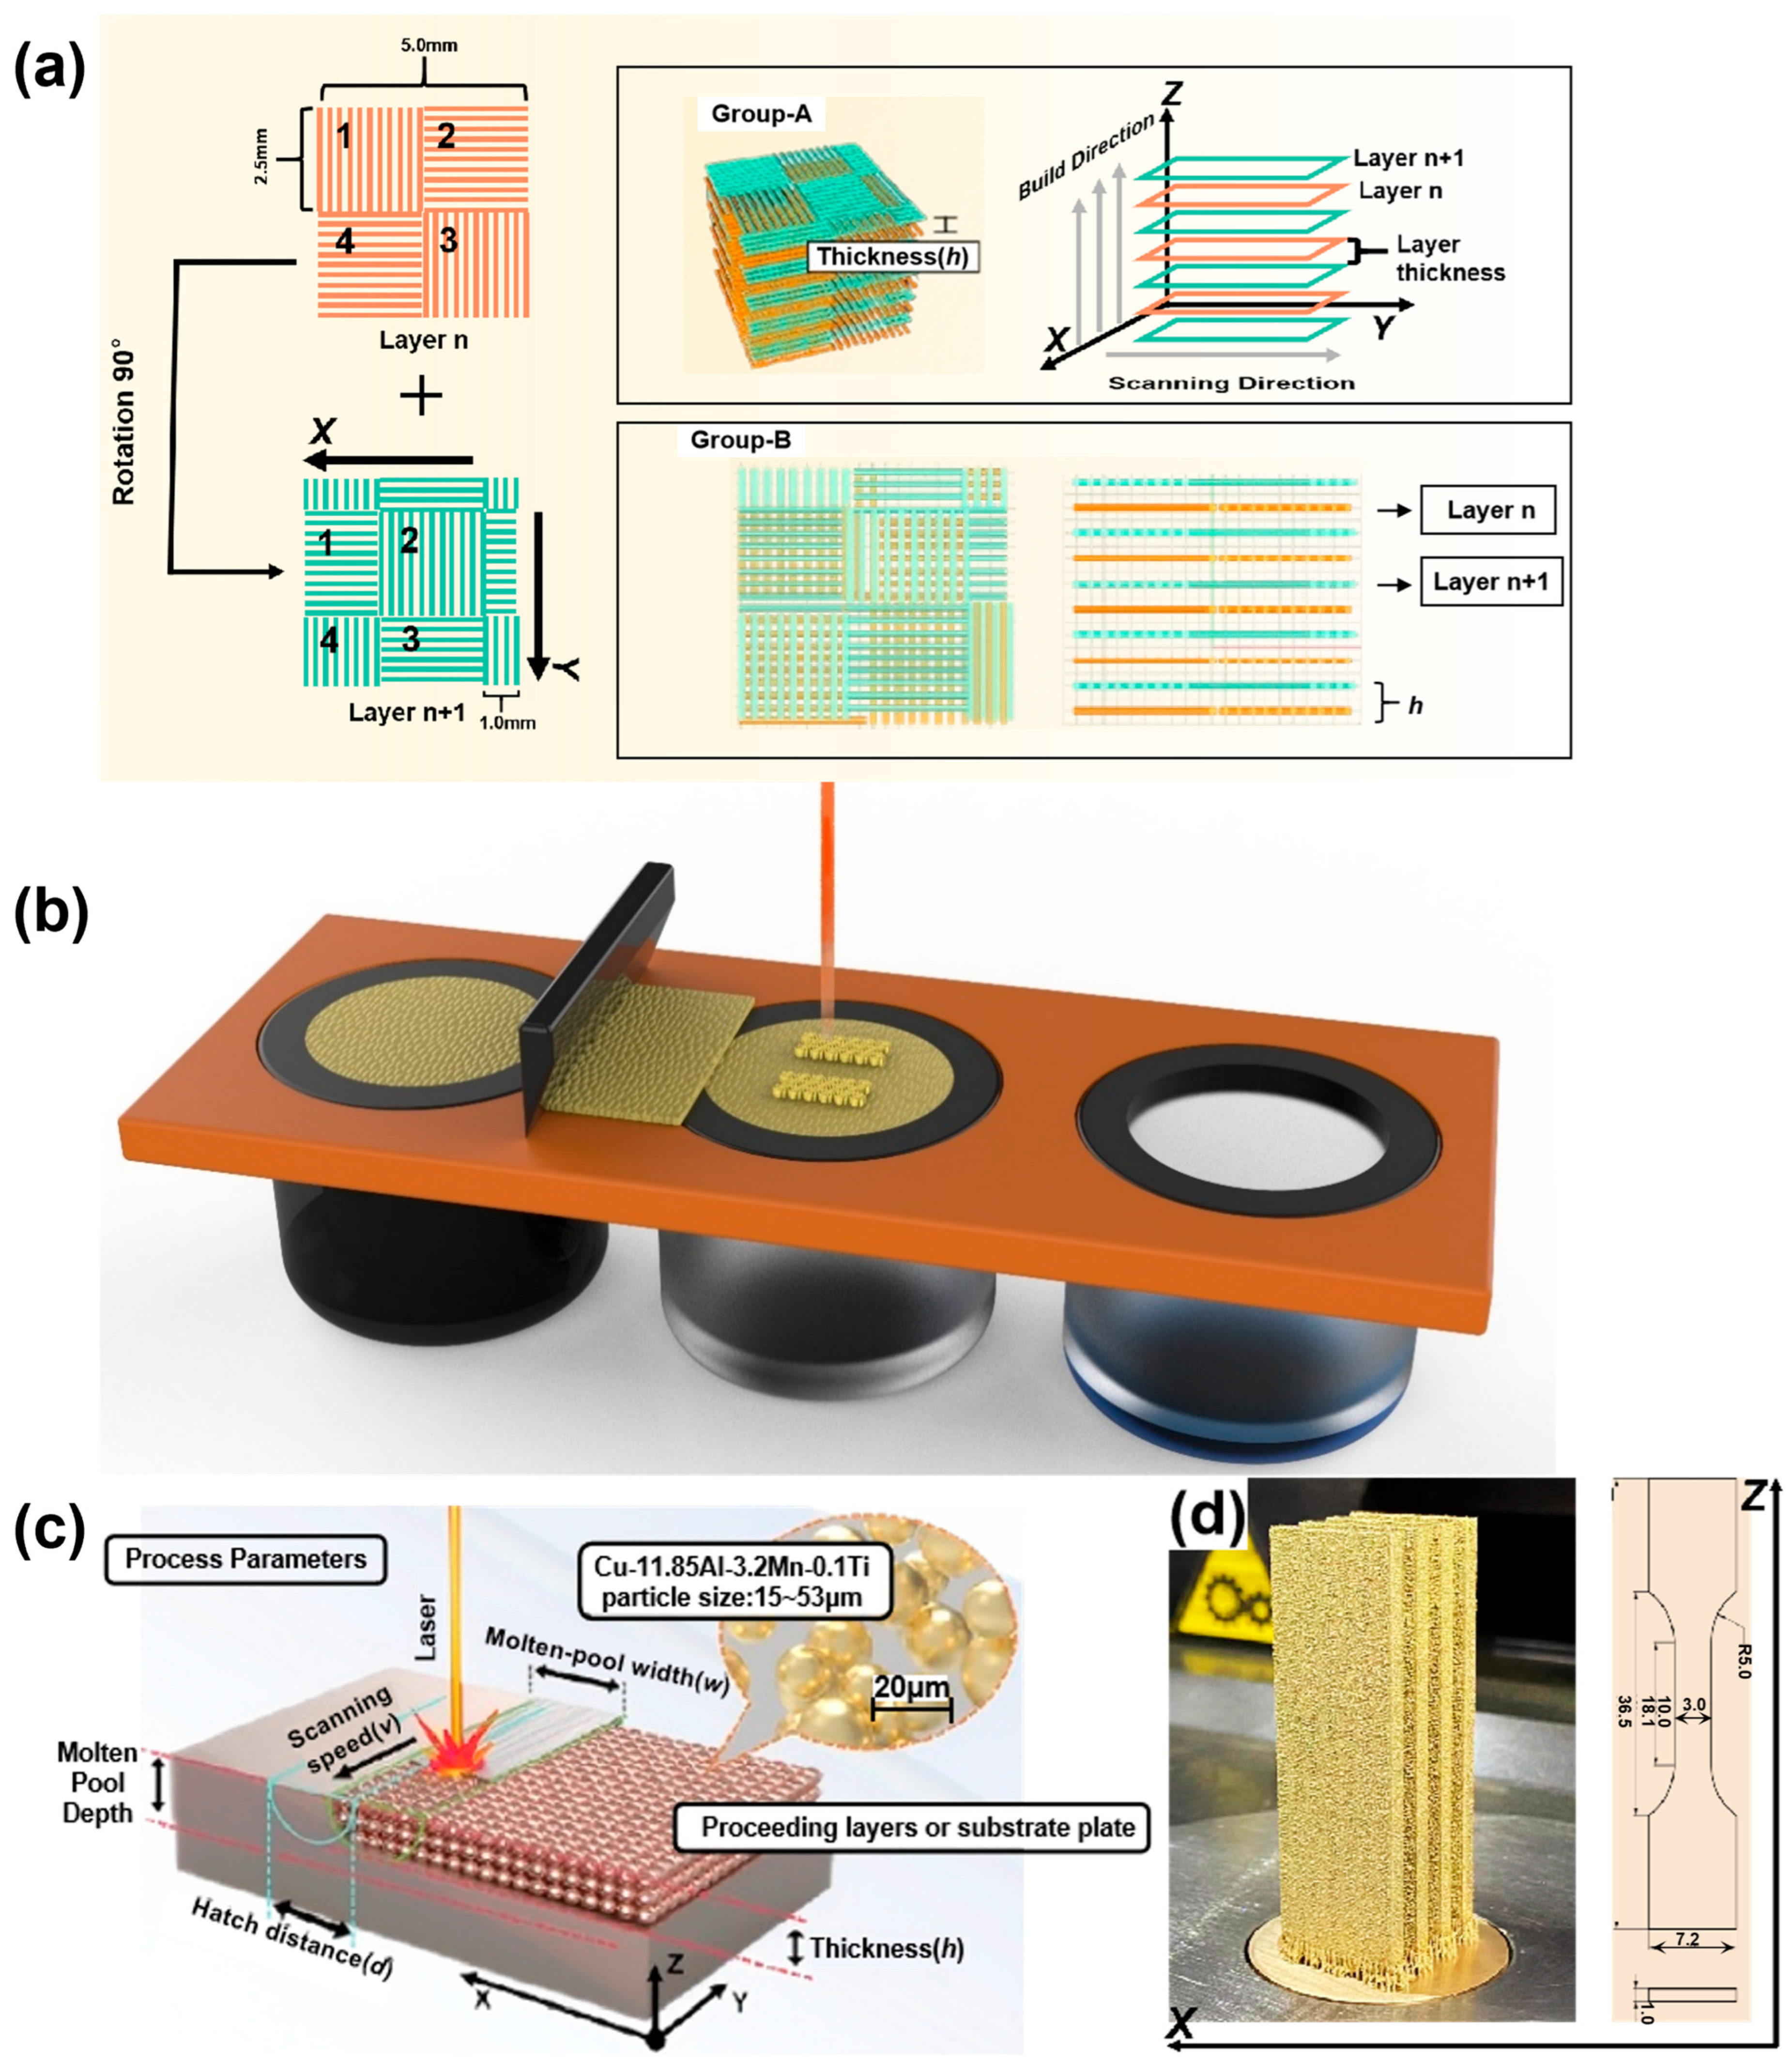
2.2. SLM Process
2.3. Characterization Techniques
3. Results and Discussion
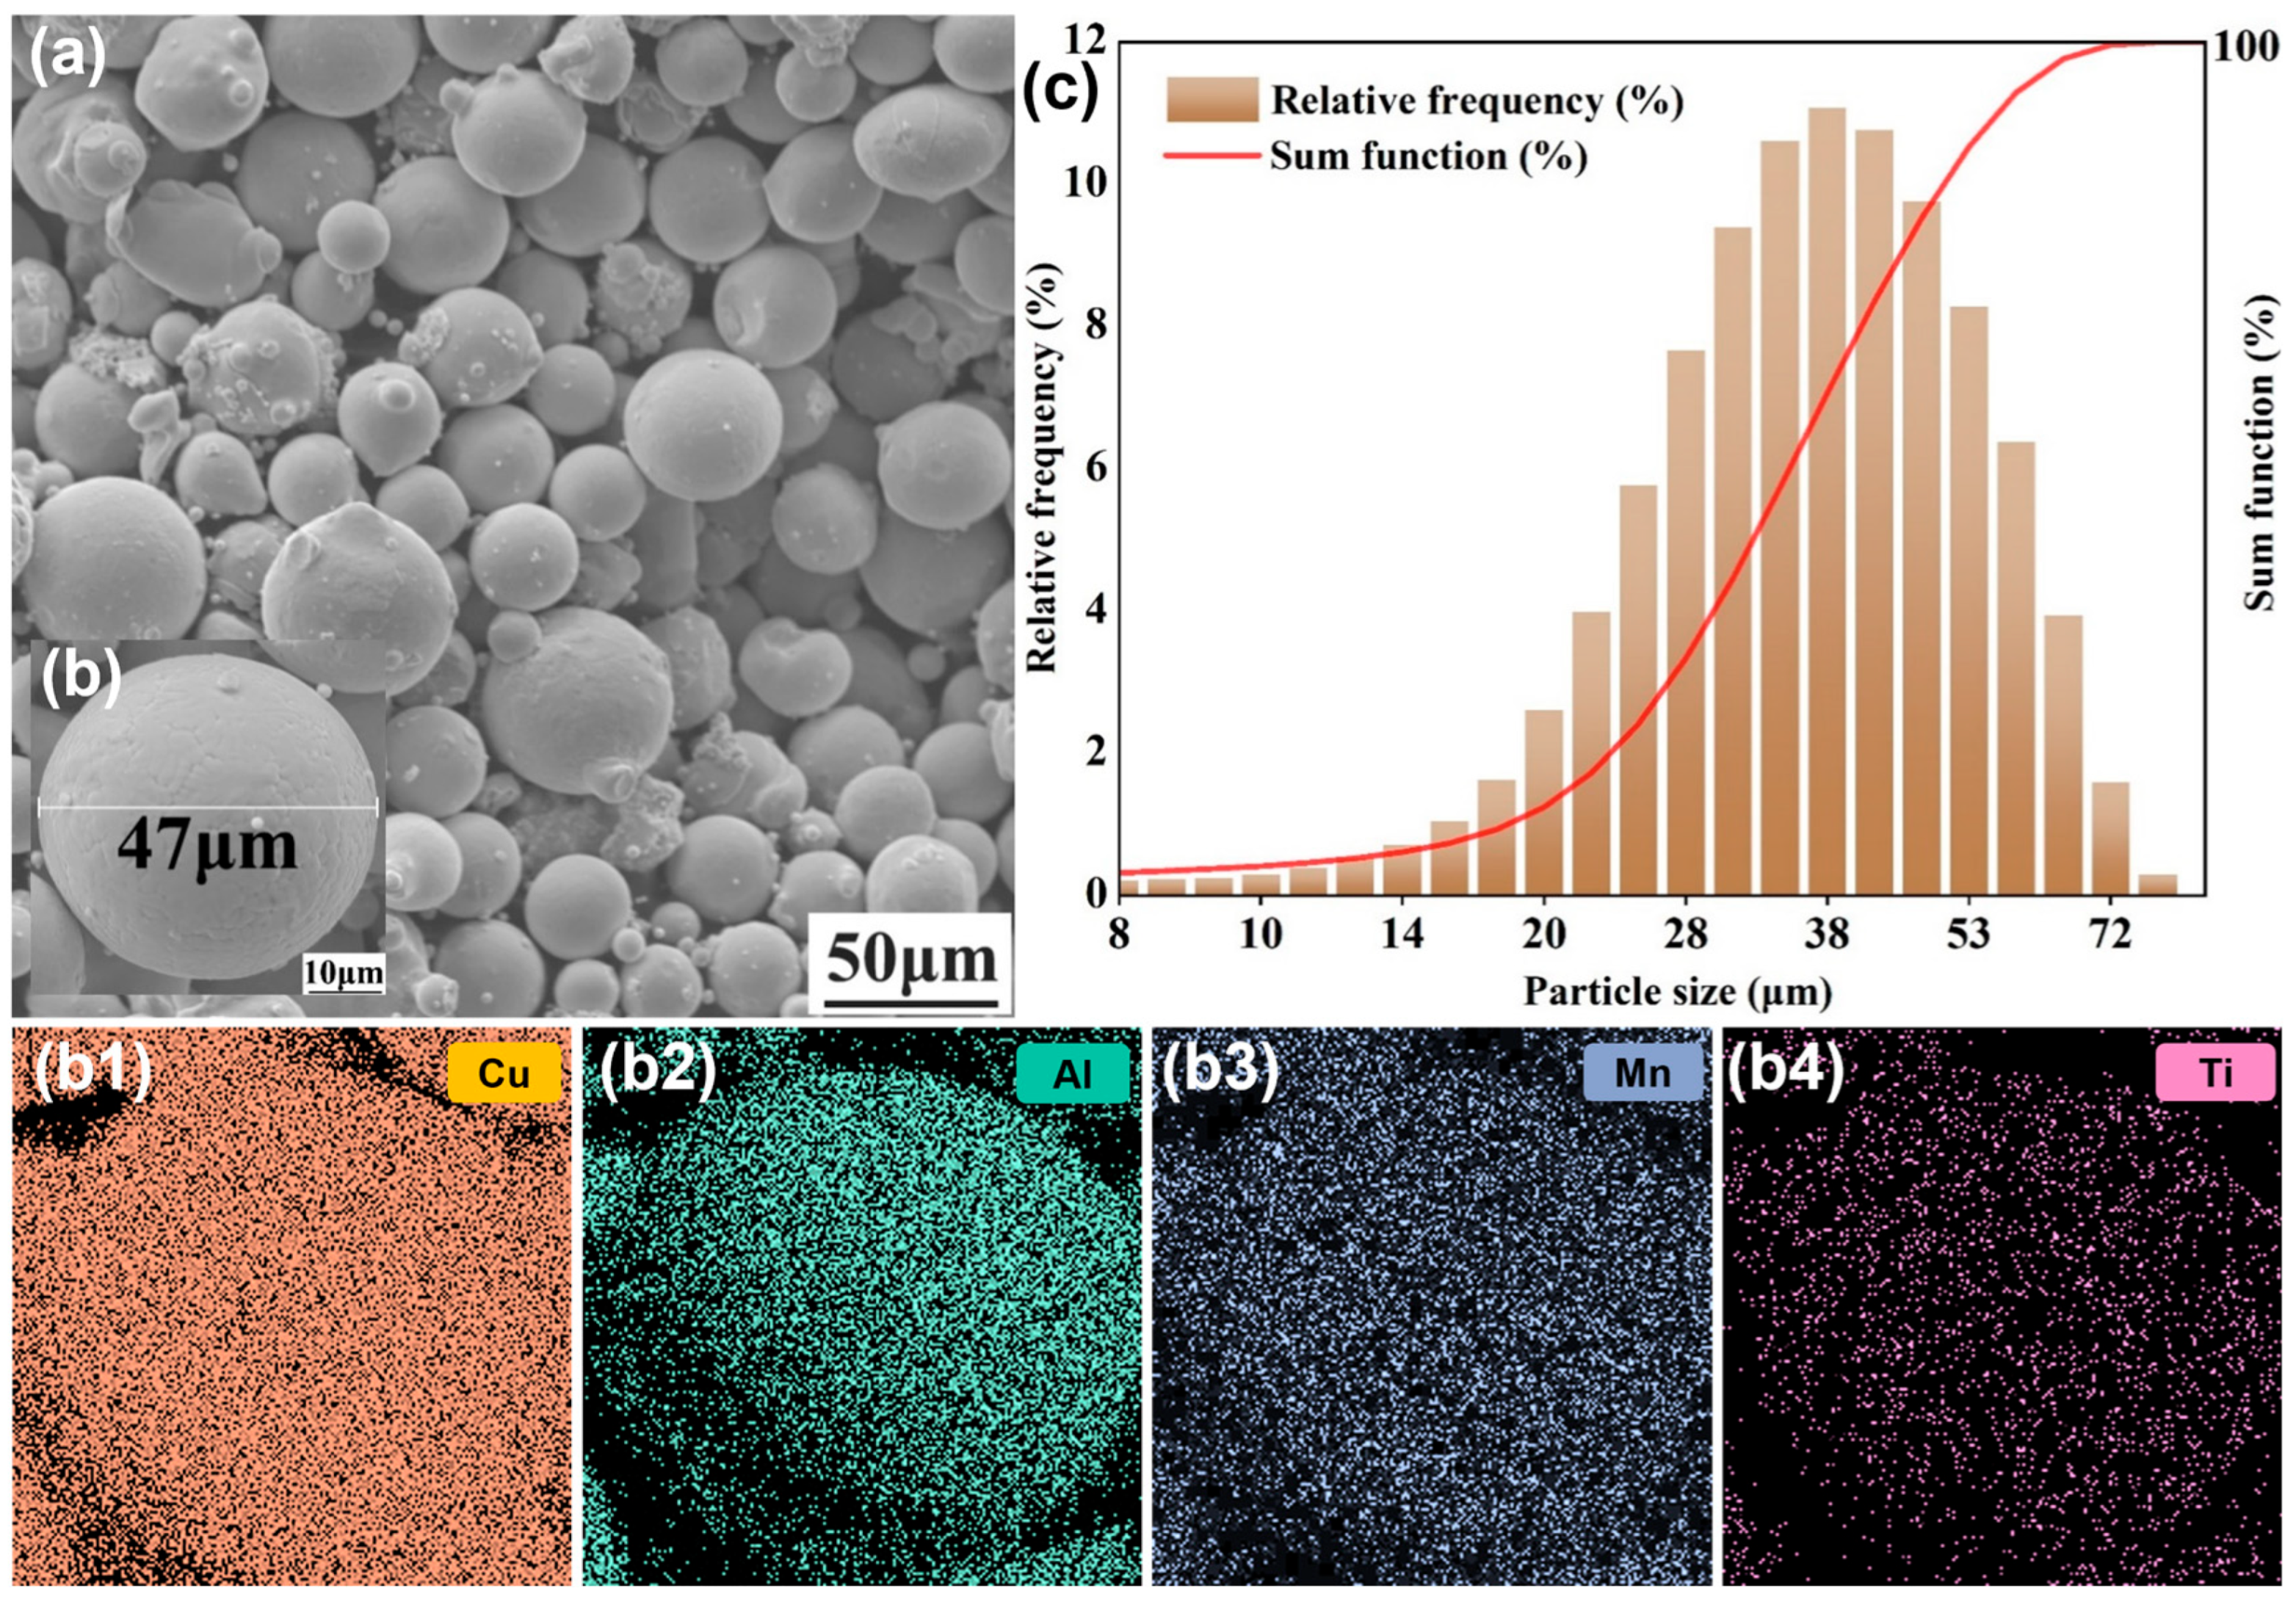
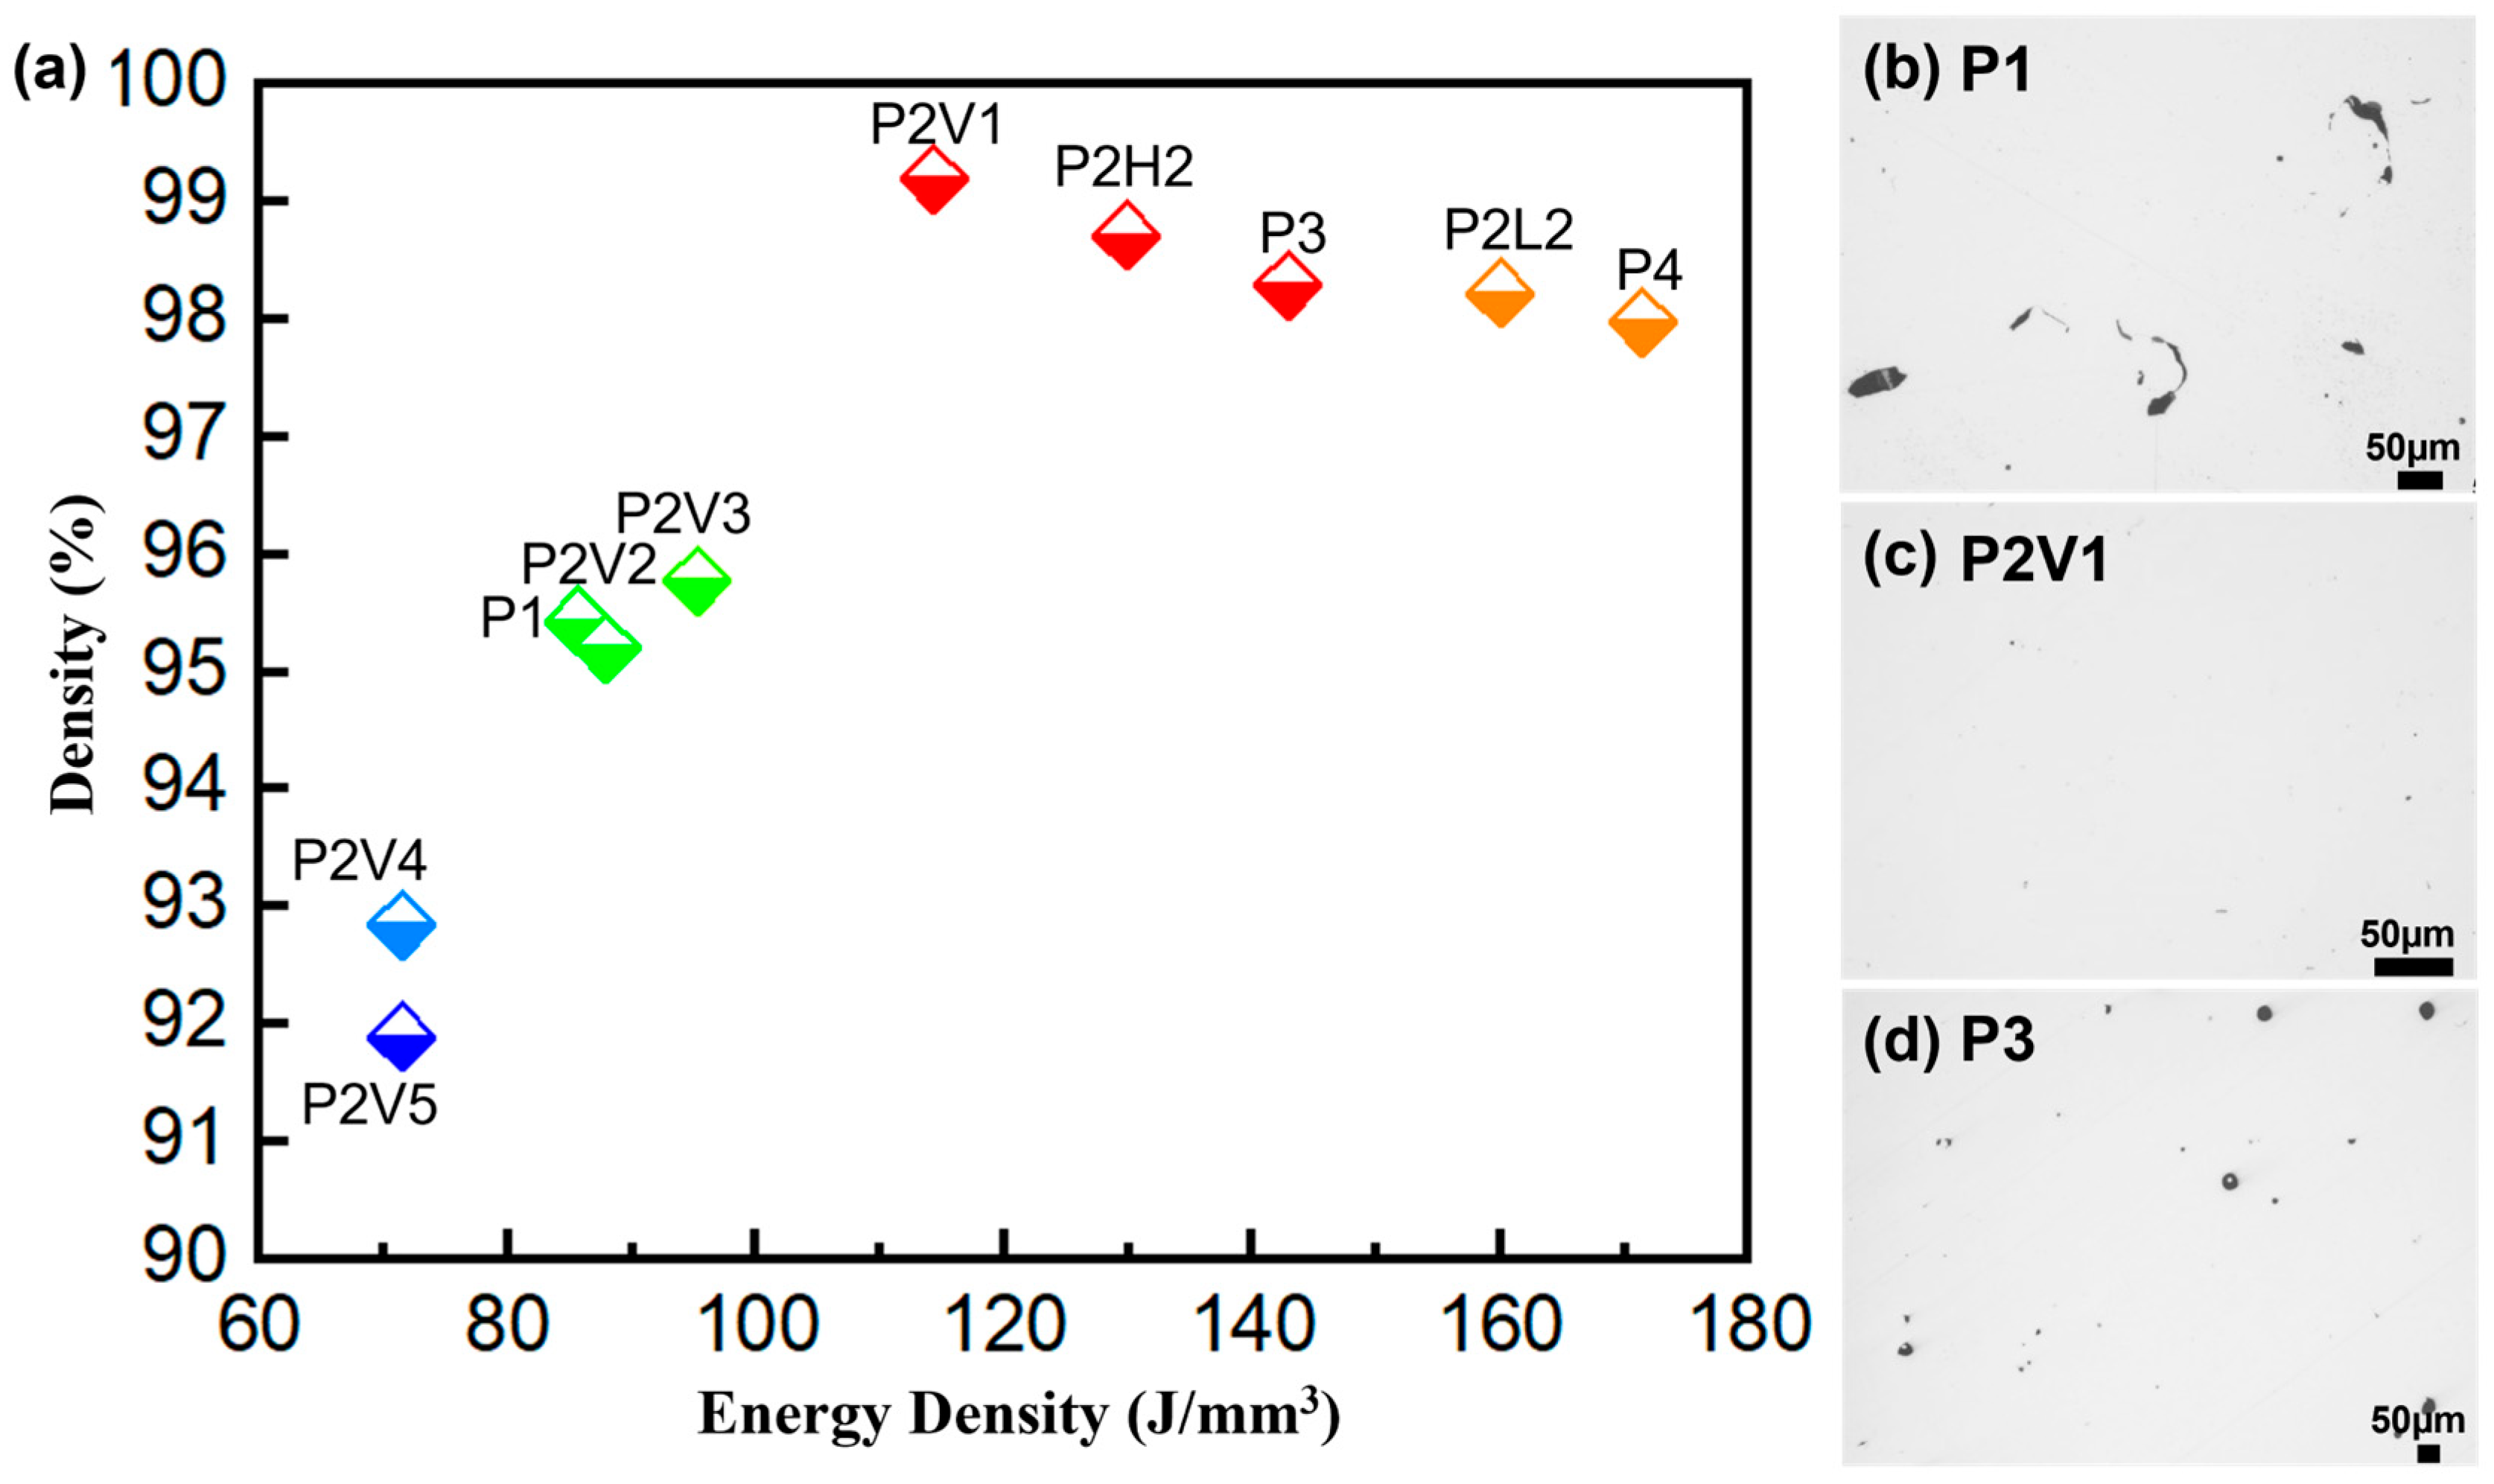
3.1. Powder Analysis and Optimization of Process Parameters
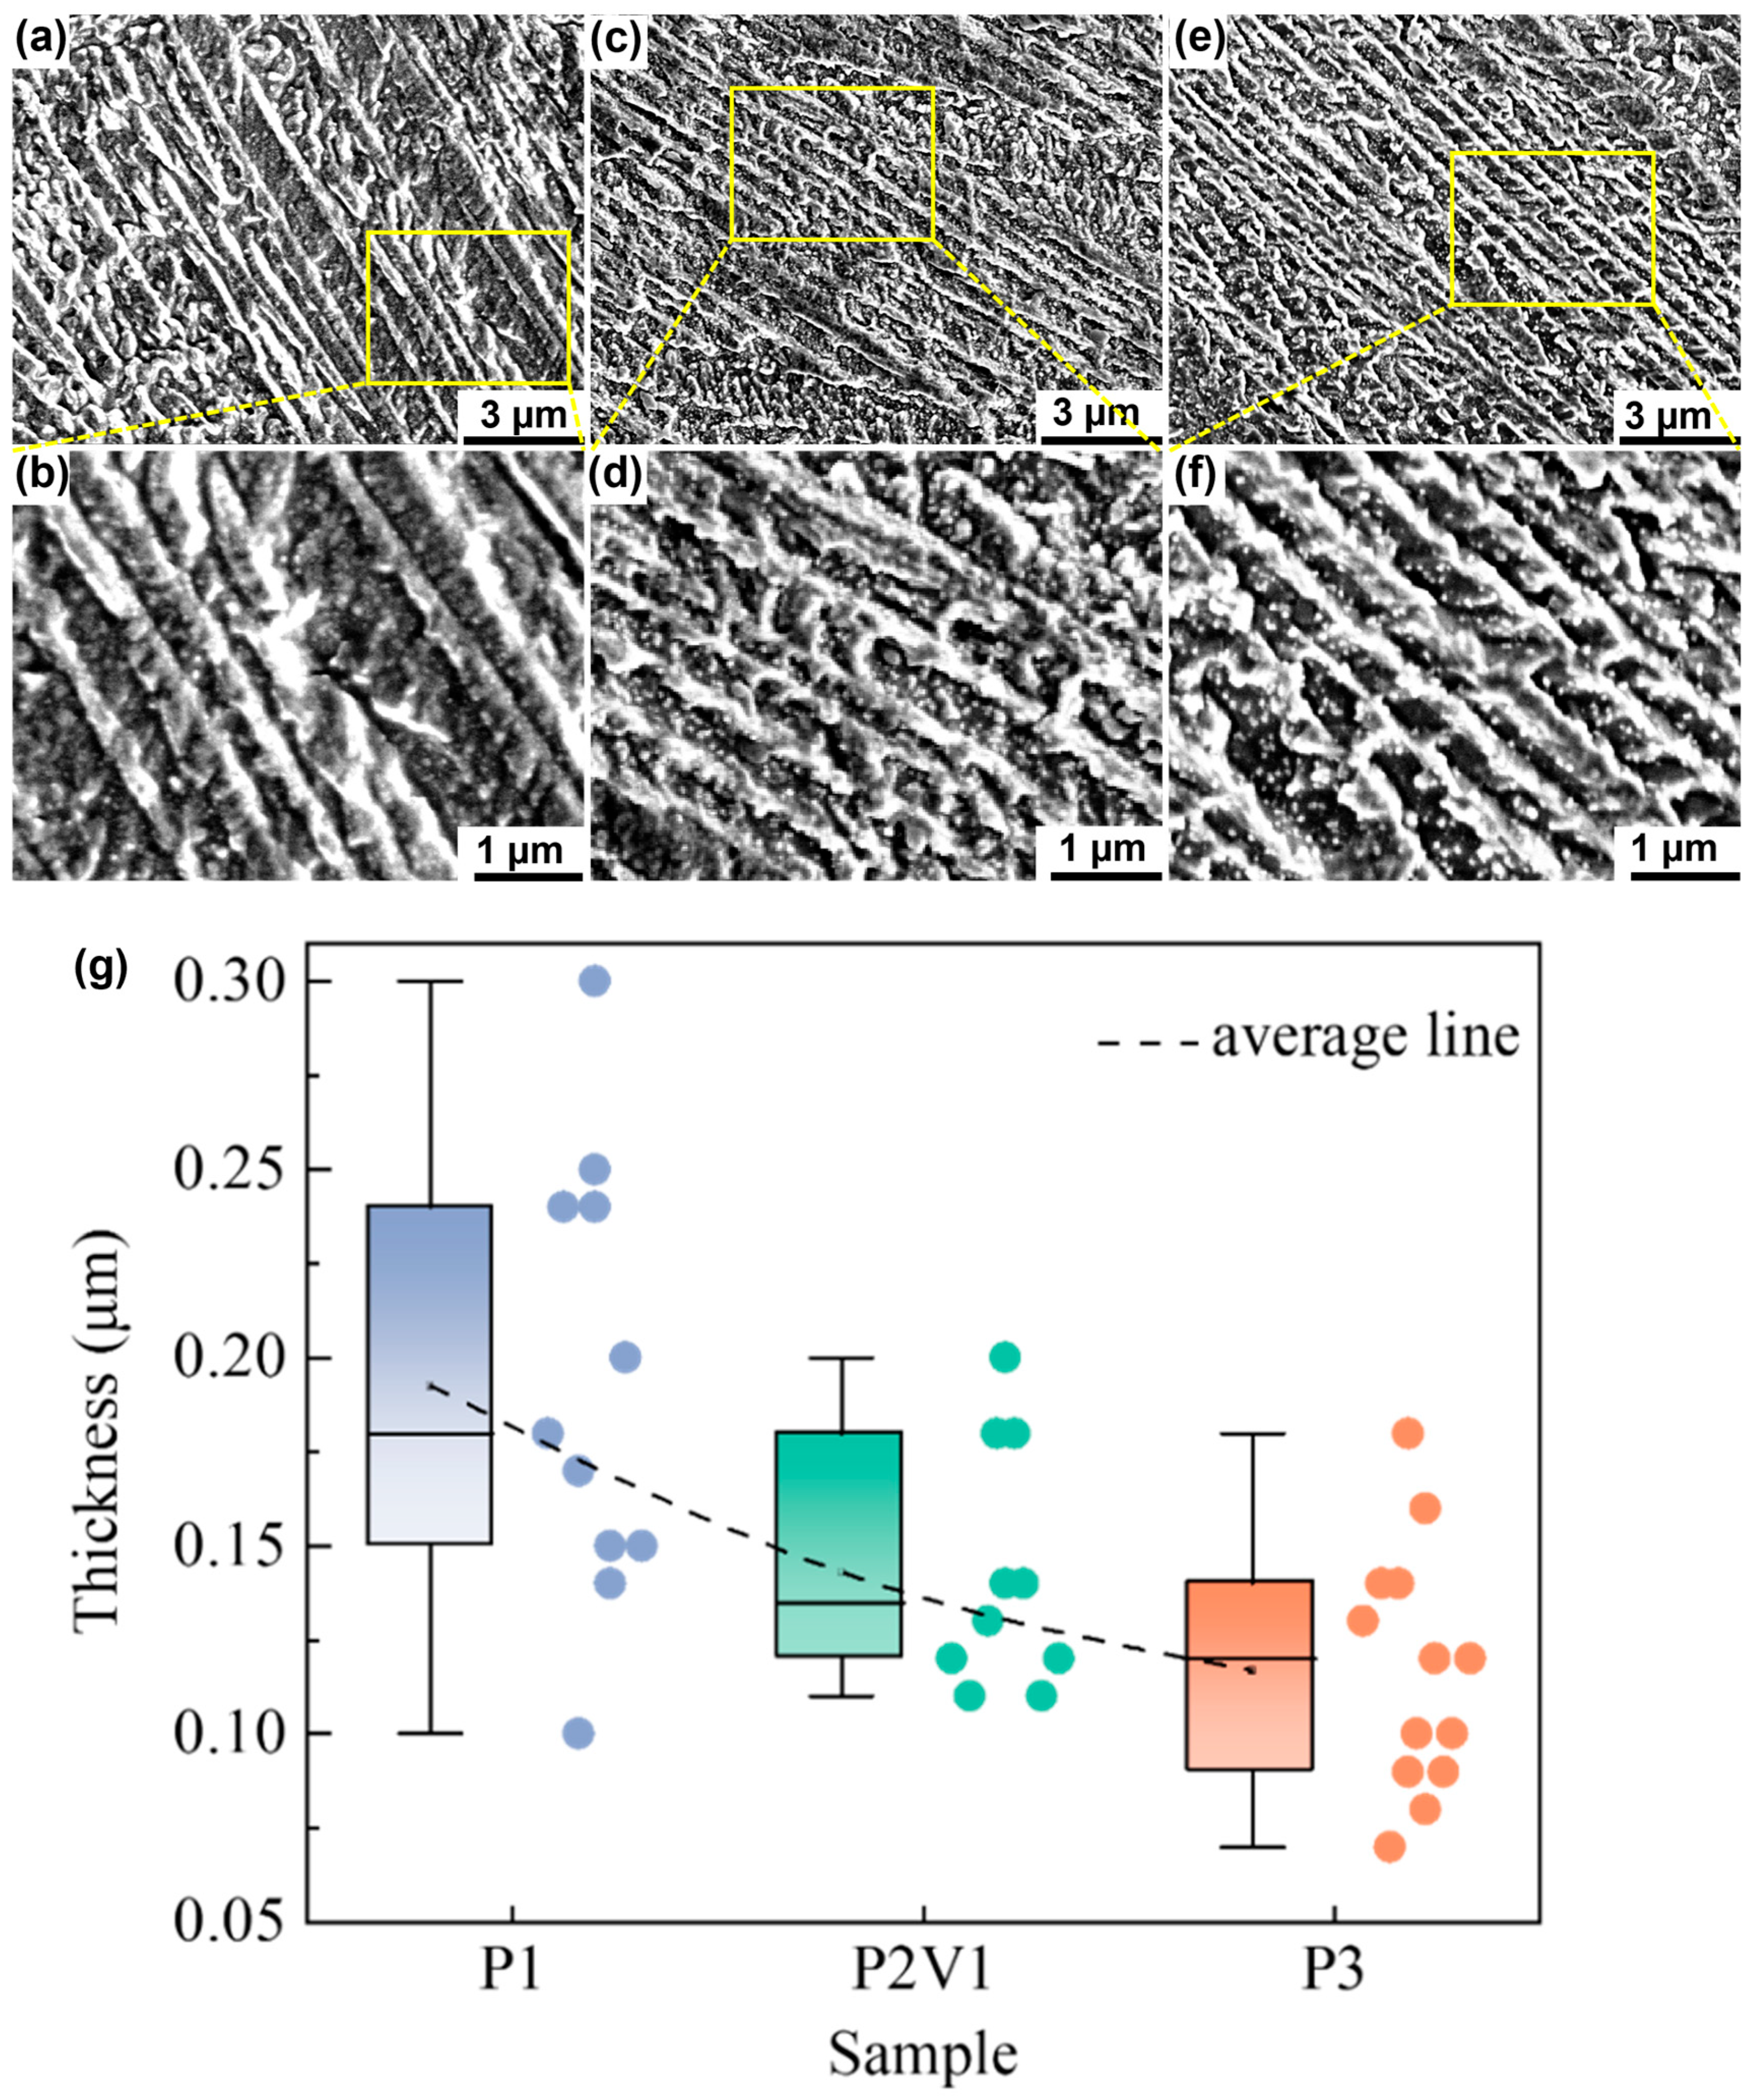
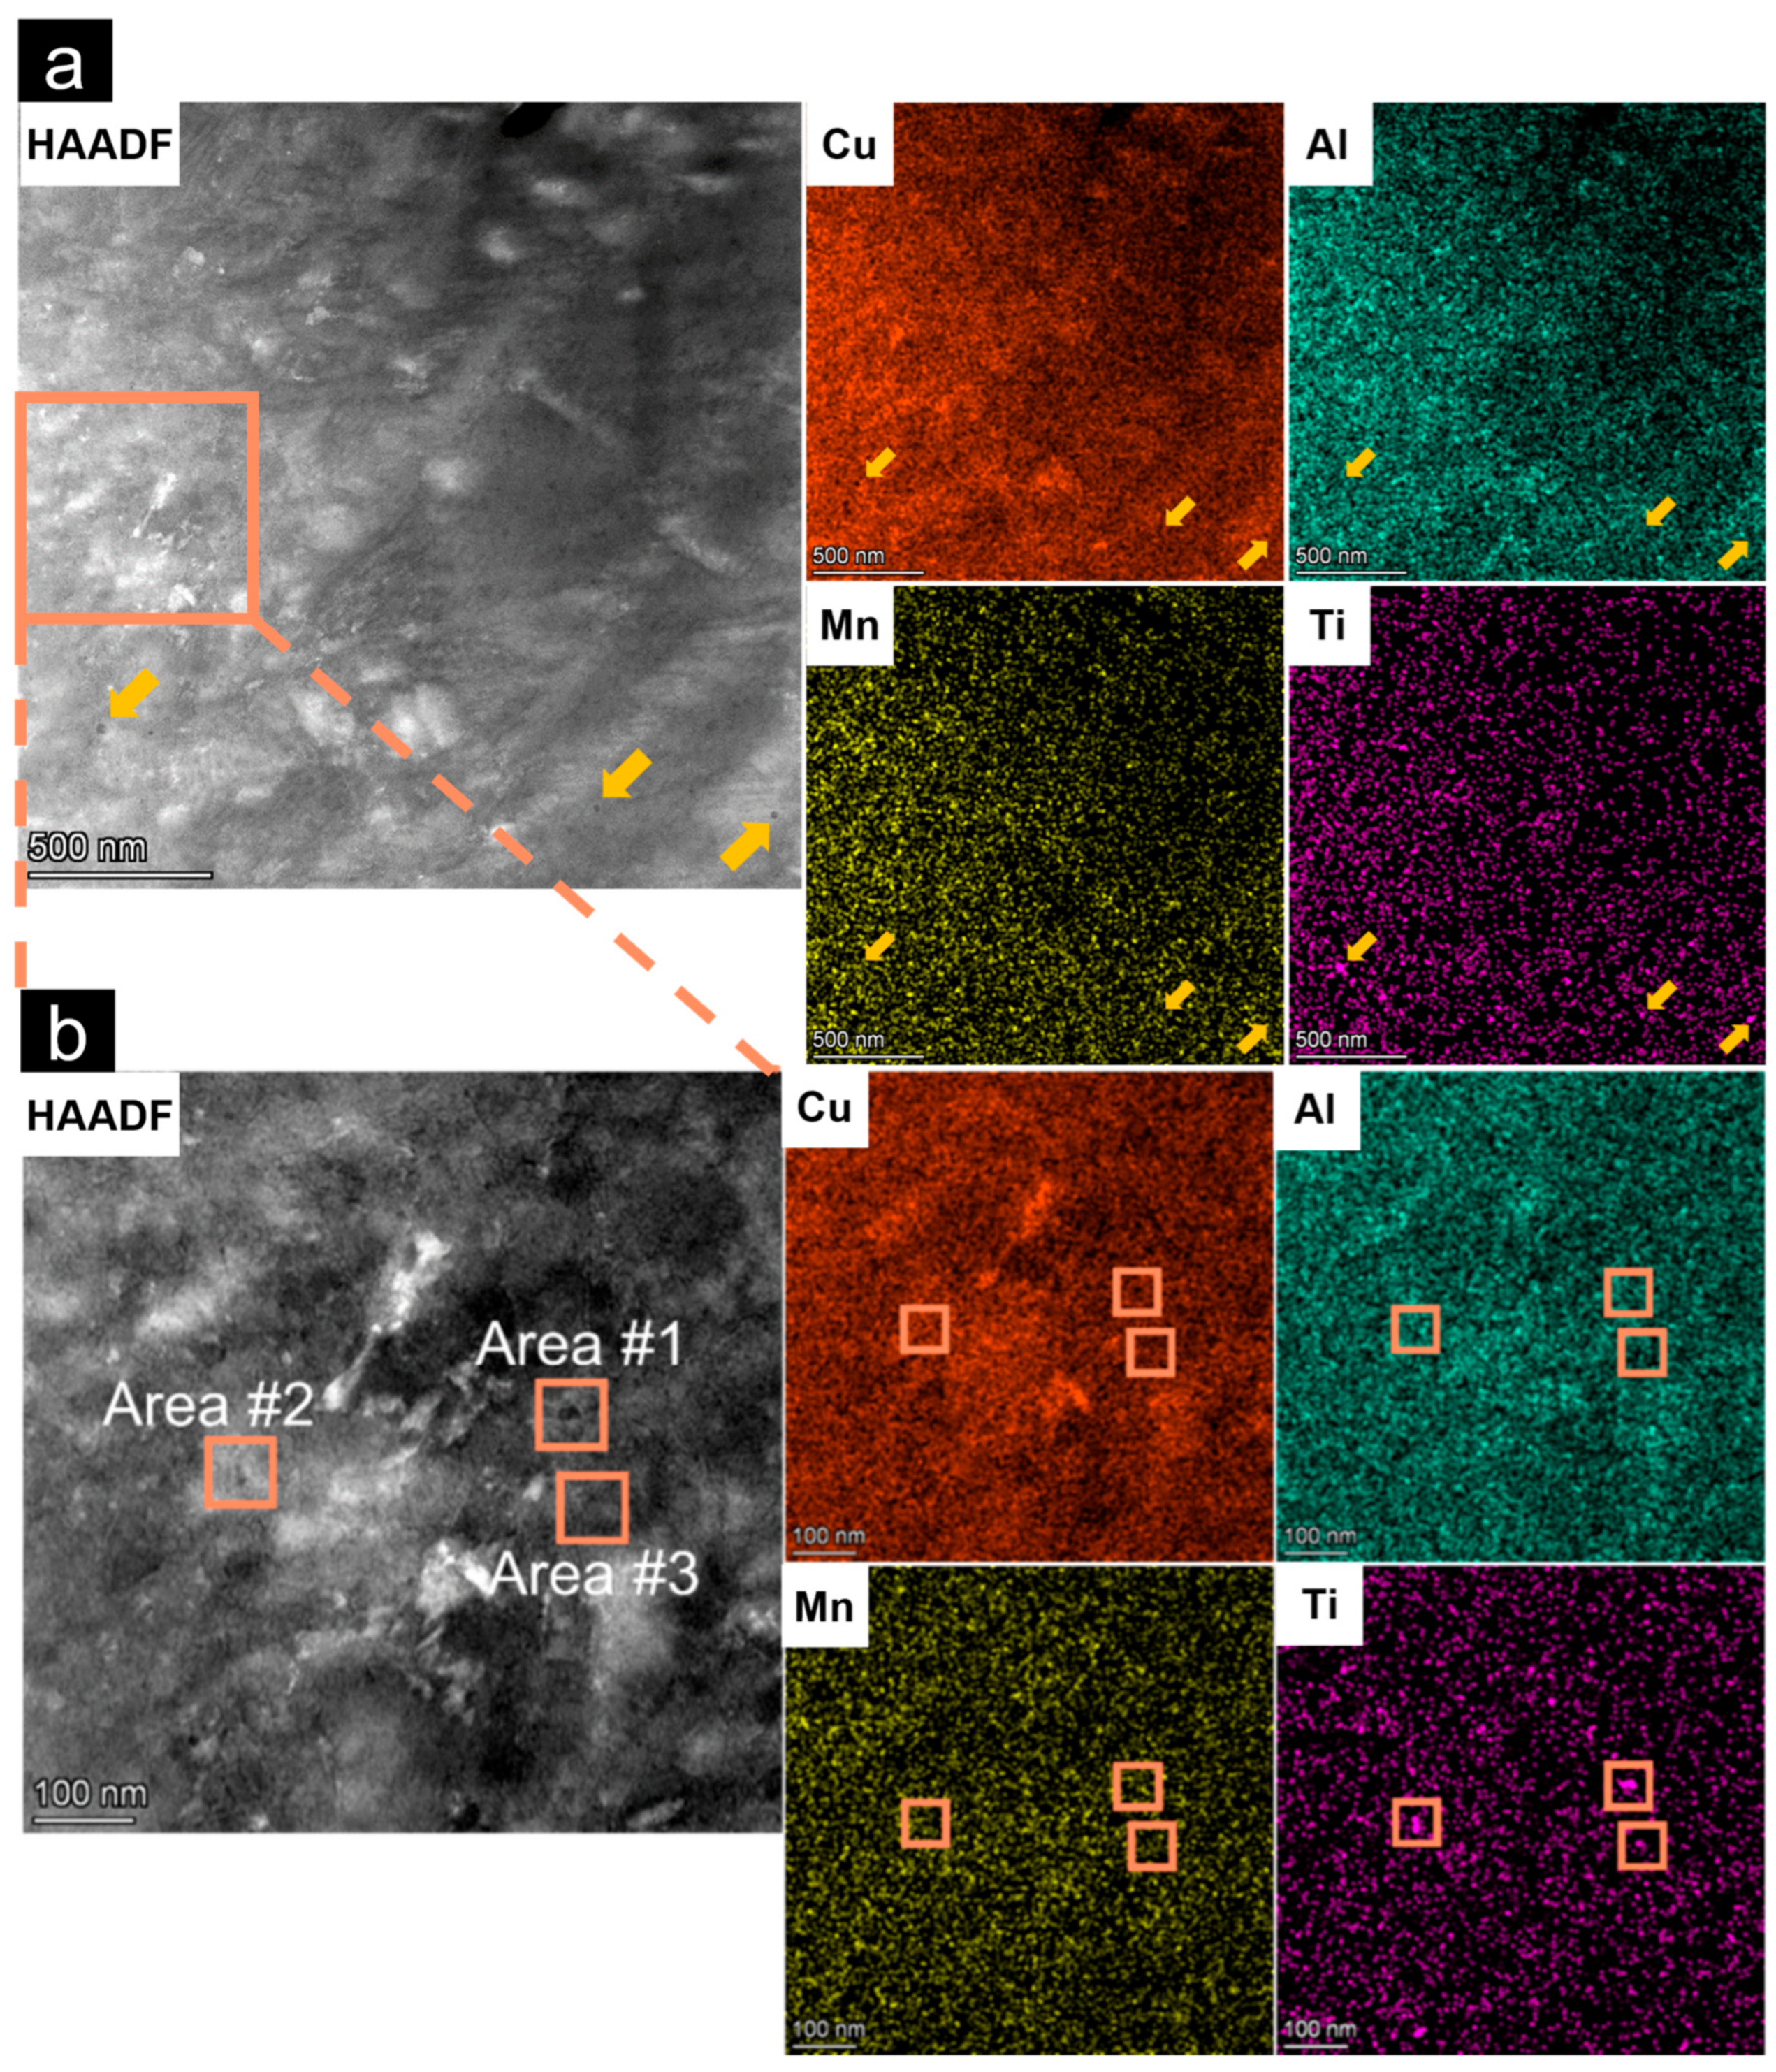
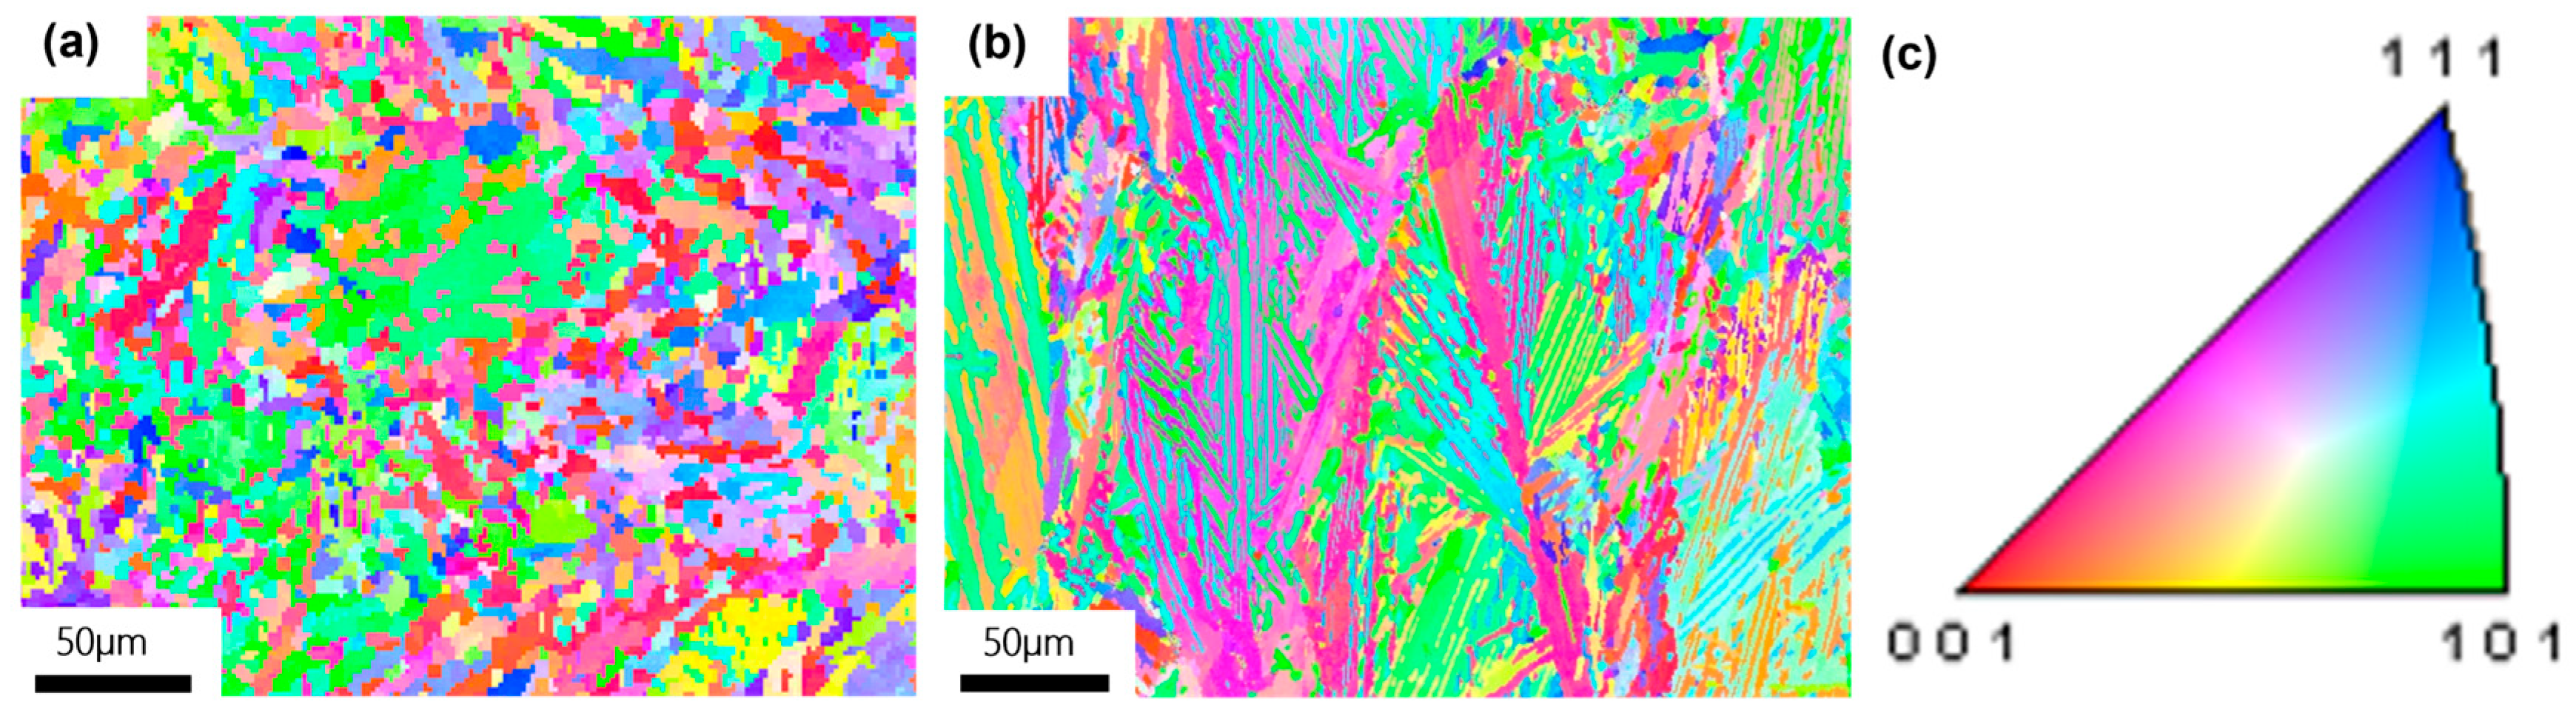
3.2. Microstructural Analysis
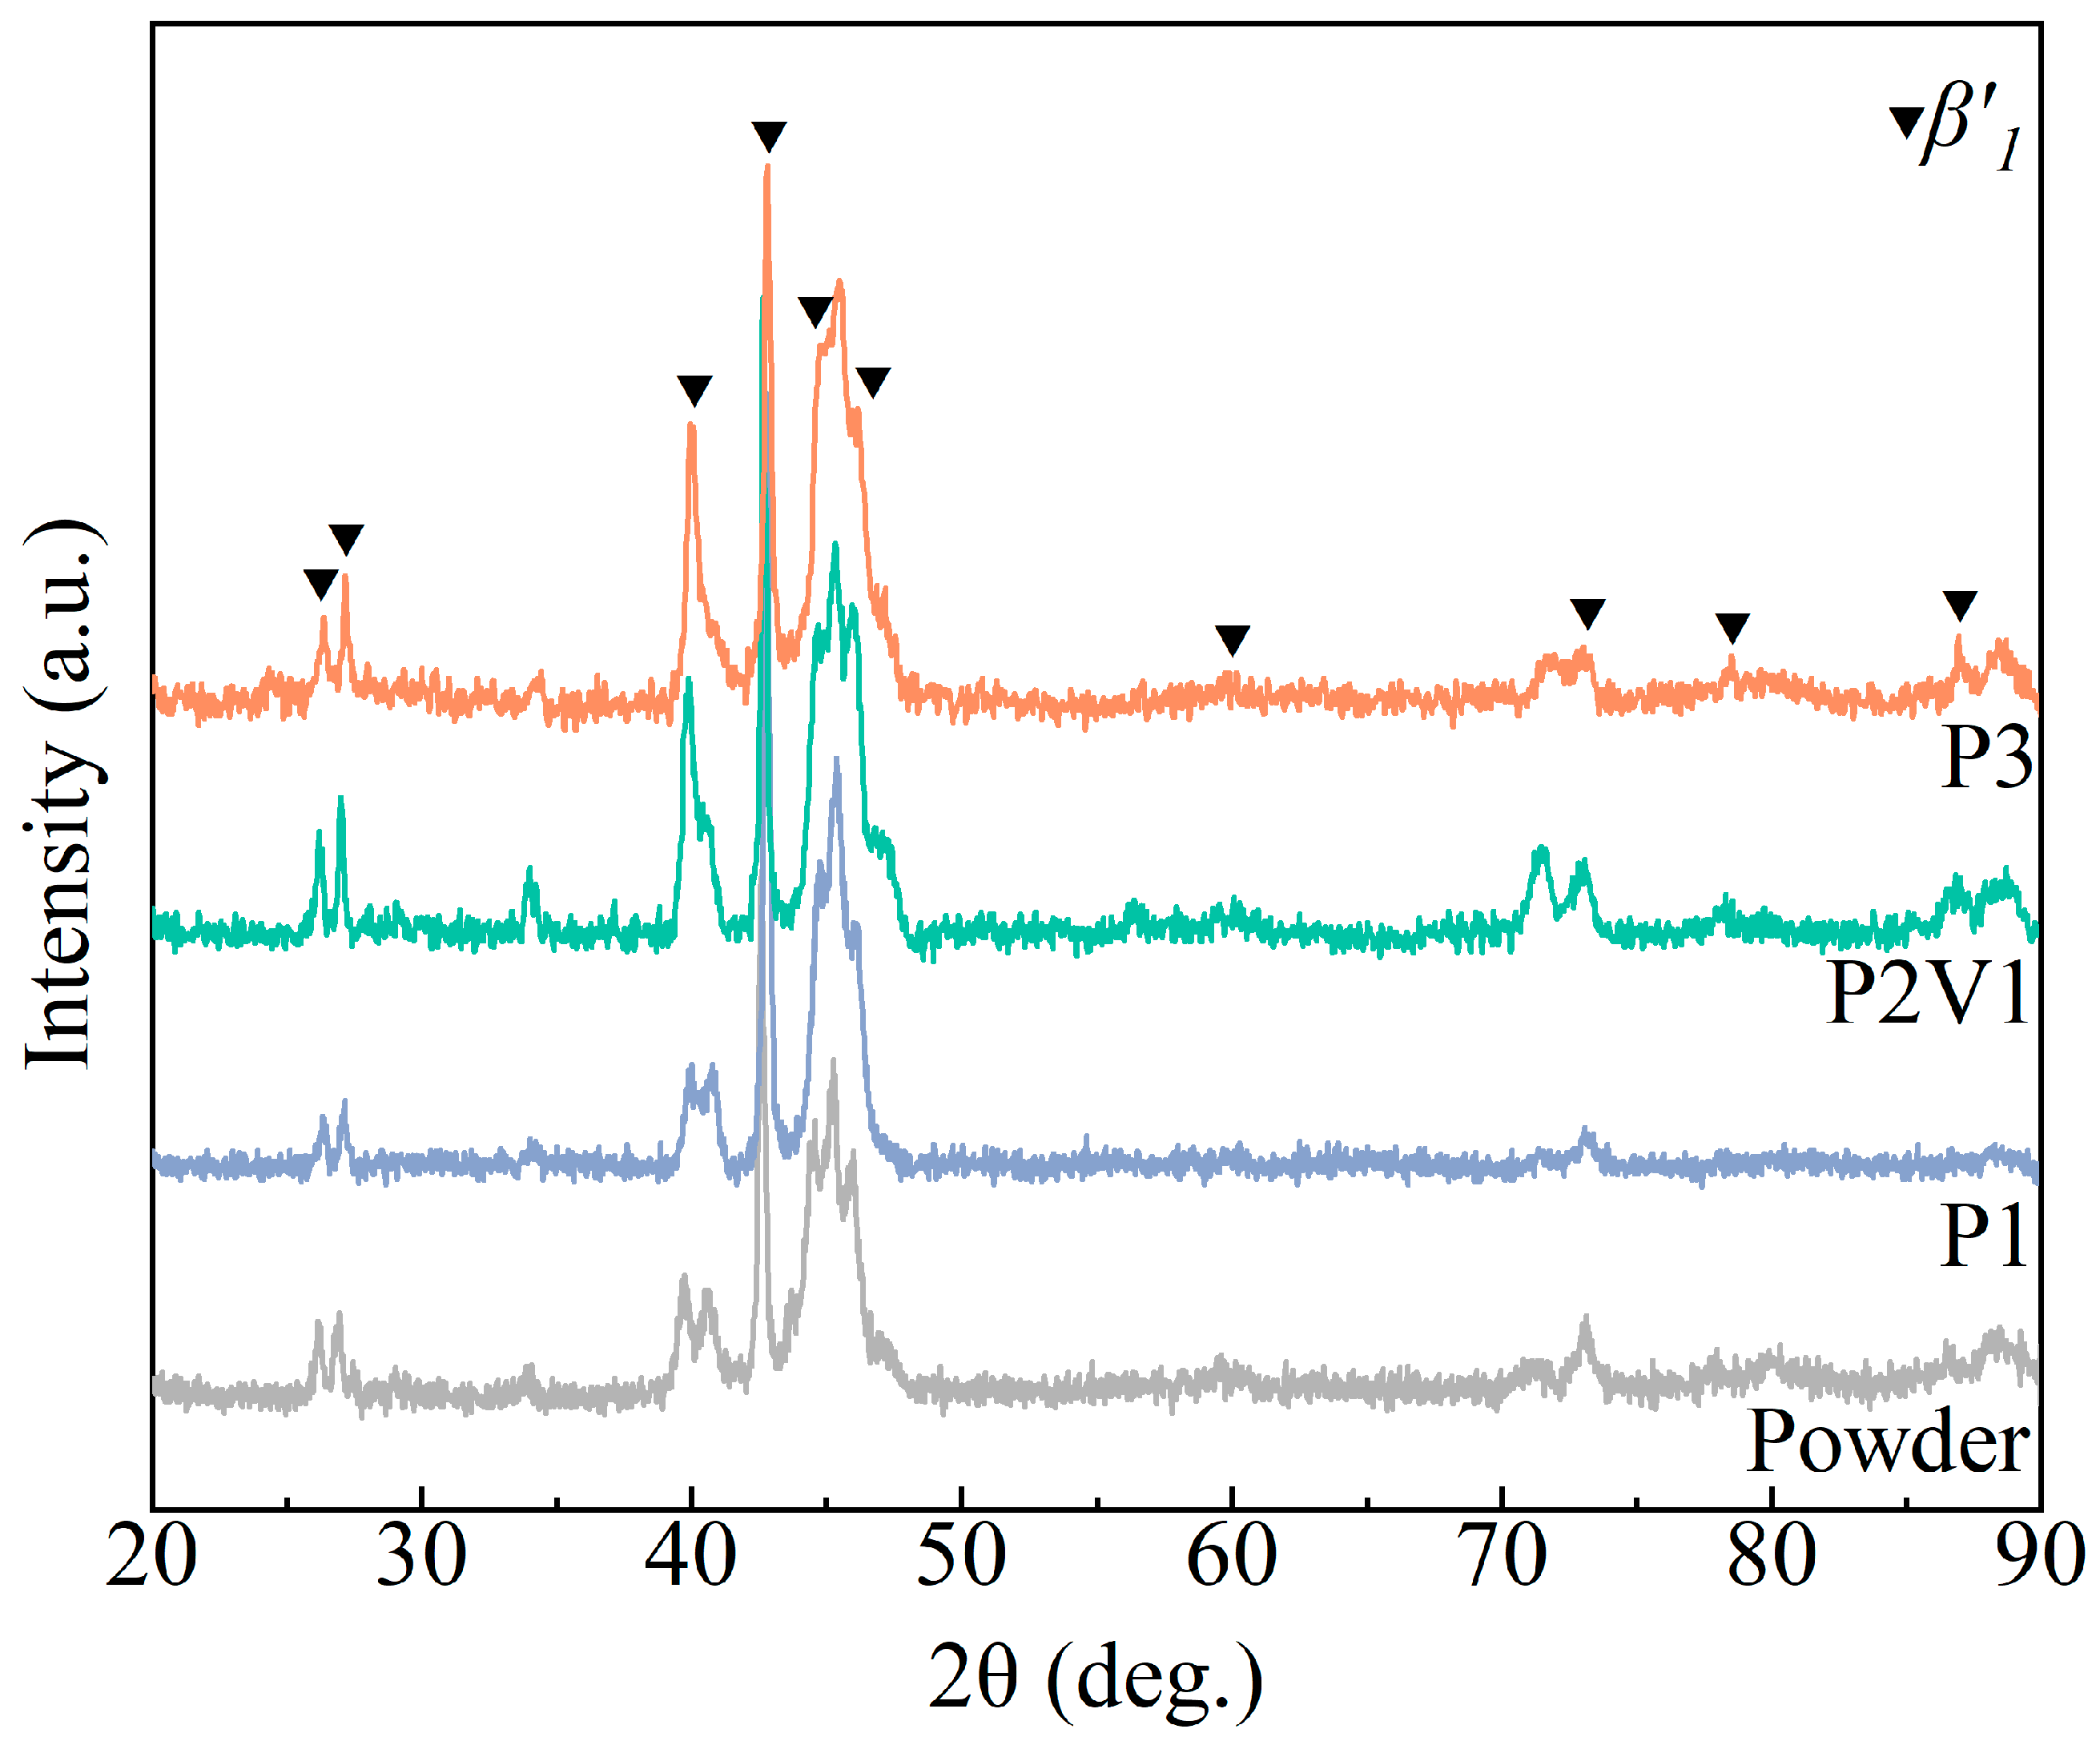
3.3. Phase Identification and Transformation Behavior
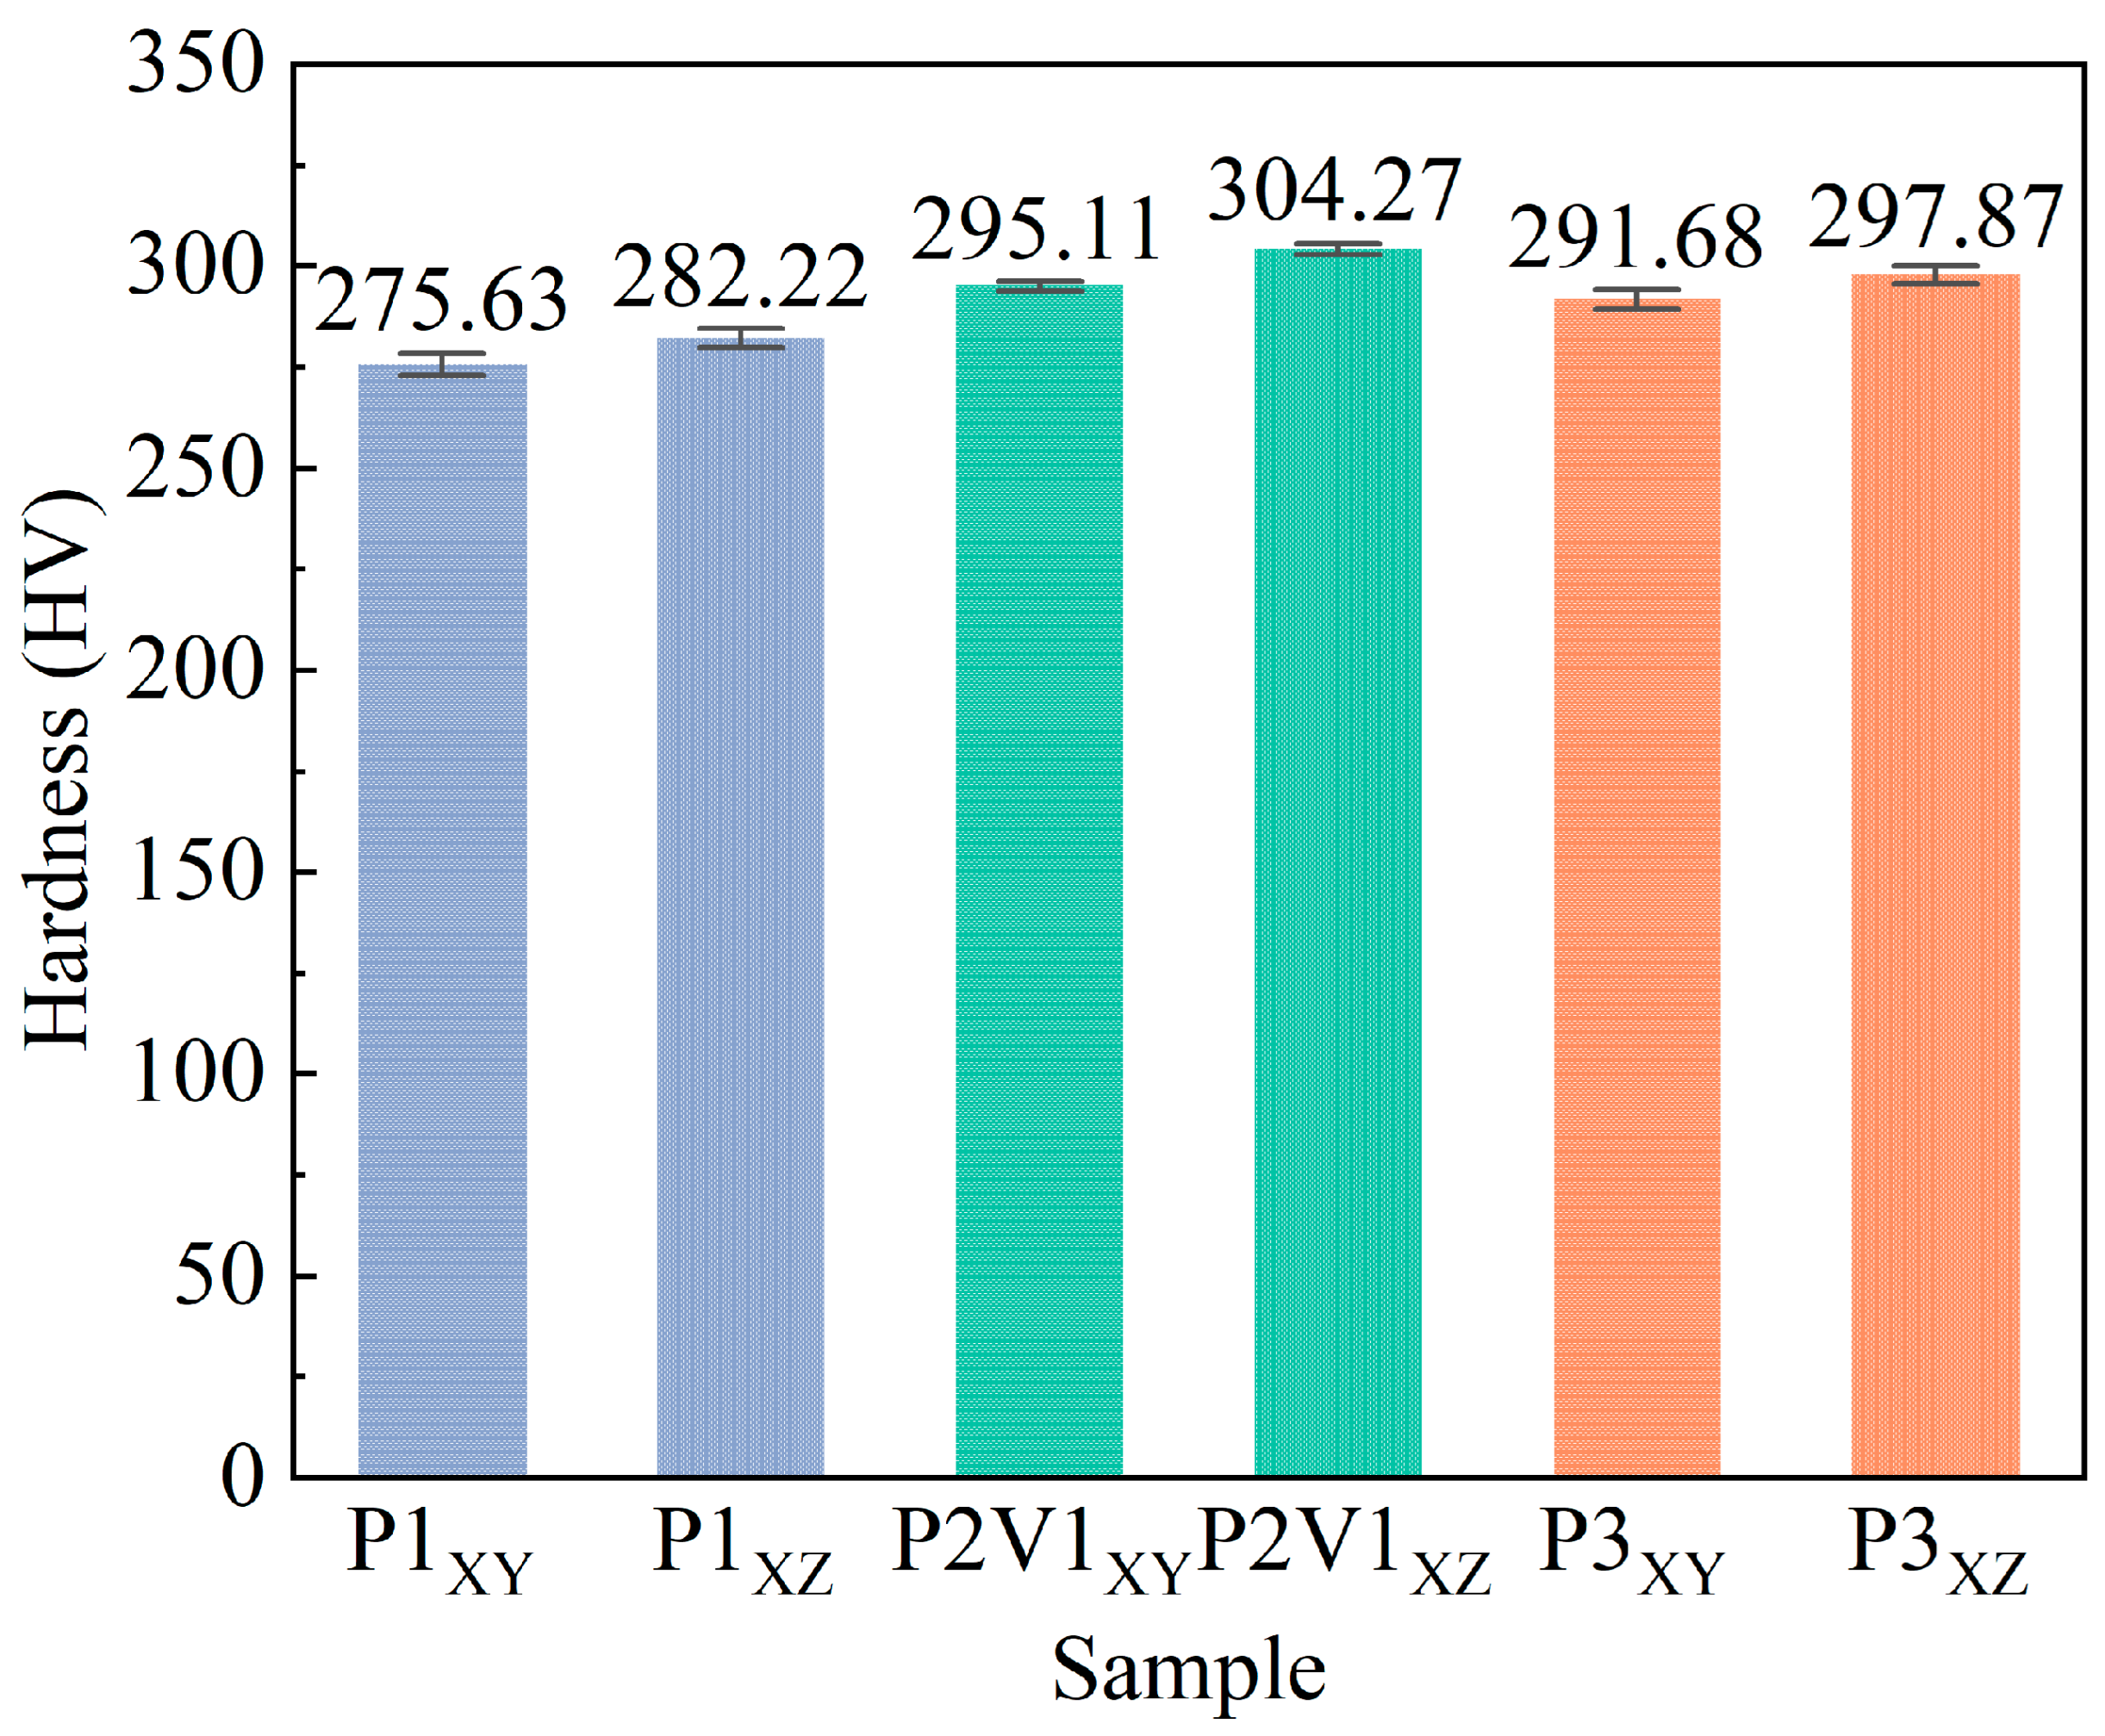
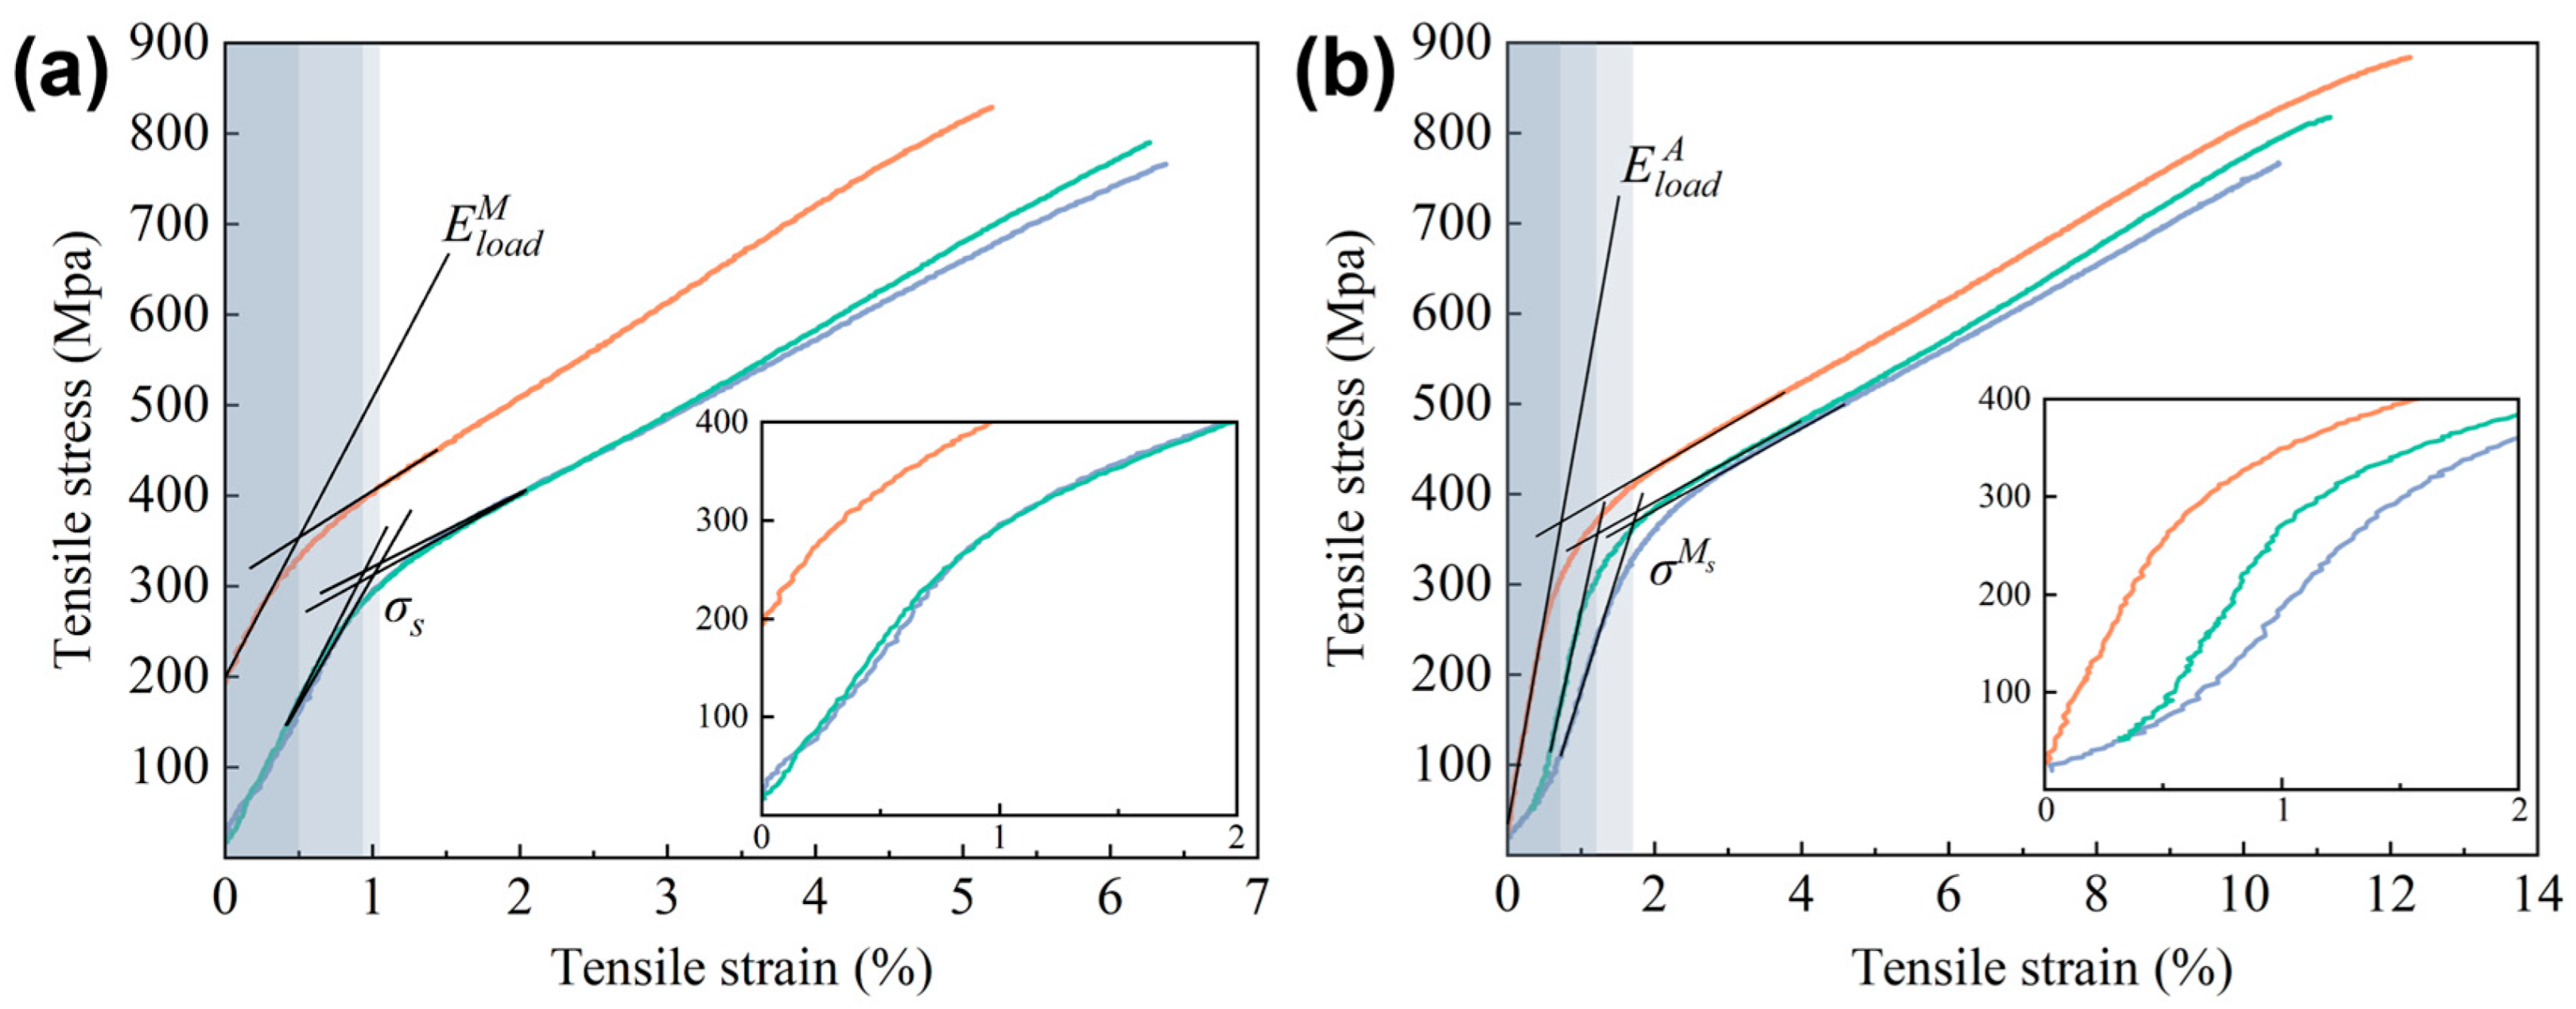
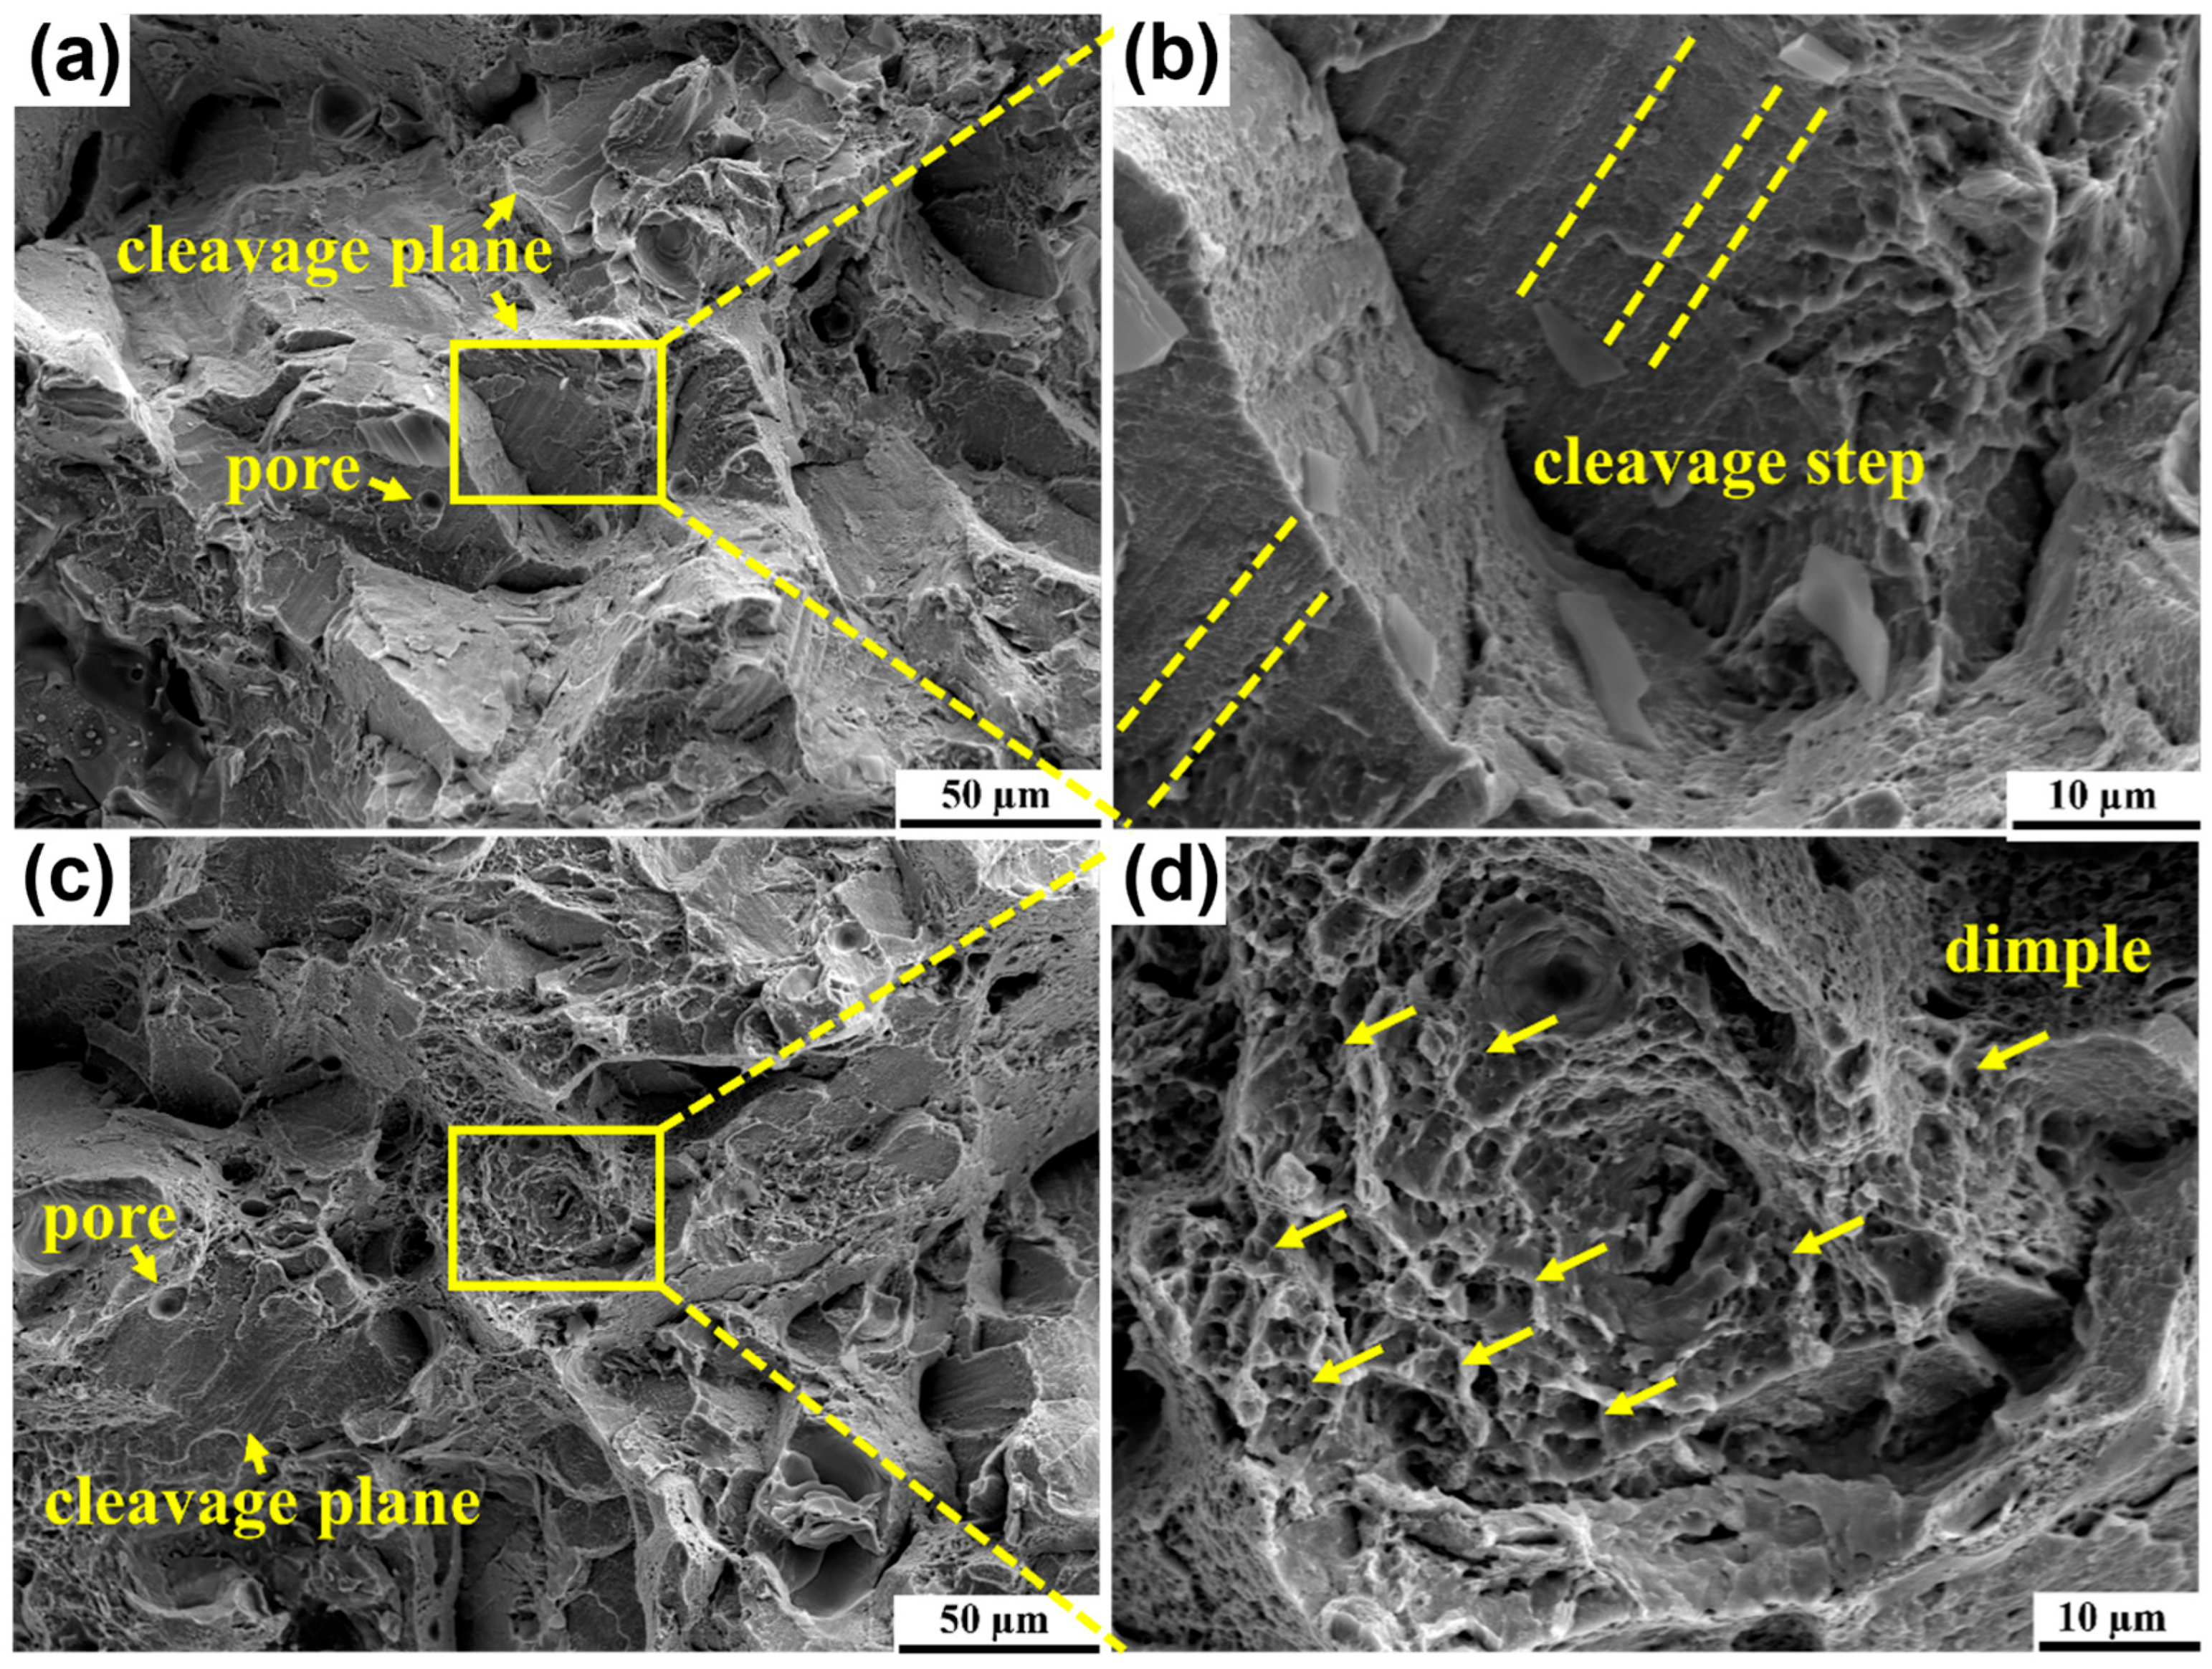
3.4. Mechanical Properties
4. Conclusions
Supplementary Materials
Author Contributions
Funding
Data Availability Statement
Conflicts of Interest
References
- Cisse, C.; Zaki, W.; Ben Zineb, T. A review of constitutive models and modeling techniques for shape memory alloys. Int. J. Plast. 2016, 76, 244–284. [Google Scholar] [CrossRef]
- Alagha, A.N.; Hussain, S.; Zaki, W. Additive manufacturing of shape memory alloys: A review with emphasis on powder bed systems. Mater. Des. 2021, 204, 109654. [Google Scholar] [CrossRef]
- Patoor, E.; Lagoudas, D.C.; Entchev, P.B.; Brinson, L.C.; Gao, X.J. Shape memory alloys, Part I: General properties and modeling of single crystals. Mech. Mater. 2006, 38, 391–429. [Google Scholar] [CrossRef]
- Karaca, H.E.; Karaman, I.; Basaran, B.; Lagoudas, D.C.; Chumlyakov, Y.I.; Maier, H.J. One-way shape memory effect due to stress-assisted magnetic field-induced phase transformation in Ni2MnGa magnetic shape memory alloys. Scr. Mater. 2006, 55, 803–806. [Google Scholar] [CrossRef]
- Costanza, G.; Tata, M.E. Shape Memory Alloys for Aerospace, Recent Developments, and New Applications: A Short Review. Materials 2020, 13, 1856. [Google Scholar] [CrossRef] [PubMed]
- Williams, E.A.; Shaw, G.; Elahinia, M. Control of an automotive shape memory alloy mirror actuator. Mechatronics 2010, 20, 527–534. [Google Scholar] [CrossRef]
- Wang, Y.; Venezuela, J.; Dargusch, M. Biodegradable shape memory alloys: Progress and prospects. Biomaterials 2021, 279, 121215. [Google Scholar] [CrossRef] [PubMed]
- Ades, C.J.; Dilibal, S.; Engeberg, E.D. Shape memory alloy tube actuators inherently enable internal fluidic cooling for a robotic finger under force control. Smart Mater. Struct. 2020, 29, 115009. [Google Scholar] [CrossRef] [PubMed]
- Imran, M.; Zhang, X. Reduced dimensions elastocaloric materials: A route towards miniaturized refrigeration. Mater. Design 2021, 206, 109784. [Google Scholar] [CrossRef]
- Qian, S.; Geng, Y.; Wang, Y.; Ling, J.; Hwang, Y.; Radermacher, R.; Takeuchi, I.; Cui, J. A review of elastocaloric cooling: Materials, cycles and system integrations. Int. J. Refrig. 2016, 64, 1–19. [Google Scholar] [CrossRef]
- Hwang, D.; Lee, J.; Kim, K. On the design of a miniature haptic ring for cutaneous force feedback using shape memory alloy actuators. Smart Mater. Struct. 2017, 26, 105002. [Google Scholar] [CrossRef]
- Hua, S.; Liu, Y.; Jiang, J.; Xiao, F.; Hou, R.; Li, A.; Cai, X.; Hu, X.; Ding, X.; Jin, X. Shape memory alloy based smart compression stocking and real-time health monitoring app for deep venous thrombosis. Smart Mater. Struct. 2023, 32, 075024. [Google Scholar] [CrossRef]
- Lagoudas, D.C. Shape Memory Alloys; Springer: Boston, MA, USA, 2008. [Google Scholar]
- Babacan, N.; Pauly, S.; Gustmann, T. Laser powder bed fusion of a superelastic Cu-Al-Mn shape memory alloy. Mater. Des. 2021, 203, 109625. [Google Scholar] [CrossRef]
- Jiao, Z.; Wang, Q.; Yin, F.; Zhang, J.; Liu, L.; Ji, P.; Chu, H.; Yu, J. Novel laminated multi-layer graphene/Cu–Al–Mn composites with ultrahigh damping capacity and superior tensile mechanical properties. Carbon 2022, 188, 45–58. [Google Scholar] [CrossRef]
- Wu, M.-W.; Hu, Z.-F.; Yang, B.-B.; Tao, Y.; Liu, R.-P.; Ma, C.-M.; Zhang, L. Additive manufacturing of Cu–Al–Mn shape memory alloy with enhanced superelasticity. Rare Met. 2023, 42, 4234–4245. [Google Scholar] [CrossRef]
- Sutou, Y.; Omori, T.; Wang, J.J.; Kainuma, R.; Ishida, K. Characteristics of Cu–Al–Mn-based shape memory alloys and their applications. Mater. Sci. Eng. A 2004, 378, 278–282. [Google Scholar] [CrossRef]
- Agrawal, A.; Dube, R.K. Methods of fabricating Cu-Al-Ni shape memory alloys. J. Alloys Compd. 2018, 750, 235–247. [Google Scholar] [CrossRef]
- Gómez-Cortés, J.F.; Nó, M.L.; Chuvilin, A.; Ruiz-Larrea, I.; San Juan, J.M. Thermal Stability of Cu-Al-Ni Shape Memory Alloy Thin Films Obtained by Nanometer Multilayer Deposition. Nanomaterials 2023, 13, 2605. [Google Scholar] [CrossRef] [PubMed]
- Zhang, Y.; Xu, L.; Zhao, L.; Lin, D.; Liu, M.; Chen, W.; Han, Y. Deformation mechanism of Cu-Al-Ni shape memory alloys fabricated via laser powder bed fusion: Tension-compression asymmetry. J. Mater. Sci. Technol. 2023, 167, 14–26. [Google Scholar] [CrossRef]
- Alaneme, K.K.; Umar, S. Mechanical behaviour and damping properties of Ni modified Cu–Zn–Al shape memory alloys. J. Sci. Adv. Mater. Devices 2018, 3, 371–379. [Google Scholar] [CrossRef]
- Iacoviello, F.; Di Cocco, V.; Natali, S.; Brotzu, A. Grain size and loading conditions influence on fatigue crack propagation in a Cu-Zn-Al shape memory alloy. Int. J. Fatigue 2018, 115, 27–34. [Google Scholar] [CrossRef]
- Mahdi, M.M.; Ali, A.M.; Alalousi, M.A.; Kadhim, D.A.; Abid, M.A. Developing a copper-zinc-aluminum alloying technique by vacuum thermal deposition after irradiation by gamma rays (NaI (Ti)) with stabilized zinc metal. Vacuum 2024, 219, 112676. [Google Scholar] [CrossRef]
- Yuan, B.; Zhu, X.; Zhang, X.; Qian, M. Elastocaloric effect with small hysteresis in bamboo-grained Cu–Al–Mn microwires. J. Mater. Sci. 2019, 54, 9613–9621. [Google Scholar] [CrossRef]
- Yuan, B.; Qian, M.; Zhang, X.; Geng, L. Grain structure related inhomogeneous elastocaloric effects in Cu–Al–Mn shape memory microwires. Scr. Mater. 2020, 178, 356–360. [Google Scholar] [CrossRef]
- Yuan, B.; Zhong, S.; Qian, M.; Zhang, X.; Geng, L. Elastocaloric effect in bamboo-grained Cu71.1Al17.2Mn11.7 microwires. J. Alloys Compd. 2021, 850, 156612. [Google Scholar] [CrossRef]
- Liu, J.-L.; Huang, H.-Y.; Xie, J.-X. Superelastic anisotropy characteristics of columnar-grained Cu–Al–Mn shape memory alloys and its potential applications. Mater. Des. 2015, 85, 211–220. [Google Scholar] [CrossRef]
- Xu, S.; Huang, H.-Y.; Xie, J.; Takekawa, S.; Xu, X.; Omori, T.; Kainuma, R. Giant elastocaloric effect covering wide temperature range in columnar-grained Cu71.5Al17.5Mn11 shape memory alloy. APL Mater. 2016, 4, 106106. [Google Scholar] [CrossRef]
- Li, H.; Yuan, B.; Gao, Y.; Zhao, Y. Effect of oligocrystallinity on damping and pseudoelasticity of oligocrystalline Cu-Al-Mn shape memory foams. J. Alloys Compd. 2019, 773, 940–949. [Google Scholar] [CrossRef]
- Li, H.; Yuan, B.; Gao, Y. Achieving high oligocrystalline degree via strut architecture tailoring to increase the damping and mechanical properties of spherical porous CuAlMn SMAs. J. Alloys Compd. 2018, 767, 690–702. [Google Scholar] [CrossRef]
- Zheng, S.; Chen, S.; Hong, S.; Su, Z.; Zhang, J.; Wang, L.; Wang, C.; Yang, S. Microstructure, martensitic transformation and excellent shape memory effect of Ga-alloyed Cu–Al–Mn–Fe shape-memory single crystal. J. Sci. Adv. Mater. Devices 2022, 7, 100448. [Google Scholar] [CrossRef]
- Xin, C.; Zhao, X.; Geng, H.; Hao, L.; Li, Y.; Chen, T.; Gong, P. Microstructure, grain and nanowire growth during selective laser melting of Ag–Cu/diamond composites. RSC Adv. 2023, 13, 3448–3458. [Google Scholar] [CrossRef] [PubMed]
- Chen, Q.; Jing, Y.; Yin, J.; Li, Z.; Xiong, W.; Gong, P.; Zhang, L.; Li, S.; Pan, R.; Zhao, X.; et al. High Reflectivity and Thermal Conductivity Ag–Cu Multi-Material Structures Fabricated via Laser Powder Bed Fusion: Formation Mechanisms, Interfacial Characteristics, and Molten Pool Behavior. Micromachines 2023, 14, 362. [Google Scholar] [CrossRef] [PubMed]
- Gustmann, T.; Neves, A.; Kühn, U.; Gargarella, P.; Kiminami, C.S.; Bolfarini, C.; Eckert, J.; Pauly, S. Influence of processing parameters on the fabrication of a Cu-Al-Ni-Mn shape-memory alloy by selective laser melting. Addit. Manuf. 2016, 11, 23–31. [Google Scholar] [CrossRef]
- Gustmann, T.; Schwab, H.; Kühn, U.; Pauly, S. Selective laser remelting of an additively manufactured Cu–Al–Ni–Mn shape-memory alloy. Mater. Des. 2018, 153, 129–138. [Google Scholar] [CrossRef]
- Tian, J.; Zhu, W.; Wei, Q.; Wen, S.; Li, S.; Song, B.; Shi, Y. Process optimization, microstructures and mechanical properties of a Cu-based shape memory alloy fabricated by selective laser melting. J. Alloys Compd. 2019, 785, 754–764. [Google Scholar] [CrossRef]
- Zhuo, L.; Song, B.; Li, R.; Wei, Q.; Yan, C.; Shi, Y. Effect of element evaporation on the microstructure and properties of CuZnAl shape memory alloys prepared by selective laser melting. Opt. Laser Technol. 2020, 127, 106164. [Google Scholar] [CrossRef]
- Abolhasani, D.; Han, S.W.; VanTyne, C.J.; Kang, N.; Moon, Y.H. Enhancing the shape memory effect of Cu–Al–Ni alloys via partial reinforcement by alumina through selective laser melting. J. Mater. Res. Technol. 2021, 15, 4032–4047. [Google Scholar] [CrossRef]
- Abolhasani, D.; Moon, B.; Kang, N.; VanTyne, C.J.; Moon, Y.H. High-performance Cu-Al shape memory alloy in ternary combination with graphene fabricated by powder bed fusion process. J. Alloys Compd. 2023, 960, 170707. [Google Scholar] [CrossRef]
- Abolhasani, D.; Han, S.W.; VanTyne, C.J.; Kang, N.; Moon, Y.H. Powder bed fusion of two-functional Cu–Al–Ni shape memory alloys utilized for 4D printing. J. Alloys Compd. 2022, 922, 166228. [Google Scholar] [CrossRef]
- Dang, M.; Xiang, H.; Li, J.; Cai, C.; Wei, Q. Laser powder bed fusion of full martensite Cu–Al–Mn–Ti alloy with good superelasticity and shape memory effect. Mater. Sci. Eng. A 2023, 884, 145475. [Google Scholar] [CrossRef]
- Yin, J.; Zhang, W.; Ke, L.; Wei, H.; Wang, D.; Yang, L.; Zhu, H.; Dong, P.; Wang, G.; Zeng, X. Vaporization of alloying elements and explosion behavior during laser powder bed fusion of Cu–10Zn alloy. Int. J. Mach. Tools Manuf. 2021, 161, 103686. [Google Scholar] [CrossRef]
- King, W.E.; Barth, H.D.; Castillo, V.M.; Gallegos, G.F.; Gibbs, J.W.; Hahn, D.E.; Kamath, C.; Rubenchik, A.M. Observation of keyhole-mode laser melting in laser powder-bed fusion additive manufacturing. J. Mater. Process. Technol. 2014, 214, 2915–2925. [Google Scholar] [CrossRef]
- Yang, J.; Wang, Q.Z.; Yin, F.X.; Cui, C.X.; Ji, P.G.; Li, B. Effects of grain refinement on the structure and properties of a CuAlMn shape memory alloy. Mater. Sci. Eng. A 2016, 664, 215–220. [Google Scholar] [CrossRef]
- Liu, X.; Wang, Q.; Kondrat’ev, S.Y.; Ji, P.; Yin, F.; Cui, C.; Hao, G. Microstructural, Mechanical, and Damping Properties of a Cu-Based Shape Memory Alloy Refined by an In Situ LaB6/Al Inoculant. Metall. Mater. Trans. A 2019, 50, 2310–2321. [Google Scholar] [CrossRef]
- Khan, A.Q. The application and interpretation of the “time law” to the growth of β grain size and martensite plate thickness in copper-based martensites. J. Mater. Sci. 1974, 9, 1290–1296. [Google Scholar] [CrossRef]
- La Roca, P.; Isola, L.; Vermaut, P.; Malarría, J. Relationship between martensitic plate size and austenitic grain size in martensitic transformations. Appl. Phys. Lett. 2015, 106, 221903. [Google Scholar] [CrossRef]
- Li, Y.; Gu, D. Parametric analysis of thermal behavior during selective laser melting additive manufacturing of aluminum alloy powder. Mater. Des. 2014, 63, 856–867. [Google Scholar] [CrossRef]
- Khan, A.Q.; Brabers, M.; Delaey, L. The Hall-Petch relationship in copper-based martensites. Mater. Sci. Eng. 1974, 15, 263–274. [Google Scholar] [CrossRef]
- Alés, A.; Lanzini, F. Mechanical and thermodynamical properties of β–Cu–Al–Mn alloys along the Cu3Al → Cu2AlMn compositional line. Solid State Commun. 2020, 319, 113980. [Google Scholar] [CrossRef]
- Yong, P.; Zhu, X.; Yanlin, J.; Rui, Z.; Jiang, Y.; Wenting, Q.; Zhou, L. Hot deformation behavior of a CuAlMn shape memory alloy. J. Alloys Compd. 2020, 845, 156161. [Google Scholar] [CrossRef]
- Wang, H.; Huang, H.-Y.; Su, Y.-J. Tuning the operation temperature window of the elastocaloric effect in Cu–Al–Mn shape memory alloys by composition design. J. Alloys Compd. 2020, 828, 154265. [Google Scholar] [CrossRef]
- Sutou, Y.; Omori, T.; Yamauchi, K.; Ono, N.; Kainuma, R.; Ishida, K. Effect of grain size and texture on pseudoelasticity in Cu–Al–Mn-based shape memory wire. Acta. Mater. 2005, 53, 4121–4133. [Google Scholar] [CrossRef]
- Roca, P.L.; Isola, L.; Vermaut, P.; Malarría, J. Relationship between grain size and thermal hysteresis of martensitic transformations in Cu-based shape memory alloys. Scr. Mater. 2017, 135, 5–9. [Google Scholar] [CrossRef]
- Jiao, Z.; Wang, Q.; Yin, F.; Cui, C. Effect of precipitation during parent phase aging on the microstructure and properties of a refined CuAlMn shape memory alloy. Mater. Sci. Eng. A 2018, 737, 124–131. [Google Scholar] [CrossRef]
- Pan, R.C.; Fan, D.; Bian, Y.L.; Zhao, X.J.; Zhang, N.B.; Lu, L.; Cai, Y.; Luo, S.N. Effect of minor elements Al and Ti on dynamic deformation and fracture of CoCrNi-based medium-entropy alloys. Mater. Sci. Eng. A 2023, 884, 145535. [Google Scholar] [CrossRef]


| Element | Al | Mn | Ti | Cu |
|---|---|---|---|---|
| Composition (wt.%) | 11.7 | 3.28 | 0.17 | Ball. |
| Parameters | P (W) | v (mm/s) | h (mm) | l (mm) | E (J/mm3) | (%) |
|---|---|---|---|---|---|---|
| P1V1 | 60 | 200 | 0.1 | 0.035 | 85.71 | 95.430 |
| P2V1 | 80 | 200 | 0.1 | 0.035 | 114.29 | 99.190 |
| P2V2 | 80 | 400 | 0.065 | 0.035 | 87.91 | 95.197 |
| P2V3 | 80 | 600 | 0.04 | 0.035 | 95.24 | 95.768 |
| P2V4 | 80 | 800 | 0.04 | 0.035 | 71.43 | 92.846 |
| P2V5 | 80 | 1000 | 0.032 | 0.035 | 71.43 | 91.885 |
| P2L2 | 80 | 200 | 0.1 | 0.025 | 160 | 98.220 |
| P2H2 | 80 | 200 | 0.088 | 0.035 | 129.87 | 98.707 |
| P3V1 | 100 | 200 | 0.1 | 0.035 | 142.86 | 98.287 |
| P4V1 | 120 | 200 | 0.1 | 0.035 | 171.43 | 97.974 |
| No. | Ms | Mf | Mp | As | Af | Ap | Af-Ms |
|---|---|---|---|---|---|---|---|
| P1 | 123.26 | 96.550 | 97.78 | 126.54 | 155.71 | 139.28 | 32.45 |
| P2V1 | 121.20 | 65.33 | 110.52 | 147.50 | 166.81 | 158.59 | 45.61 |
| P3 | 120.37 | 55.47 | 117.91 | 150.78 | 169.68 | 160.23 | 49.31 |
| Treatment | (GPa) | (MPa) | (%) | (MPa) |
|---|---|---|---|---|
| RT | 30.38 ± 1.85 | 328.32 ± 23.07 | 5.95 ± 0.65 | 795.20 ± 31.66 |
| HT | 36.85 ± 10.09 | 365.49 ± 7.66 | 11.30 ± 0.90 | 822.74 ± 58.39 |
Disclaimer/Publisher’s Note: The statements, opinions and data contained in all publications are solely those of the individual author(s) and contributor(s) and not of MDPI and/or the editor(s). MDPI and/or the editor(s) disclaim responsibility for any injury to people or property resulting from any ideas, methods, instructions or products referred to in the content. |
© 2025 by the authors. Licensee MDPI, Basel, Switzerland. This article is an open access article distributed under the terms and conditions of the Creative Commons Attribution (CC BY) license (https://creativecommons.org/licenses/by/4.0/).
Share and Cite
He, L.; Li, Y.; Su, Q.; Zhao, X.; Jiang, Z. Fabrication of Cu-Al-Mn-Ti Shape Memory Alloys via Selective Laser Melting and Its Nano-Precipitation Strengthening. Micromachines 2025, 16, 857. https://doi.org/10.3390/mi16080857
He L, Li Y, Su Q, Zhao X, Jiang Z. Fabrication of Cu-Al-Mn-Ti Shape Memory Alloys via Selective Laser Melting and Its Nano-Precipitation Strengthening. Micromachines. 2025; 16(8):857. https://doi.org/10.3390/mi16080857
Chicago/Turabian StyleHe, Lijun, Yan Li, Qing Su, Xiya Zhao, and Zhenyu Jiang. 2025. "Fabrication of Cu-Al-Mn-Ti Shape Memory Alloys via Selective Laser Melting and Its Nano-Precipitation Strengthening" Micromachines 16, no. 8: 857. https://doi.org/10.3390/mi16080857
APA StyleHe, L., Li, Y., Su, Q., Zhao, X., & Jiang, Z. (2025). Fabrication of Cu-Al-Mn-Ti Shape Memory Alloys via Selective Laser Melting and Its Nano-Precipitation Strengthening. Micromachines, 16(8), 857. https://doi.org/10.3390/mi16080857