Author Contributions
Conceptualization, W.W. (Wenhua Wang) and W.S.; Methodology, W.W. (Wenhua Wang) and Q.H.; Validation, W.S. and W.W. (Weina Wu); Formal analysis, Q.H.; Investigation, Q.H. and W.W. (Weina Wu); Resources, W.W. (Wenhua Wang) and W.S.; Data curation, Q.H.; Writing—original draft, W.W. (Wenhua Wang) and Q.H.; Writing—review & editing, W.W. (Weina Wu); Supervision, W.S. and W.W. (Weina Wu); Project administration, W.W. (Weina Wu); Funding acquisition, W.W. (Wenhua Wang) and W.S. All authors have read and agreed to the published version of the manuscript.
Figure 1.
SEM images of the (a–c) top melting, (d–f) central bonding, and (g–i) bottom affecting zones of Stellite6/Cu composite coatings prepared using laser powers of (a,d,g) 800 W, (b,e,h) 1000 W, (c,f,i) 1200 W.
Figure 1.
SEM images of the (a–c) top melting, (d–f) central bonding, and (g–i) bottom affecting zones of Stellite6/Cu composite coatings prepared using laser powers of (a,d,g) 800 W, (b,e,h) 1000 W, (c,f,i) 1200 W.
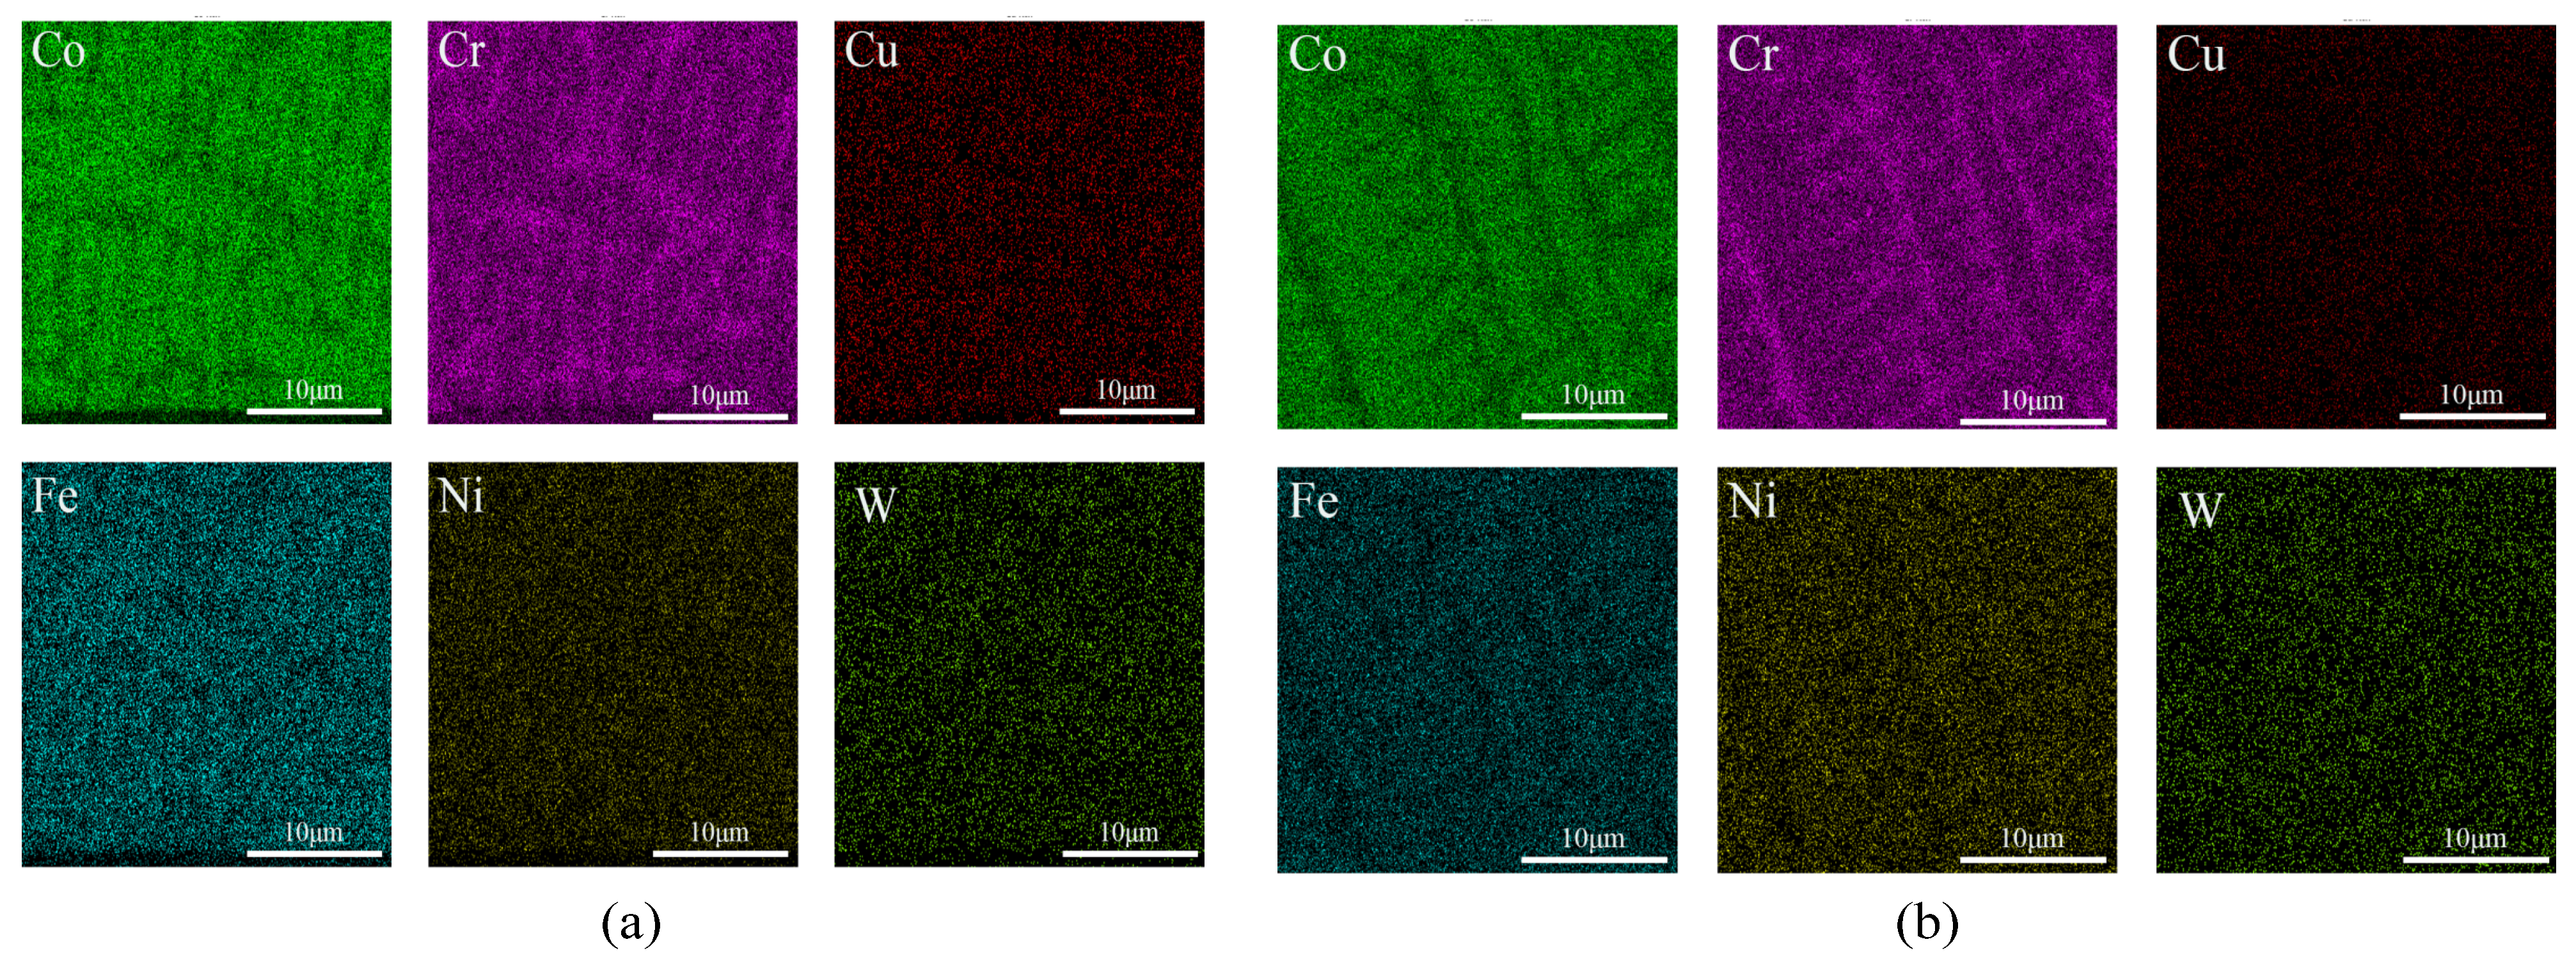
Figure 2.
(a) Top and (b) bottom EDS surface scanning of composite coating prepared at 800 W.
Figure 2.
(a) Top and (b) bottom EDS surface scanning of composite coating prepared at 800 W.
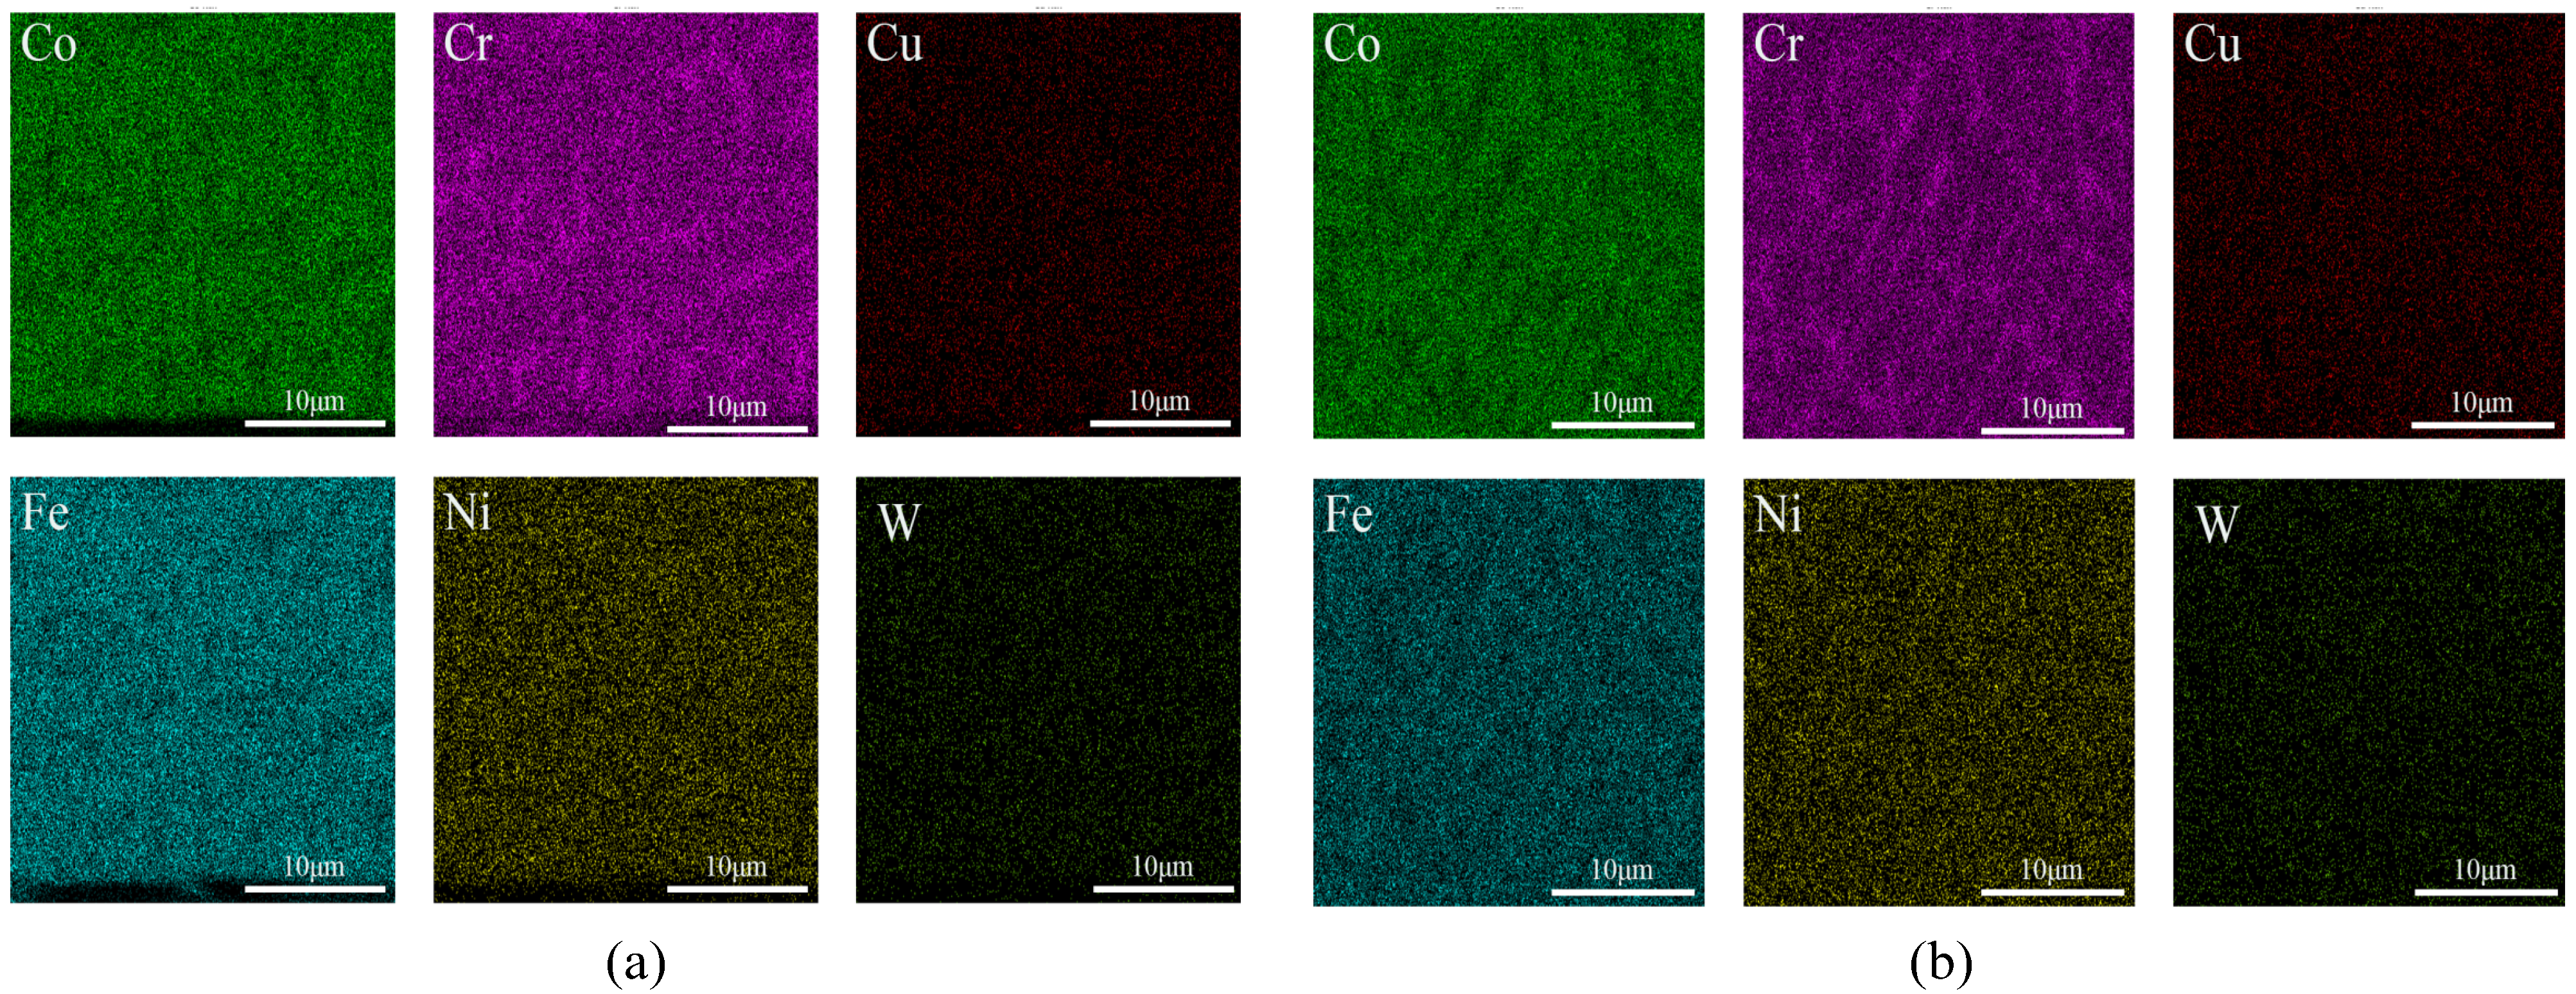
Figure 3.
(a) Top and (b) bottom EDS surface scanning of composite coating prepared at 1000 W.
Figure 3.
(a) Top and (b) bottom EDS surface scanning of composite coating prepared at 1000 W.
Figure 4.
(a) Top and (b) bottom EDS surface scanning of composite coating prepared at 1200 W.
Figure 4.
(a) Top and (b) bottom EDS surface scanning of composite coating prepared at 1200 W.
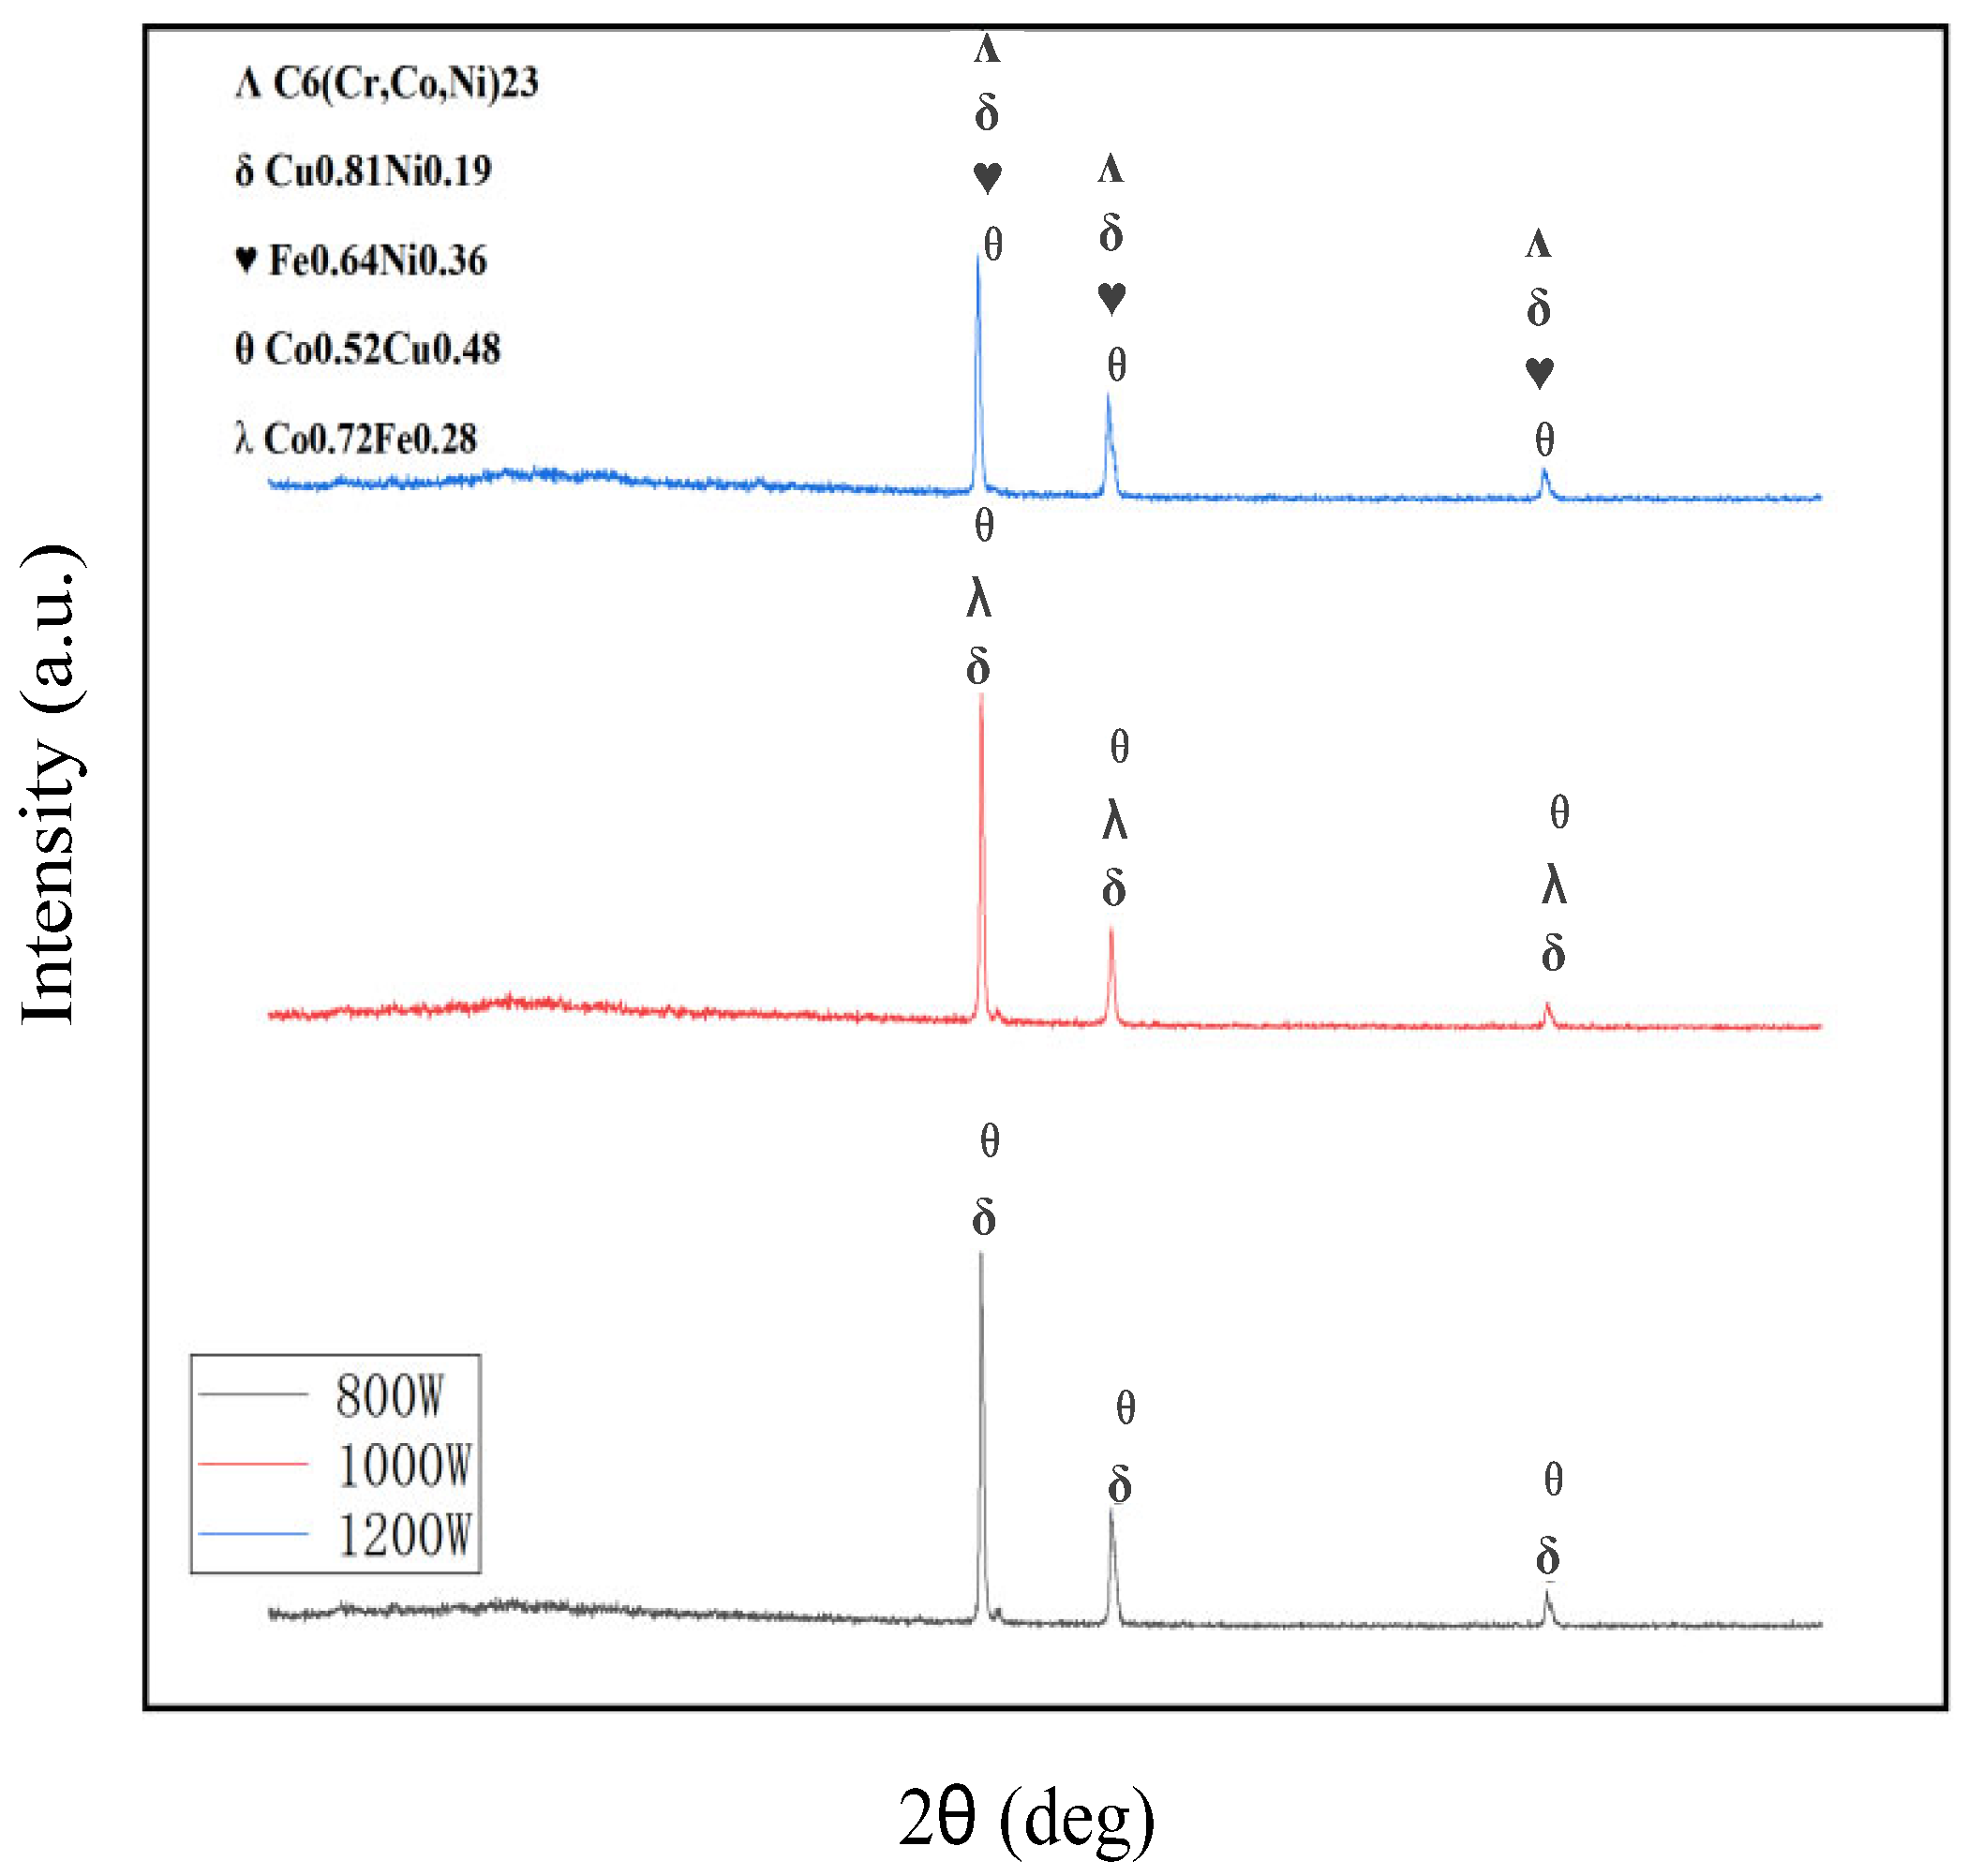
Figure 5.
Phase components of composite coating prepared at different laser powers.
Figure 5.
Phase components of composite coating prepared at different laser powers.
Figure 6.
SEM images of the (a–c) top melting zone, (d–f) middle bonding zone, and (g–i) bottom affecting zone of Stellite6/Cu composite coating prepared with scanning speeds of (a,d,g) 600 mm/min, (b,e,h) 800 mm/min, and (c,f,i) 1000 mm/min.
Figure 6.
SEM images of the (a–c) top melting zone, (d–f) middle bonding zone, and (g–i) bottom affecting zone of Stellite6/Cu composite coating prepared with scanning speeds of (a,d,g) 600 mm/min, (b,e,h) 800 mm/min, and (c,f,i) 1000 mm/min.
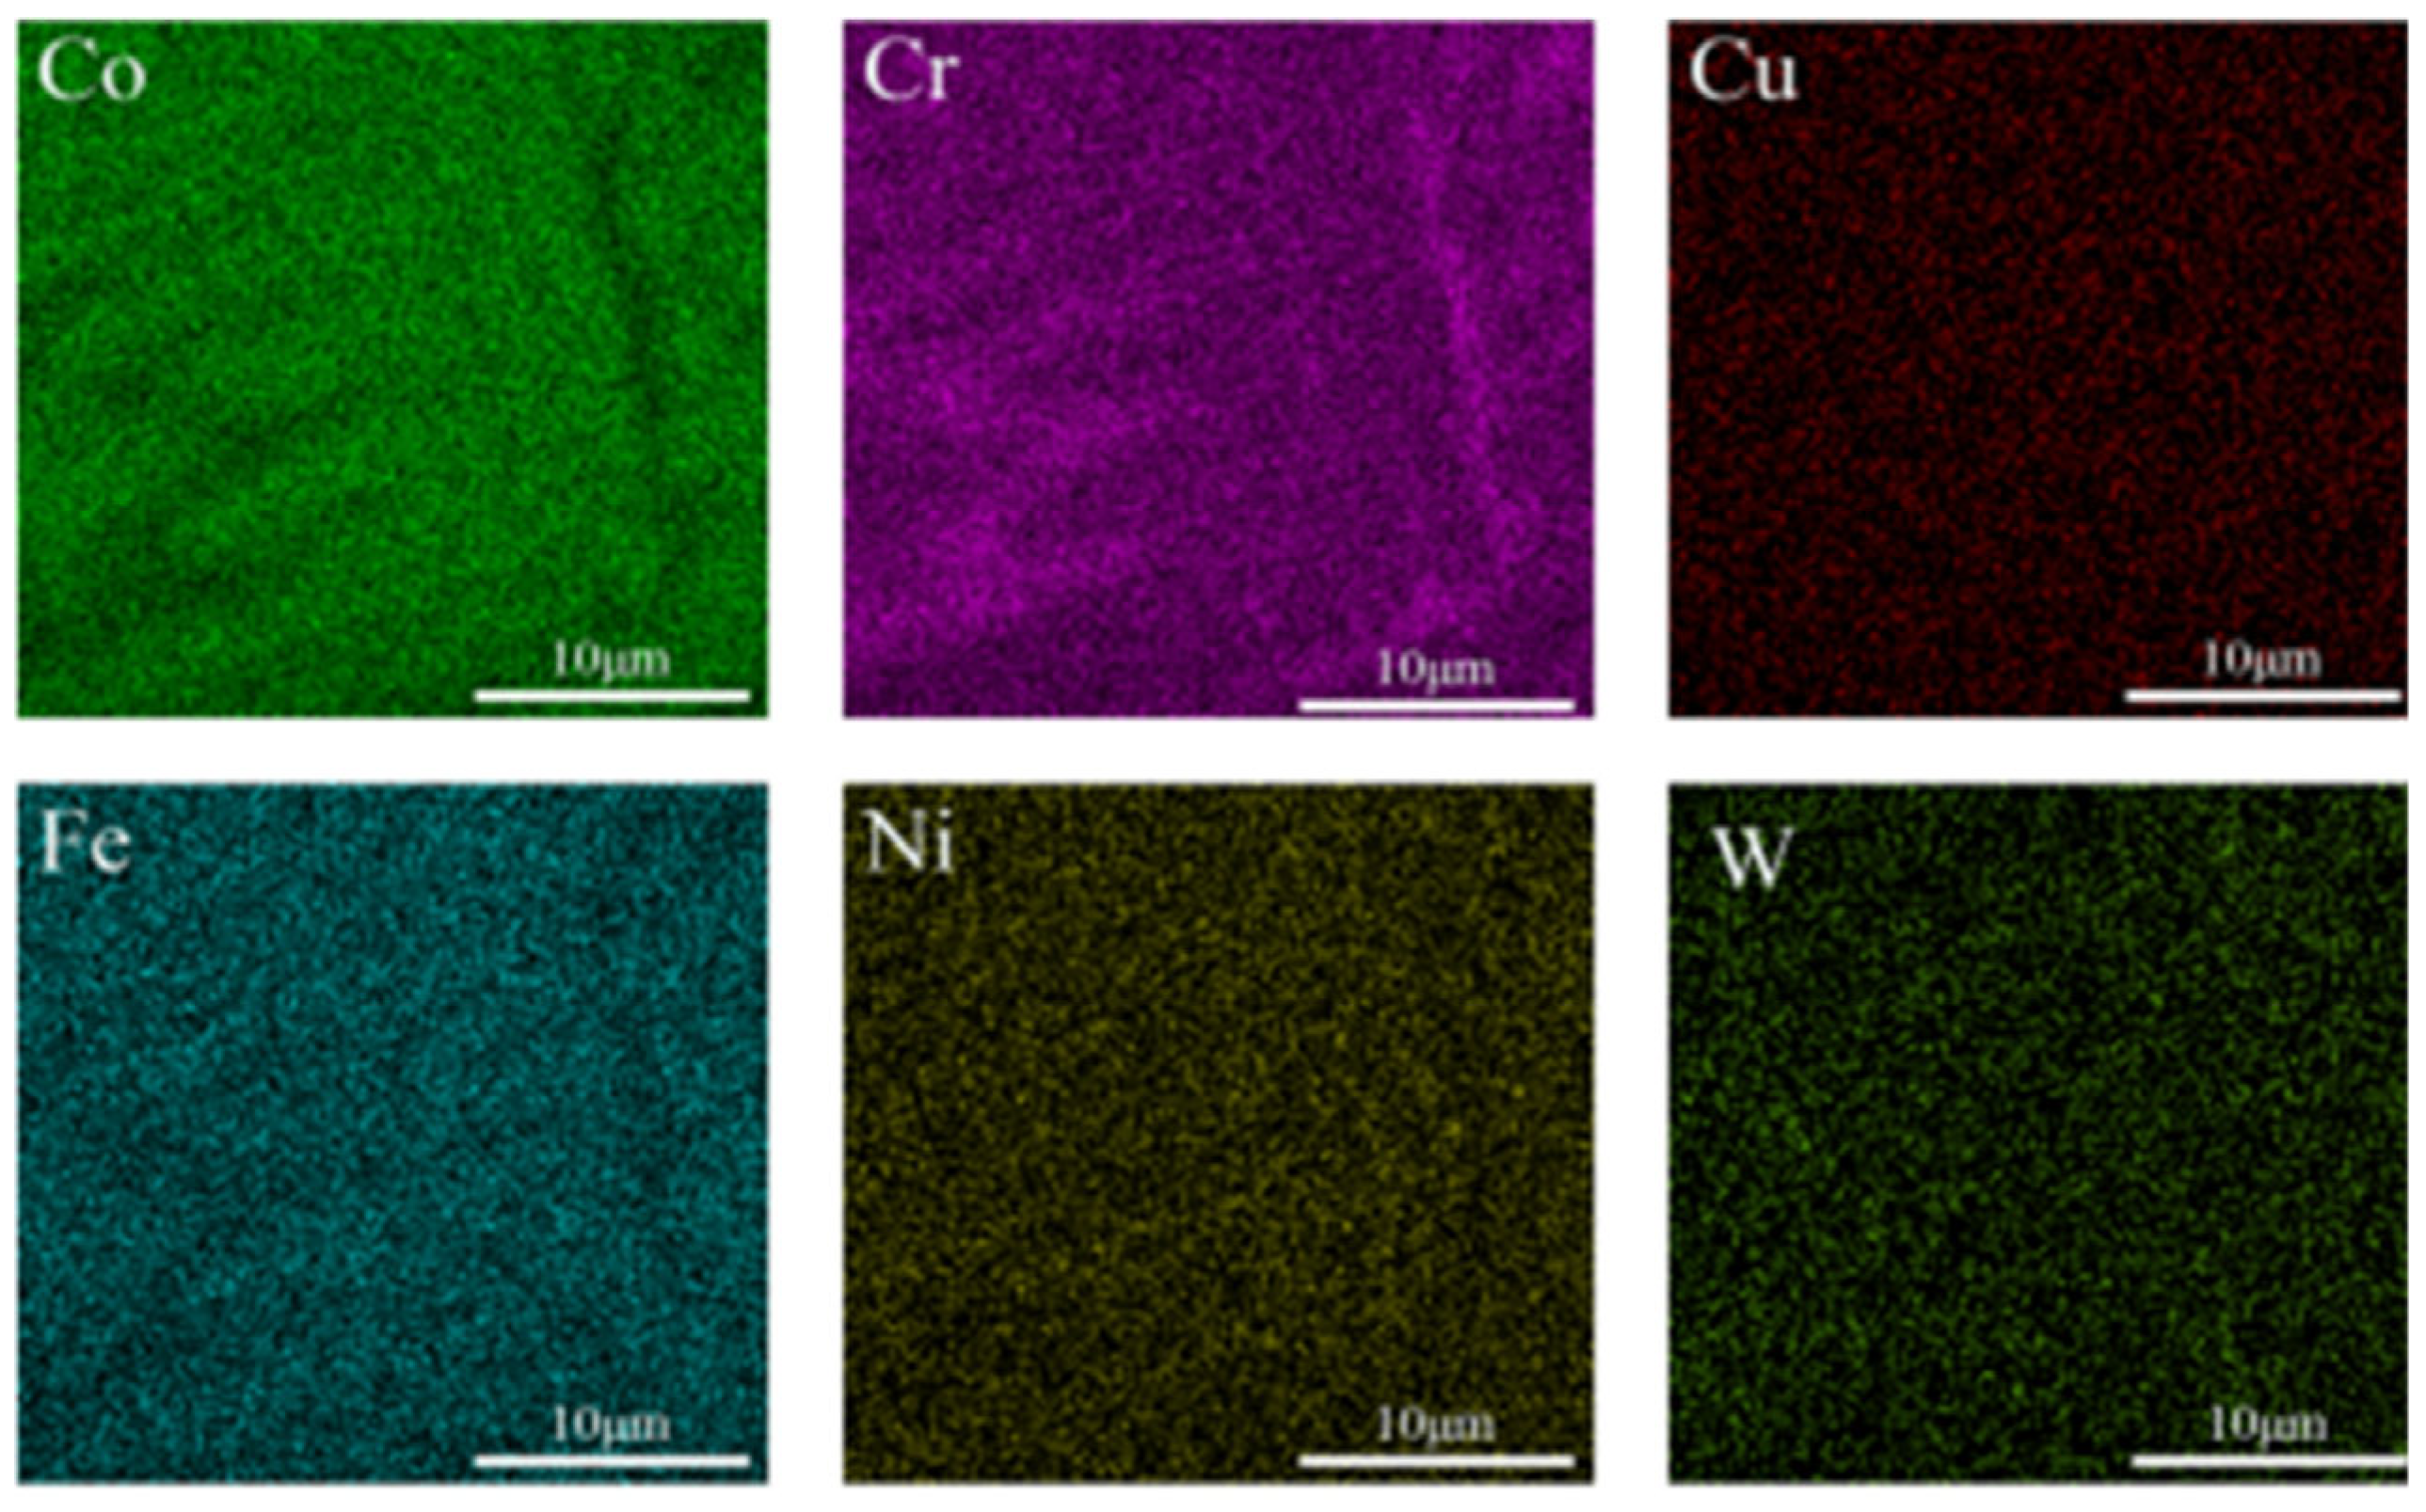
Figure 7.
Top EDS surface scanning of composite coating prepared at 600 mm/min.
Figure 7.
Top EDS surface scanning of composite coating prepared at 600 mm/min.
Figure 8.
Top EDS surface scanning of composite coating prepared at 800 mm/min.
Figure 8.
Top EDS surface scanning of composite coating prepared at 800 mm/min.
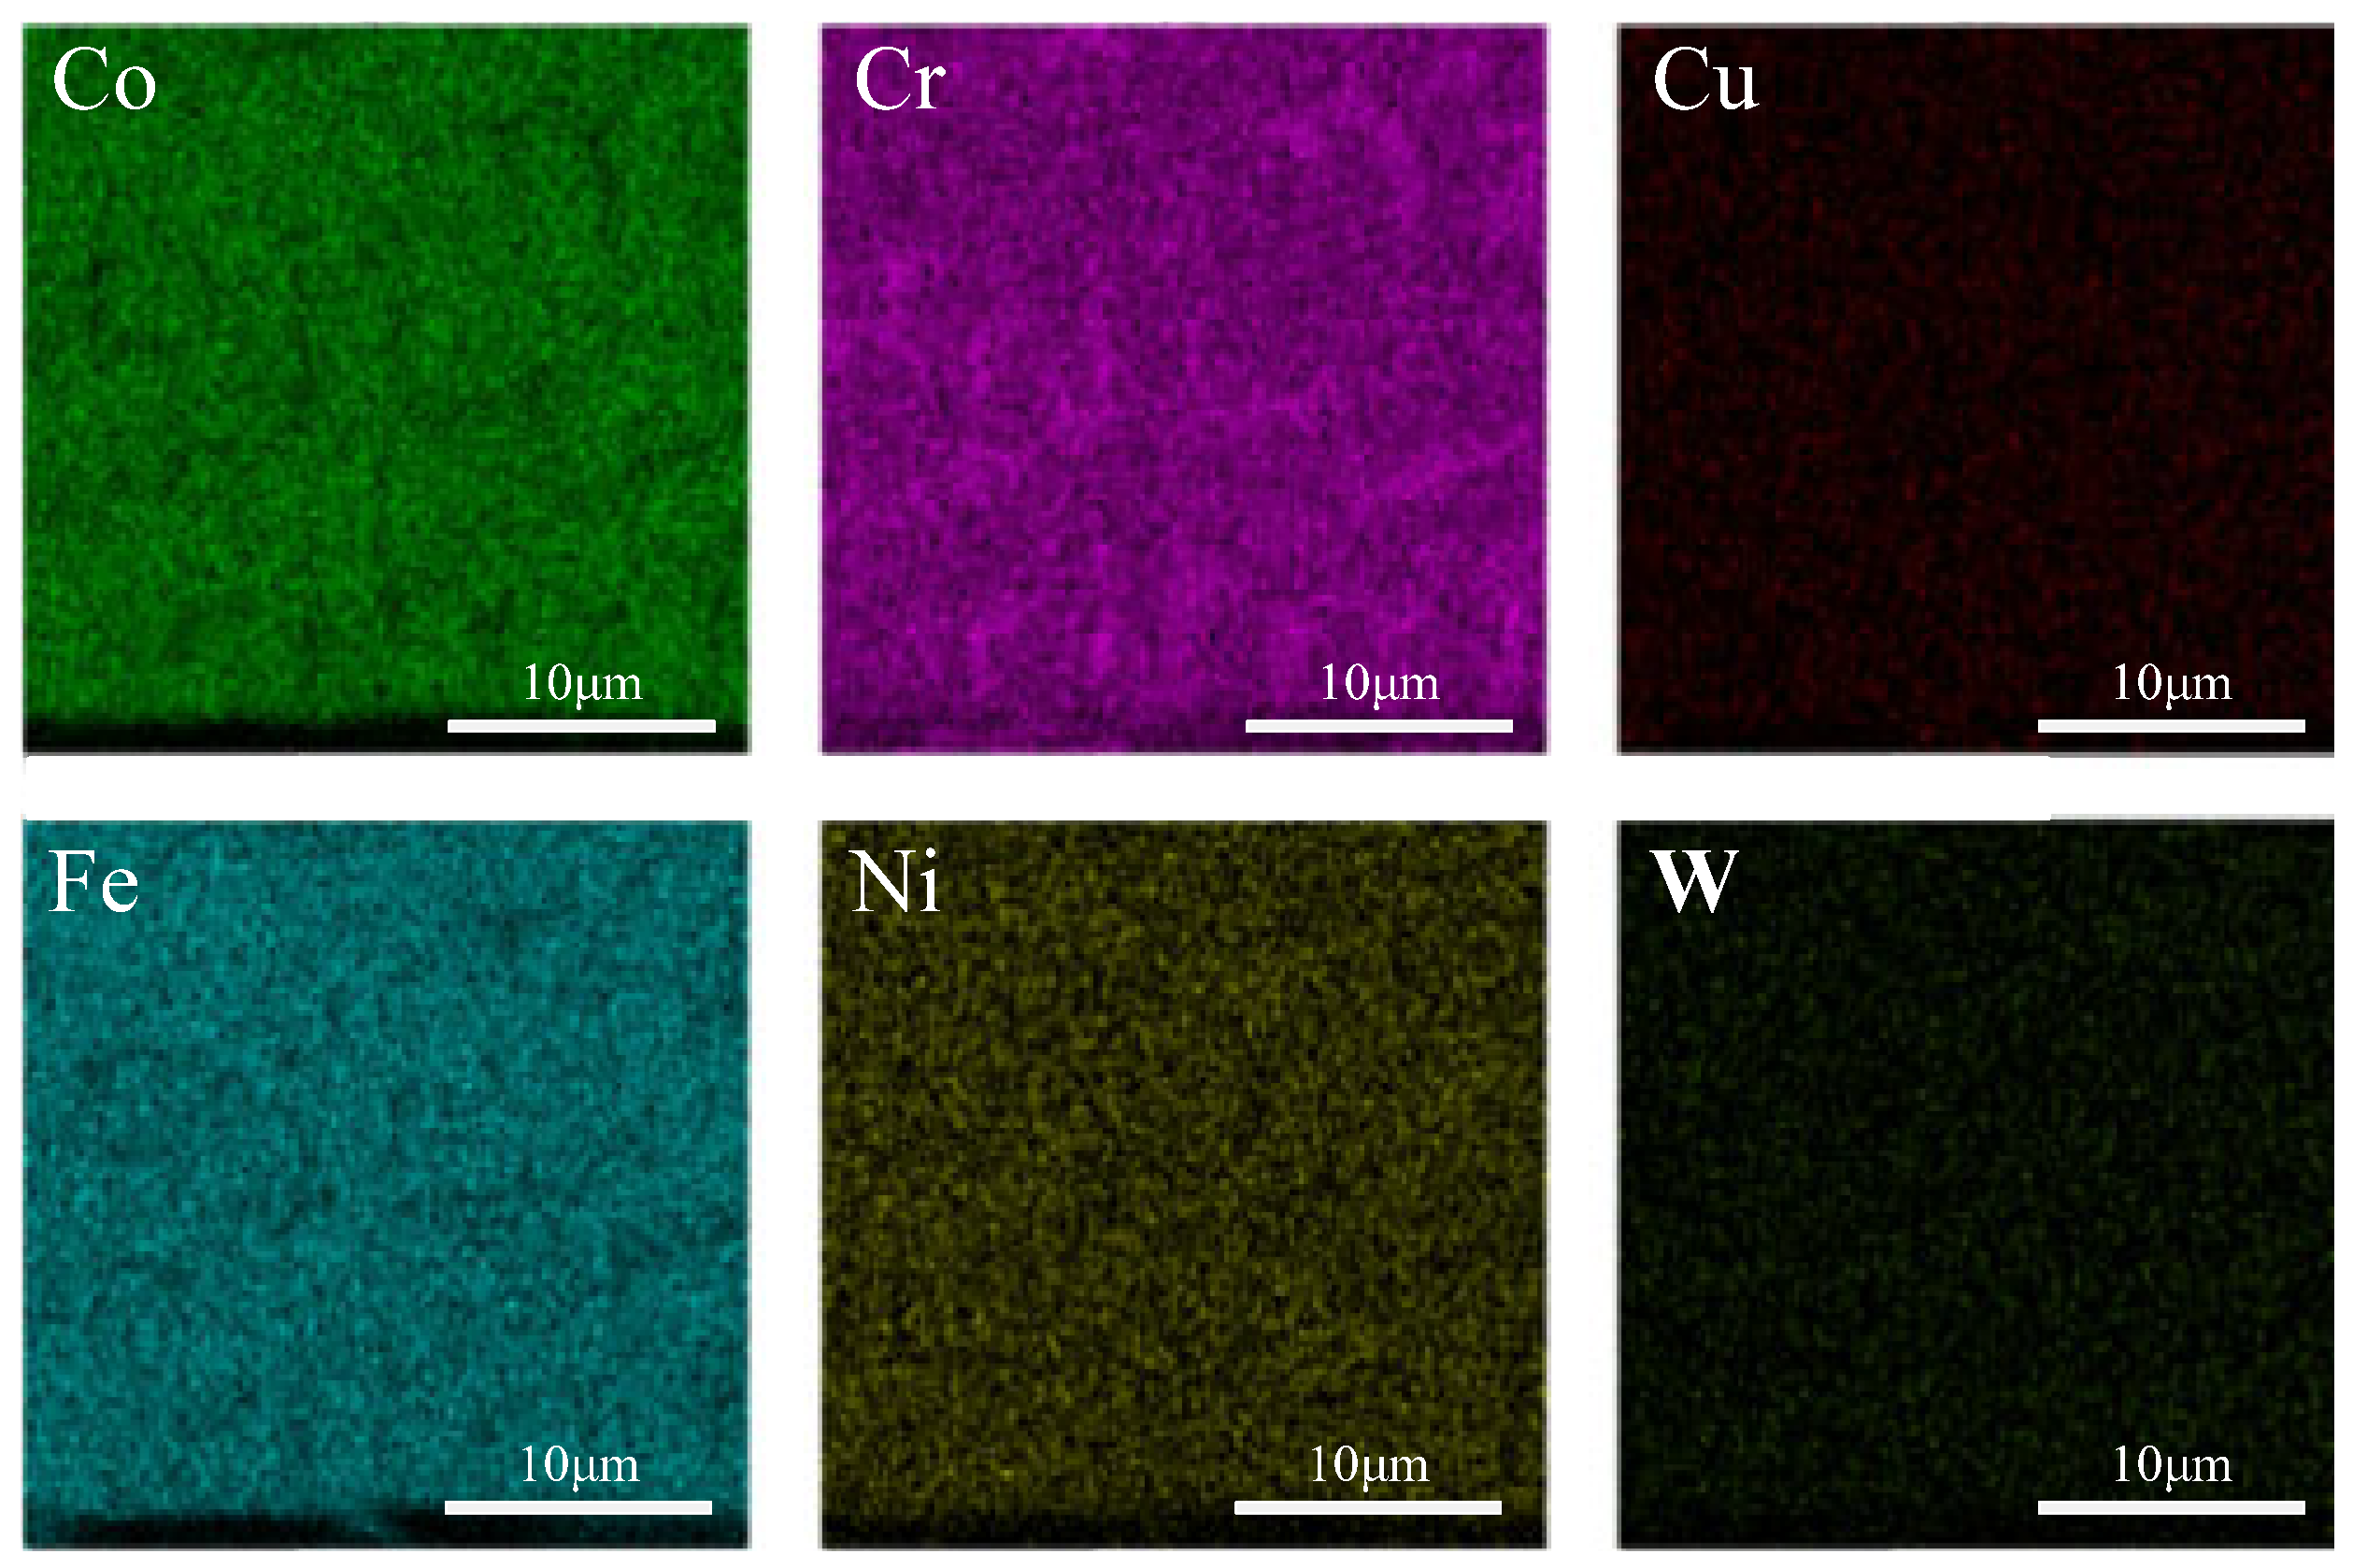
Figure 9.
Top EDS surface scanning of composite coating prepared at 1000 mm/min.
Figure 9.
Top EDS surface scanning of composite coating prepared at 1000 mm/min.
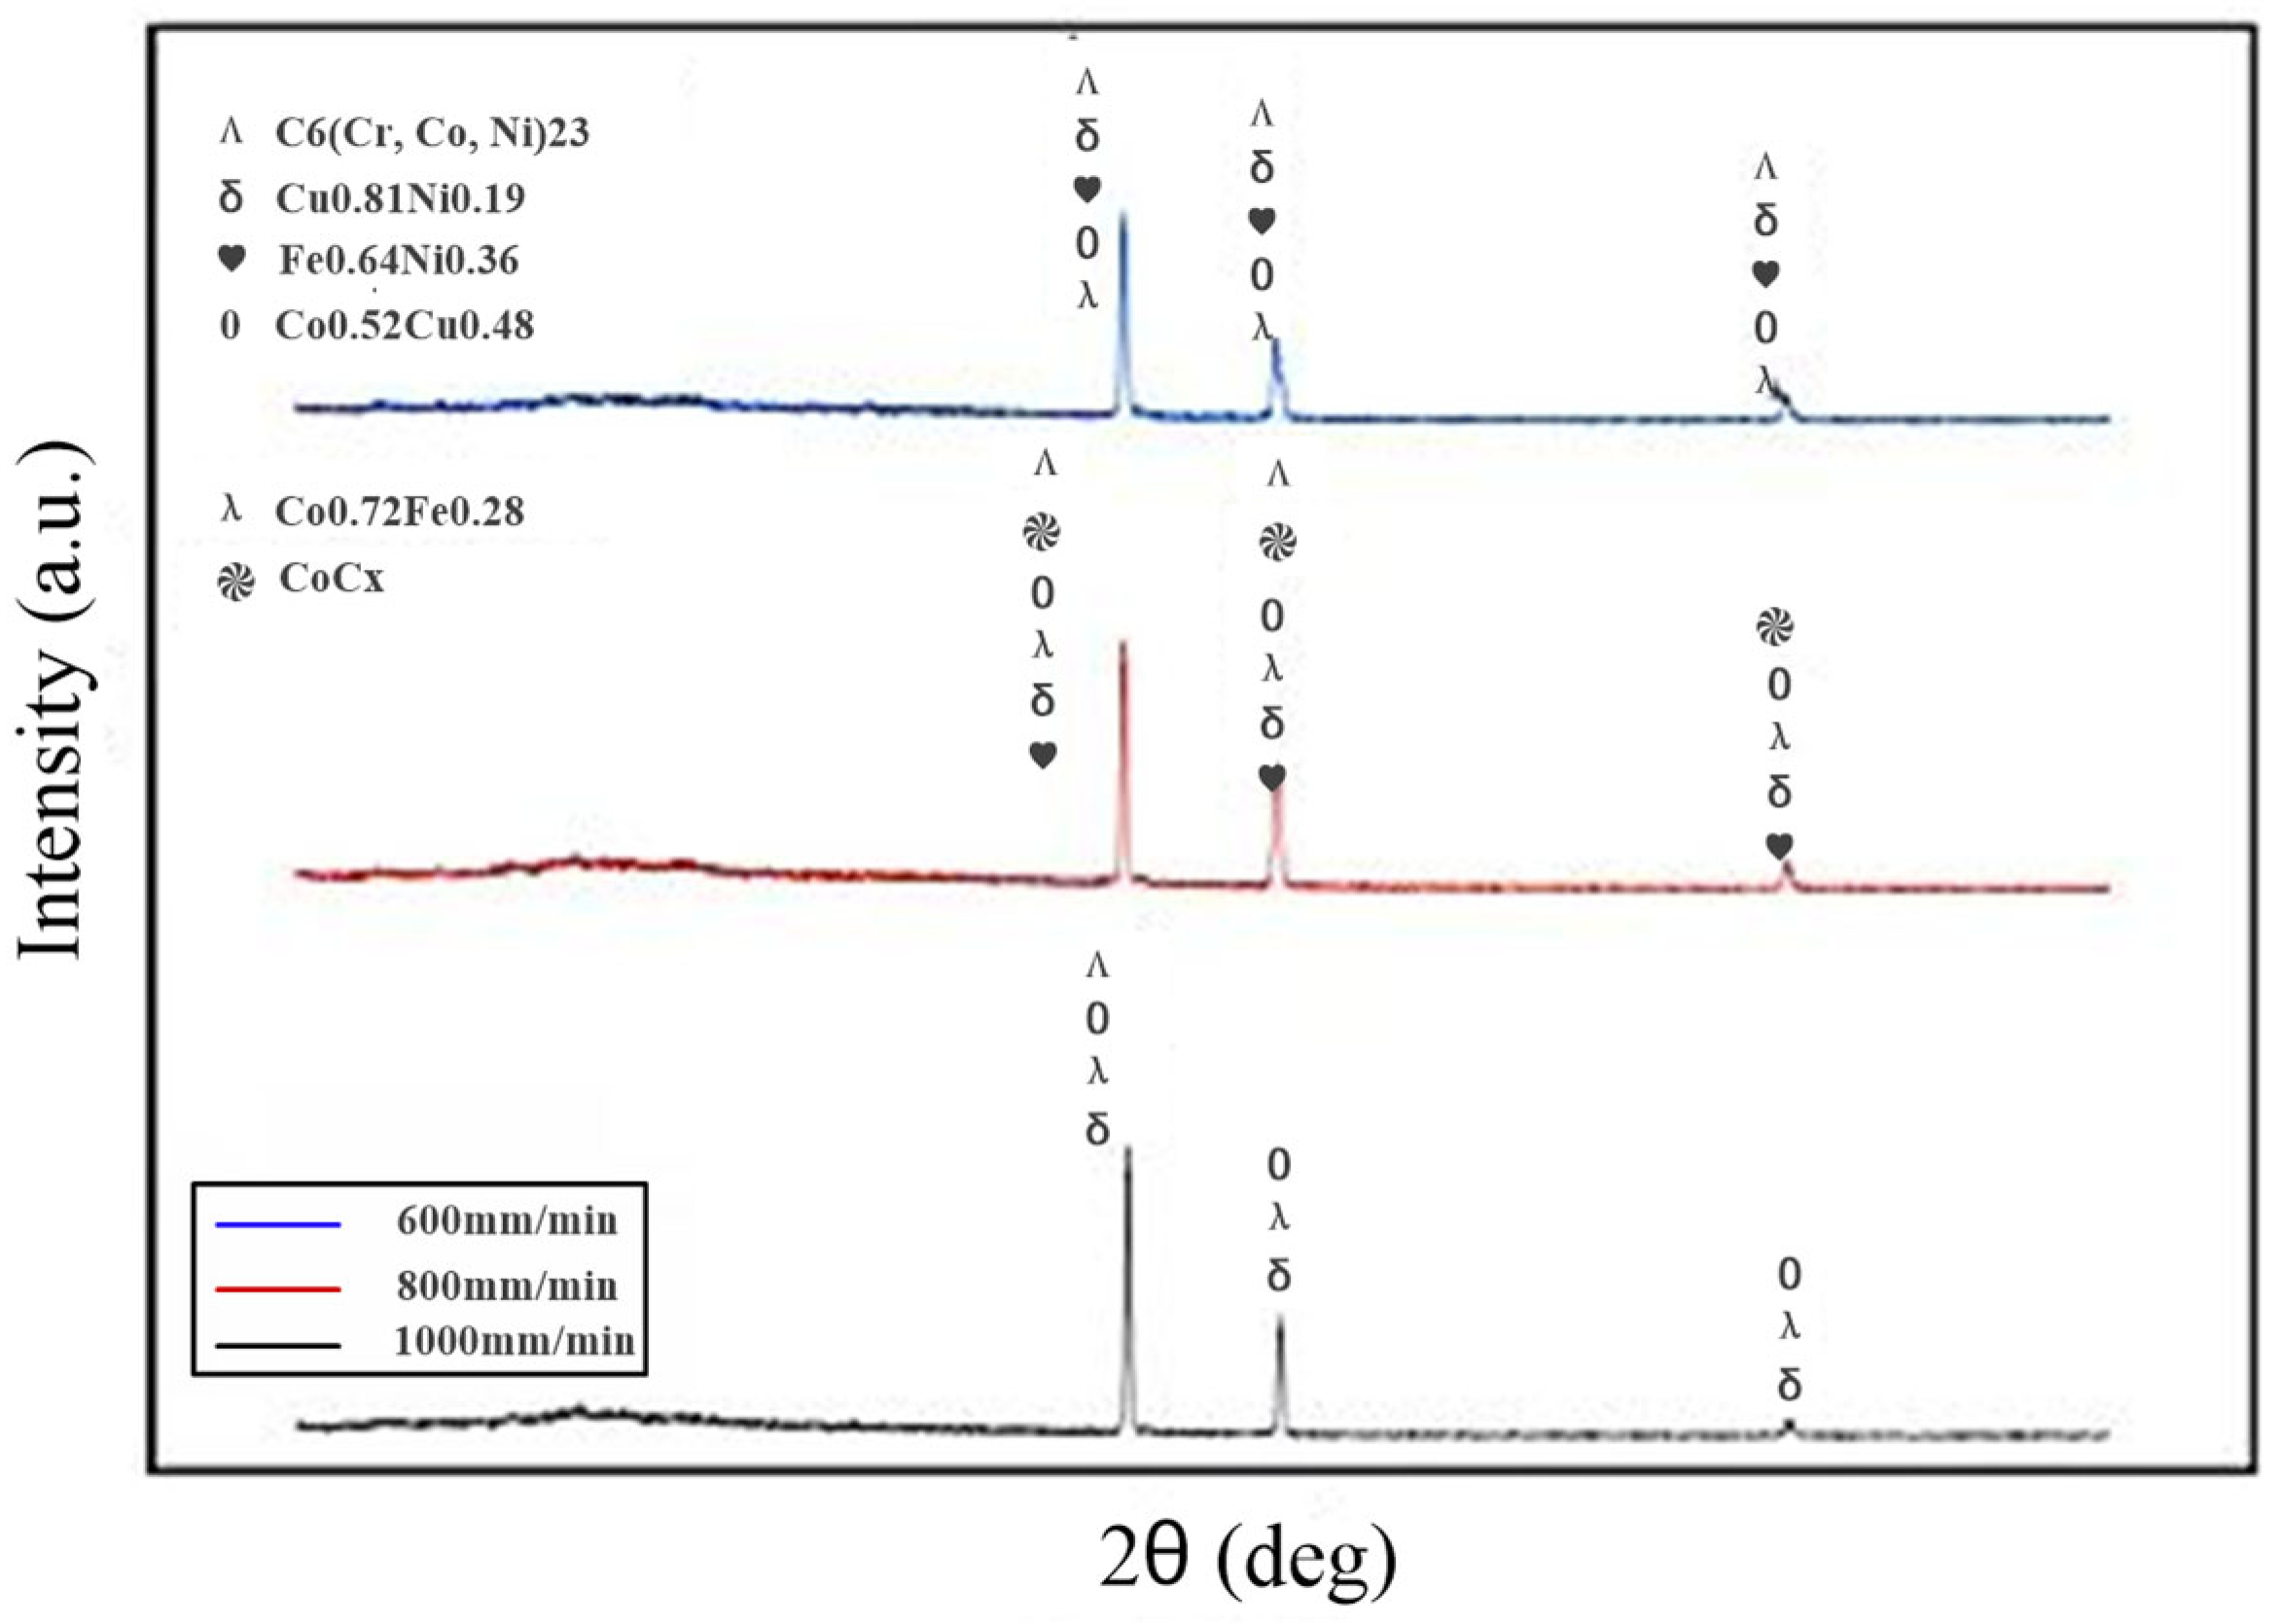
Figure 10.
Phase components of composite coatings prepared at different scanning speeds.
Figure 10.
Phase components of composite coatings prepared at different scanning speeds.
Figure 11.
Influence of different laser powers on the hardness of the coating under 600 mm/min.
Figure 11.
Influence of different laser powers on the hardness of the coating under 600 mm/min.
Figure 12.
Influence of different laser powers on the hardness of the coating under 800 mm/min.
Figure 12.
Influence of different laser powers on the hardness of the coating under 800 mm/min.
Figure 13.
Influence of different laser powers on the hardness of the coating under 1000 mm/min.
Figure 13.
Influence of different laser powers on the hardness of the coating under 1000 mm/min.
Figure 14.
Friction coefficient of composite coatings prepared by different laser powers under Si3N4 ball.
Figure 14.
Friction coefficient of composite coatings prepared by different laser powers under Si3N4 ball.
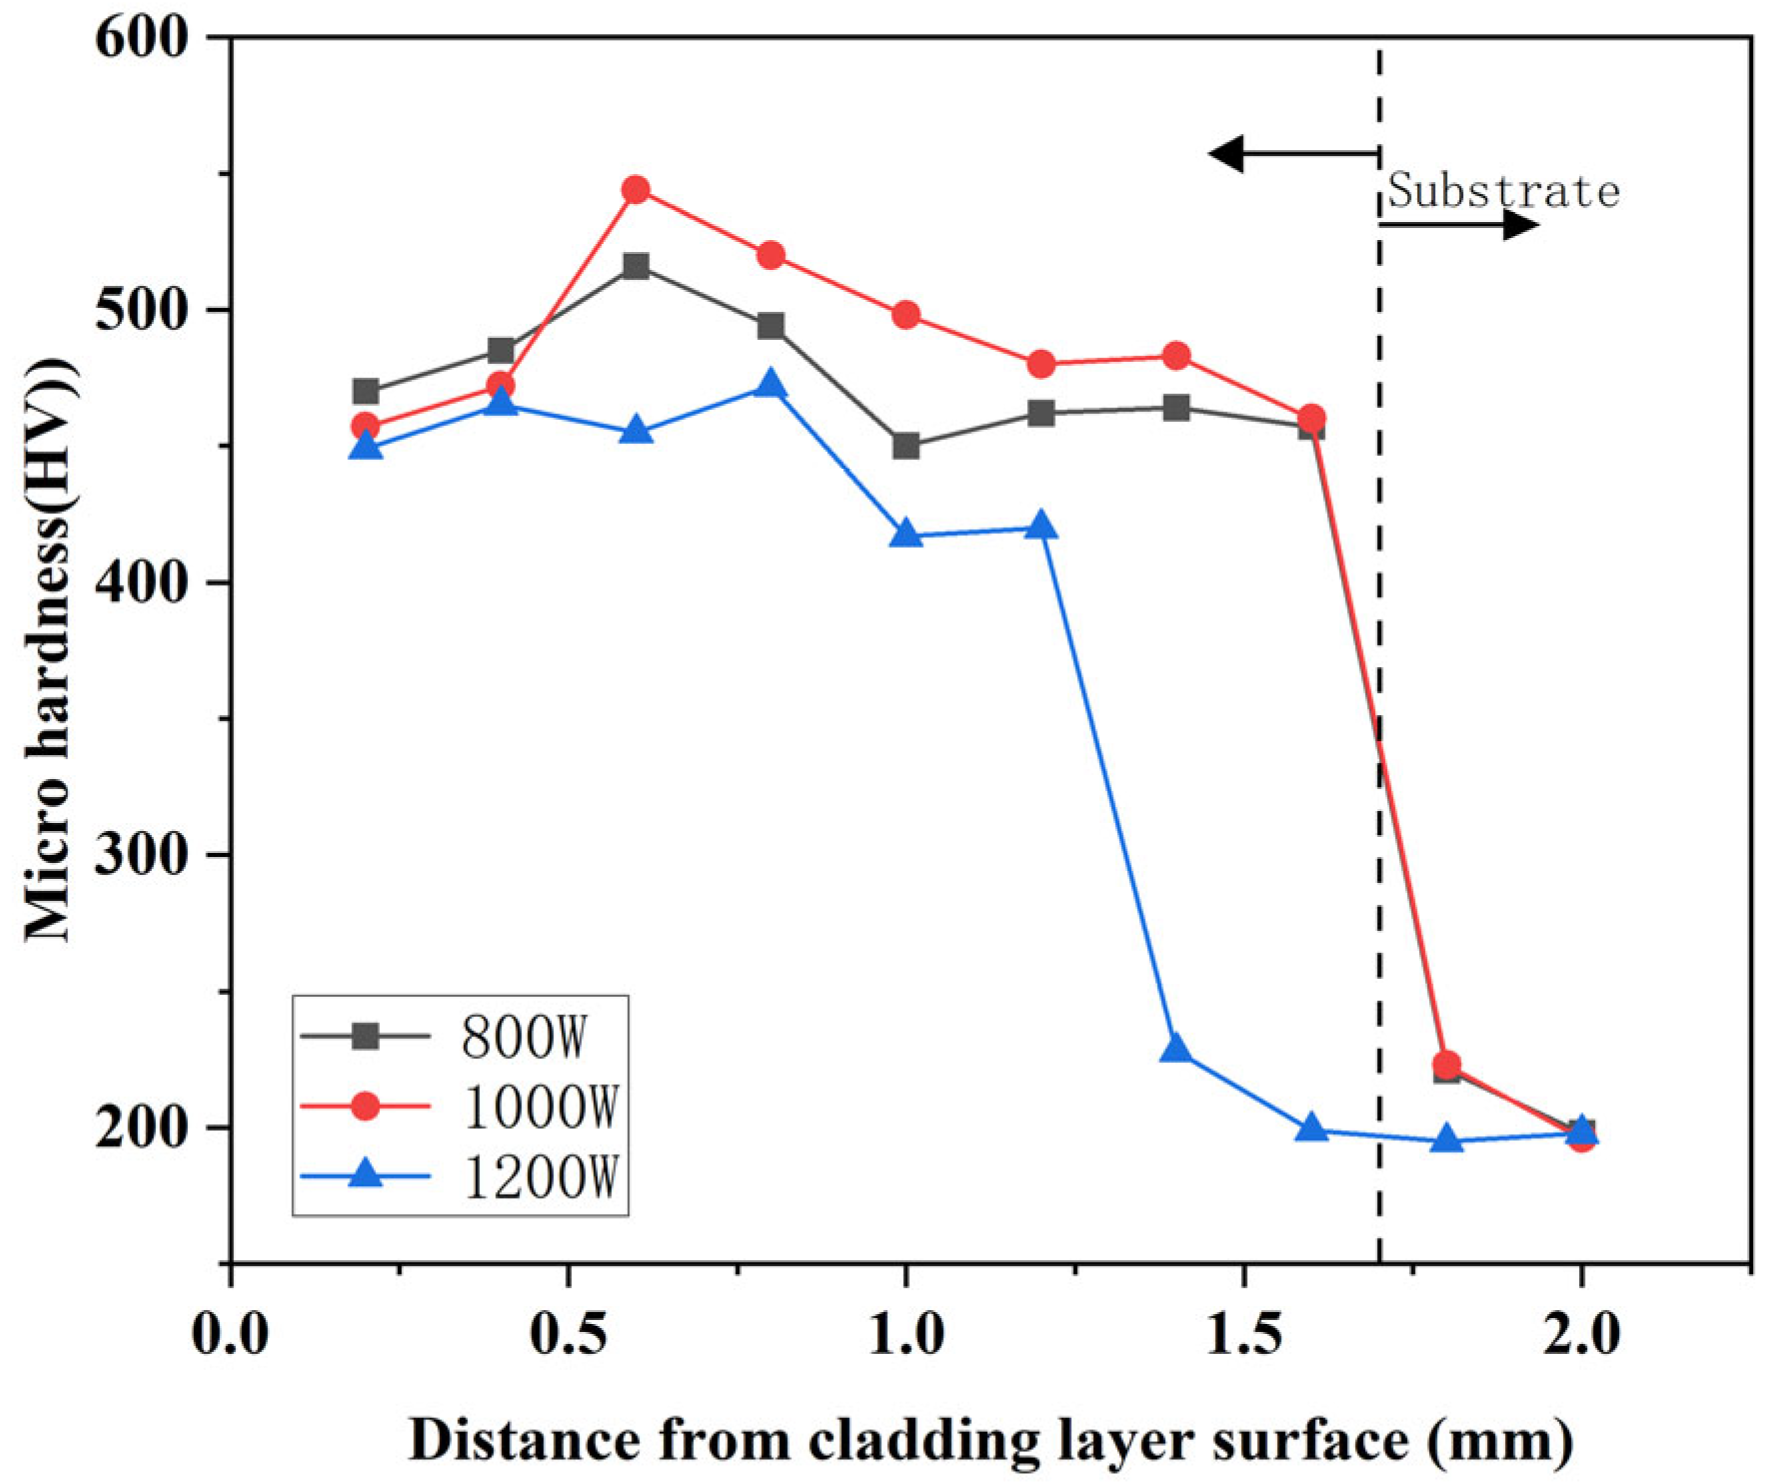
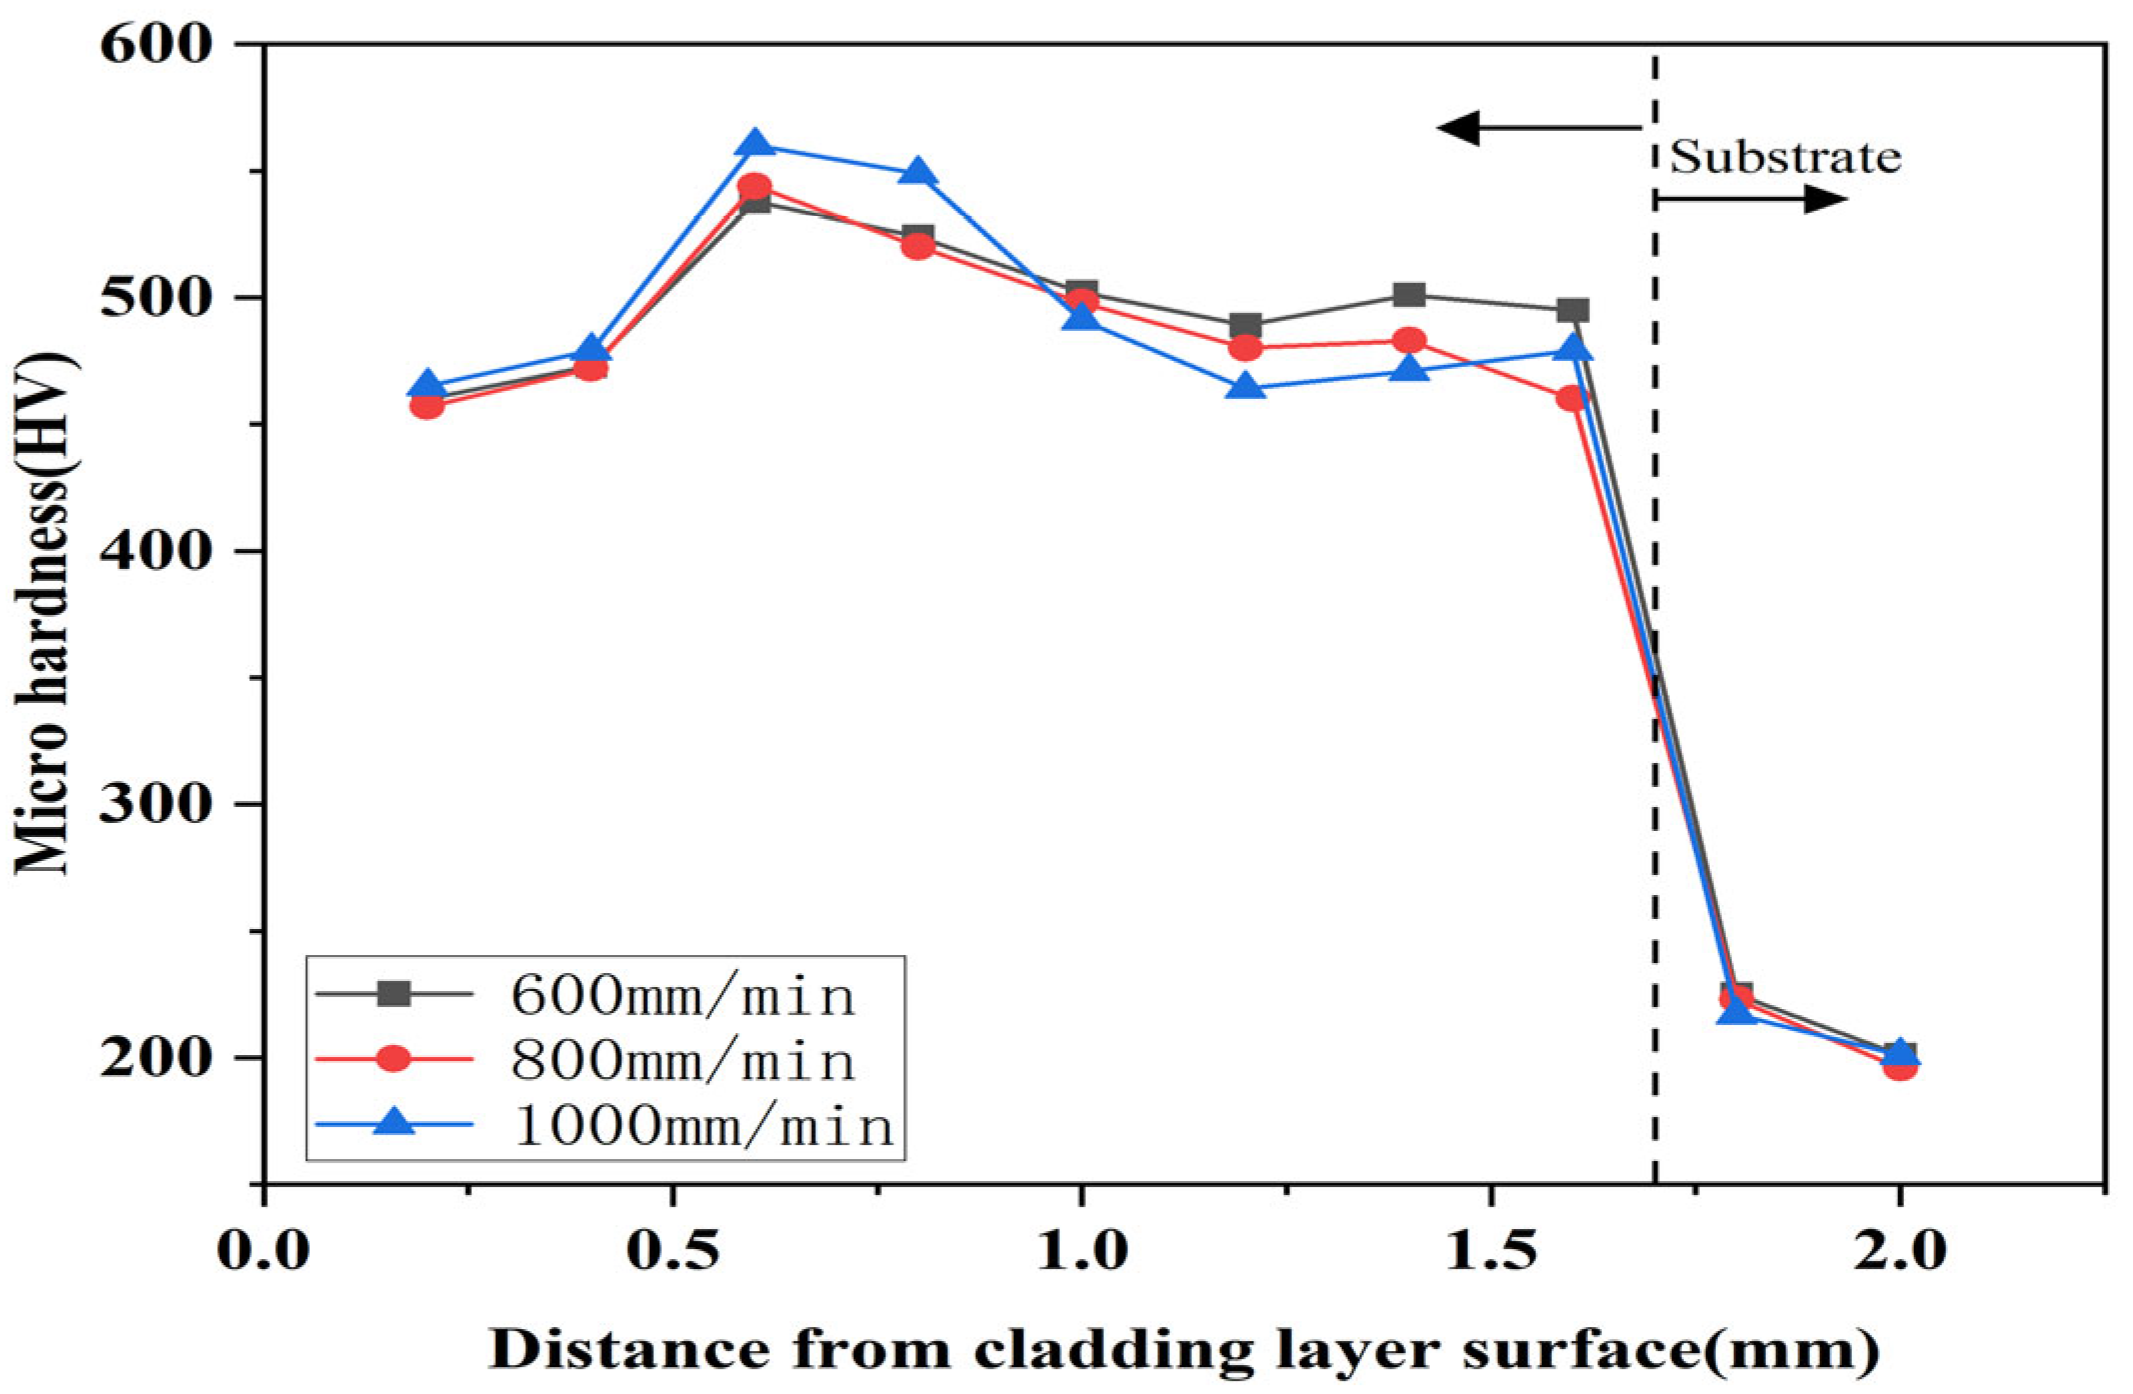
Figure 15.
Influence of different scanning speeds on the hardness of the cladding under 800 W.
Figure 15.
Influence of different scanning speeds on the hardness of the cladding under 800 W.
Figure 16.
Influence of different scanning speeds on the hardness of the cladding under 1000 W.
Figure 16.
Influence of different scanning speeds on the hardness of the cladding under 1000 W.
Figure 17.
Influence of different scanning speeds on the hardness of the cladding under 1200 W.
Figure 17.
Influence of different scanning speeds on the hardness of the cladding under 1200 W.
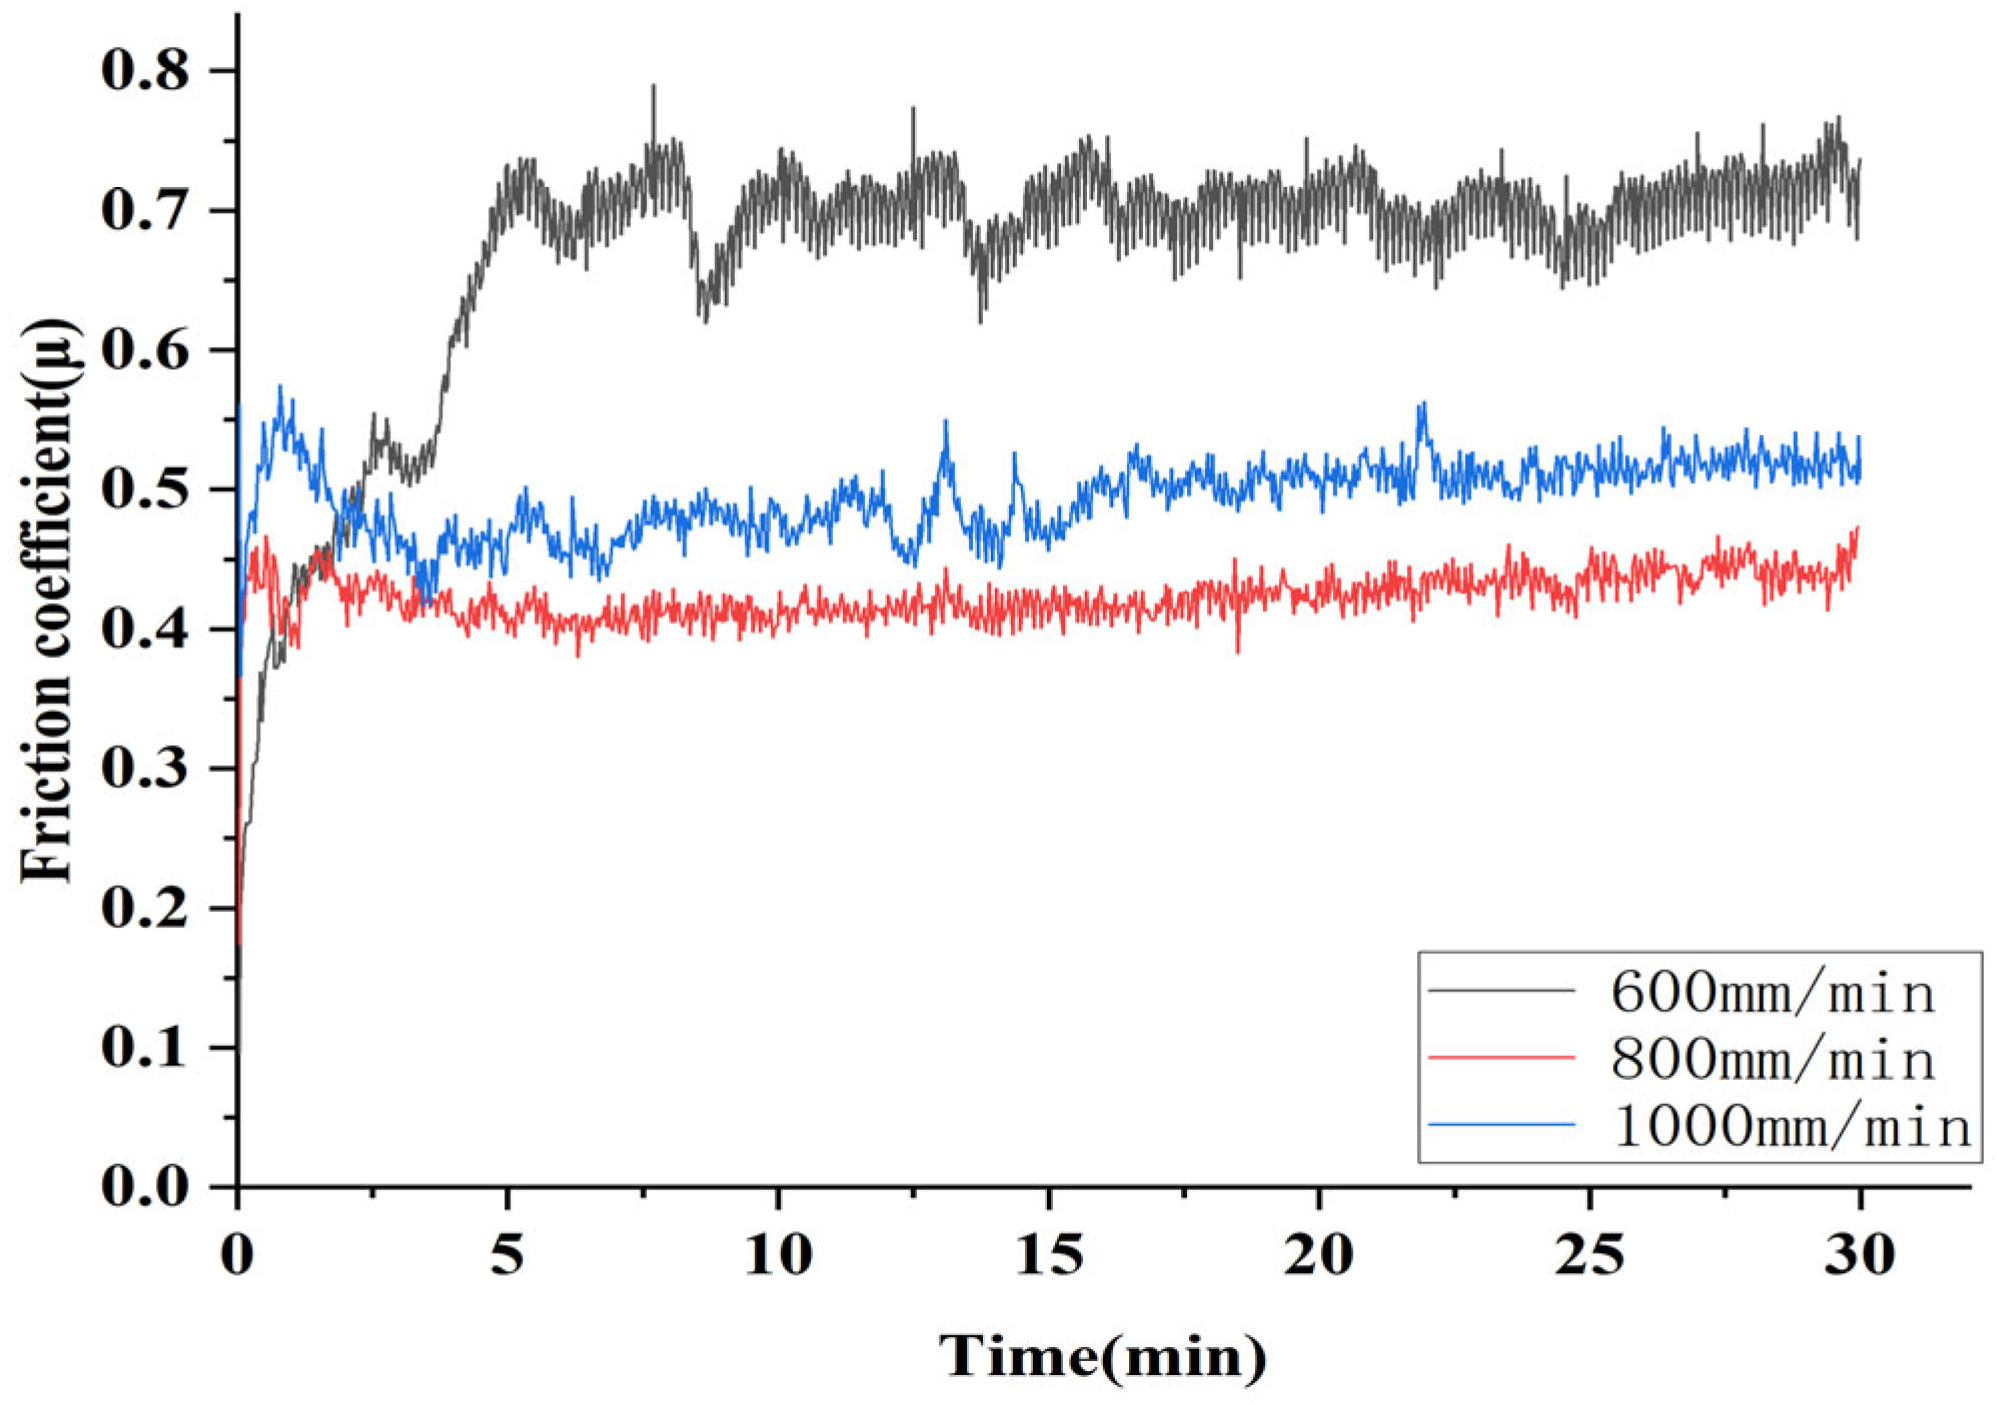
Figure 18.
Friction coefficient of composite coating prepared by different scanning speeds under Si3N4 ball.
Figure 18.
Friction coefficient of composite coating prepared by different scanning speeds under Si3N4 ball.
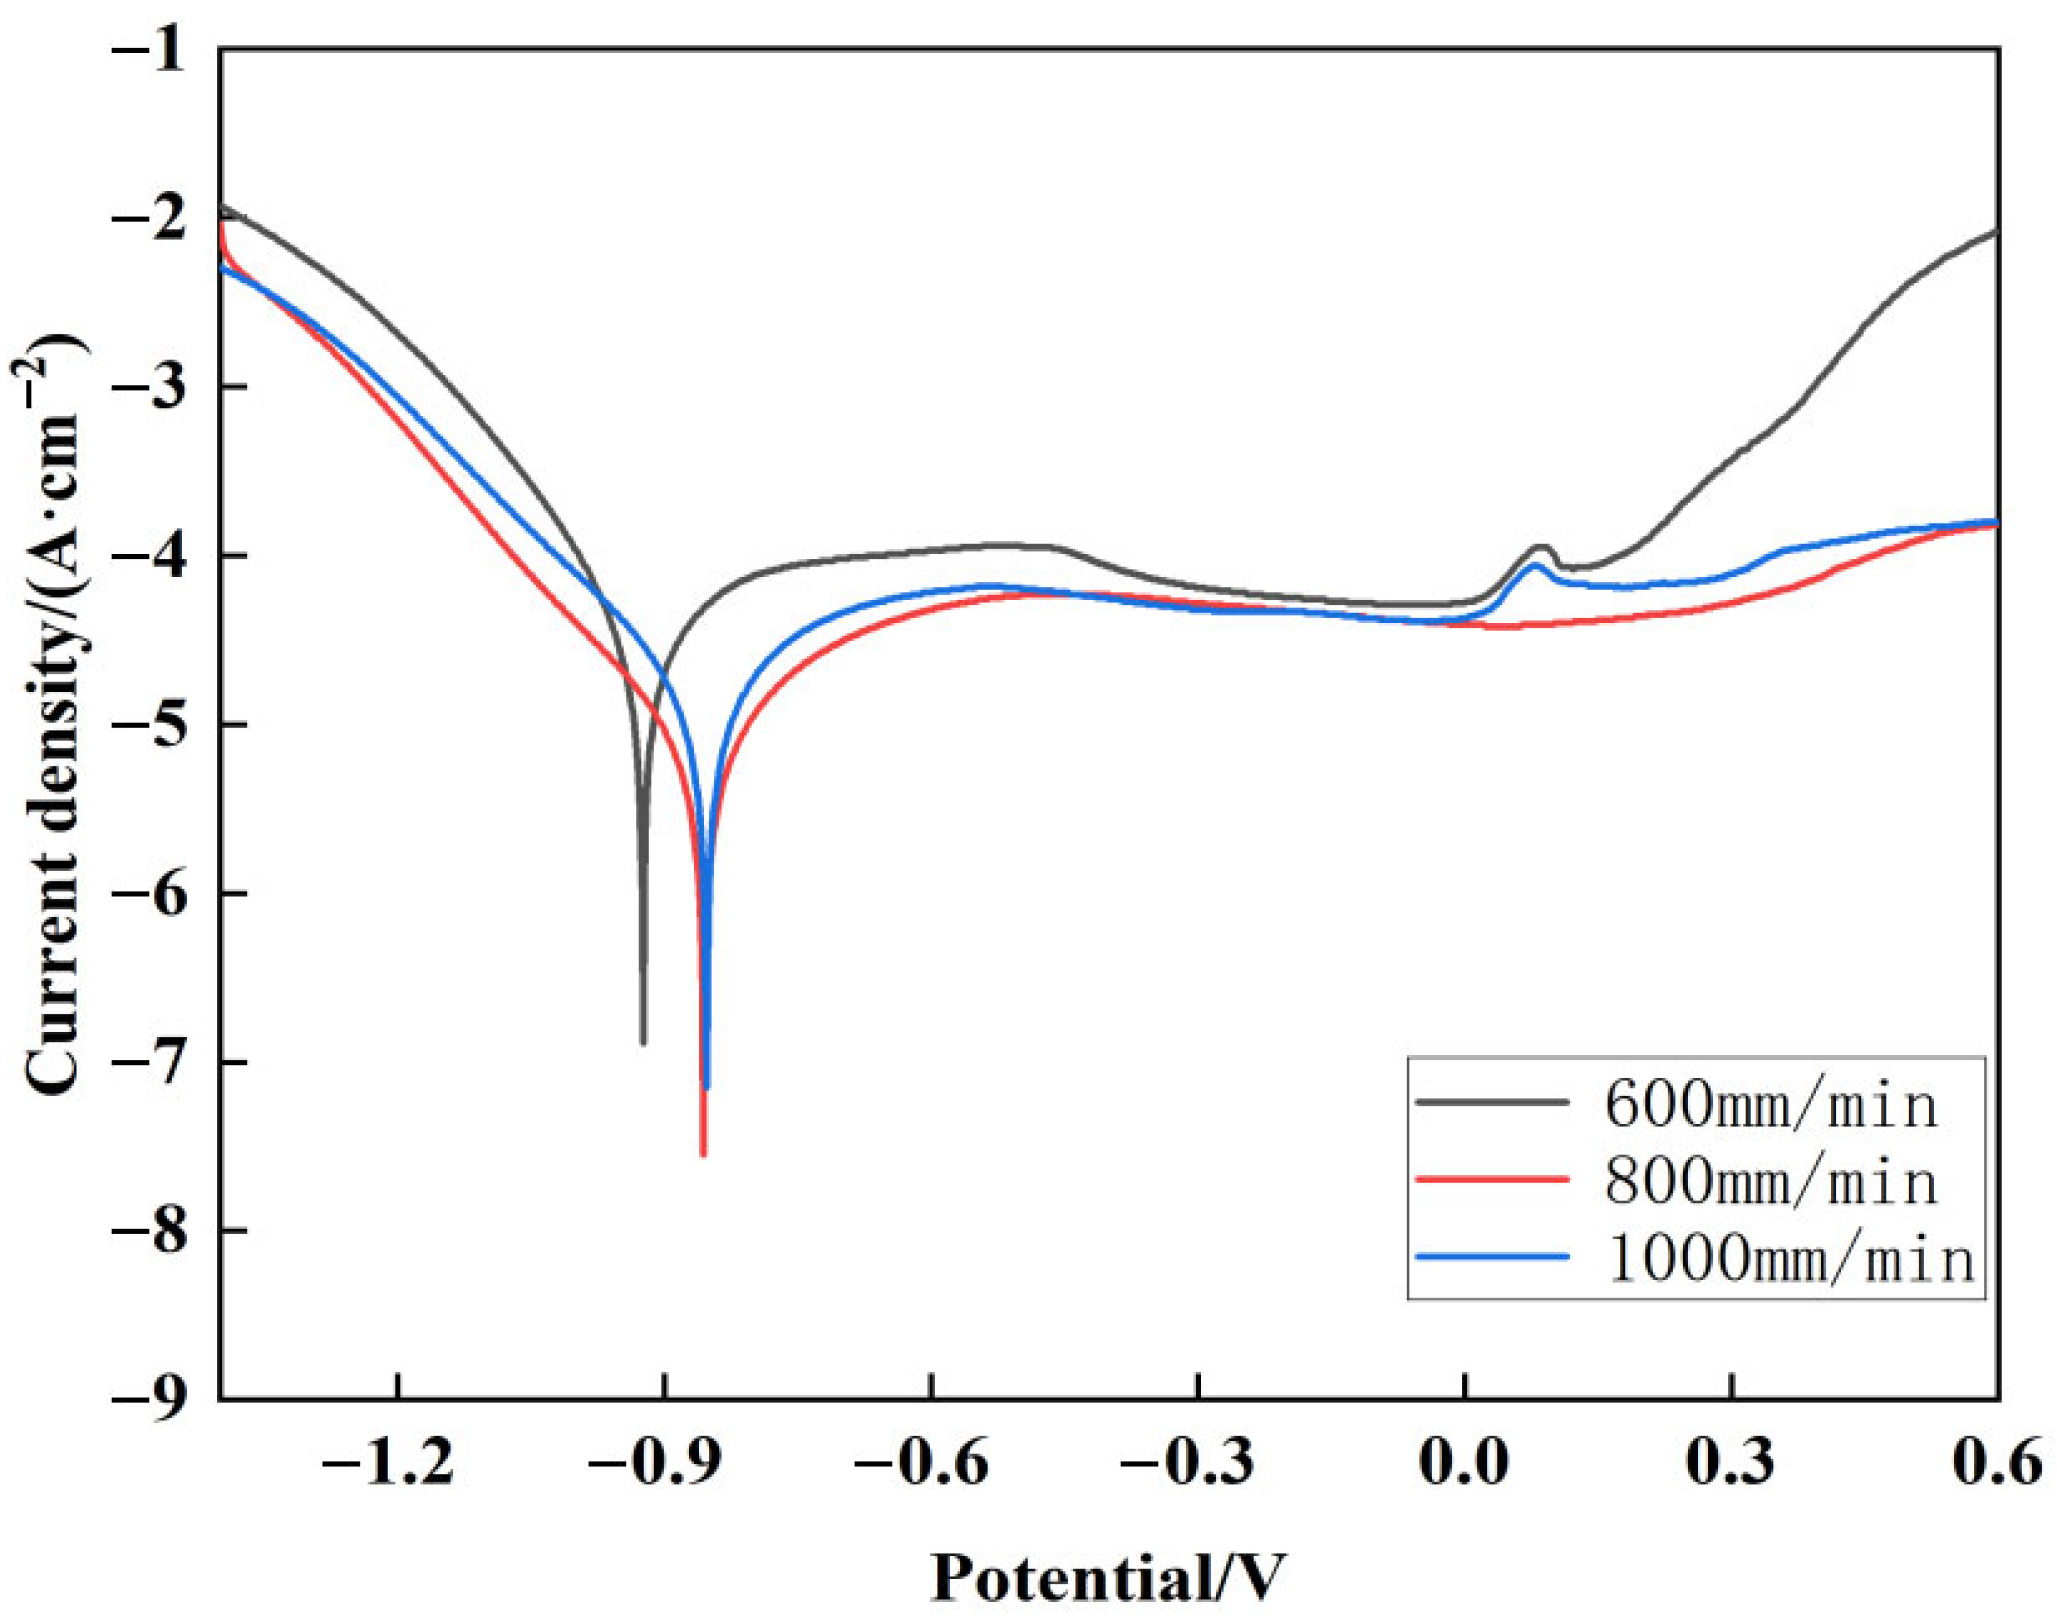
Figure 19.
Potentiodynamic polarization curves of composite coatings with different scanning speeds.
Figure 19.
Potentiodynamic polarization curves of composite coatings with different scanning speeds.
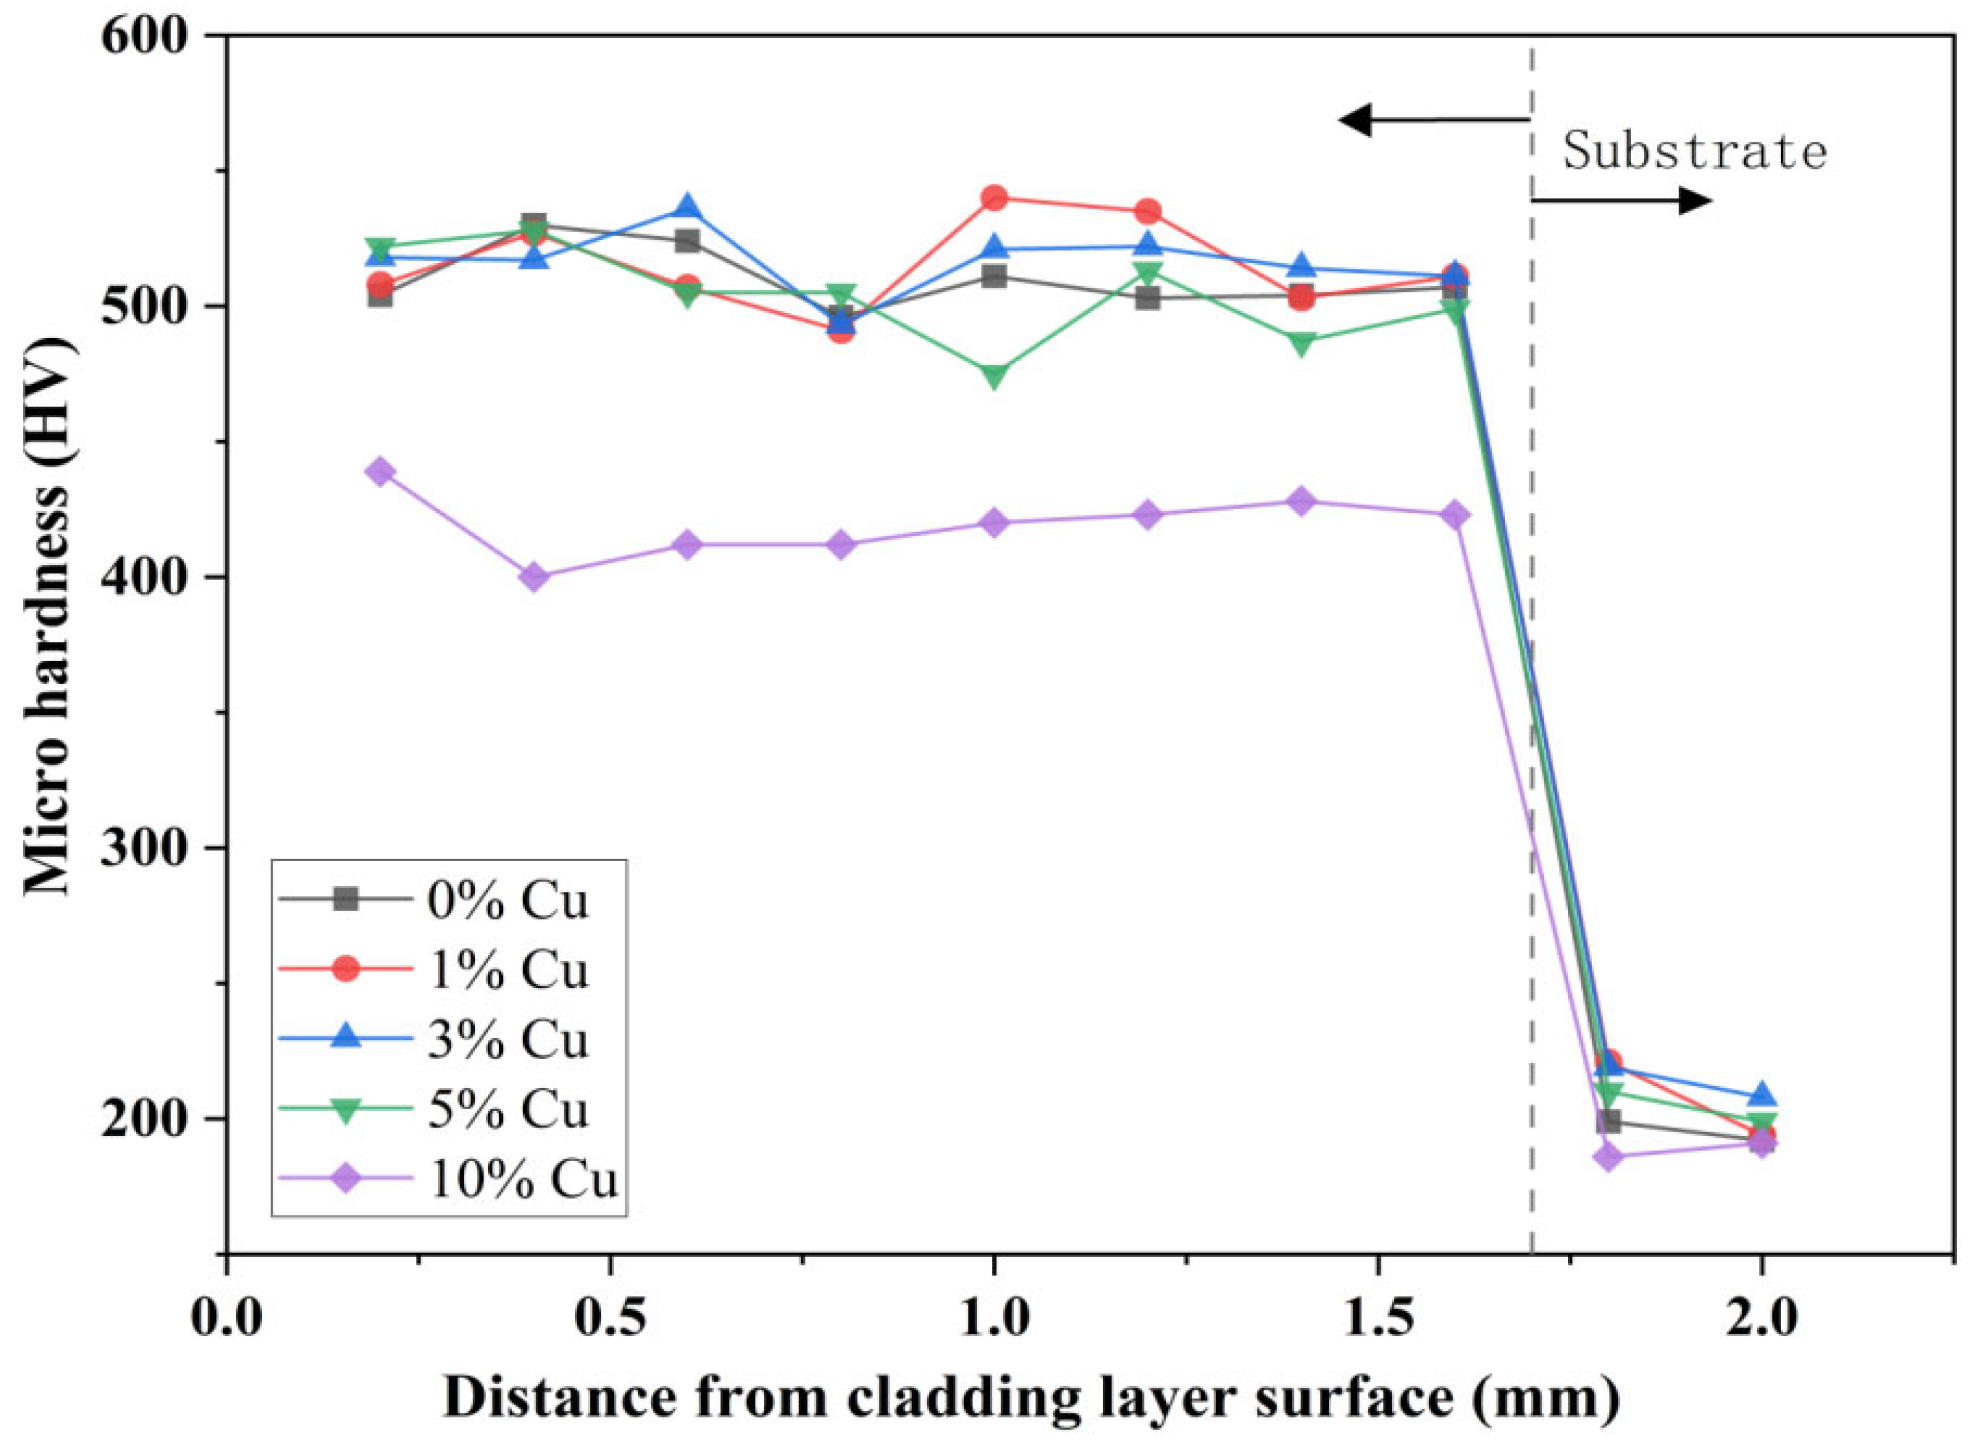
Figure 20.
Hardness distribution of copper-based alloy cladding layer with different Cu weight percents.
Figure 20.
Hardness distribution of copper-based alloy cladding layer with different Cu weight percents.
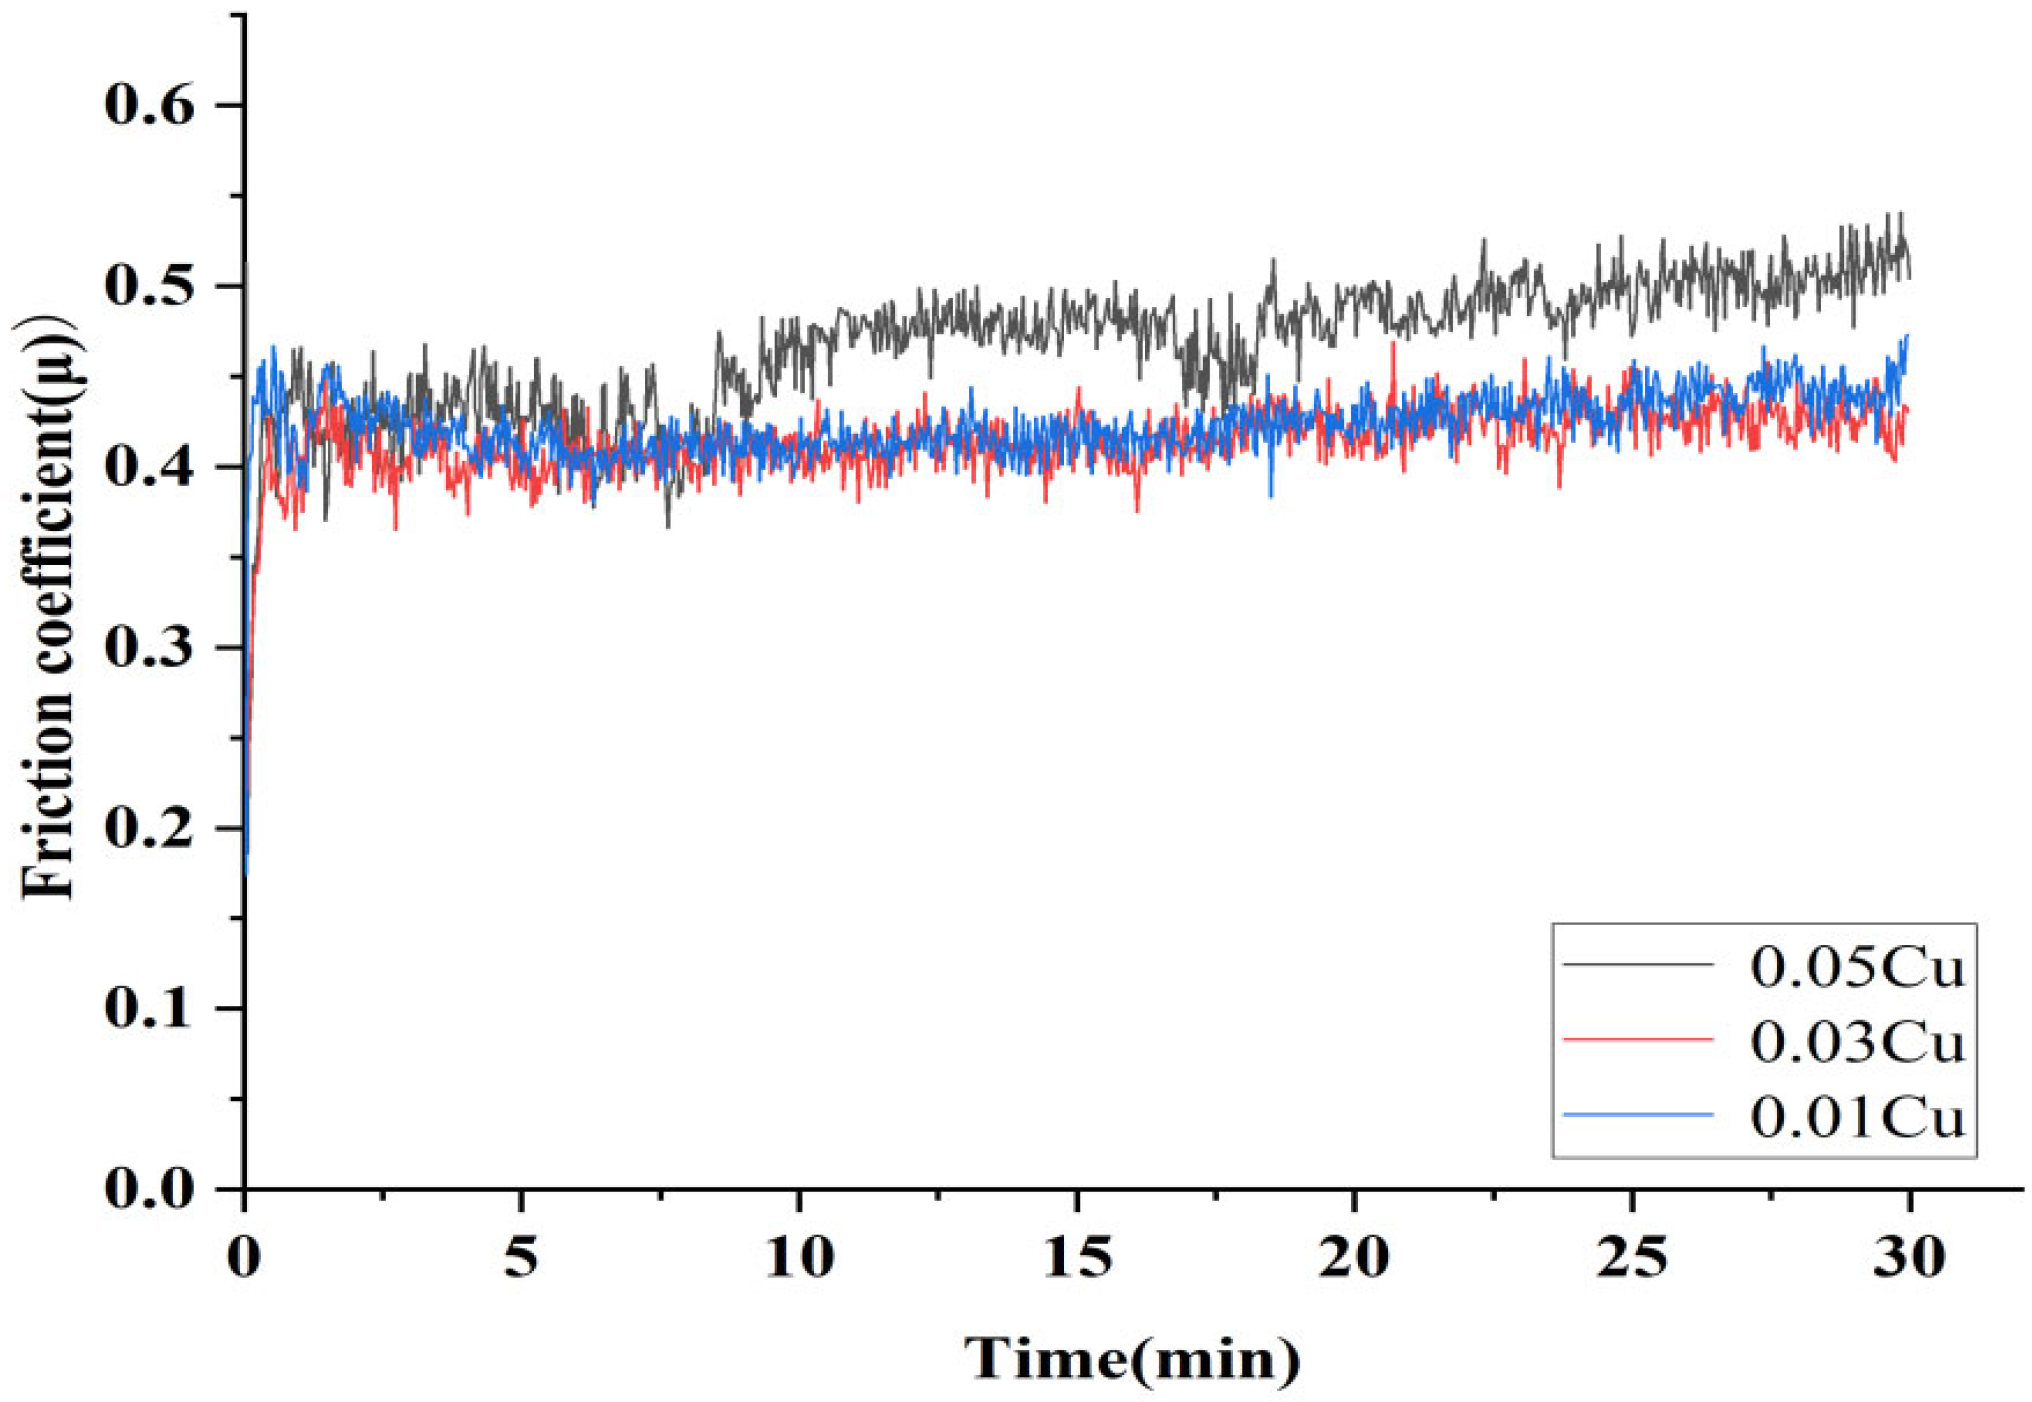
Figure 21.
Friction coefficient of composite coatings prepared at the different weight percents of copper.
Figure 21.
Friction coefficient of composite coatings prepared at the different weight percents of copper.
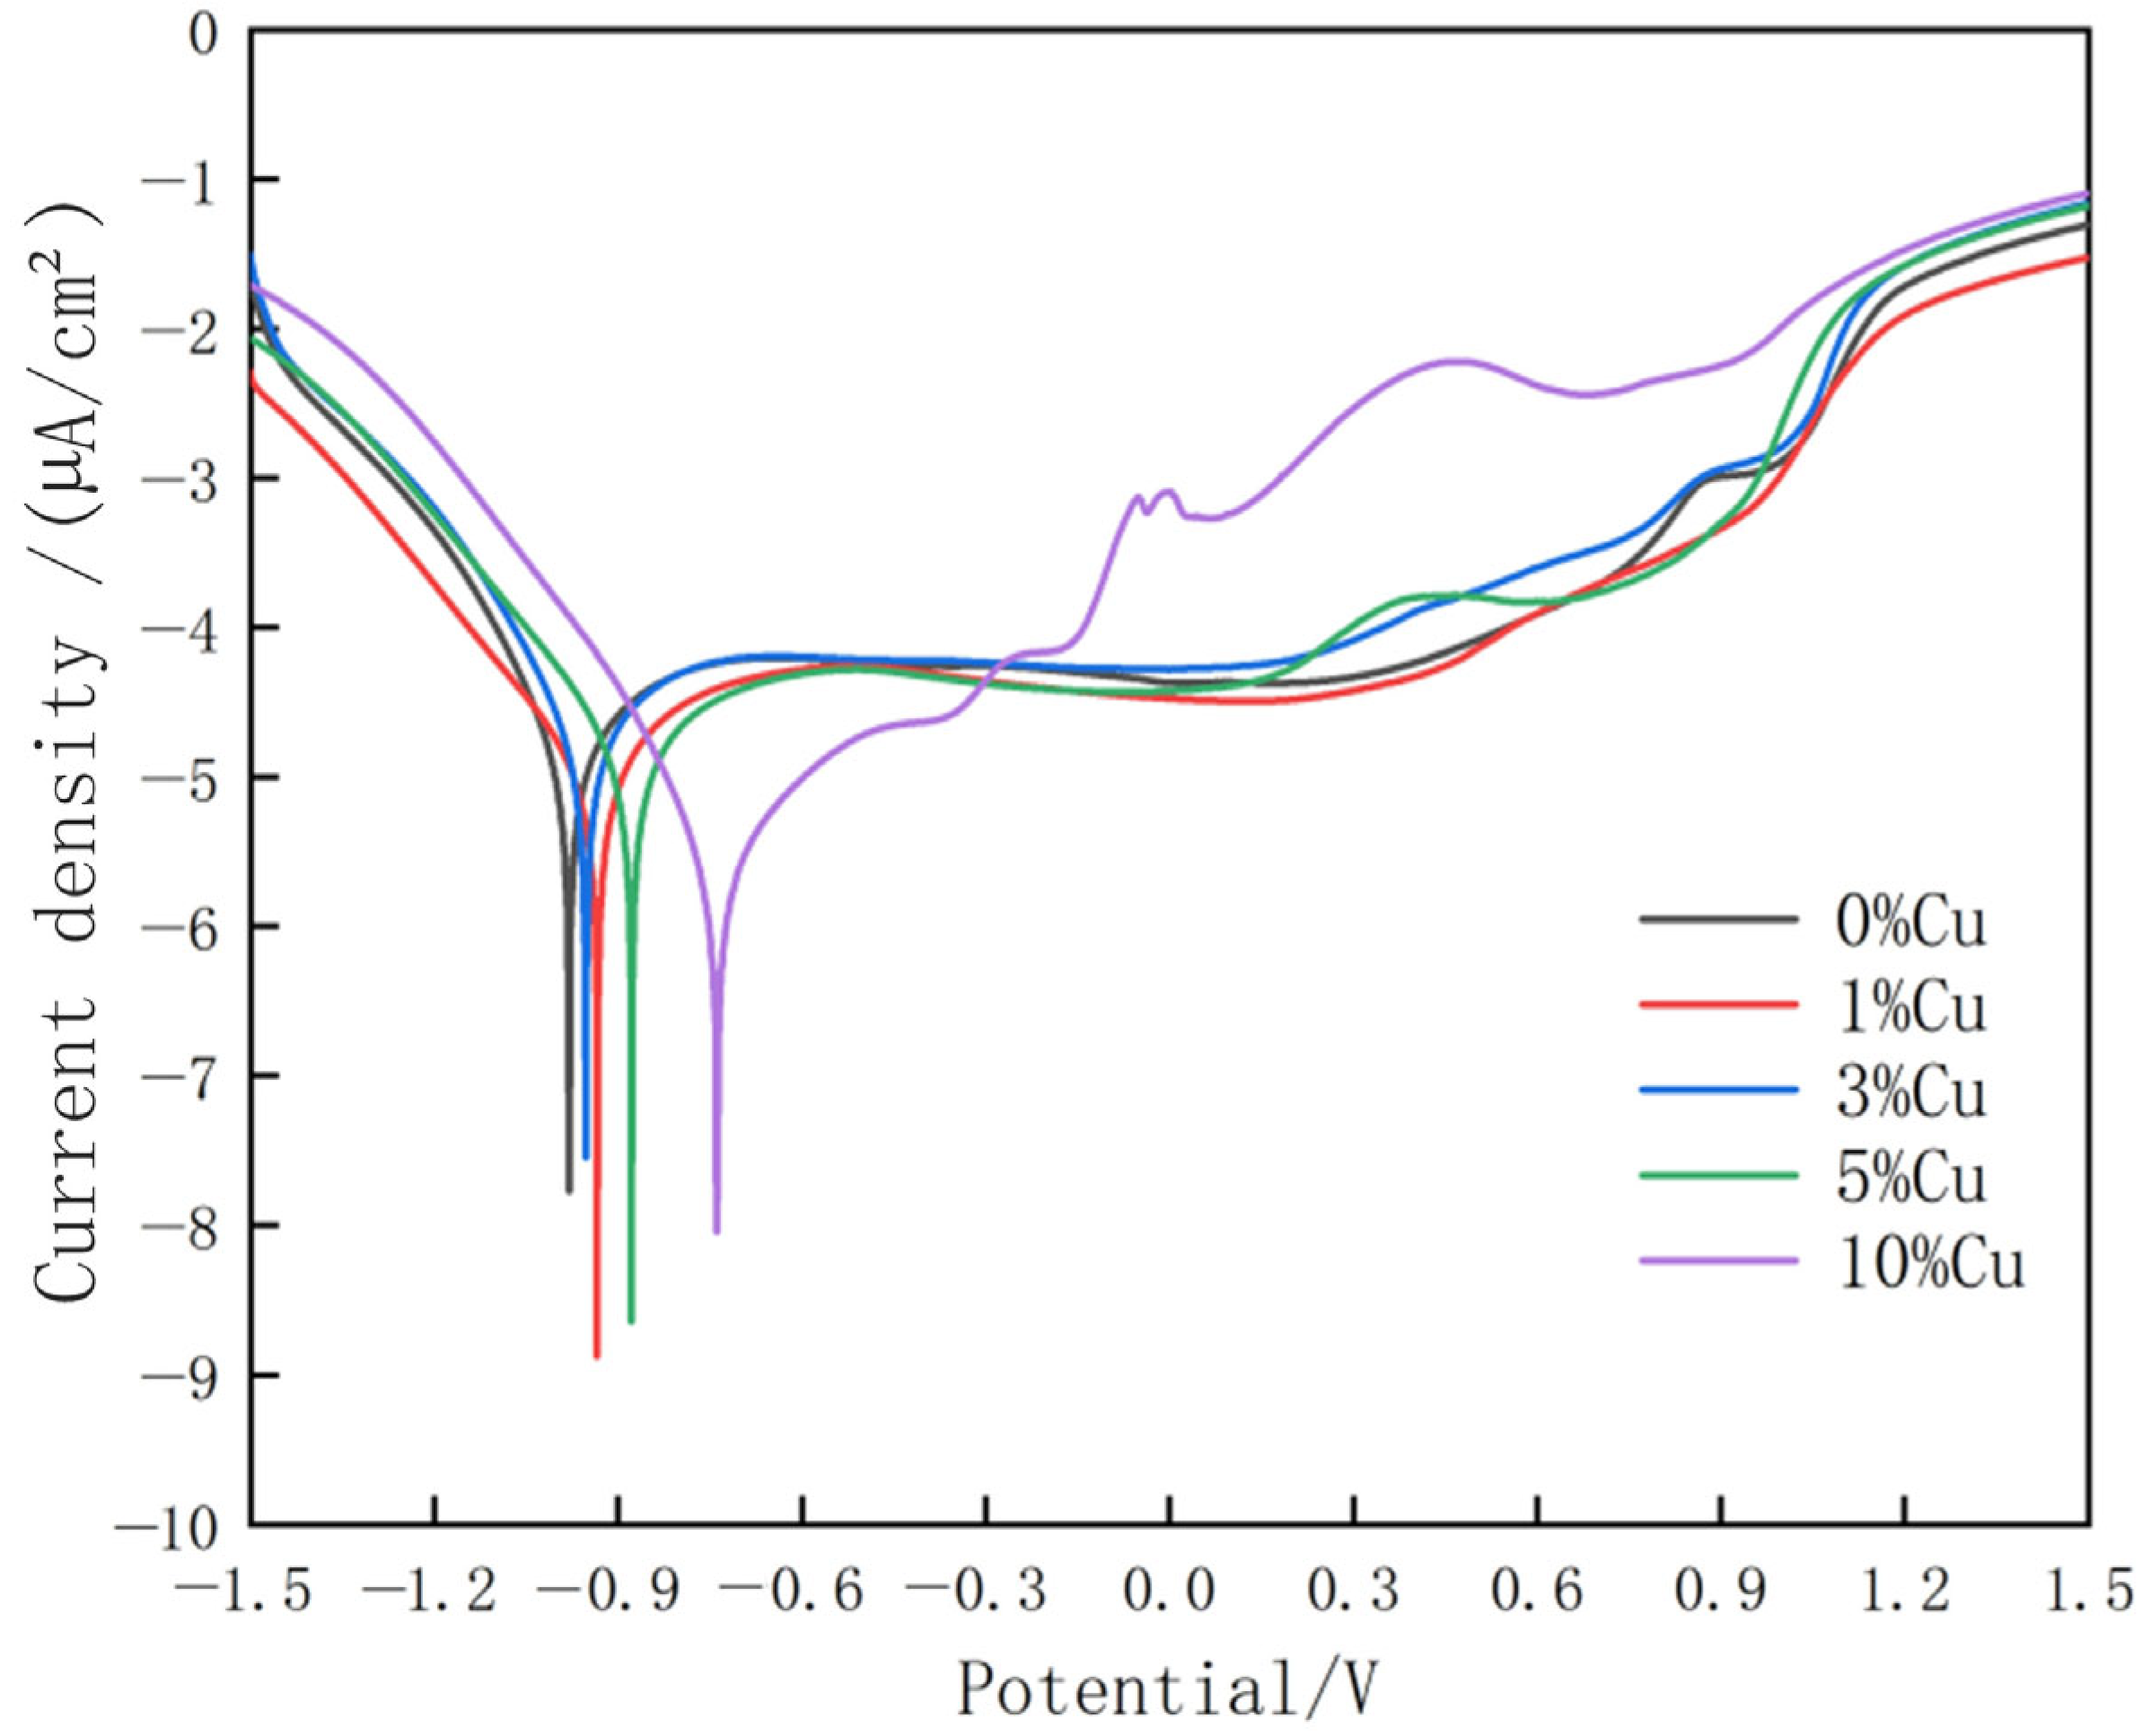
Figure 22.
Potentiodynamic polarization curves of composite coatings with different weight percents of copper.
Figure 22.
Potentiodynamic polarization curves of composite coatings with different weight percents of copper.
Table 1.
Chemical composition of high-purity copper powder.
Table 1.
Chemical composition of high-purity copper powder.
| Materials | Sn | Cr | S | Fe | Pb | As | Sb | Bi | Cu |
|---|
| wt % | <0.001 | <0.001 | 0.002 | <0.001 | <0.001 | <0.001 | <0.001 | <0.001 | Balance |
Table 2.
Chemical composition of Stellite6 alloy powder.
Table 2.
Chemical composition of Stellite6 alloy powder.
| Materials | C | Ni | W | Si | Mo | Fe | Cr | Co |
|---|
| wt % | 1.40 | 3.00 | 8.25 | 1.45 | 1.00 | 3.00 | 29.50 | Balance |
Table 3.
Element content at the top of the cladding layer prepared at different powers.
Table 3.
Element content at the top of the cladding layer prepared at different powers.
| Laser Power (W) | Co | Cr | Cu | Fe | Ni | W |
|---|
| 800 | 51.5 | 28.1 | 4.1 | 4.9 | 2.6 | 4.2 |
| 1000 | 46.1 | 25.3 | 3.7 | 8.3 | 3.1 | 4.0 |
| 1200 | 38.4 | 24.1 | 3.5 | 16.9 | 4.1 | 3.4 |
Table 4.
Element content at the bottom of the cladding layer prepared at different powers.
Table 4.
Element content at the bottom of the cladding layer prepared at different powers.
| Laser Power (W) | Co | Cr | Cu | Fe | Ni | W |
|---|
| 800 | 49.6 | 26.1 | 3.8 | 3.9 | 2.6 | 4.2 |
| 1000 | 48.7 | 27.4 | 2.4 | 7.5 | 3.1 | 3.8 |
| 1200 | 39.4 | 25.2 | 3.8 | 18.3 | 4.3 | 3.3 |
Table 5.
Element content at the top of the cladding layers prepared at the different scanning speed.
Table 5.
Element content at the top of the cladding layers prepared at the different scanning speed.
| Scanning Speed (mm/min) | Co | Cr | Cu | Fe | Ni | W |
|---|
| 600 | 29.4 | 23.0 | 2.5 | 27.6 | 5.3 | 2.5 |
| 800 | 44.6 | 25.4 | 2.3 | 11.0 | 3.5 | 3.8 |
| 1000 | 38.4 | 24.1 | 3.5 | 16.9 | 4.1 | 3.4 |
Table 6.
Self-corrosion potential and current density of composite coatings prepared at different scanning speeds.
Table 6.
Self-corrosion potential and current density of composite coatings prepared at different scanning speeds.
| Scanning Speed | 600 mm/min | 800 mm/min | 1000 mm/min |
|---|
| self-corrosion potential (mV) | −924 | −856 | −853 |
| current density (µA/cm2) | −6.89 | −7.55 | −7.15 |
Table 7.
Self-corrosion potential and current density of Stellite6/Cu composite coatings with different wt% of copper.
Table 7.
Self-corrosion potential and current density of Stellite6/Cu composite coatings with different wt% of copper.
| wt % of Cu | 0 | 1 | 3 | 5 | 10 |
|---|
| self-corrosion potential (mV) | −980 | −934 | −953 | −878 | −739 |
| current density (µA/cm2) | −7.755 | −8.878 | −7.547 | −8.648 | −8.045 |


