


Design and Fabrication of Multi-Frequency and Low-Quality-Factor Capacitive Micromachined Ultrasonic Transducers †


Abstract
1. Introduction
2. Materials and Methods
2.1. Modeling
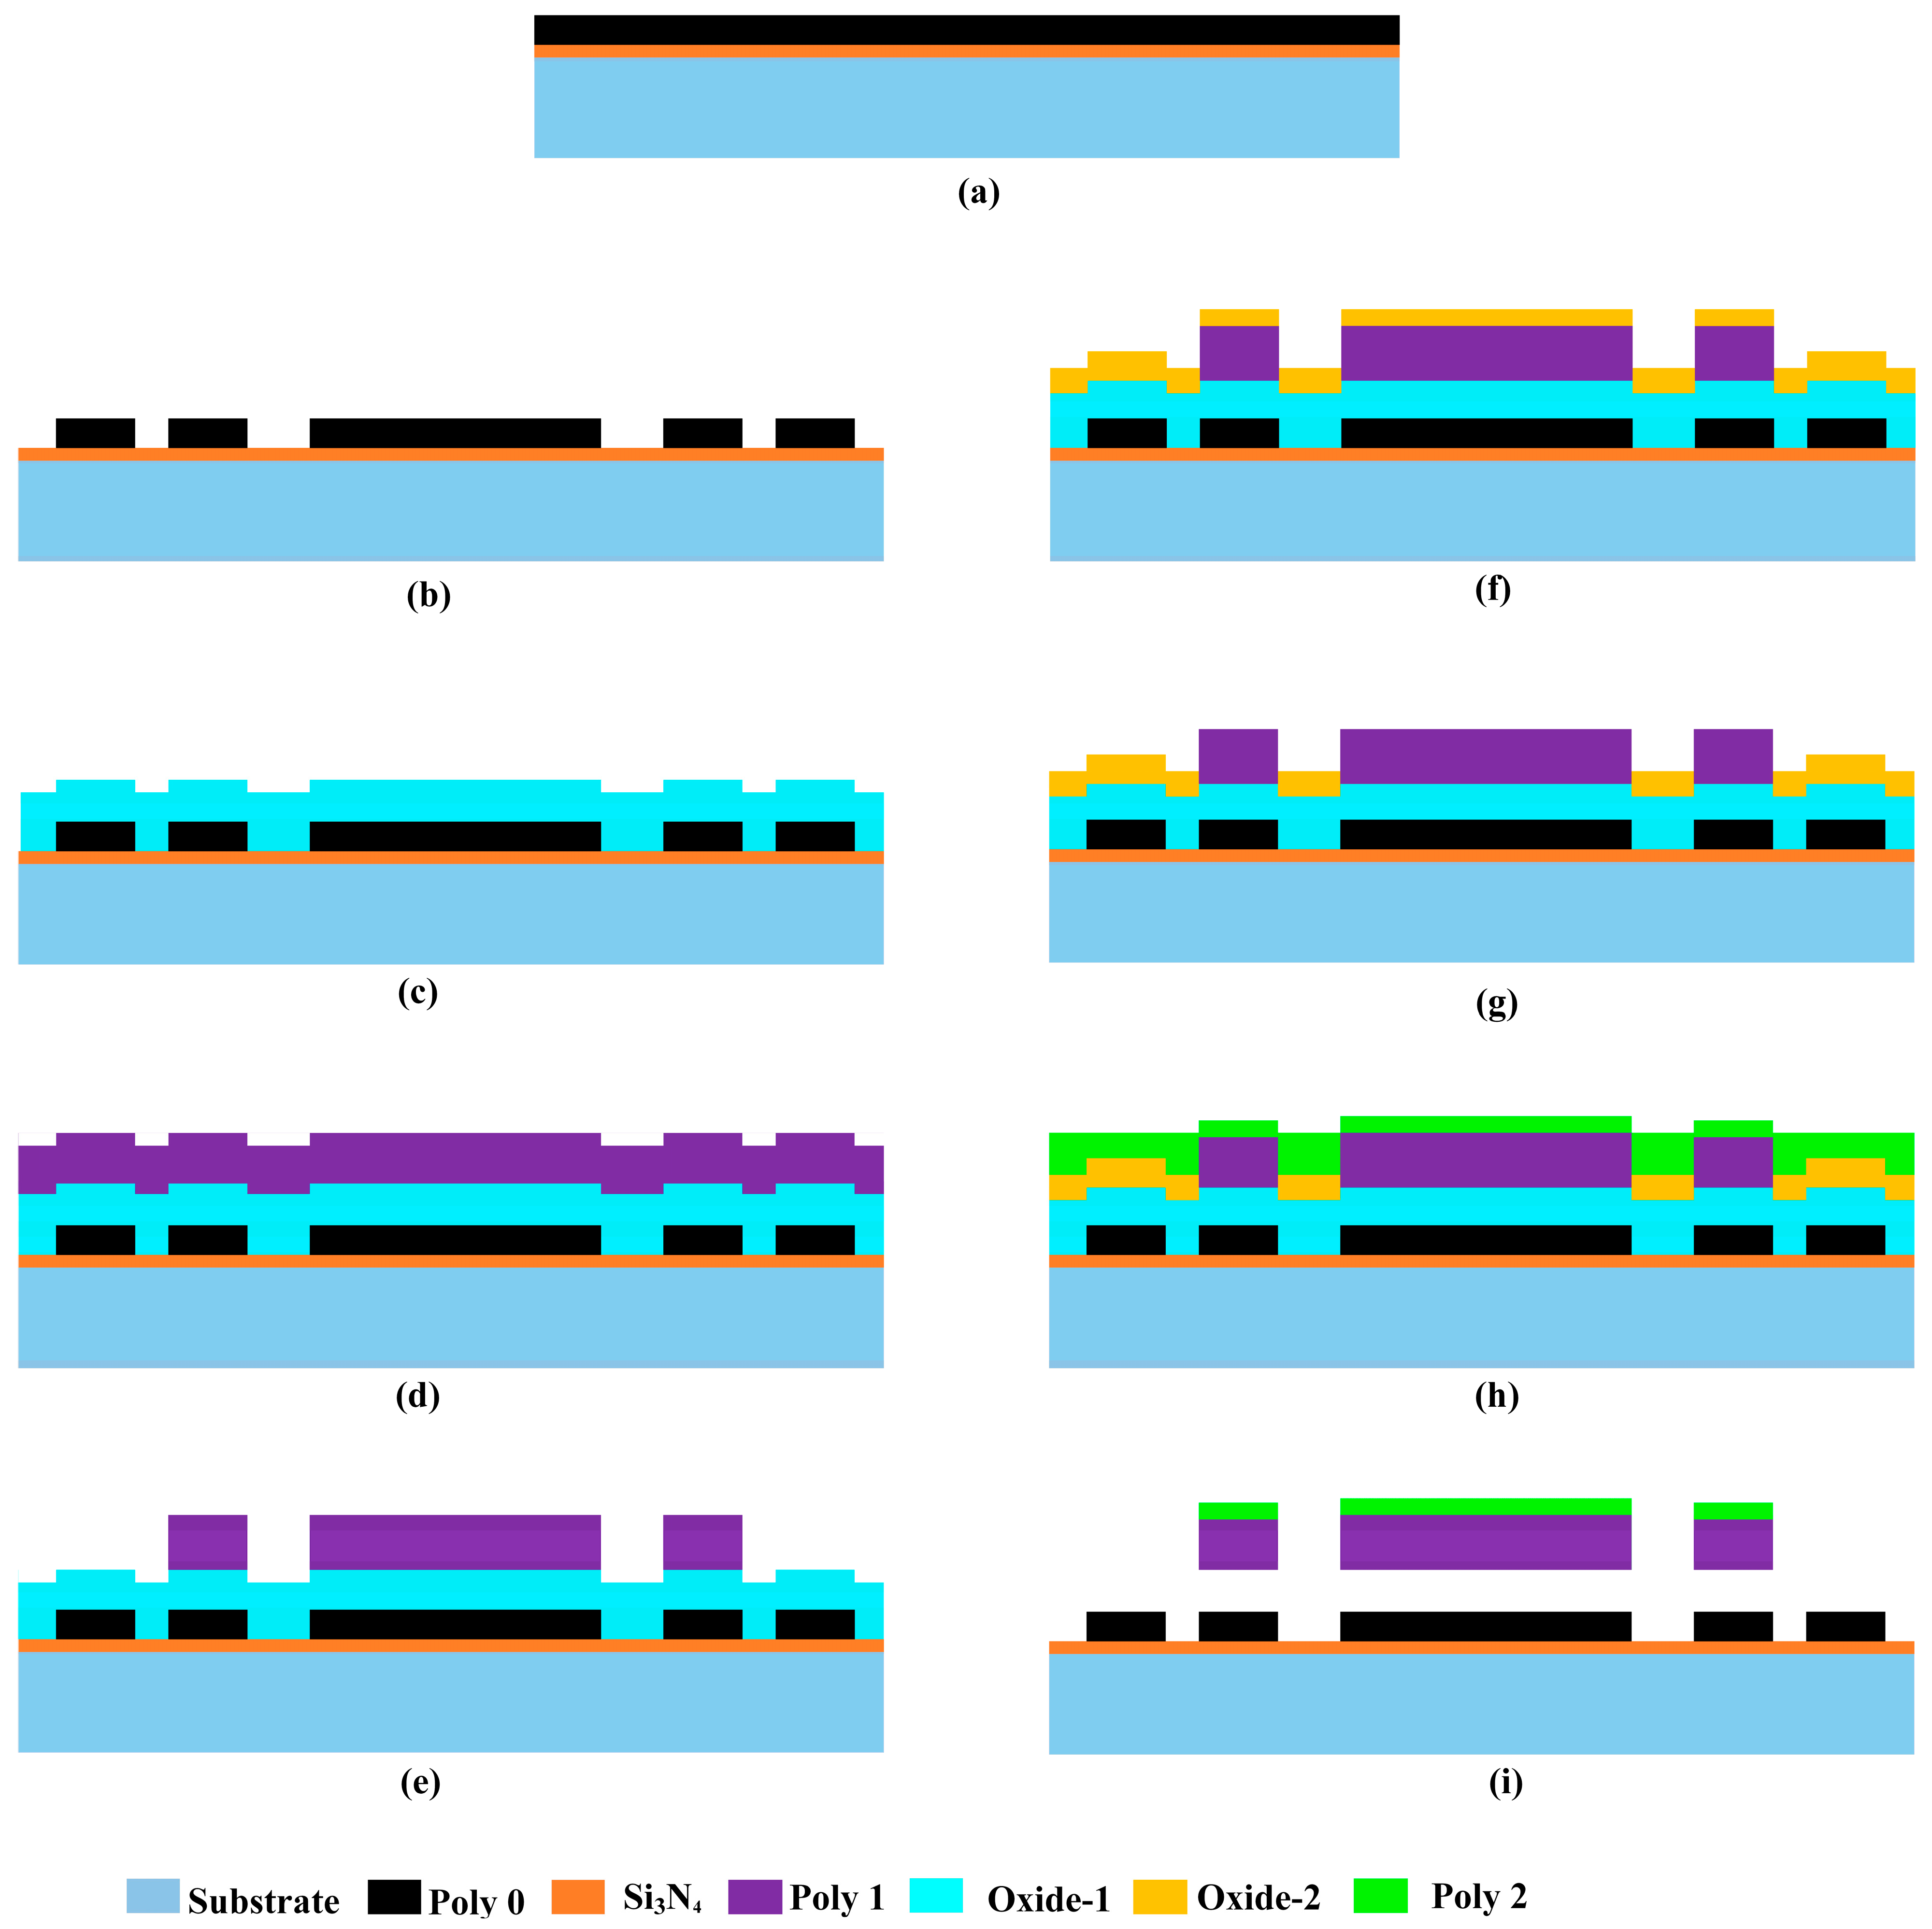
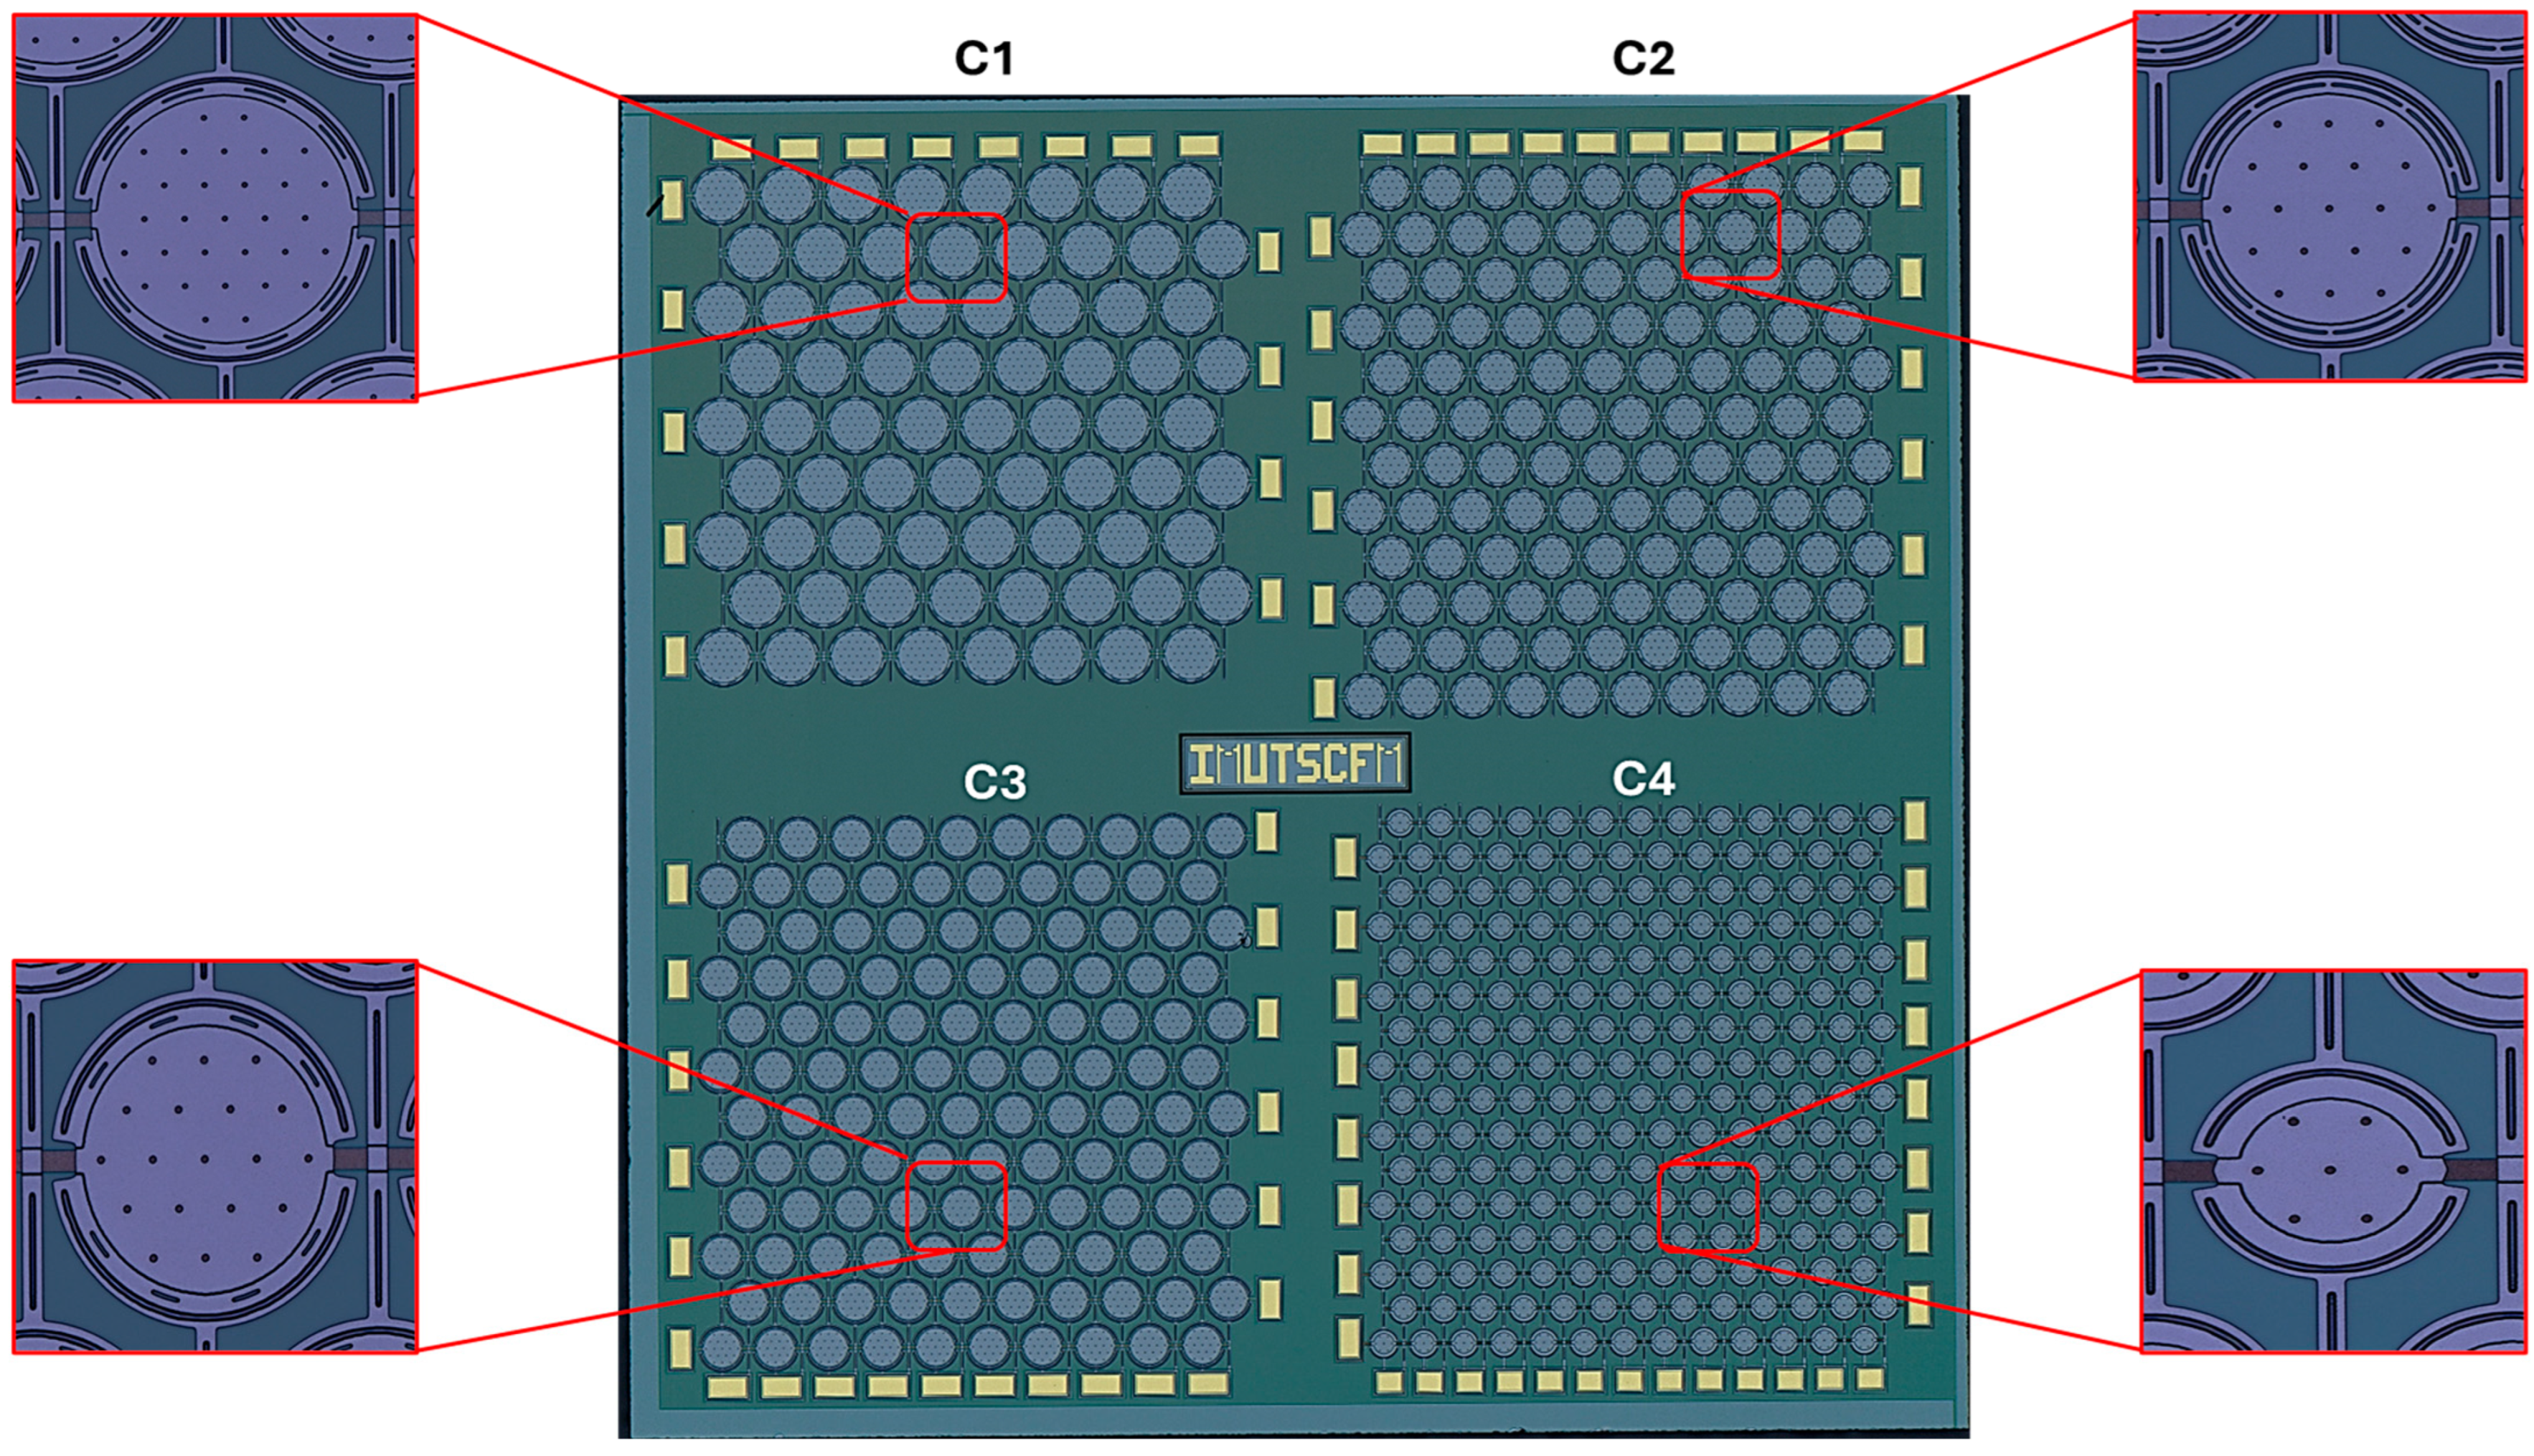
2.2. Fabrication of CMUT Array
3. Results
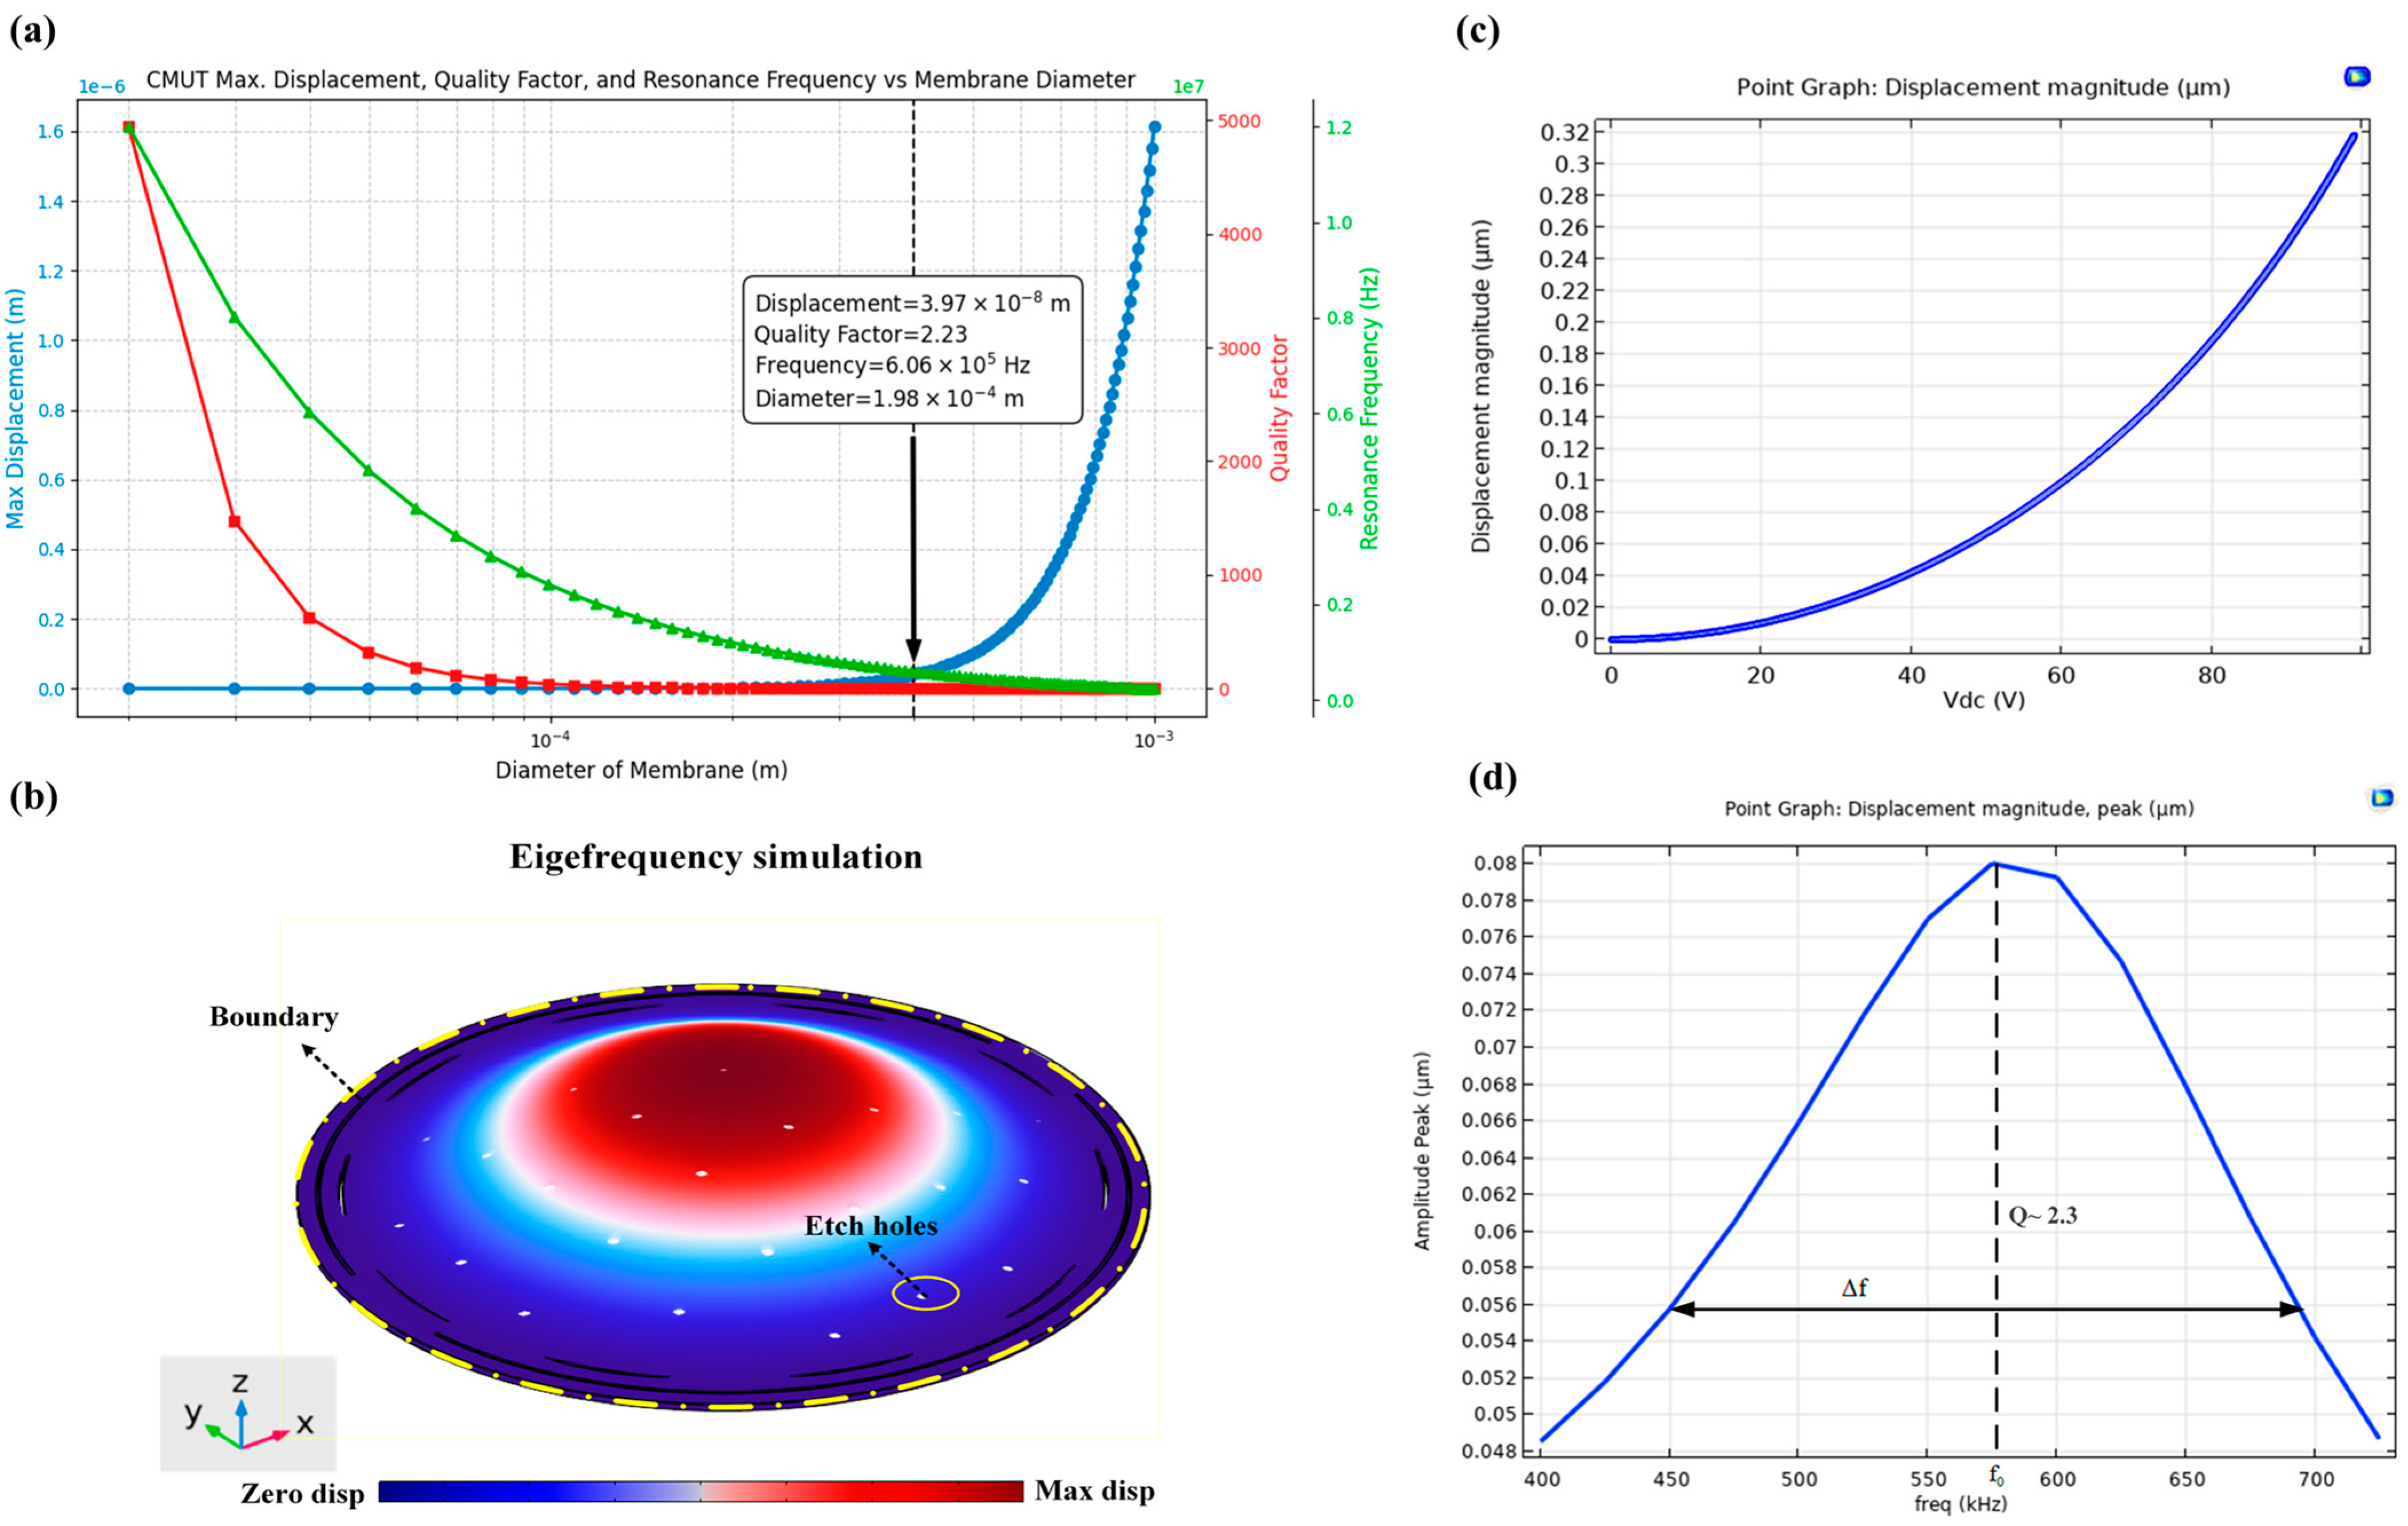
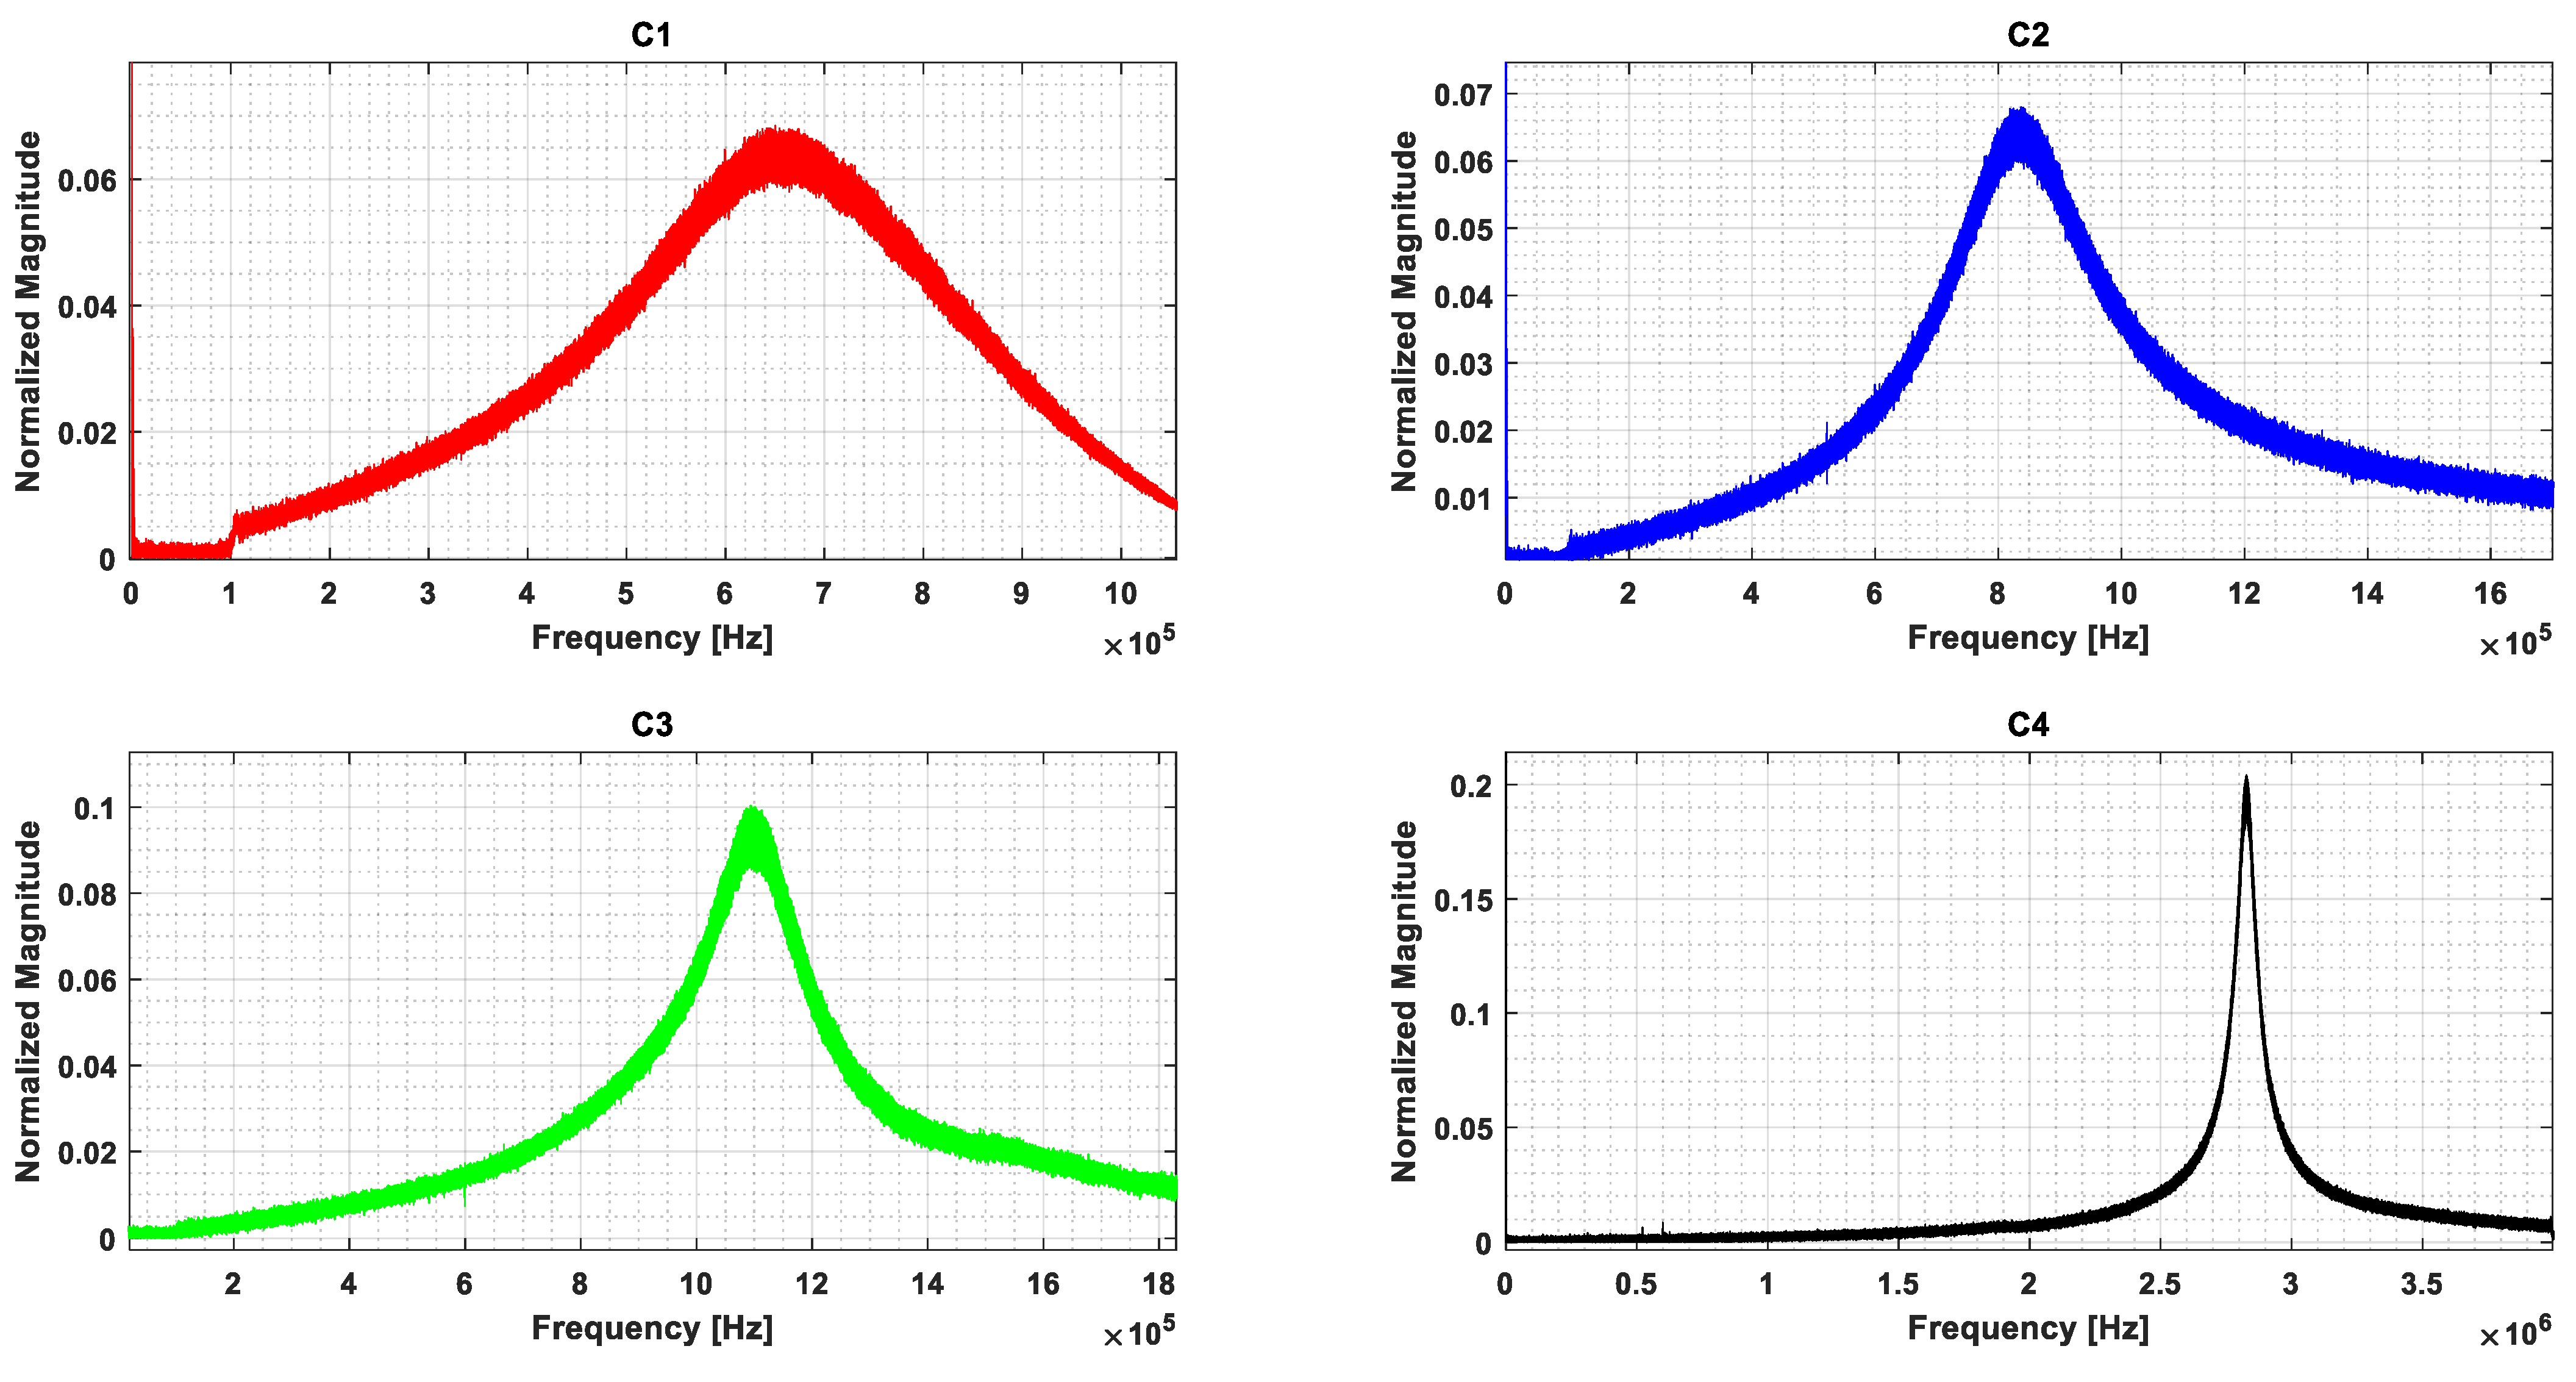
3.1. COMSOL Simulation
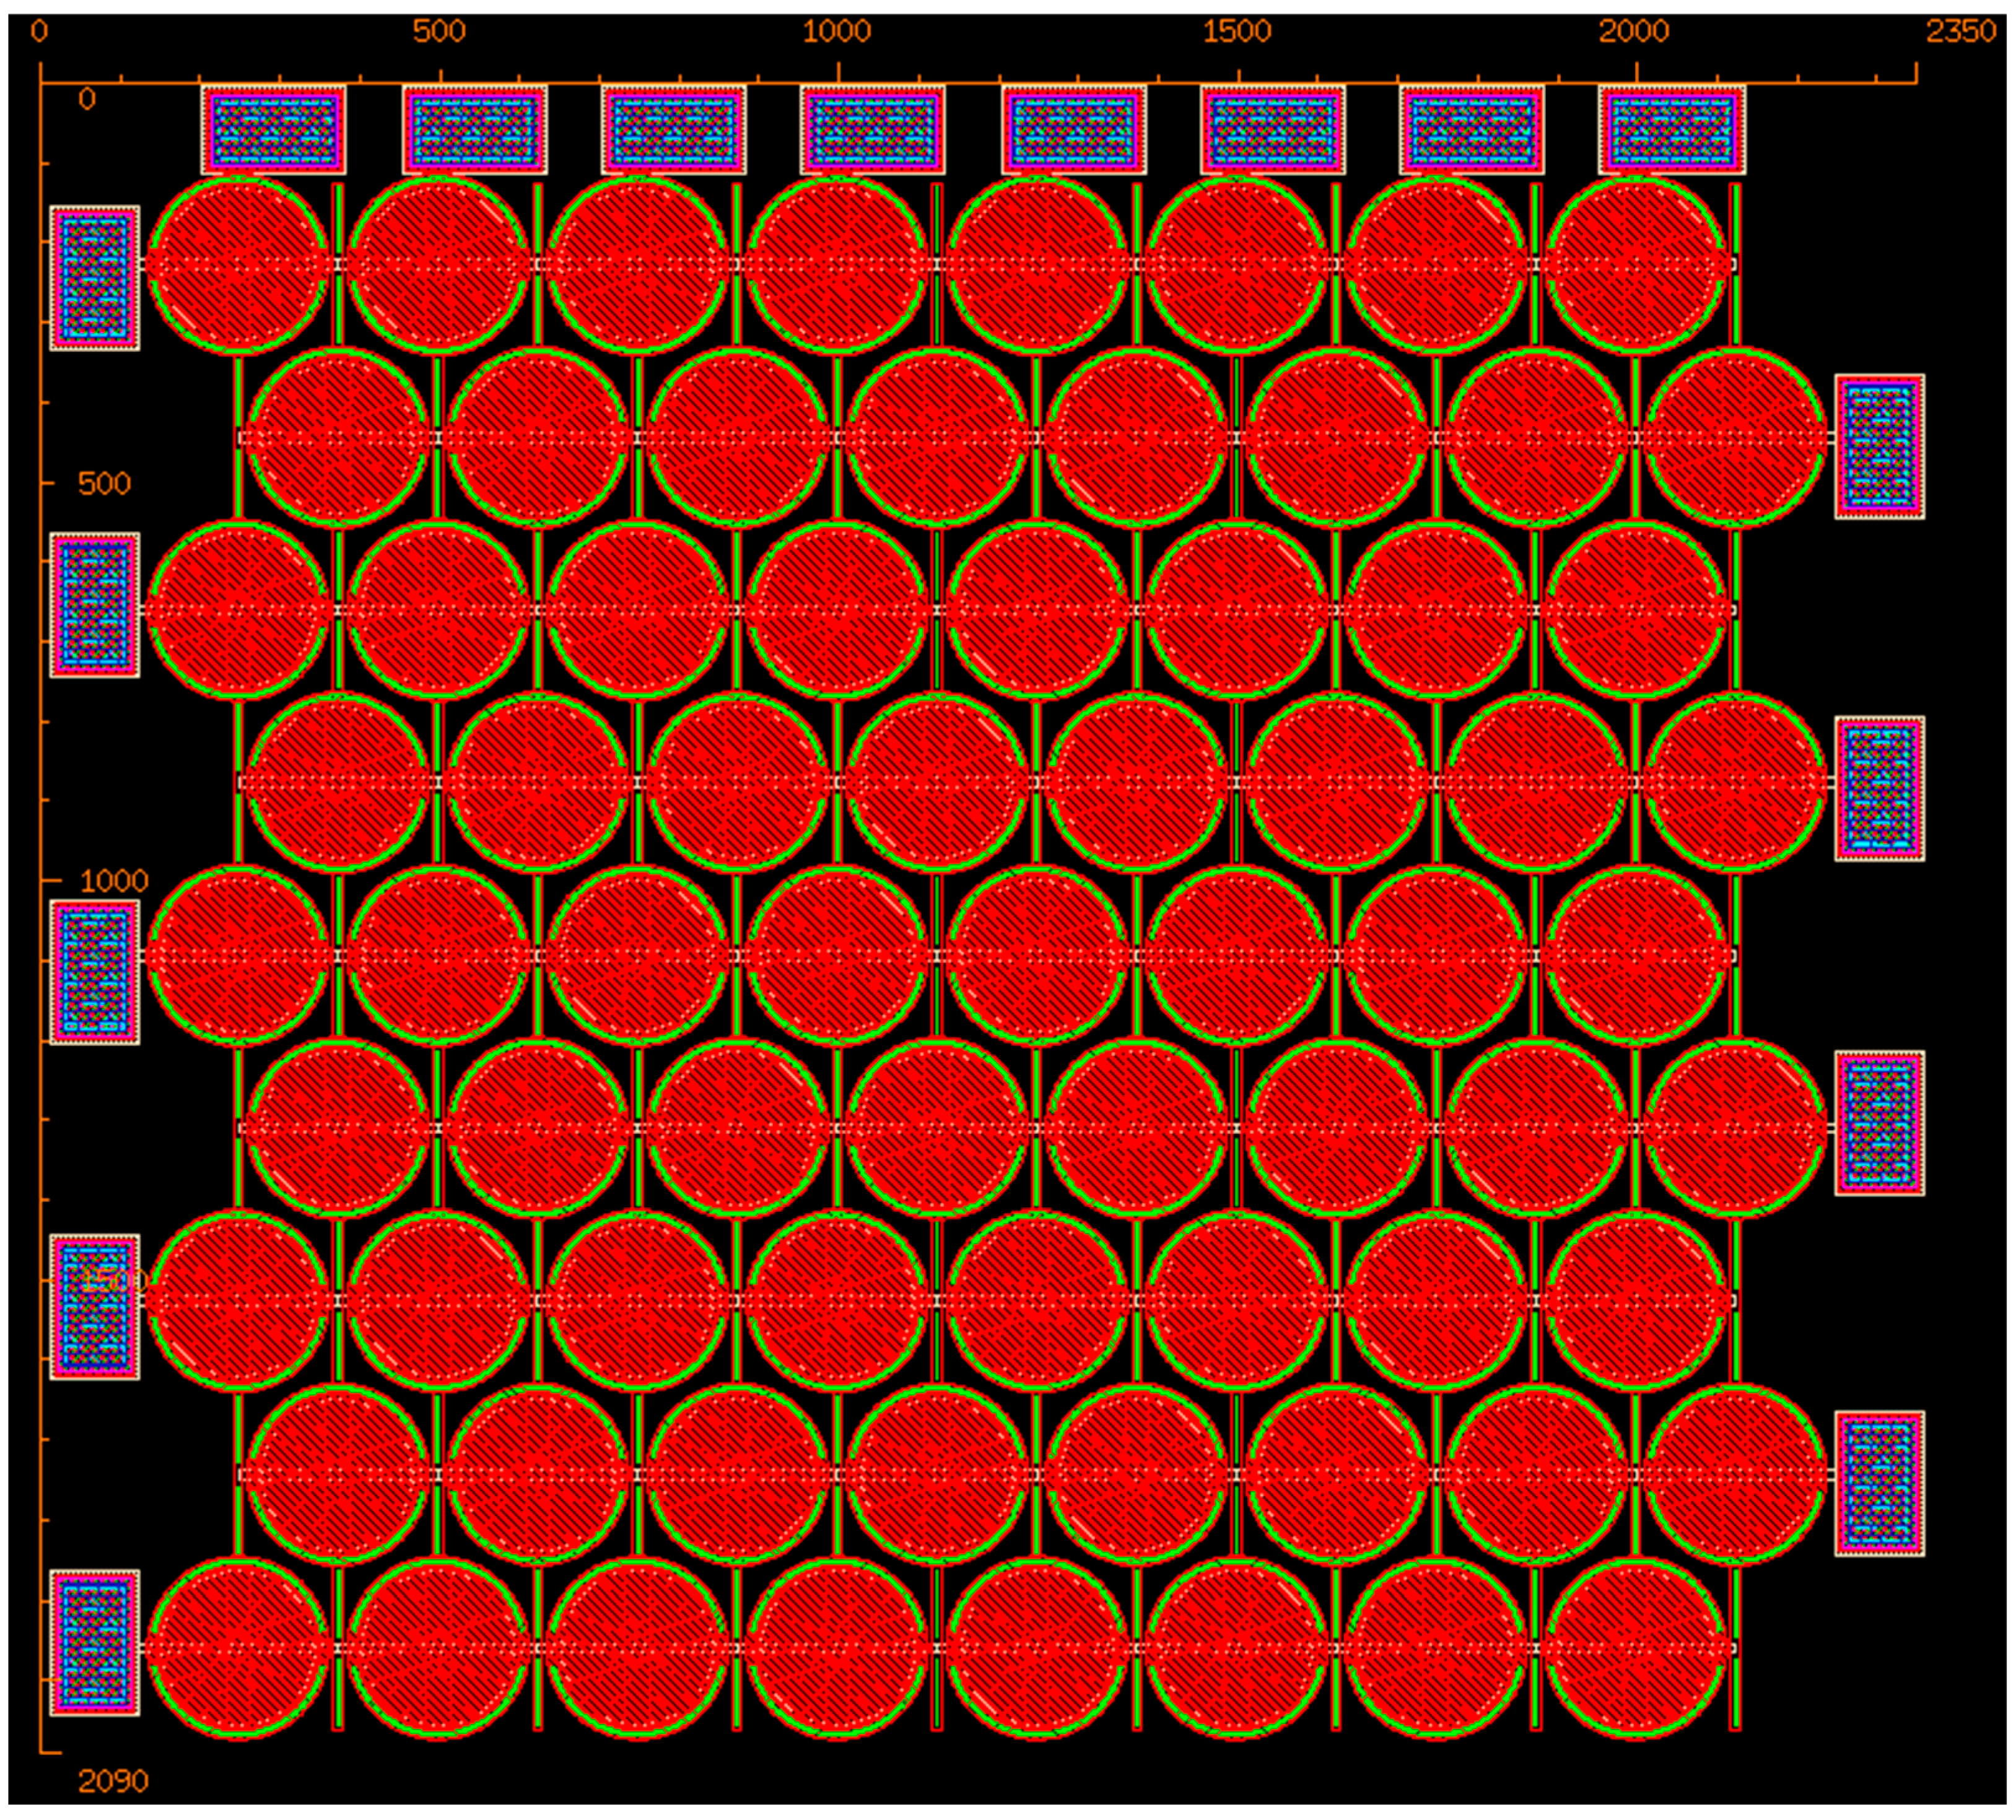
3.2. Fabricated Device
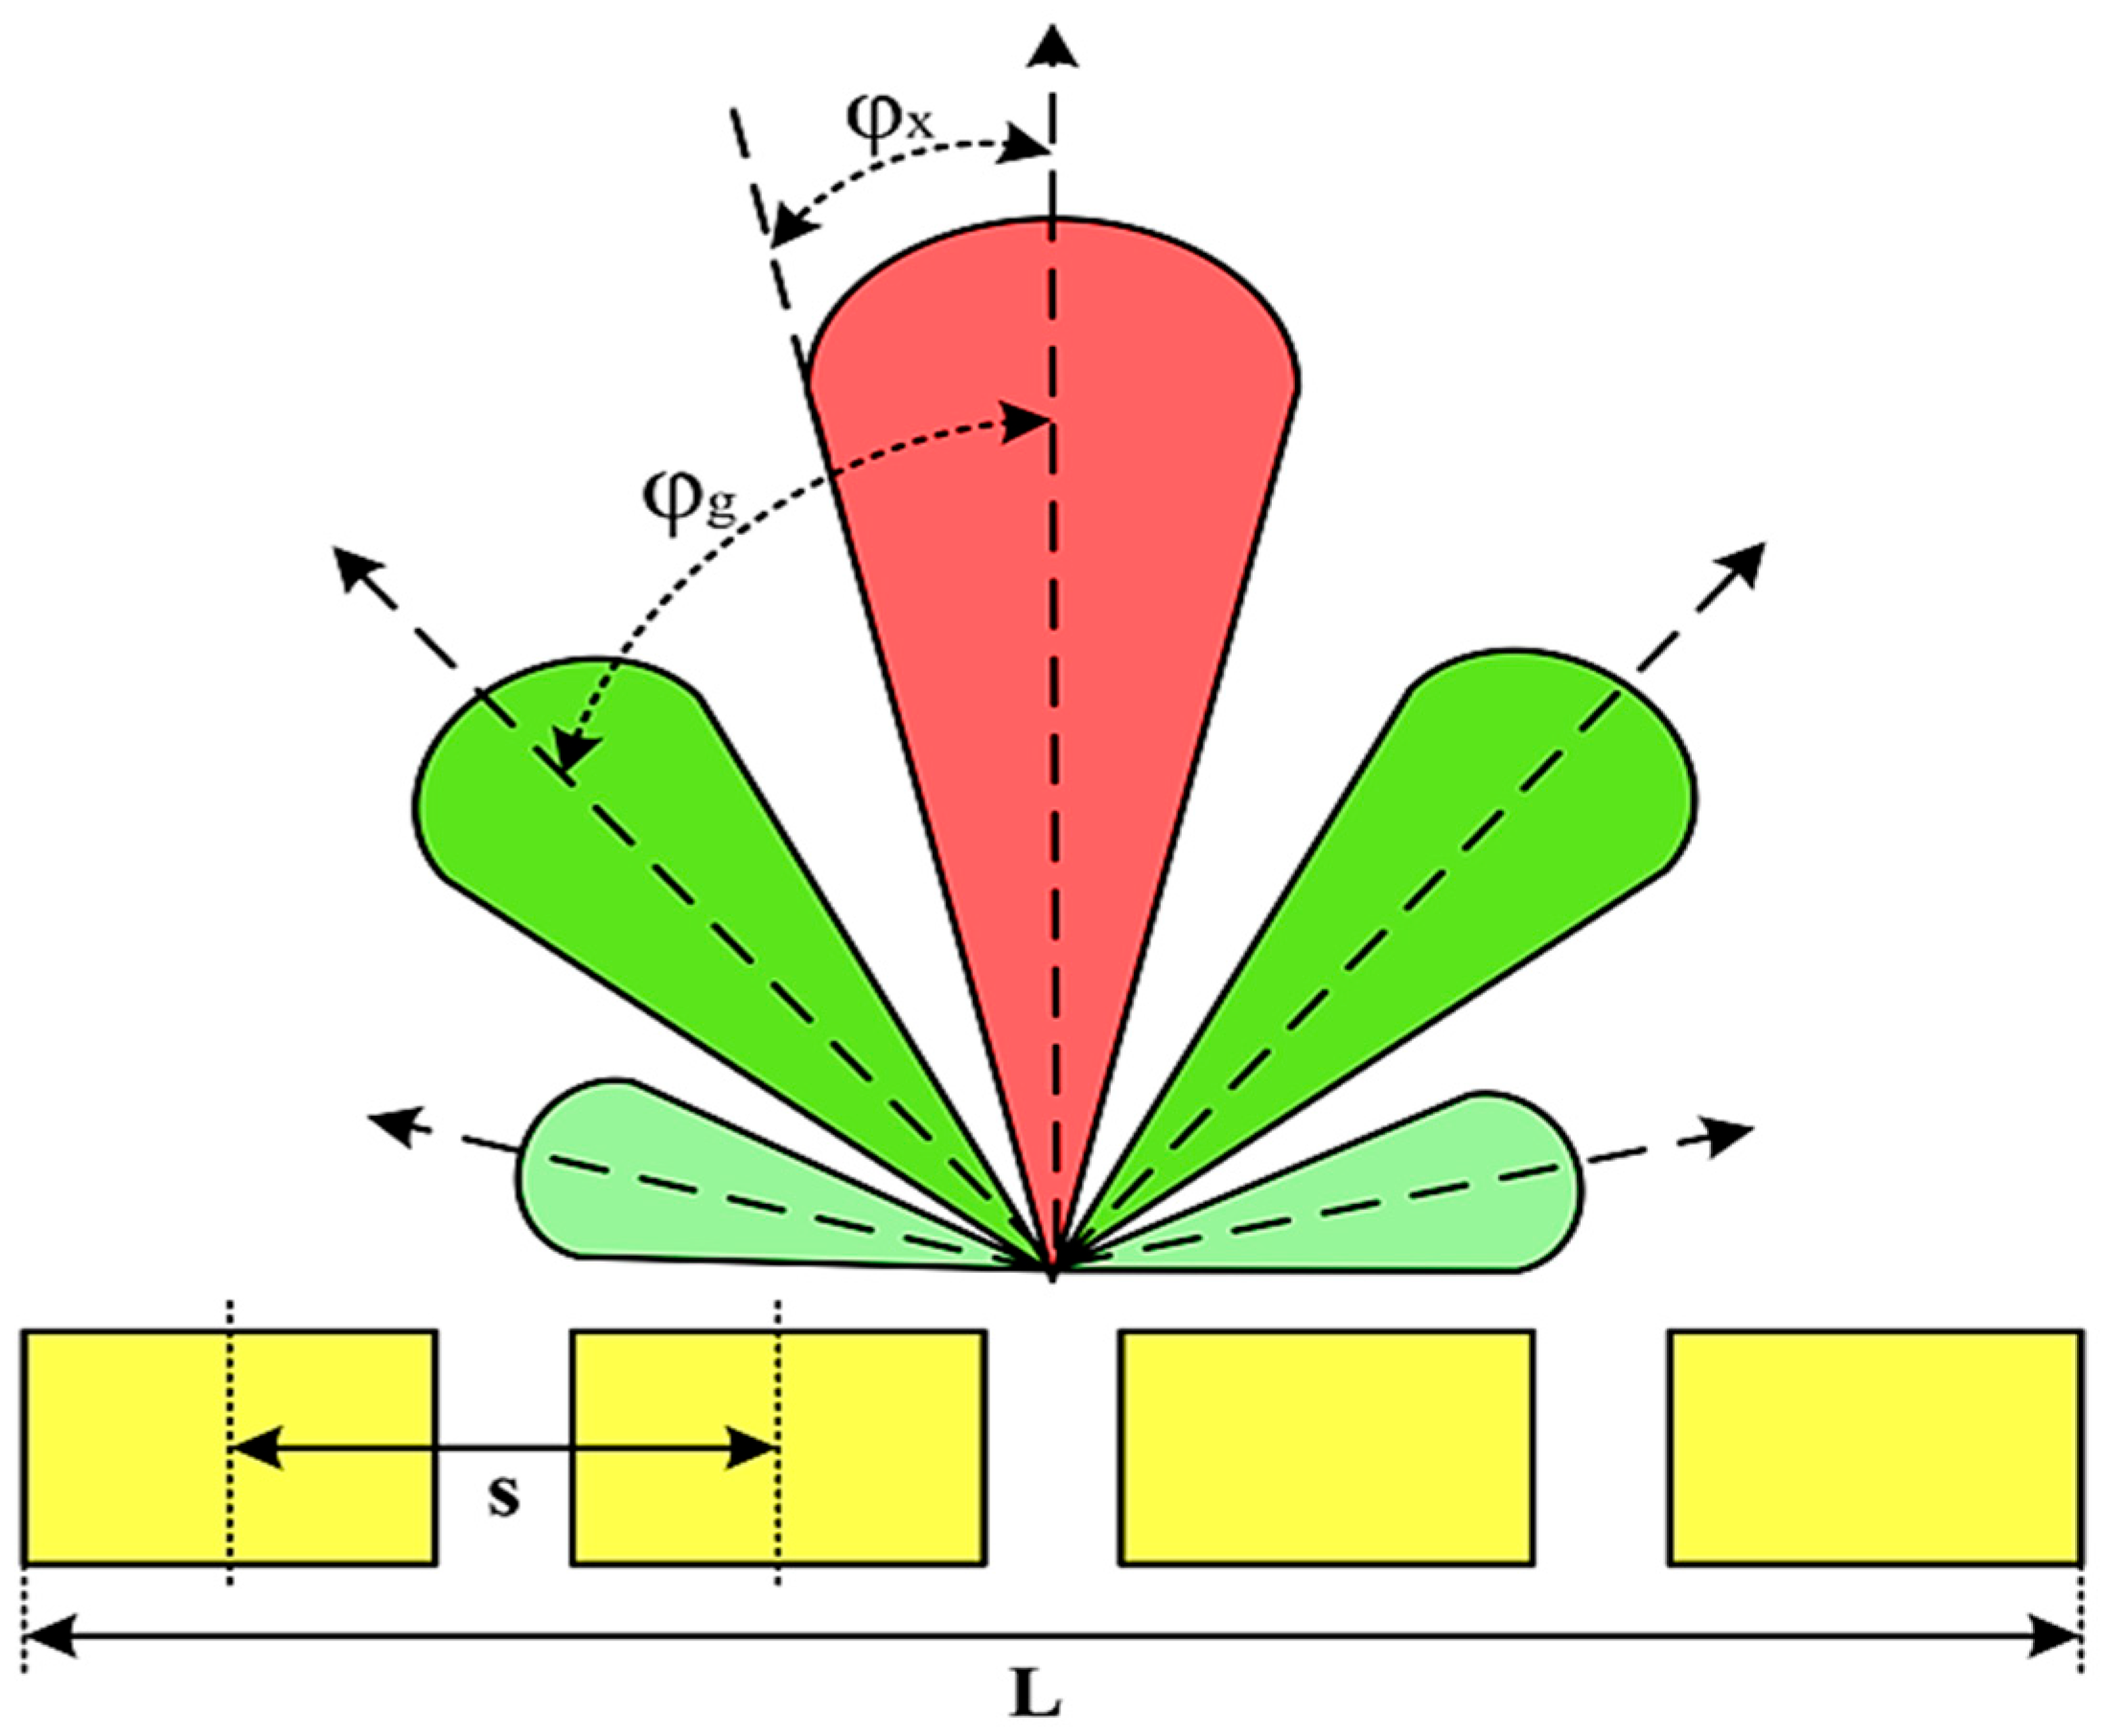
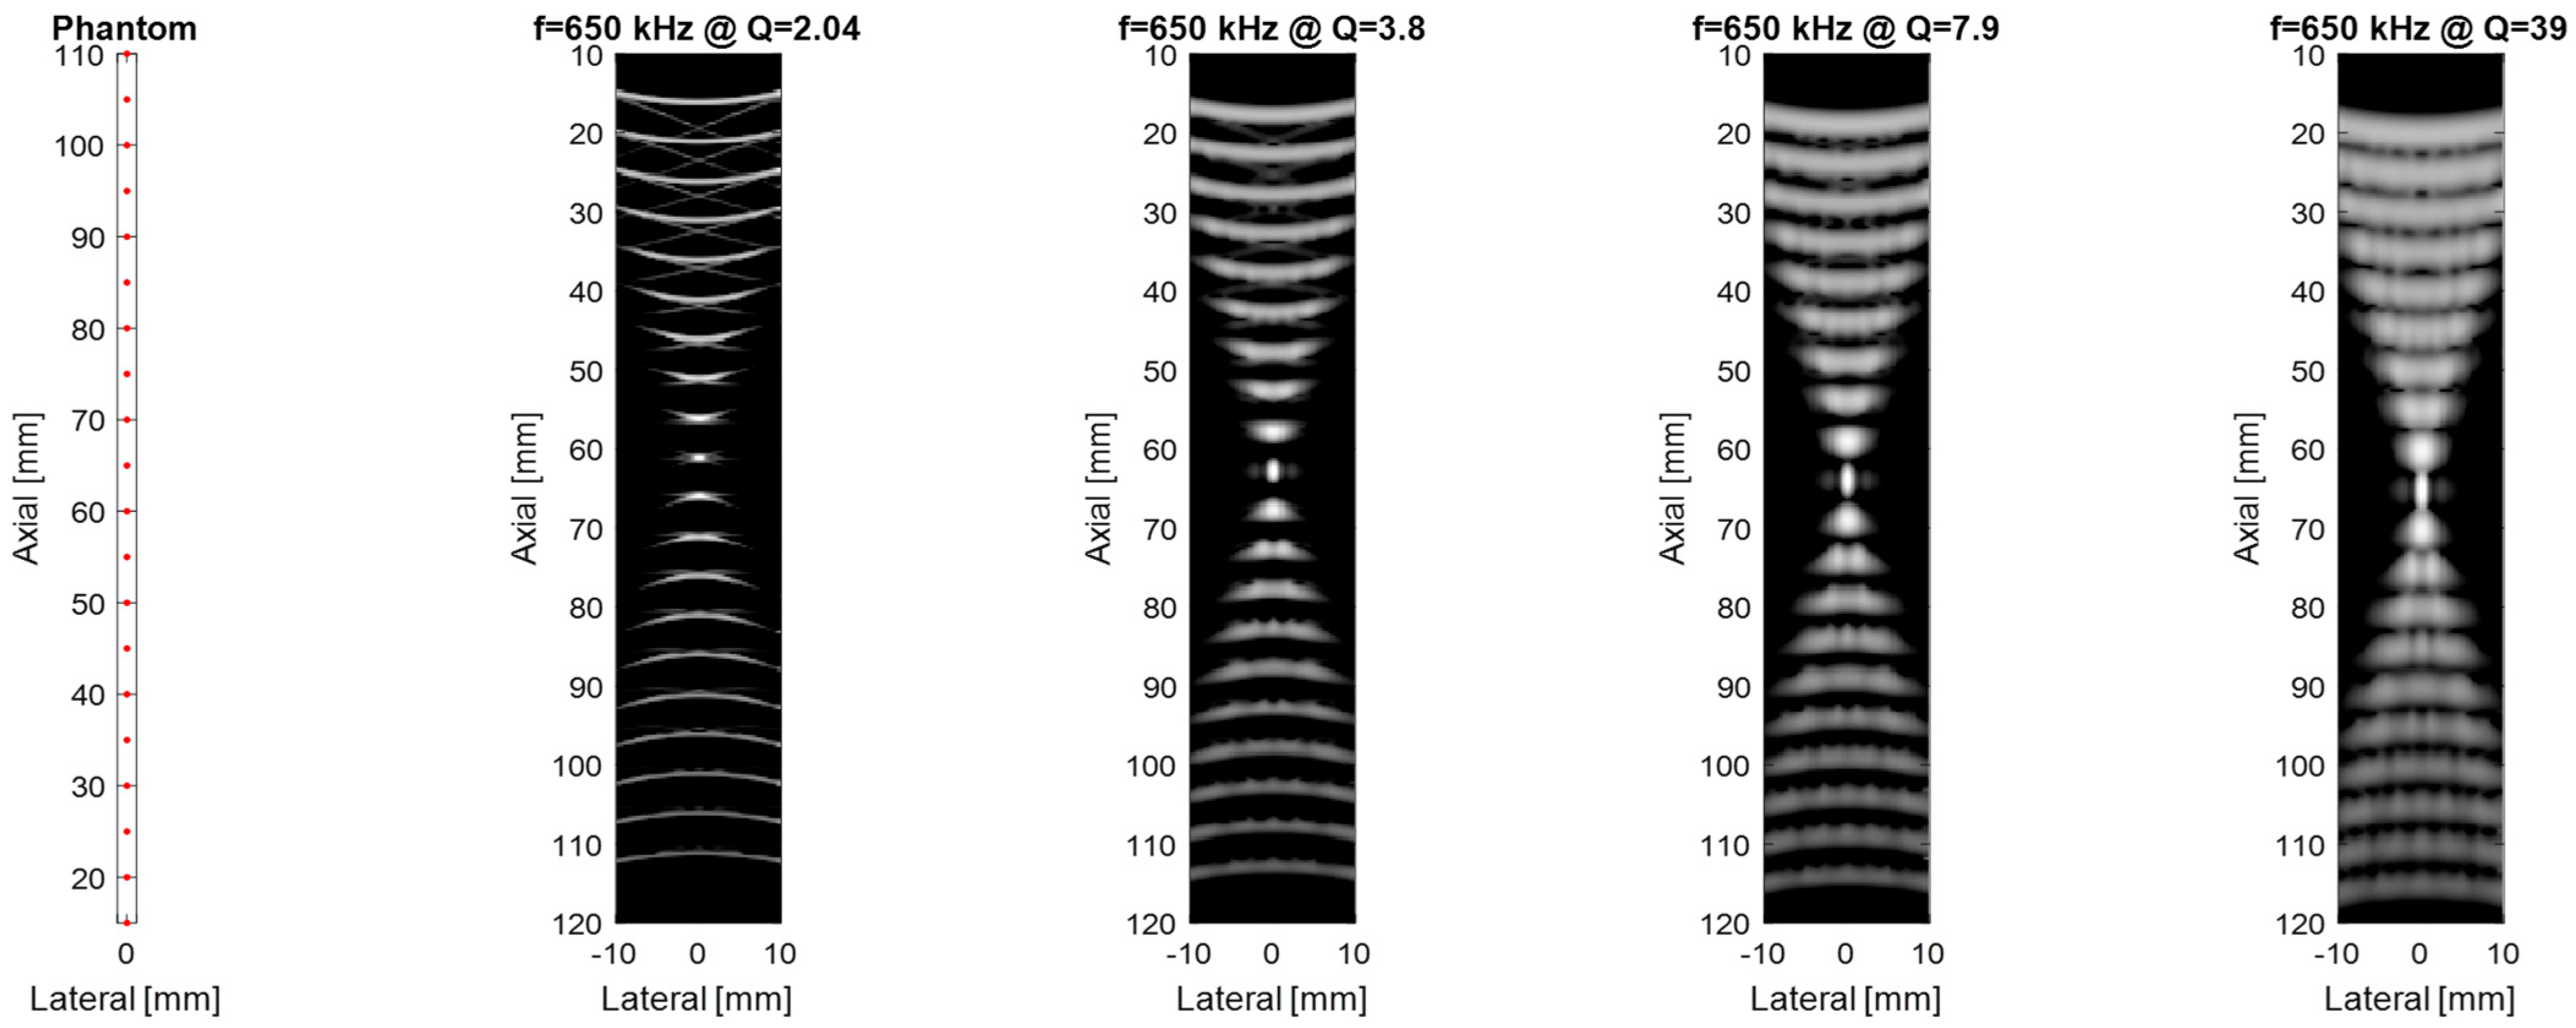
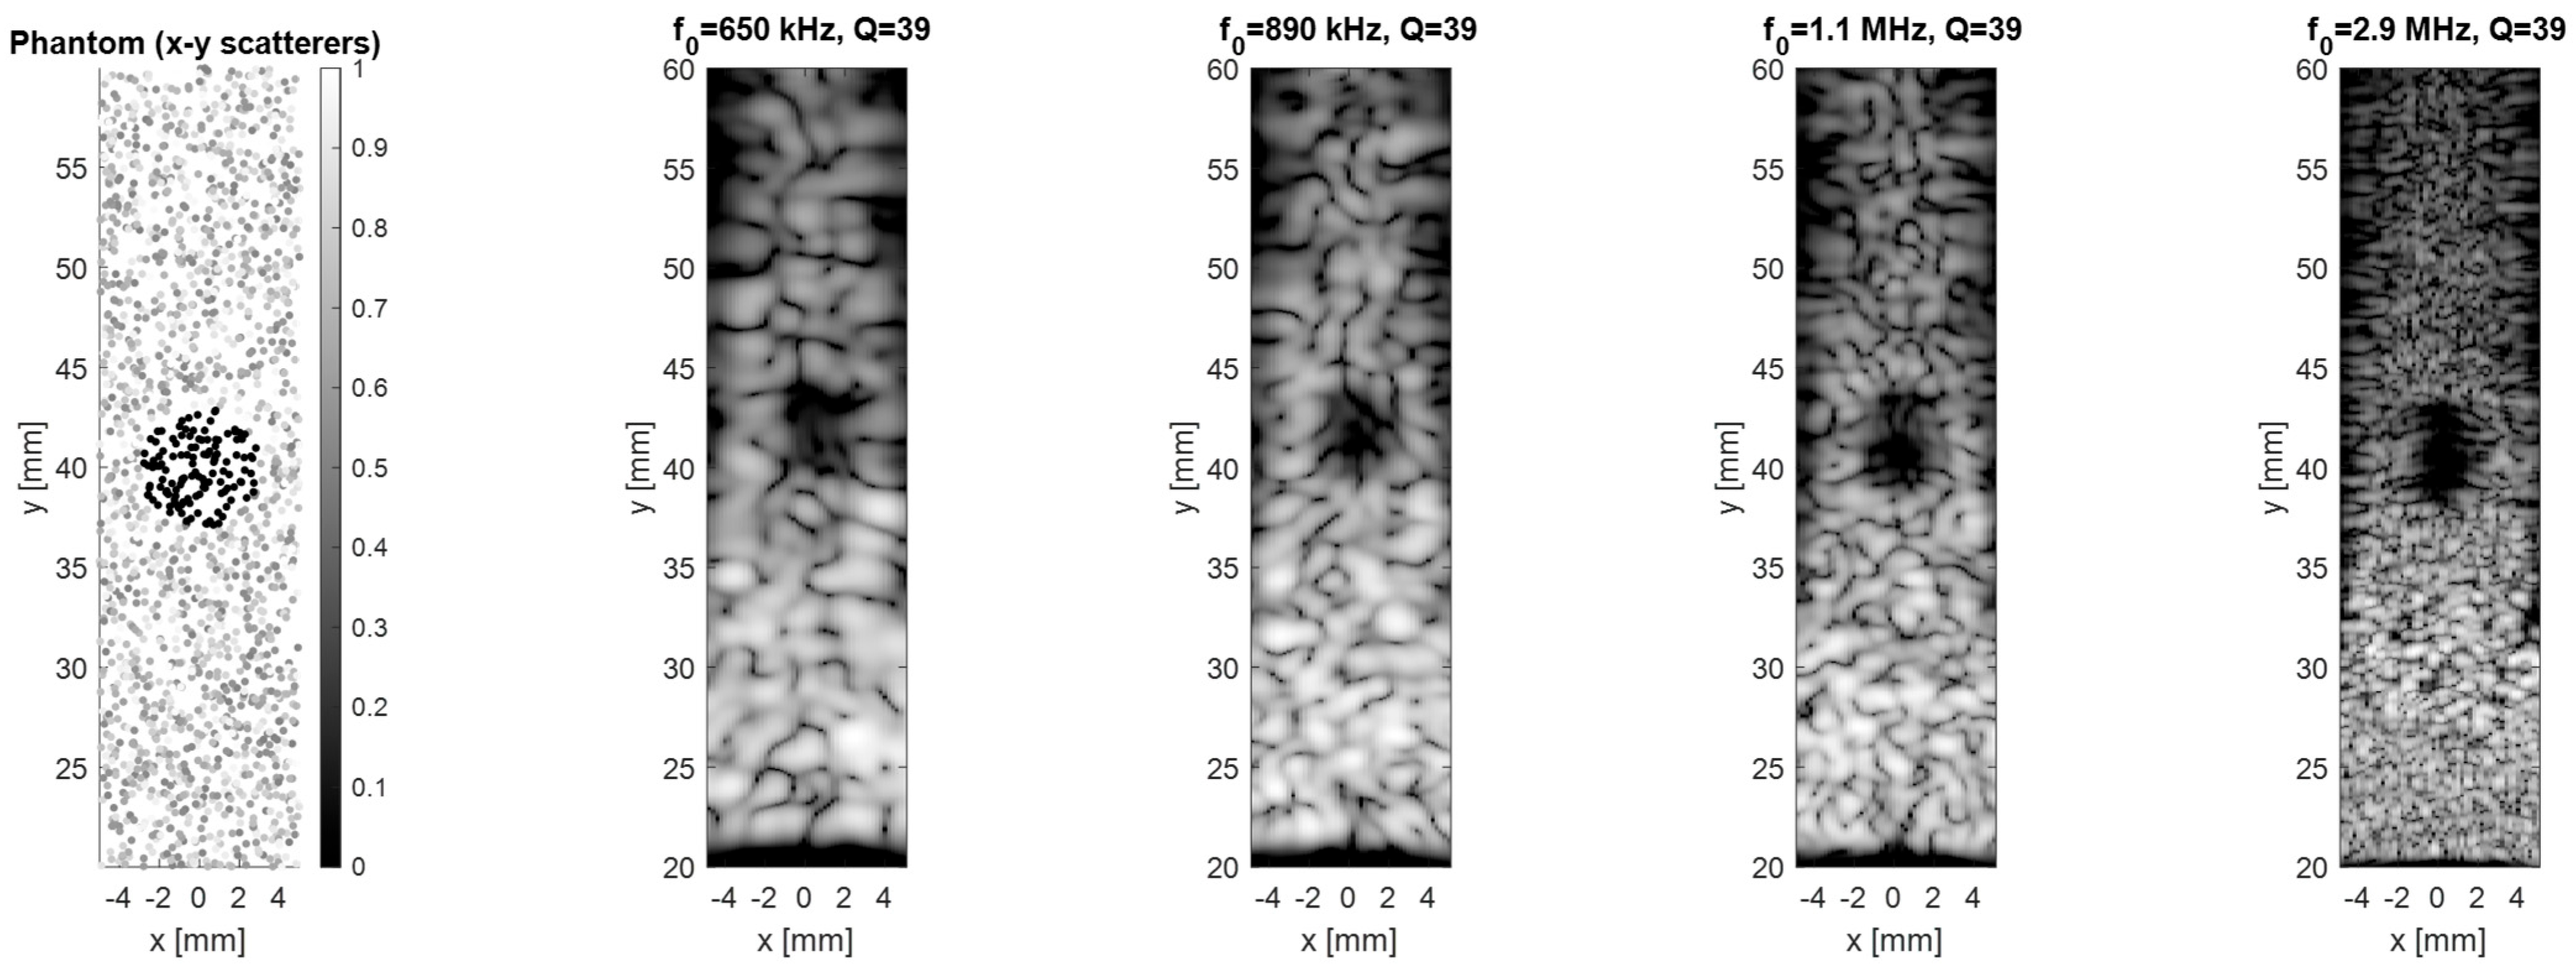
3.3. Imaging Simulation
3.4. Mode Shape
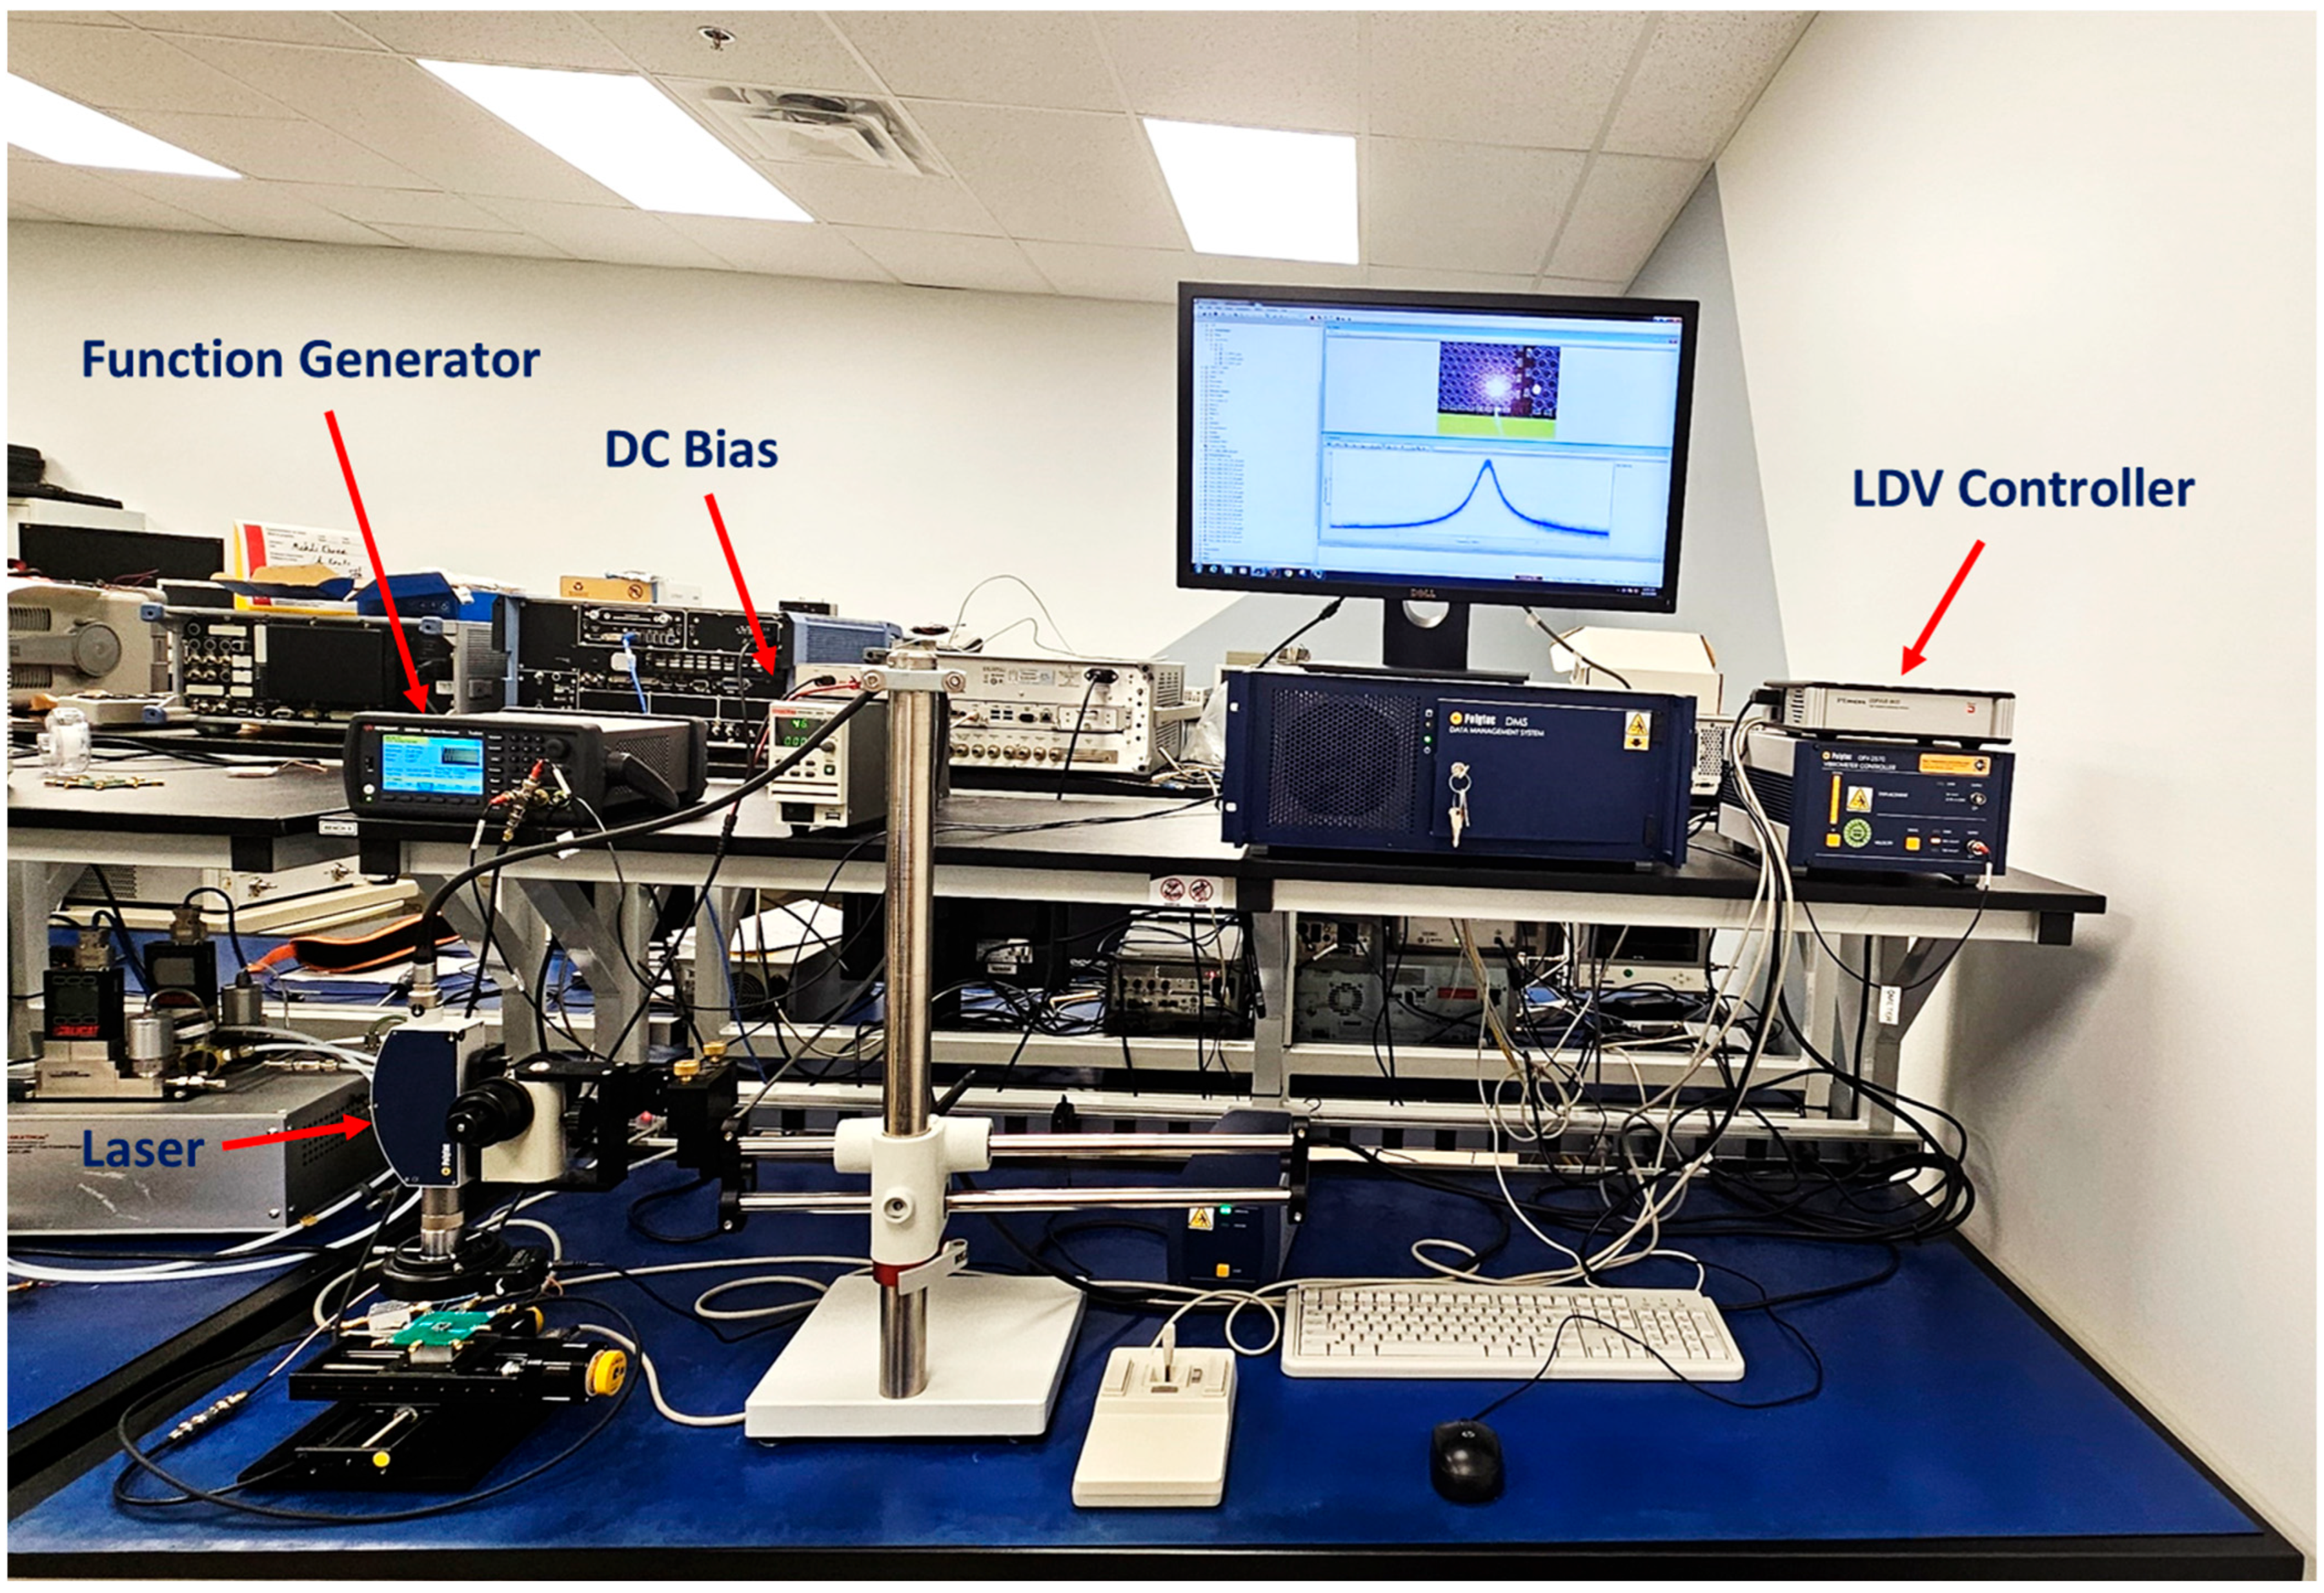
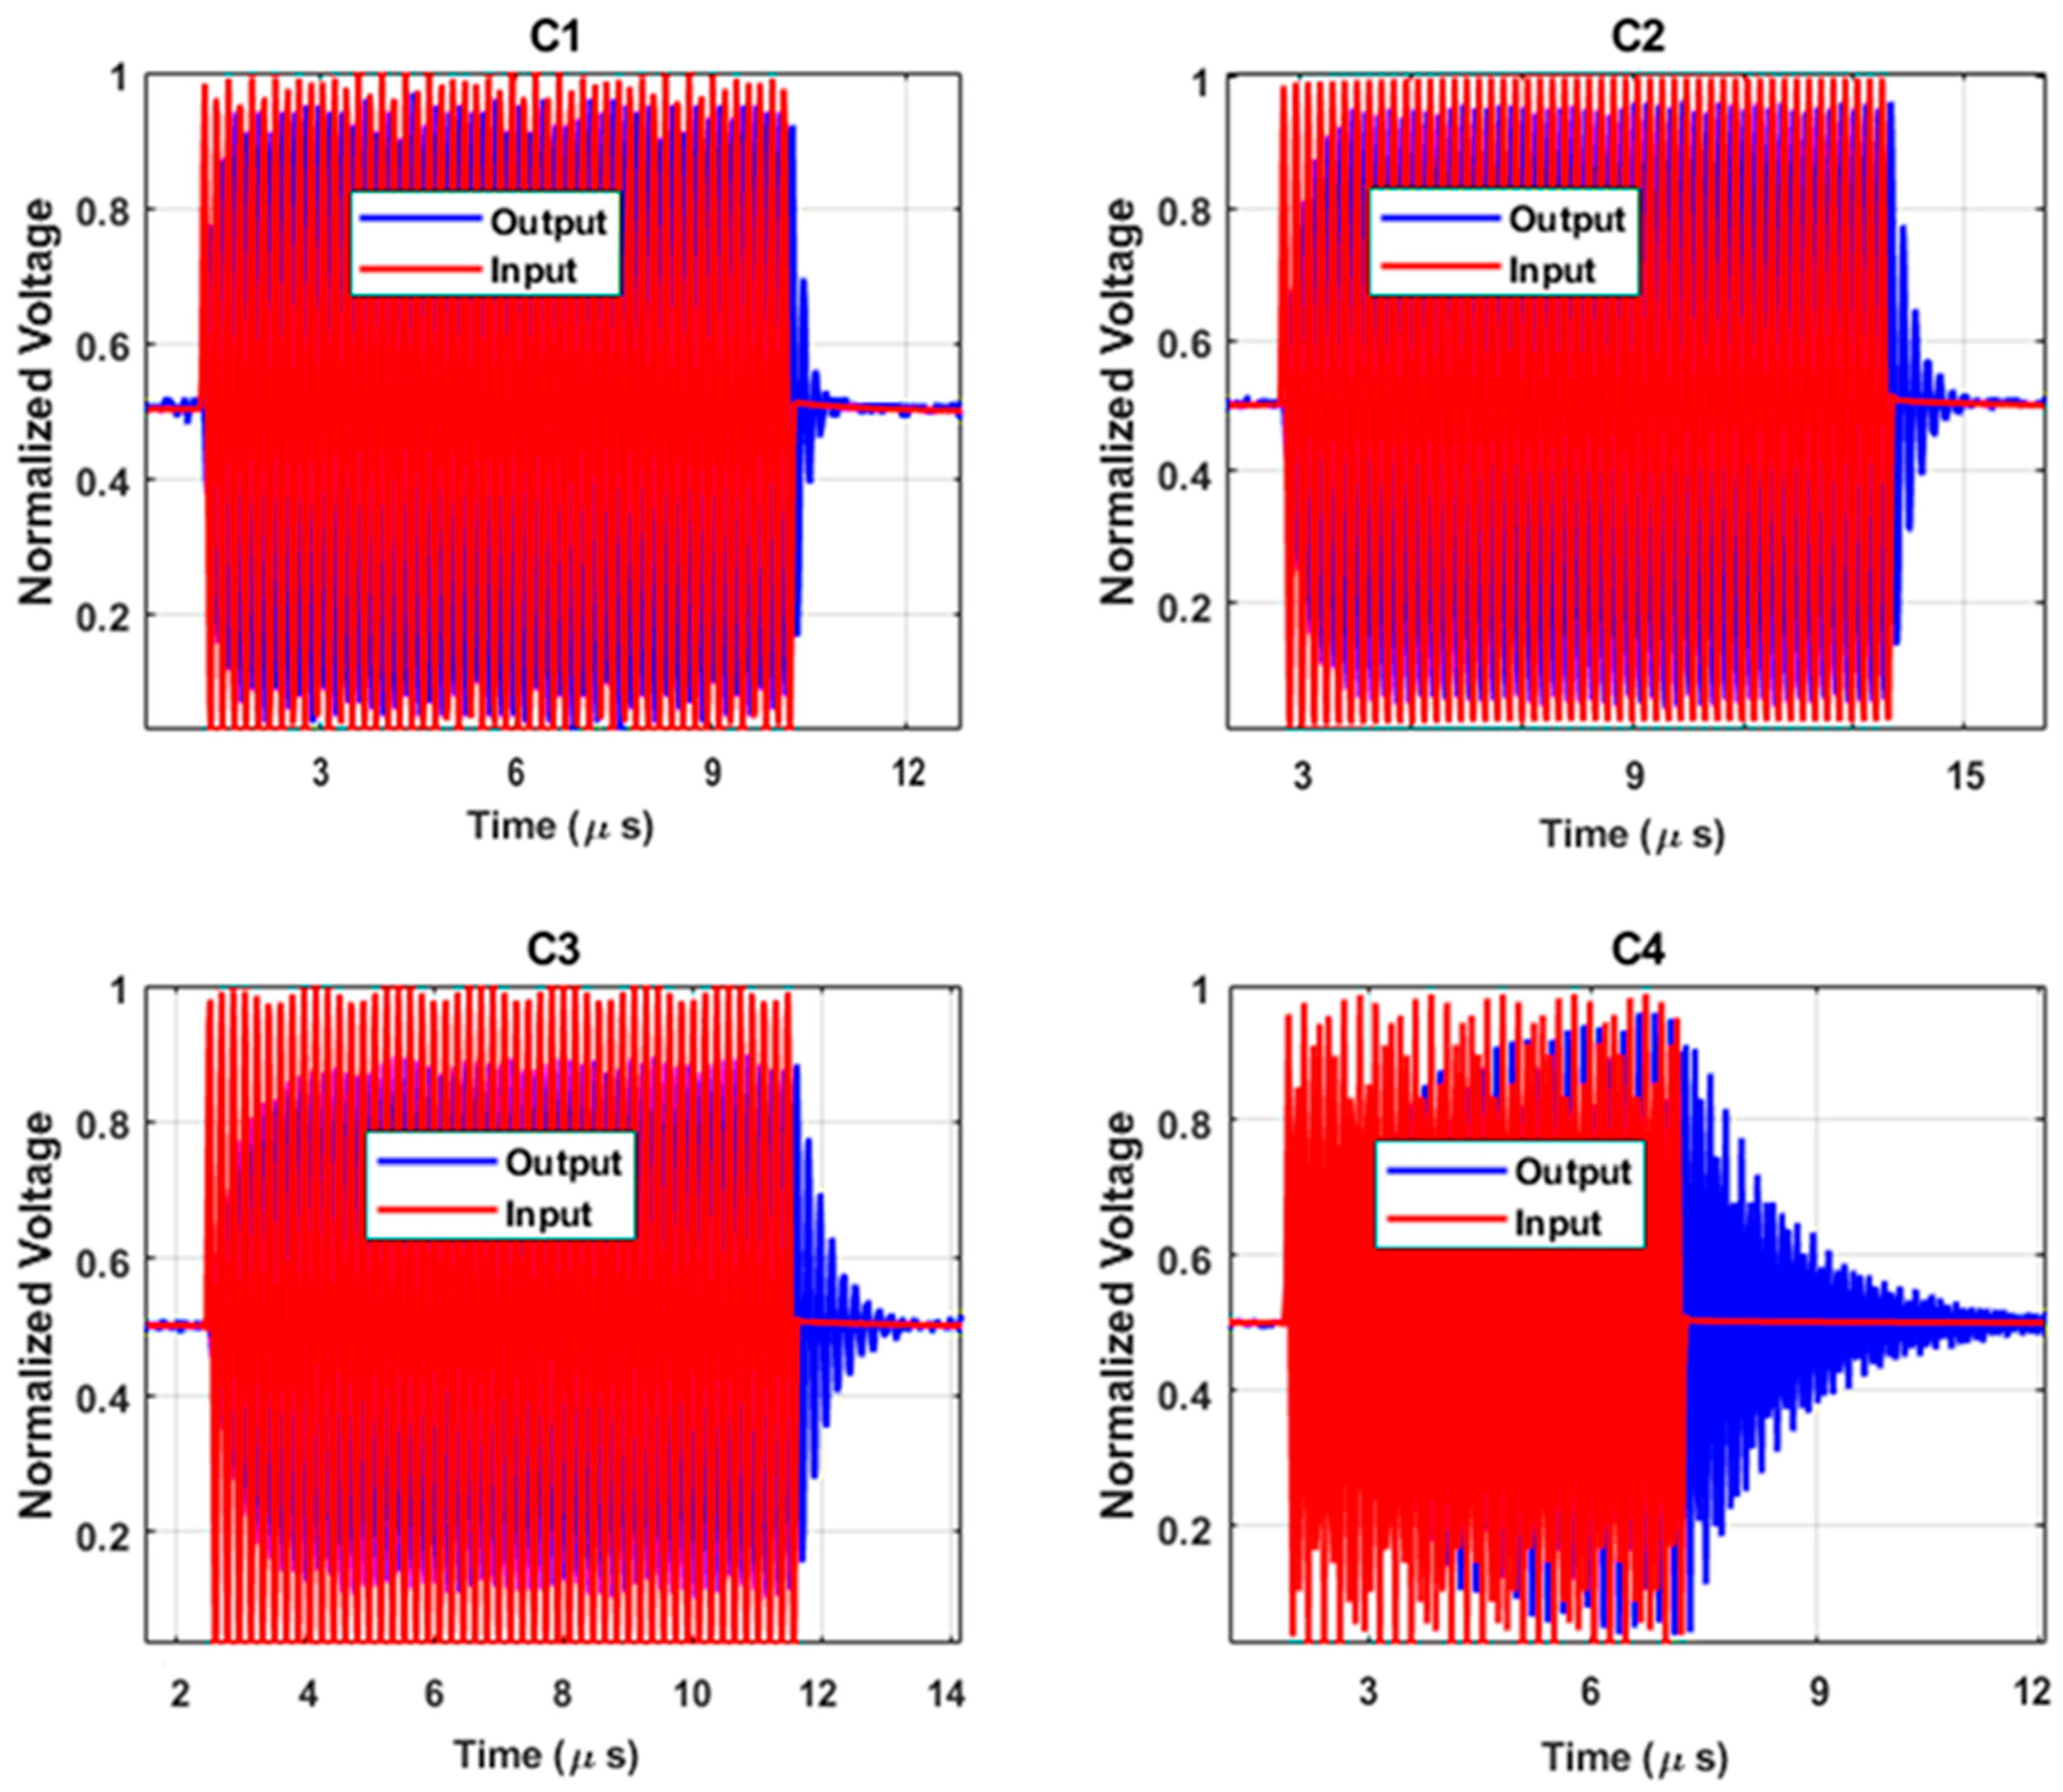
3.5. Air-Coupled Ring-Down Q-Factor Measurement
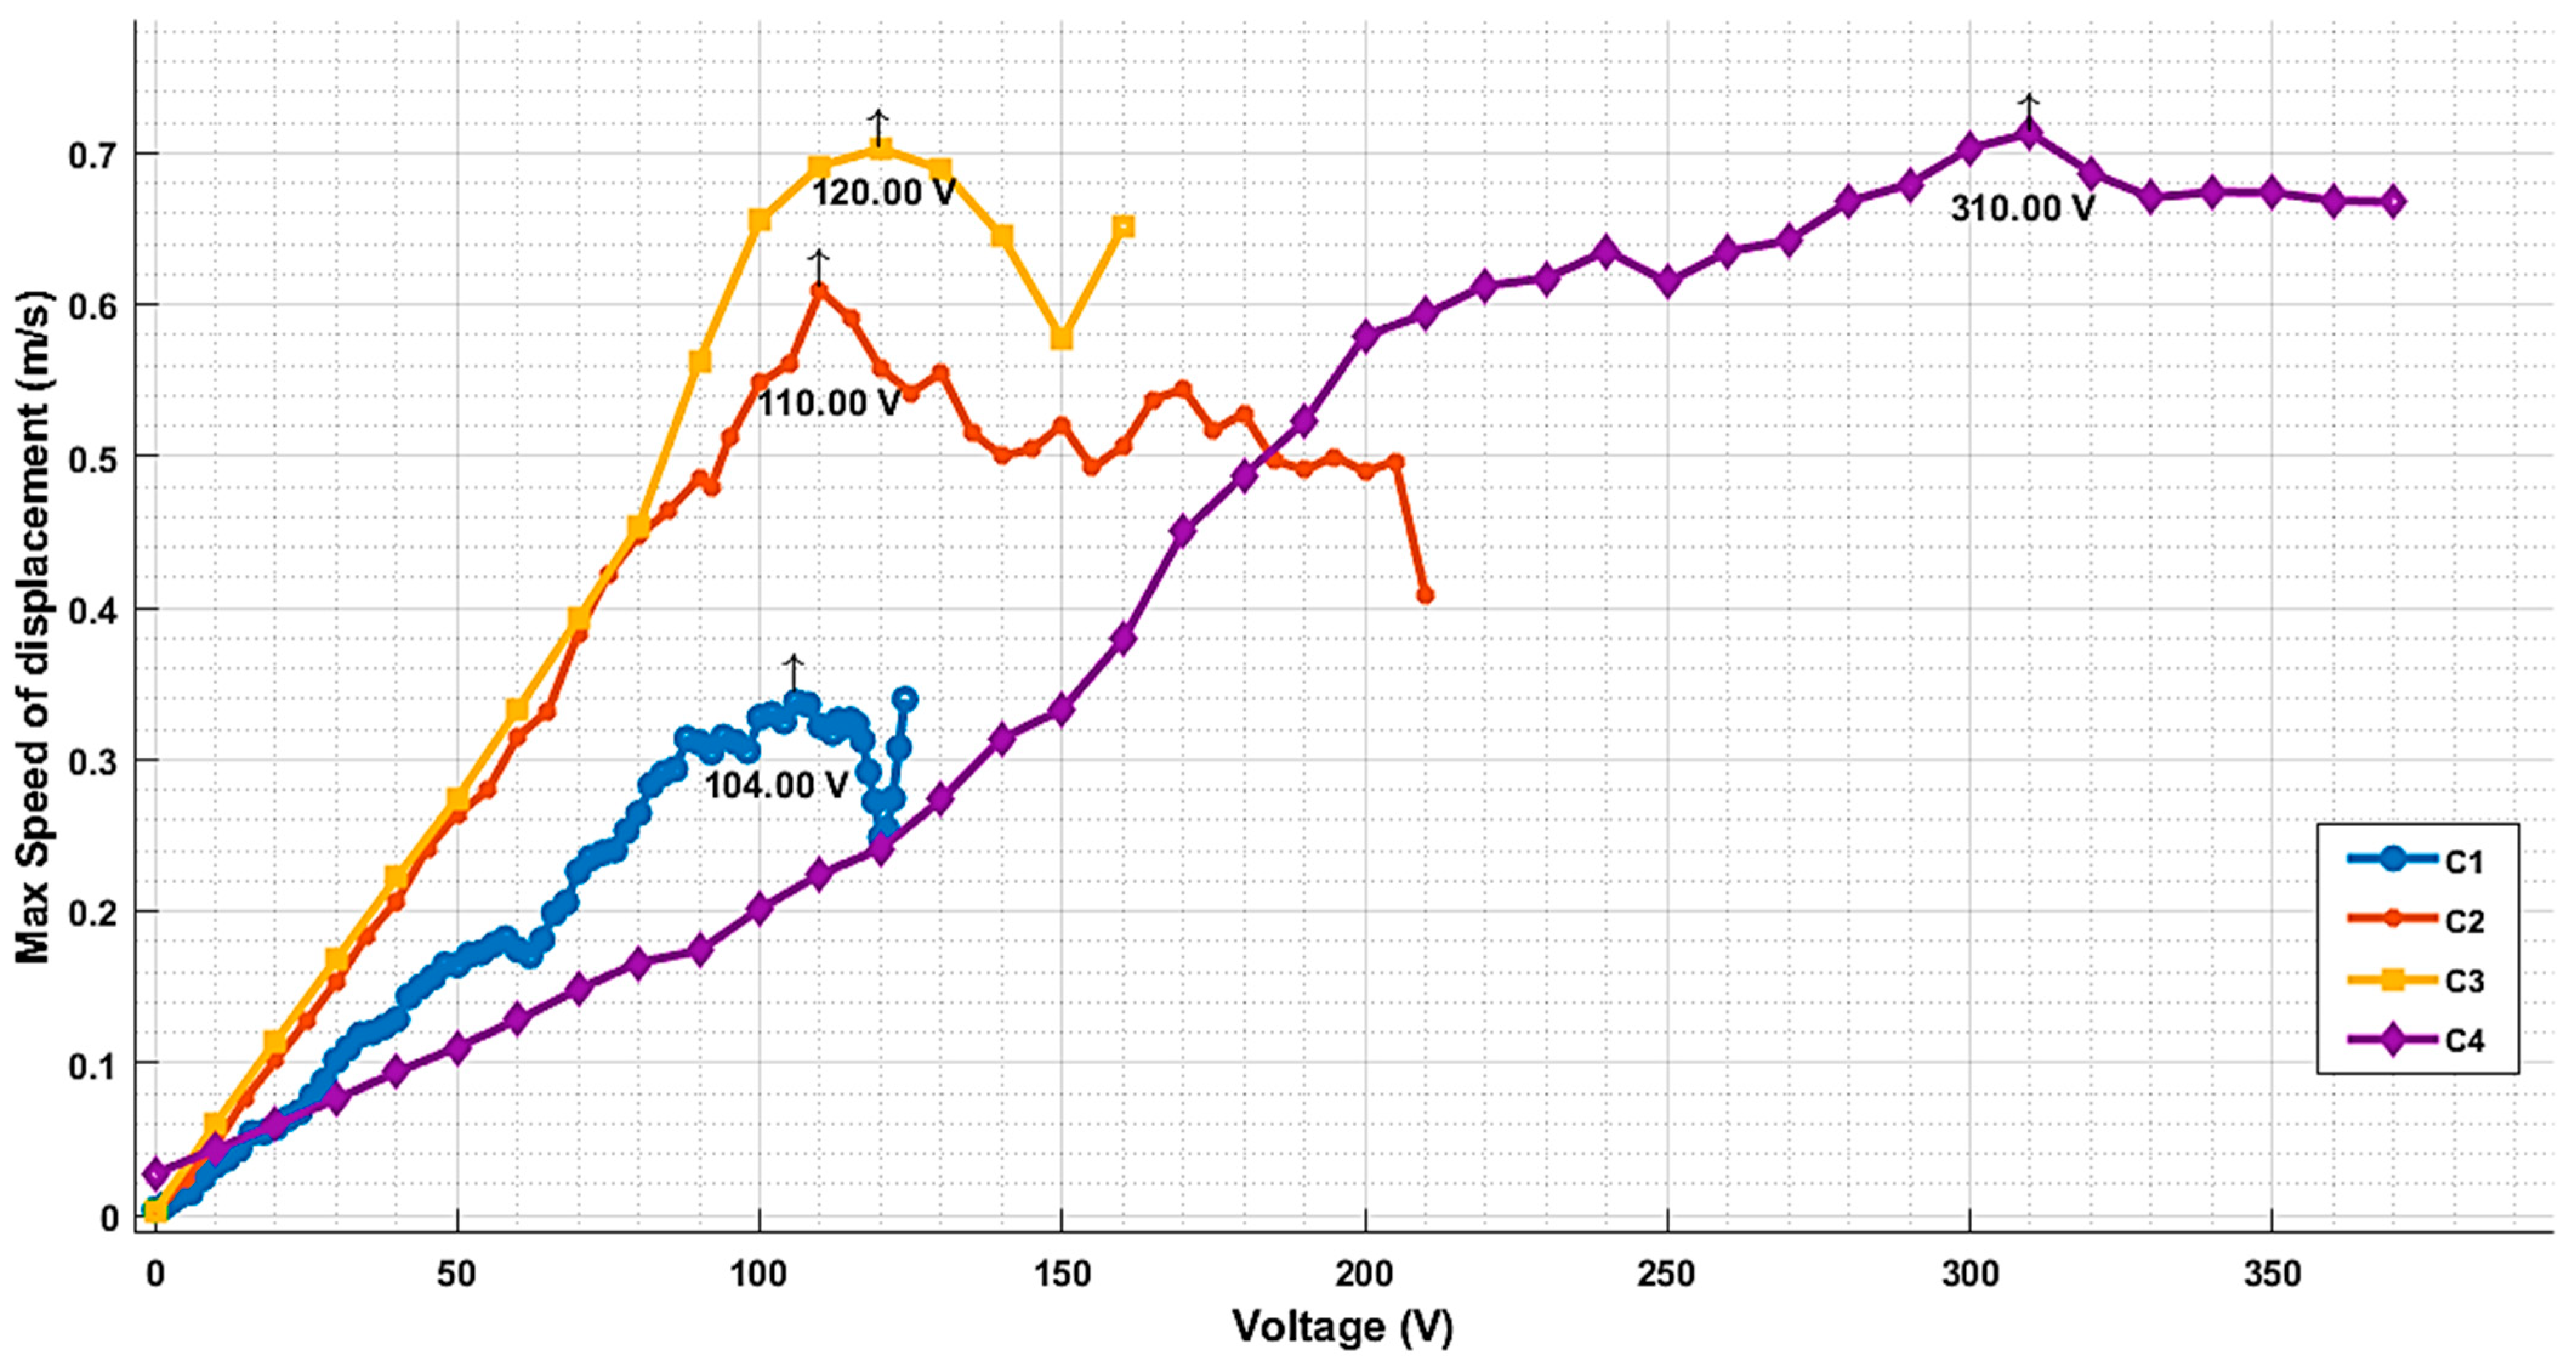
3.6. Maximal Output
3.7. Result Comparison
4. Conclusions
Author Contributions
Funding
Data Availability Statement
Conflicts of Interest
References
- Tanter, M.; Fink, M. Ultrafast imaging in biomedical ultrasound. IEEE Trans. Ultrason. Ferroelectr. Freq. Control 2014, 61, 102–119. [Google Scholar] [CrossRef] [PubMed]
- Li, Z.; Zhao, Y.; Barbruni, G.L.; Li, J.; Li, Z.; Yuan, J.; Yang, P.; Zhao, L.; Jiang, Z.; Carrara, S. Development of an Integrated CMUTs-Based Resonant Biosensor for Label-Free Detection of DNA with Improved Selectivity by Ethylene-Glycol Alkanethiols. Engineering 2024, 41, 231–241. [Google Scholar] [CrossRef]
- Demirci, U.; Ergun, A.S.; Oralkan, O.; Karaman, M.; Khuri-Yakub, B.T. Forward-viewing CMUT arrays for medical imaging. IEEE Trans. Ultrason. Ferroelectr. Freq. Control 2004, 51, 887–895. [Google Scholar] [CrossRef] [PubMed]
- Moshrefi, A.; Moghaddam, M.K.; Pournaki, I.J.; Ali, A.; Nabki, F. Advanced Design of Capacitive Micromachined Ultrasonic Transducers with Ultra-Low Quality Factor. In Proceedings of the 2024 IEEE Ultrasonics, Ferroelectrics, and Frequency Control Joint Symposium (UFFC-JS), Taipei, Taiwan, 22–26 September 2024; IEEE: Piscataway, NJ, USA; pp. 1–3. [Google Scholar] [CrossRef]
- Zangabad, R.P.; Lee, H.; Zhang, X.; Kilinc, M.S.; Arvanitis, C.D.; Degertekin, F.L. A high sensitivity CMUT-based passive cavitation detector for monitoring microbubble dynamics during focused ultrasound interventions. IEEE Trans. Ultrason. Ferroelectr. Freq. Control 2024, 71, 1087–1096. [Google Scholar] [CrossRef] [PubMed]
- Wang, J.; Li, S.; Zhang, H.; Wang, Z. An integrated multichannel system for air-coupled CMUT array imaging and guided wave detection applications. J. Phys. Conf. Ser. 2024, 2822, 012189. [Google Scholar] [CrossRef]
- Behnamfar, P.; Molavi, R.; Mirabbasi, S. Transceiver design for CMUT-based super-resolution ultrasound imaging. IEEE Trans. Biomed. Circuits Syst. 2016, 10, 383–393. [Google Scholar] [CrossRef] [PubMed]
- Zheng, Y.; Zhang, Z.; Zhang, Y.; Pan, Q.; Yan, X.; Li, X.; Yang, Z. Enhancing ultrasound power transfer: Efficiency, acoustics, and future directions. Adv. Mater. 2024, 37, 2407395. [Google Scholar] [CrossRef] [PubMed]
- Kim, J.H.; Lee, C.H.; Park, B.H.; Park, K.K. The effect of cell-to-cell variation in CMUTs on quality factor and frequency noise. In Proceedings of the 2023 IEEE International Ultrasonics Symposium (IUS), Montreal, QC, Canada, 3–8 September 2023; pp. 1–4. [Google Scholar]
- Ye, L.; Li, J.; Zhang, H.; Liang, D.; Wang, Z. An integrated front-end circuit board for air-coupled CMUT burst-echo imaging. Sensors 2020, 20, 6128. [Google Scholar] [CrossRef] [PubMed]
- Bayram, B.; Hsu, W.; Ergun, A.S.; Huang, Y.; Khuri-Yakub, B.T. Capacitive micromachined ultrasonic transducer (CMUT) design for high-frequency applications. In Proceedings of the 2002 IEEE Ultrasonics Symposium, Munich, Germany, 8–11 October 2002; Volume 1, pp. 417–420. [Google Scholar] [CrossRef]
- Goel, C.; Cicek, P.V.; Robichaud, A. Design and Implementation of Low-Voltage Tunable Capacitive Micro-Machined Transducers (CMUT) for Portable Applications. Micromachines 2022, 13, 1598. [Google Scholar] [CrossRef] [PubMed]
- Joseph, J.; Ma, B.; Khuri-Yakub, B.T. Applications of capacitive micromachined ultrasonic transducers: A comprehensive review. IEEE Trans. Ultrason. Ferroelectr. Freq. Control 2021, 69, 456–467. [Google Scholar] [CrossRef] [PubMed]
- Hasegawa, H. Advances in ultrasonography: Image formation and quality assessment. J. Med. Ultrason. 2021, 48, 377–389. [Google Scholar] [CrossRef] [PubMed]
- Rozsa, N.N.; Chen, Z.; Kim, T.; Guo, P.; Hopf, Y.M.; Voorneveld, J.; dos Santos, D.S.; Noothout, E.; Chang, Z.Y.; Chen, C.; et al. A 2000-volumes/s 3-D Ultrasound Probe with Monolithically Integrated 23 × 23-mm 2 4096-Element CMUT Array. IEEE J. Solid-State Circuits 2025, 60, 1397–1410. [Google Scholar] [CrossRef]
- Annayev, M.; Minhaj, T.I.; Adelegan, O.J.; Yamaner, F.Y.; Dayton, P.A.; Oralkan, Ö. Design and Fabrication of 1-D CMUT Arrays for Dual-Mode Dual-Frequency Acoustic Angiography Applications. IEEE Trans. Ultrason. Ferroelectr. Freq. Control 2023, 71, 191–201. [Google Scholar] [CrossRef] [PubMed]
- Mills, D. Medical imaging with capacitive micromachined ultrasound transducer (CMUT) arrays. In Proceedings of the IEEE Ultrasonics Symposium, Montreal, QC, Canada, 24–27 August 2004; Volume 1, pp. 384–390. [Google Scholar]
- Bao, M.; Yang, H. Squeeze film air damping in MEMS. Sens. Actuators A Phys. 2007, 136, 3–27. [Google Scholar] [CrossRef]
- Bao, M. Analysis and Design Principles of MEMS Devices; Elsevier: Amsterdam, The Netherlands, 2005. [Google Scholar]
- Hansen, R.C. Phased Array Antennas; Wiley: Hoboken, NJ, USA, 2009. [Google Scholar]
- Christensen, D.A. Ultrasonic Bioinstrumentation; Wiley: New York, NY, USA, 1988. [Google Scholar]
- Koester, D.; Cowen, A.; Mahadevan, R.; Stonefield, M.; Hardy, B. PolyMUMPs Design Handbook; MEMSCAP Inc.: Durham, NC, USA, 2003. [Google Scholar]
- Jensen, J.A. Users’ guide for the Field II program. Tech. Univ. Den. 2001, 2800, 28. [Google Scholar]
- Qu, M.; Chen, X.; Zhu, K.; Guo, X.; Xie, J. Beam-Membrane Coupled Piezoelectric Micromachined Ultrasonic Transducers with Enhanced Transmitting Sensitivity. Micromachines 2022, 13, 423. [Google Scholar] [CrossRef] [PubMed]
- Bayram, B.; Oralkan, O.; Ergun, A.S.; Hæggstrom, E.; Yaralioglu, G.G.; Khuri-Yakub, B.T. Capacitive micromachined ultrasonic transducer design for high power transmission. IEEE Trans. Ultrason. Ferroelectr. Freq. Control 2005, 52, 326–339. [Google Scholar] [CrossRef] [PubMed]
- Annayev, M.; Yamaner, F.Y.; Oralkan, Ö. Wireless ultrasonic power transfer using a pre-charged CMUT structure with a built-in charge storage capacitor. Microsyst. Nanoeng. 2025, 11, 70. [Google Scholar] [CrossRef] [PubMed]

| Diameter (µm) | Frequency (MHz) | Anchor Width (µm) | Holes Numbers | Q | Velocity (mm/s) | |
|---|---|---|---|---|---|---|
| C1 | 200 | 0.65 | 20 | 33 | 2.04 | 177.38 |
| C2 | 150 | 0.84 | 30 | 19 | 3.98 | 339.62 |
| C3 | 150 | 1.12 | 2.5 | 19 | 7.66 | 552.30 |
| C4 | 85 | 2.91 | 30 | 7 | 39.41 | 939.42 |
| Array Angle | C1 | C2 | C3 | C4 |
|---|---|---|---|---|
| 0 |  |  | 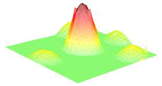 |  |
| 45 | 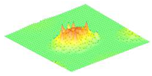 |  |  | 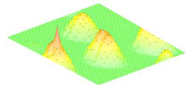 |
| 90 |  |  |  | 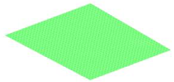 |
| 135 |  | 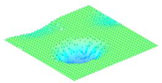 |  | 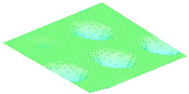 |
| 180 |  | 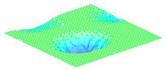 | 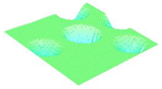 |  |
| 225 | 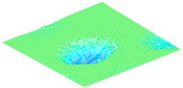 |  | 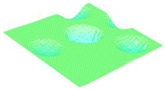 | 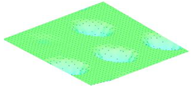 |
| 270 |  |  |  |  |
| 315 |  | 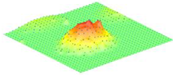 | 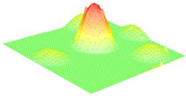 |  |
| Measured τ (µs) | Measured Q from Ring-down Test | Simulated Q from FEA | |
|---|---|---|---|
| C1 | 1.19 | 2.44 | 2.04 |
| C2 | 1.58 | 4.17 | 3.98 |
| C3 | 2.06 | 7.23 | 7.66 |
| C4 | 4.57 | 41.75 | 39.41 |
| Metric | This Work | Bayram 2005 [25] | Demirci 2004 [3] | Goel 2022 [12] | Annayev 2025 [26] | Wang 2024 [6] |
|---|---|---|---|---|---|---|
| Fabrication and cost | 3-mask PolyMUMPs; <$22 cm−2 | SOI bonding; ≈$120 cm−2 | SOI bonding; ≈$130 cm−2 | PolyMUMPs; ≈$25 cm−2 | 3-mask glass-bond; ≈$90 cm−2 | SOI; ≈$145 cm−2 |
| Collapse voltage (V) | 100 V | 177 V | 155 V | 110 V | 35 V (pre-charged) | 210 V |
| Max.displacement (µm) | 0.33 ± 0.02 @ 80 V (LDV) | 0.95 µm | Not reported | 0.025 µm | Not reported | Not reported |
| Q-factor (air) | 2–40 (tunable) | 30–80 | 22–45 | 35 ± 7 | 25 ± 4 | 25 |
| −6 dB fractional BW | 75–92% | 20–25% | 35% | 25% | 34% | 30% |
| Ring-down τ (µs) | 1.2 | 12–18 | 6–9 | 7–10 | 8.5 | 8 |
| Multi-band on-die | 4 bands | No | No | No | No | No |
| CMOS-ready bias (≤100 V) | Yes | No | No | Yes | Yes | No |
Disclaimer/Publisher’s Note: The statements, opinions and data contained in all publications are solely those of the individual author(s) and contributor(s) and not of MDPI and/or the editor(s). MDPI and/or the editor(s) disclaim responsibility for any injury to people or property resulting from any ideas, methods, instructions or products referred to in the content. |
© 2025 by the authors. Licensee MDPI, Basel, Switzerland. This article is an open access article distributed under the terms and conditions of the Creative Commons Attribution (CC BY) license (https://creativecommons.org/licenses/by/4.0/).
Share and Cite
Moshrefi, A.; Ali, A.; Gratuze, M.; Nabki, F. Design and Fabrication of Multi-Frequency and Low-Quality-Factor Capacitive Micromachined Ultrasonic Transducers. Micromachines 2025, 16, 797. https://doi.org/10.3390/mi16070797
Moshrefi A, Ali A, Gratuze M, Nabki F. Design and Fabrication of Multi-Frequency and Low-Quality-Factor Capacitive Micromachined Ultrasonic Transducers. Micromachines. 2025; 16(7):797. https://doi.org/10.3390/mi16070797
Chicago/Turabian StyleMoshrefi, Amirhossein, Abid Ali, Mathieu Gratuze, and Frederic Nabki. 2025. "Design and Fabrication of Multi-Frequency and Low-Quality-Factor Capacitive Micromachined Ultrasonic Transducers" Micromachines 16, no. 7: 797. https://doi.org/10.3390/mi16070797
APA StyleMoshrefi, A., Ali, A., Gratuze, M., & Nabki, F. (2025). Design and Fabrication of Multi-Frequency and Low-Quality-Factor Capacitive Micromachined Ultrasonic Transducers. Micromachines, 16(7), 797. https://doi.org/10.3390/mi16070797