1. Introduction
In the modern field of optics [
1,
2,
3,
4], transparent optical components, such as polarizers and wave plates, are widely used in numerous cutting-edge technologies, including optical communication, optical imaging, laser processing, and quantum optics [
5,
6,
7,
8]. The precise manipulation of its polarization performance directly affects the stability and work efficiency of the whole optical system in signal transmission, image acquisition, material processing, and quantum state preparation. The extinction ratio, a key parameter for evaluating the selective transmission ability of a transparent component to different polarization states, not only affects the quality grading and performance calibration of optical components but also determines the overall performance of optical systems [
9]. In optical communication systems, accurate detection of the extinction ratio can significantly enhance the signal-to-noise ratio, ensuring the stability and reliability of data transmission [
10]. In biomedical imaging, a high extinction ratio improves image contrast and clarity, making the analysis of polarization characteristics in biological tissues more precise, which aids in achieving higher-precision image analysis and processing, thereby enhancing the ability to diagnose diseases early [
11,
12]. In quantum optics experiments, the accurate measurement of the extinction ratio is essential for achieving quantum information transmission and processing [
13].
Currently, there are various methods for detecting the extinction ratio of a transparent component [
14,
15,
16,
17,
18]. Traditional methods based on mechanical rotating parts work by changing the polarization direction through mechanical rotation of polarization elements (such as polarizers) to achieve intensity modulation. Typically, a detector measurement method is used, where the light source, polarizer, the element to be tested, analyzer, and detector are arranged in sequence along the optical path. The light emitted by the light source is converted into linearly polarized light by the polarizer and then passes through the measured element and the analyzer, and the intensity is measured by the detector. During one full rotation of the mechanical component, the maximum and minimum readings of the detector are recorded, and the extinction ratio is calculated. The detection process requires the polarization device to rotate through 360 degrees to obtain the extinction ratio, which is not only time-consuming and inefficient but also difficult to meet the industrial batch detection requirements. Moreover, it is affected by mechanical vibration and other factors, which restricts its application in high-precision optical element detection [
19,
20]. The heterodyne interferometry-based detection method uses a laser as the system light source. The input light is converted into linearly polarized light by a polarizer and then split into two beams by a polarizing beam splitter. One beam undergoes mechanical delay, while the other undergoes frequency shift and polarization adjustment. The two beams are incident on the
X-axis and
Y-axis of a polarization-maintaining fiber (PMF), respectively. During the transmission of polarized light, there is a coupling effect. By adjusting the delay distance, only one polarized beam participates in the interference. The extinction ratio is calculated based on the detection of the spatial distribution of the coupling. Although the detection accuracy of this method is high and breaks through the accuracy bottleneck of traditional technology, the employment of heterodyne interferometry for extinction ratio measurement introduces frequency shifts and entails relatively complex operational procedures, thereby presenting challenges of high technical costs in practical engineering applications [
21,
22,
23]. The technical limitations of the aforementioned detection methods fundamentally reflect the inherent trade-offs in optical detection when pursuing high precision and efficiency simultaneously. These limitations not only impede the quality enhancement and performance optimization of transparent optical components but also impose constraints on multiple technological frontiers: the expansion of transmission capacity in optical communication networks, the breakthroughs in resolution for optical imaging systems, the precision improvement of laser processing equipment, and the reliability assurance in quantum optics experiments. Therefore, developing a high-precision, efficient, and cost-effective method for detecting the extinction ratio of a transparent component is not only a critical research direction in the current field of optical detection technology but also a key driver for advancing the optical field towards higher performance and greater intelligence.
In response to the above research situation, this work proposes a new method for detecting the extinction ratio of a transparent component. Firstly, the theoretical analysis of the worst extinction ratio value and its position of the transparent sample is conducted. Secondly, the formulas for calculating the phase retardation and stress direction of the transparent sample optical component are derived using the Stokes vector [
24,
25] and Mueller matrix [
26,
27,
28], and the extinction ratio of the sample is calculated based on the phase retardation of the transparent sample optical component [
29]. In the experiment, the data of independent experiments on the transparent sample are analyzed. The experimental process is simple, with good repeatability and high accuracy. The final experimental results also verify the effectiveness and reliability of this method.
2. Principle Analysis
2.1. Derivation of Extinction Ratio
The schematic diagram of the transmission optical path is shown in
Figure 1 [
30]. The light source starts along the
z-axis and becomes linearly polarized after passing through a polarizer, with its transmission axis in the y-direction. It then vertically incidents on the surface of the sample under test. After transmission, the polarization state of the outgoing light changes, and finally, the light intensity signal is received by the detector after passing through an analyzer [
31].
The extinction ratio of the transmissive element is measured. In the transmissive model, the light source is modulated into linearly polarized light by the polarizer and then passes through the transmissive element and the analyzer, and finally, the detector detects the polarization state of the beam [
32,
33].
Its system model is shown in the following formula [
34]:
Among them,
and
denote the Stokes vectors of the incident light and the beam detected by the detector. The Stokes vectors of the monochromatic light source
with an intensity of
is as follows:
and
represent the Mueller matrices of the polarizer and analyzer, whose expressions are shown as follows [
35,
36,
37]:
The parameter
is the Mueller matrix of the transparent component, which is expressed as follows:
As can be seen from the expression, the transmissive element contains two parameters: the angle with respect to the x-axis (where the fast axis is ) and the retardation .
According to the definition of the Stokes vector, the first parameter
of the Stokes vector represents the total light intensity [
38,
39]. Therefore, the expression for the light intensity of the beam emerging from the polarizer can be derived as follows:
Among them, and are the angles between the polarizer and analyzer with the x-axis direction, respectively.
Let
; then, Equation (5) can be further rearranged into a function of
:
The maximum light intensity is
, and the minimum light intensity is
; thus, the extinction ratio is as follows:
When
is minimized, the extinction ratio is at its worst.
Here, . Through analysis, it is found that, when , the influence of the cross term is greatest, resulting in the minimum value of .
Theoretical derivation from the expression shows that, when the polarizer angle
differs from the fast-axis angle
of the transmission device by
, i.e.,
, at this point, the extinction ratio reaches its worst value, with the worst value being
2.2. Analysis of Transmission Device Parameters
The polarizer at an angle
to the
x-axis is divided into four polarization directions, 0°, 45°, 90°, and 135°, which can be expressed as follows:
When , .
Then, the Stokes vector of the outgoing light after passing through the polarizer can be derived as follows:
According to Formula (5), taking
and
, we obtain
Similarly, it can be obtained that
,
, and
are
It can be observed that, when solving the parameters of transparent samples—retardation and fast axis —they are only related to the intensity of light.
Based on the above, this paper proposes a new method: by fixing the polarizer at
and utilizing the light intensity values obtained from rotating the analyzer to four angles (
,
,
,
), the sample information of the transmission-type device can be calculated, thereby determining the extinction ratio of the sample, which is represented by the following equation:
3. Simulation Results and Analysis
As can be theoretically derived from the above, the specific relationship between the total intensity of the outgoing light and the total intensity of the incident light is as follows:
Among them, and are the angles between the polarizer and analyzer with the x-axis direction, respectively.
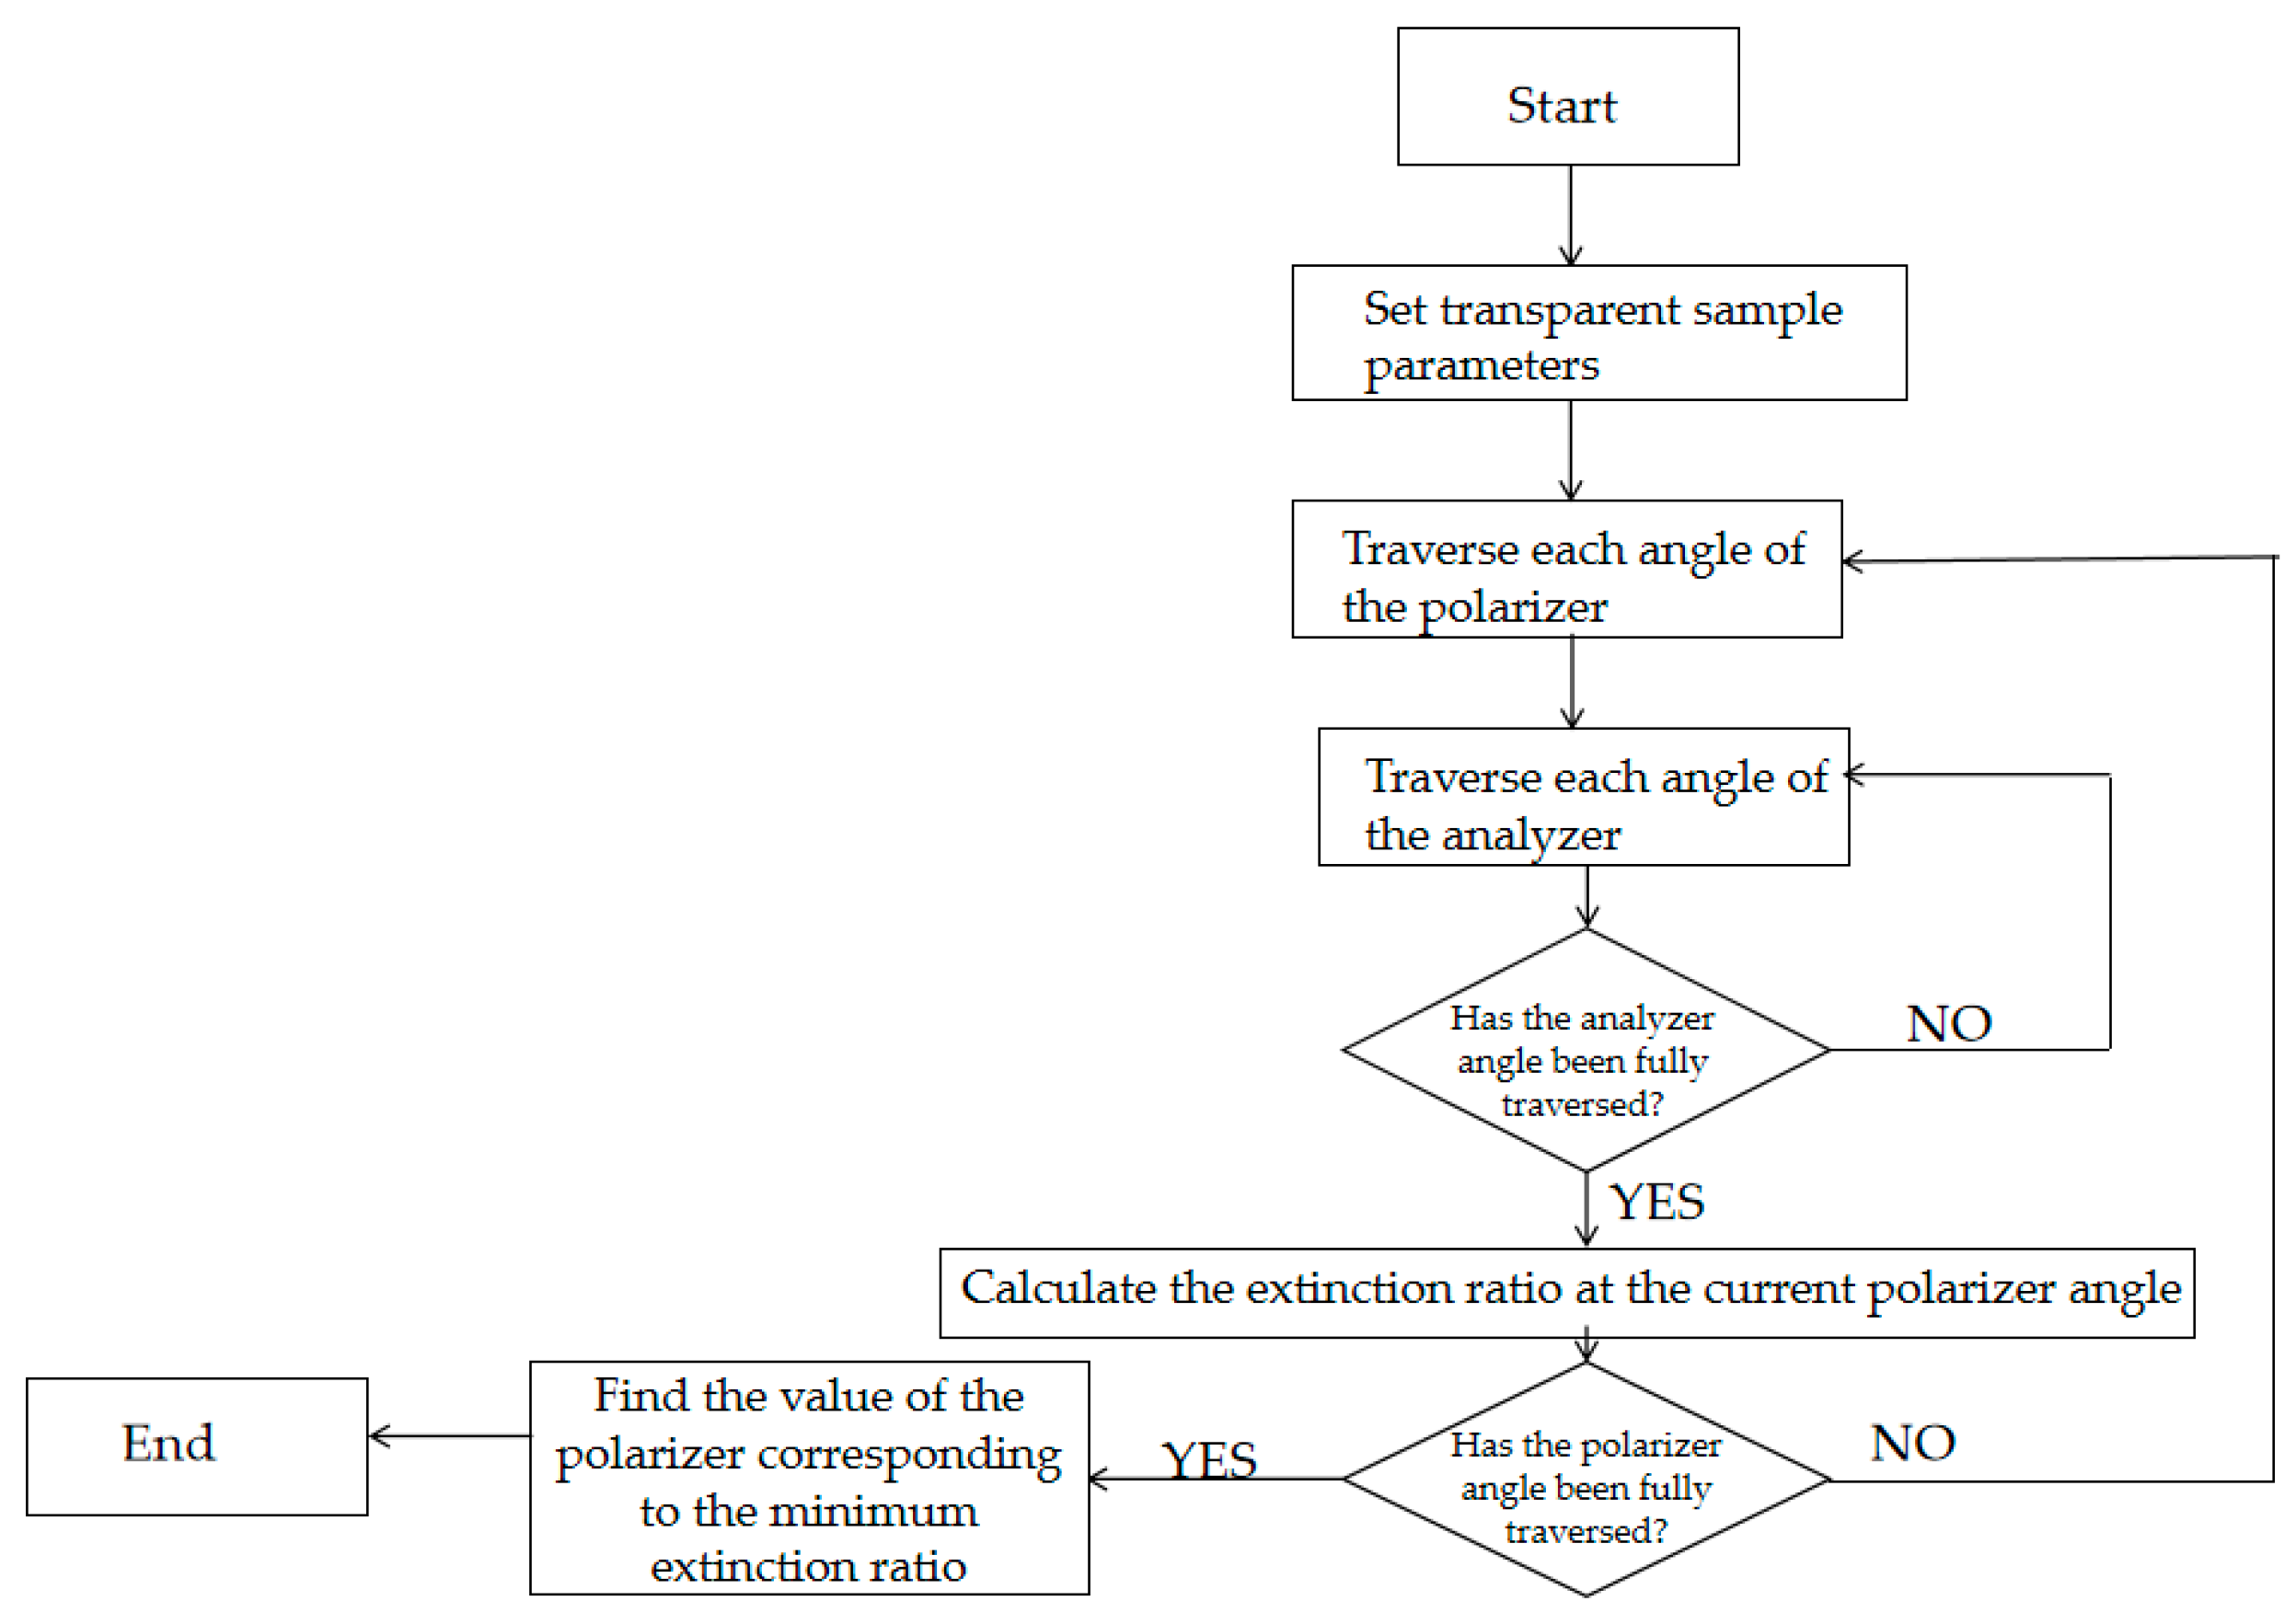
In order to verify the feasibility of the theoretical derivation of the method in this paper, the traditional method simulation was carried out through Matlab R2024b, and the extinction ratio obtained after simulation was compared with the extinction ratio obtained by this method. The simulation flow chart is shown below in
Figure 2.
Set
= 30 nm and the fast axis angles to
,
,
, and
, respectively. It can be verified that, when the angle between the polarizer and the fast axis direction differs by
, the extinction ratio is at its worst. The specific relationship curve and corresponding table are shown in
Figure 3 and
Table 1.
As shown in
Figure 2, the
obtained from traditional simulation methods is 13.93. When
nm is set,
, which can be calculated by the method proposed in this paper. Through simulation experiments, the feasibility of the theoretical derivation of this method has been verified.
4. Experiments and Results Analysis
With reference to the aforementioned optical path, an experimental platform was constructed, and an experimental system was designed as shown in
Figure 4. The system employs a laser with a wavelength of 633 nm as the visible light source, a linear polarizer with a spectral range of 400 nm to 700 nm, and an extinction ratio > 10,000:1 as the polarizer. The analyzer is mounted on a rotary stage, with the rotation angle controlled by the stage, and the final outgoing light is received by a detector. In this experiment, a standard stress 13 nm retardation plate produced by Hinds Instruments was selected for the actual measurement.
Through analysis, it was found that the detector’s response to light intensity has the greatest impact on the test results. To evaluate its effect on experimental repeatability, this work conducted 10 independent experiments, measuring the light intensity values detected by the probe at different angles (0°, 45°, 90°, 135°). The experimental results are shown in
Figure 5 and
Table 2. In
Table 2, the unit of measured light intensity at different angles is μW, and the unit of retardation of the sample to be tested is nm.
Figure 5 shows the values obtained by continuous light intensity detection at different angles of the analyzer. It can be seen that the light intensity fluctuation is very small, and the influence on the experiment can be ignored. Additionally, the data from the 10 experiments in
Table 2 were analyzed. By statistically analyzing the mean values (central tendency), standard deviations (dispersion degree), and relative standard deviations (RSD) of each parameter, the stability and reliability of the experimental results were verified. The data analysis results are shown in
Table 3.
To analyze whether changes in laser power would affect the experimental results, the laser power was adjusted, and 10 independent experiments were conducted, measuring the light intensity values detected by the detector at different angles. The experimental results are shown in
Table 4. In this table, the unit of measured light intensity at different angles is μW, and the unit of retardation of the sample to be tested is nm.
We conducted data analysis on these 10 experiments after power adjustment, verifying the stability and reliability of the experimental results through statistical analysis of parameter means (central tendency), standard deviations (dispersion degree), and relative standard deviations (RSD). The data analysis results are shown in
Table 5.
4.1. Analysis of Experimental Results
4.1.1. Repetitive Analysis
Repeatability is a crucial metric for evaluating the reliability of experiments, assessed through the relative standard deviation (RSD). In the data from
Table 3, the RSD in the i = 1 direction is as low as 0.0022, demonstrating exceptionally high repeatability. The RSD values for the i = 2 and i = 4 directions are 0.0032 and 0.0031, respectively, while the i = 3 direction shows an RSD of 0.0074. Overall, these results indicate minimal fluctuations in light intensity measurement values across multiple experiments, confirming the excellent repeatability of the experimental outcomes.
Similarly, the data in
Table 5 exhibit favorable repeatability characteristics, with RSD values of 0.0009, 0.0036, and 0.0050 for the i = 1, i = 2, and i = 4 directions, respectively—closely matching the corresponding RSD values in
Table 3, indicating comparable repeatability performance. Although the RSD in the i = 3 direction in both
Table 3 and
Table 5 is slightly higher, this may stem from minor environmental disturbances (e.g., subtle airflow-induced optical path perturbations) or slight fluctuations in detector sensitivity at the corresponding light intensity levels. Nevertheless, the standard deviations remain at a low level, exerting negligible impact on the overall experimental results and falling within an acceptable range.
These findings demonstrate that the measurement results consistently maintain relative stability across different experimental groups, proving that the experimental system exhibits strong repeatability and provides reliable data support for the experimental conclusions.
4.1.2. Calculate the Extinction Ratio
After averaging the sample retardation measured in 10 different experiments, the result was 13.08 nm. Compared with the actual value of = 13 nm, the relative error was 0.62%, which is relatively small. When = 13 nm, . By calculating the extinction ratio using the obtained parameters, the worst-case extinction ratio of the final sample was determined to be 76.09, yielding a relative error of 1.22% compared to the actual value. The small relative error validates the feasibility of this method.
5. Discussion
In the field of optical detection, two methods are widely used for the measurement of the extinction ratio: the traditional mechanical rotation detection method and the measurement method based on heterodyne interferometry. While both methods have been extensively employed in both research and industrial applications, they exhibit limitations when compared to the novel methodology proposed in this work, as detailed below.
Traditional detection methods based on mechanical rotation rely on the rotation of polarization elements to modulate light intensity by changing the polarization direction. While this method is simple and cost-effective, it has significant limitations. To obtain maximum and minimum light intensity readings, the polarizer must be rotated 360 degrees to measure the light intensity at each angle, which makes the measurement process time-consuming. Additionally, the mechanical vibrations from the rotating component can introduce errors, reducing measurement accuracy to about 7%. In contrast, the method proposed in this research does not require the polarizer to rotate 360 degrees; instead, it only needs to rotate four angles to complete the extinction ratio measurement, which greatly improves the experimental efficiency. Furthermore, the method demonstrates good repeatability, with negligible impact on the reliability of the overall experimental results across multiple trials.
The measurement method based on heterodyne interferometry uses a laser as the light source. The input linearly polarized light is split into two beams by a polarization beam splitter. One beam undergoes mechanical delay, while the other is frequency-shifted and polarized. The extinction ratio is then calculated based on the spatial distribution of the coupled light after interference in the polarization-maintaining fiber. Although this method can achieve high-precision measurements with an error rate as low as 3%, its complexity is a major drawback. The precise frequency modulation, fiber coupling, and fine adjustment of the delay distance make the experimental setup and operation cumbersome. In contrast, the proposed method employs a non-interferometric technique to measure the parameters in the Mueller matrix of the transparent component to calculate the extinction ratio. This approach simplifies the optical setup, reduces the number of optical components, and eliminates the need for complex frequency modulation operations. Consequently, the proposed method is better suited for practical applications, including on-site and real-time measurements.
To sum up, compared with the traditional mechanical rotation and heterodyne interferometry methods, the method of measuring the extinction ratio based on the Mueller matrix of transparent elements proposed in this work has a precision of less than 2% and shows good performance in terms of measurement accuracy, measurement efficiency, operation simplicity, and adaptability to a variety of measurement scenarios.
6. Conclusions
This study proposes a high-precision measurement method for the extinction ratio of a transparent component based on its Mueller matrix. First, a theoretical analysis and derivation were conducted on the extinction ratio and its position in the worst-case scenario for the transparent sample. Second, using Stokes vector and Mueller matrix theory, formulas were derived to calculate the phase delay and stress direction of the transparent component. These formulas, combined with the initial theoretical analysis, ultimately resulted in a formula for calculating the extinction ratio of the transparent component. The proposed method is theoretically simulated and compared with traditional methods, verifying the feasibility of its theoretical derivation. Experimental measurements were conducted on a transparent crystal with a retardation value of = 13 nm. By performing 10 independent repeated tests, the acquired data was analyzed and compared. The results showed a low relative standard deviation (RSD), indicating good experimental reproducibility. The final measured sample retardation exhibited a relative error of 0.62% compared to the theoretical value, indicating minimal deviation. Furthermore, the extinction ratio of the transparent sample was determined, with a relative error of 1.22% compared to the theoretical value, validating the effectiveness of the method. Compared with the existing methods, this method realizes the simplification and efficiency improvement of the device and provides a new idea for the rapid detection of industrial polarization devices. It has the characteristics of high precision, high efficiency, and low cost.
Author Contributions
Conceptualization, X.C.; Data curation, R.X.; Formal analysis, R.X.; Investigation, R.X. and J.R.; Methodology, R.X. and M.H.; Resources, X.C.; Software, R.X. and M.H.; Supervision, M.H. and X.C.; Validation, R.X.; Writing—original draft, R.X.; Writing—review and editing, M.H. and X.C. All authors have read and agreed to the published version of the manuscript.
Funding
This research received no external funding.
Data Availability Statement
The original contributions presented in this study are included in the article; further inquiries can be directed to the corresponding author.
Conflicts of Interest
The authors declare no conflicts of interest.
References
- Huard, S. Polarization of Light; Wiley: Hoboken, NJ, USA, 1997. [Google Scholar]
- Major, C.; Juhasz, G.; Petrik, P.; Horvath, Z.; Polgar, O.; Fried, M. Application of wide angle beam spectroscopic ellipsometry for quality control in solar cell production. Vacuum 2009, 84, 119–122. [Google Scholar] [CrossRef]
- Ohyama, T.; Ohki, A.; Takahata, K.; Ito, T.; Nunoya, N.; Mawatari, H.; Fujisawa, T.; Kanazawa, S.; Iga, R.; Sanjoh, H. Transmitter optical subassembly using a polarization beam combiner for 100 Gbit/s Ethernet over 40-km transmission. J. Light. Technol. 2015, 33, 1985–1992. [Google Scholar] [CrossRef]
- Baryshnikova, K.V.; Smirnova, D.A.; Luk’yanchuk, B.S.; Kivshar, Y.S. Optical anapoles: Concepts and applications. Adv. Opt. Mater. 2019, 7, 1801350. [Google Scholar] [CrossRef]
- Khonina, S.N.; Kazanskiy, N.L.; Skidanov, R.V.; Butt, M.A. Advancements and applications of diffractive optical elements in contemporary optics: A comprehensive overview. Adv. Mater. Technol. 2025, 10, 2401028. [Google Scholar] [CrossRef]
- Zhang, Y.; Wu, J.; Jia, L.; Jin, D.; Jia, B.; Hu, X.; Moss, D.; Gong, Q. Advanced optical polarizers based on 2D materials. Npj Nanophotonics 2024, 1, 28. [Google Scholar] [CrossRef]
- Arun Prakash, S.; Sumithra, M.; Shankar, K.; Grover, A.; Singh, M.; Malhotra, J. Performance investigation of spectral-efficient high-speed inter-satellite optical wireless communication link incorporating polarization division multiplexing. Opt. Quantum Electron. 2021, 53, 270. [Google Scholar] [CrossRef]
- Shi, Y.; Lin, Z.; Wang, T.; Huang, C.; Chen, H.; Chen, J.; Xie, Y. Reverse Design of Pixel-Type Micro-Polarizer Arrays to Improve Polarization Image Contrast. Micromachines 2024, 15, 1251. [Google Scholar] [CrossRef]
- Kliger, D.S.; Lewis, J.W. Polarized Light in Optics and Spectroscopy; Elsevier: Amsterdam, The Netherlands, 2012. [Google Scholar]
- Guo, M.; Wang, Y.; Yao, Y.; Duan, S.; Zhang, H.; Lin, W.; Liu, B. Experimental demonstration of SNSPD-based free space optical communication with a high extinction ratio modulator. Opt. Commun. 2024, 550, 129998. [Google Scholar] [CrossRef]
- Sasagawa, K.; Shishido, S.; Ando, K.; Matsuoka, H.; Noda, T.; Tokuda, T.; Kakiuchi, K.; Ohta, J. Image sensor pixel with on-chip high extinction ratio polarizer based on 65-nm standard CMOS technology. Opt. Express 2013, 21, 11132–11140. [Google Scholar] [CrossRef]
- Shrestha, S.; Petermann, J.; Farrahi, T.; Deshpande, A.; Giakos, G.C. Design, calibration, and testing of an automated near-infrared liquid-crystal polarimetric imaging system for discrimination of lung cancer cells. IEEE Trans. Instrum. Meas. 2015, 64, 2453–2467. [Google Scholar] [CrossRef]
- Wang, X.; Liu, J.; Li, X.; Li, Y. Generation of stable and high extinction ratio light pulses for continuous variable quantum key distribution. IEEE J. Quantum Electron. 2015, 51, 5200206. [Google Scholar] [CrossRef]
- Li, J.; Labudovic, M.; Young, J.R. Impact on polarization extinction ratio by stresses in a polarization maintaining fiber soldered into a ferrule. IEEE Trans. Compon. Packag. Technol. 2006, 29, 696–701. [Google Scholar] [CrossRef]
- Tsubokawa, M.; Higashi, T.; Sasaki, Y. Measurement of mode couplings and extinction ratios in polarization-maintaining fibers. J. Light. Technol. 1989, 7, 45–50. [Google Scholar] [CrossRef]
- Tang, X.; Liao, J.; Li, H.; Liu, Y. Novel approach for controllable polarization beam splitter: Design and simulation. IEEE J. Quantum Electron. 2012, 49, 43–50. [Google Scholar] [CrossRef]
- Ding, Y.; Zhu, X.; Xiao, S.; Hu, H.; Frandsen, L.H.; Mortensen, N.A.; Yvind, K. Effective electro-optical modulation with high extinction ratio by a graphene–silicon microring resonator. Nano Lett. 2015, 15, 4393–4400. [Google Scholar] [CrossRef]
- Zhou, K.; Simpson, G.; Chen, X.; Zhang, L.; Bennion, I. High extinction ratio in-fiber polarizers based on 45 tilted fiber Bragg gratings. Opt. Lett. 2005, 30, 1285–1287. [Google Scholar] [CrossRef]
- Duan, Z.L.; Ren, L.Y.; Zhang, Y.N.; Wang, H.Y.; Yao, B.L.; Zhao, W. Theoretical and experimental study of polarization characteristics of polarization maintaining fiber based on wavelength-sweeping modulation. Microw. Opt. Technol. Lett. 2010, 52, 1466–1469. [Google Scholar] [CrossRef]
- Zhaobing, W.; Guohua, L.; Shulong, L. Experimental study of the extinction ratio auto-measuring system. Chin. J. Lasers 2000, 27, 415–418. [Google Scholar]
- Hlubina, P.; Ciprian, D.; Lunacek, J. Spectral interferometric technique to measure the ellipsometric phase of a thin-film structure. Opt. Lett. 2009, 34, 2661–2663. [Google Scholar] [CrossRef]
- Hazebroek, H.; Visser, W. Automated laser interferometric ellipsometry and precision reflectometry. J. Phys. E Sci. Instrum. 1983, 16, 654. [Google Scholar] [CrossRef]
- Watkins, L.R. Interferometric ellipsometer. Appl. Opt. 2008, 47, 2998–3001. [Google Scholar] [CrossRef] [PubMed]
- Berry, H.G.; Gabrielse, G.; Livingston, A. Measurement of the Stokes parameters of light. Appl. Opt. 1977, 16, 3200–3205. [Google Scholar] [CrossRef] [PubMed]
- Lu, S.-Y.; Chipman, R.A. Interpretation of Mueller matrices based on polar decomposition. J. Opt. Soc. Am. A 1996, 13, 1106–1113. [Google Scholar] [CrossRef]
- Kalibjian, R. Stokes polarization vector and Mueller matrix for a corner-cube reflector. Opt. Commun. 2004, 240, 39–68. [Google Scholar] [CrossRef]
- Wang, Y.; Su, Y.; Sun, X.; Hao, X.; Liu, Y.; Zhao, X.; Li, H.; Zhang, X.; Xu, J.; Tian, J. Principle and implementation of stokes vector polarization imaging technology. Appl. Sci. 2022, 12, 6613. [Google Scholar] [CrossRef]
- Gil, J.J.; Ossikovski, R. Polarized Light and the Mueller Matrix Approach; CRC Press: Boca Raton, FL, USA, 2022. [Google Scholar]
- Zhang, P.; Tan, Y.; Liu, W.; Chen, W. Methods for optical phase retardation measurement: A review. Sci. China Technol. Sci. 2013, 56, 1155–1164. [Google Scholar] [CrossRef]
- Hardy, A.C.; Perrin, F.H. The Principles of Optics; McGraw-Hill Book Company, Inc.: New York, NY, USA, 1932. [Google Scholar]
- Marcuse, D. Light Transmission Optics; New York: Albany, NY, USA, 1982. [Google Scholar]
- Wolf, E. Introduction to the Theory of Coherence and Polarization of Light; Cambridge University Press: Cambridge, UK, 2007. [Google Scholar]
- Chipman, R.; Lam, W.S.T.; Young, G. Polarized Light and Optical Systems; CRC Press: Boca Raton, FL, USA, 2018. [Google Scholar]
- Mueller, H. The Foundation of Optics. J. Opt. Soc. Am. 1948, 38, 661. [Google Scholar]
- Azzam, R.M. Stokes-vector and Mueller-matrix polarimetry. J. Opt. Soc. Am. A 2016, 33, 1396–1408. [Google Scholar] [CrossRef]
- Chenault, D.B.; Pezzaniti, J.L.; Chipman, R.A. Mueller matrix algorithms. In Polarization Analysis and Measurement; SPIE: Bellingham, WA, USA, 1992; pp. 231–246. [Google Scholar]
- Thompson, R.C.; Bottiger, J.R.; Fry, E.S. Measurement of polarized light interactions via the Mueller matrix. Appl. Opt. 1980, 19, 1323–1332. [Google Scholar] [CrossRef]
- Azzam, R. Division-of-amplitude photopolarimeter (DOAP) for the simultaneous measurement of all four Stokes parameters of light. Opt. Acta Int. J. Opt. 1982, 29, 685–689. [Google Scholar] [CrossRef]
- Brudzewski, K. Static Stokes ellipsometer: General analysis and optimization. J. Mod. Opt. 1991, 38, 889–896. [Google Scholar] [CrossRef]
| Disclaimer/Publisher’s Note: The statements, opinions and data contained in all publications are solely those of the individual author(s) and contributor(s) and not of MDPI and/or the editor(s). MDPI and/or the editor(s) disclaim responsibility for any injury to people or property resulting from any ideas, methods, instructions or products referred to in the content. |
© 2025 by the authors. Licensee MDPI, Basel, Switzerland. This article is an open access article distributed under the terms and conditions of the Creative Commons Attribution (CC BY) license (https://creativecommons.org/licenses/by/4.0/).


