SAMOO and A-SAMOO methodologies were evaluated on three different MEMS devices: the U-shaped Lorentz force actuator, serpentine Lorentz force actuator, and the thermal actuator. Our investigation focused on these devices alone and did not consider additional elements, such as the mechanics of the substrate, since we are wishing to develop the methodology for particular actuator designs. LHS is employed to generate five distinct datasets within the design space, each comprising 20, 50, 100, 200, and 400 samples. Five-fold cross-validation is used to assess the prediction accuracy of the surrogate models. The parameters associated with NSGA-II optimization algorithm are listed in
Table 1. For A-SAMOO, the number of FEM evaluations per generation is set to 1. Furthermore, when objectives are scaled using a combination log scaling and normalization, the standard deviation threshold is 1 × 10
−4, found via a trial-and-error process.
4.1. U-Shaped Lorentz Force Actuator
The first MEMS device considered for optimization is a U-shaped Lorentz force actuator [
44], as depicted in
Figure 2. When exposed to an external magnetic field, a current passing through the crossbar generates a Lorentz force, causing the crossbar, and hence the load, to move vertically. Mathematically, the generated force is calculated using the equation
where
is the generated Lorentz force,
I is the current,
is the length of the crossbar (
in
Figure 2),
is the magnetic field, and
is the angle between the magnetic field and the crossbar. In this work, the magnetic field is assumed to be provided via a permanent magnet in a way that the provided magnetic field is perpendicular to the crossbar (sin 90° = 1).
Since these actuators have applications for adaptive optics, the load is considered to be a mirror membrane composed of Au/Si
3N
4/Au layers. Based on the volume and density of these layers, the mirror mass is computed. The mirror is then modeled as a mass and spring system attached to the crossbar via a small pillar depicted in
Figure 2. The opposite ends of the two cantilever springs are mechanically clamped to the substrate. A thin-film Al layer, covering the entire structure, provides the pathway for the current. The actuator itself is made of polycrystalline silicon. The magnetic field (B) required for the operation is assumed to be provided externally. This value is used for the calculation of required current and voltage. The vertical displacement of the crossbar in one direction is set to a fixed value, and hence, the total displacement of the cross bar is twice the value.
The meshing size for the simulations was carefully chosen to balance convergence and computational efficiency. Larger mesh sizes were found to occasionally fail due to significant inaccuracies in the results, making them unsuitable for reliable optimization. On the other hand, smaller mesh sizes did not lead to noticeable changes in results but significantly increased computation times. More specifically, the chosen meshing sizes are tested to be small enough that finer sizes do not make significant changes to the simulation results. This is due the fact that the main contribution of this work is the optimization process itself and time-consuming sampling would only hinder extensive studies.
A trial-and-error process was performed to obtain the meshing configuration that balanced the convergence and consistency of the simulations and the computational times. Meshing is calibrated for “General physics” and set to “Predefined Coarse” size. The average simulation time was 6.02 s. The parameters used in the modeling and their values are listed in
Table 2.
The design is defined by seven geometric design variables, each with specific ranges outlined in
Table 3. The optimization process focuses on three conflicting objectives: minimizing von Mises stress, minimizing reaction force, and maximizing resonant frequency [
45]. The structure undergoes a solid mechanics analysis to determine the resulting stress and the required reaction force. This approach enables the calculation of both the force necessary to achieve the specified deformation and the stress experienced by the structure. Resonant frequency is simulated through eigenfrequency study. Constraints applied to these objectives are detailed in
Table 4.
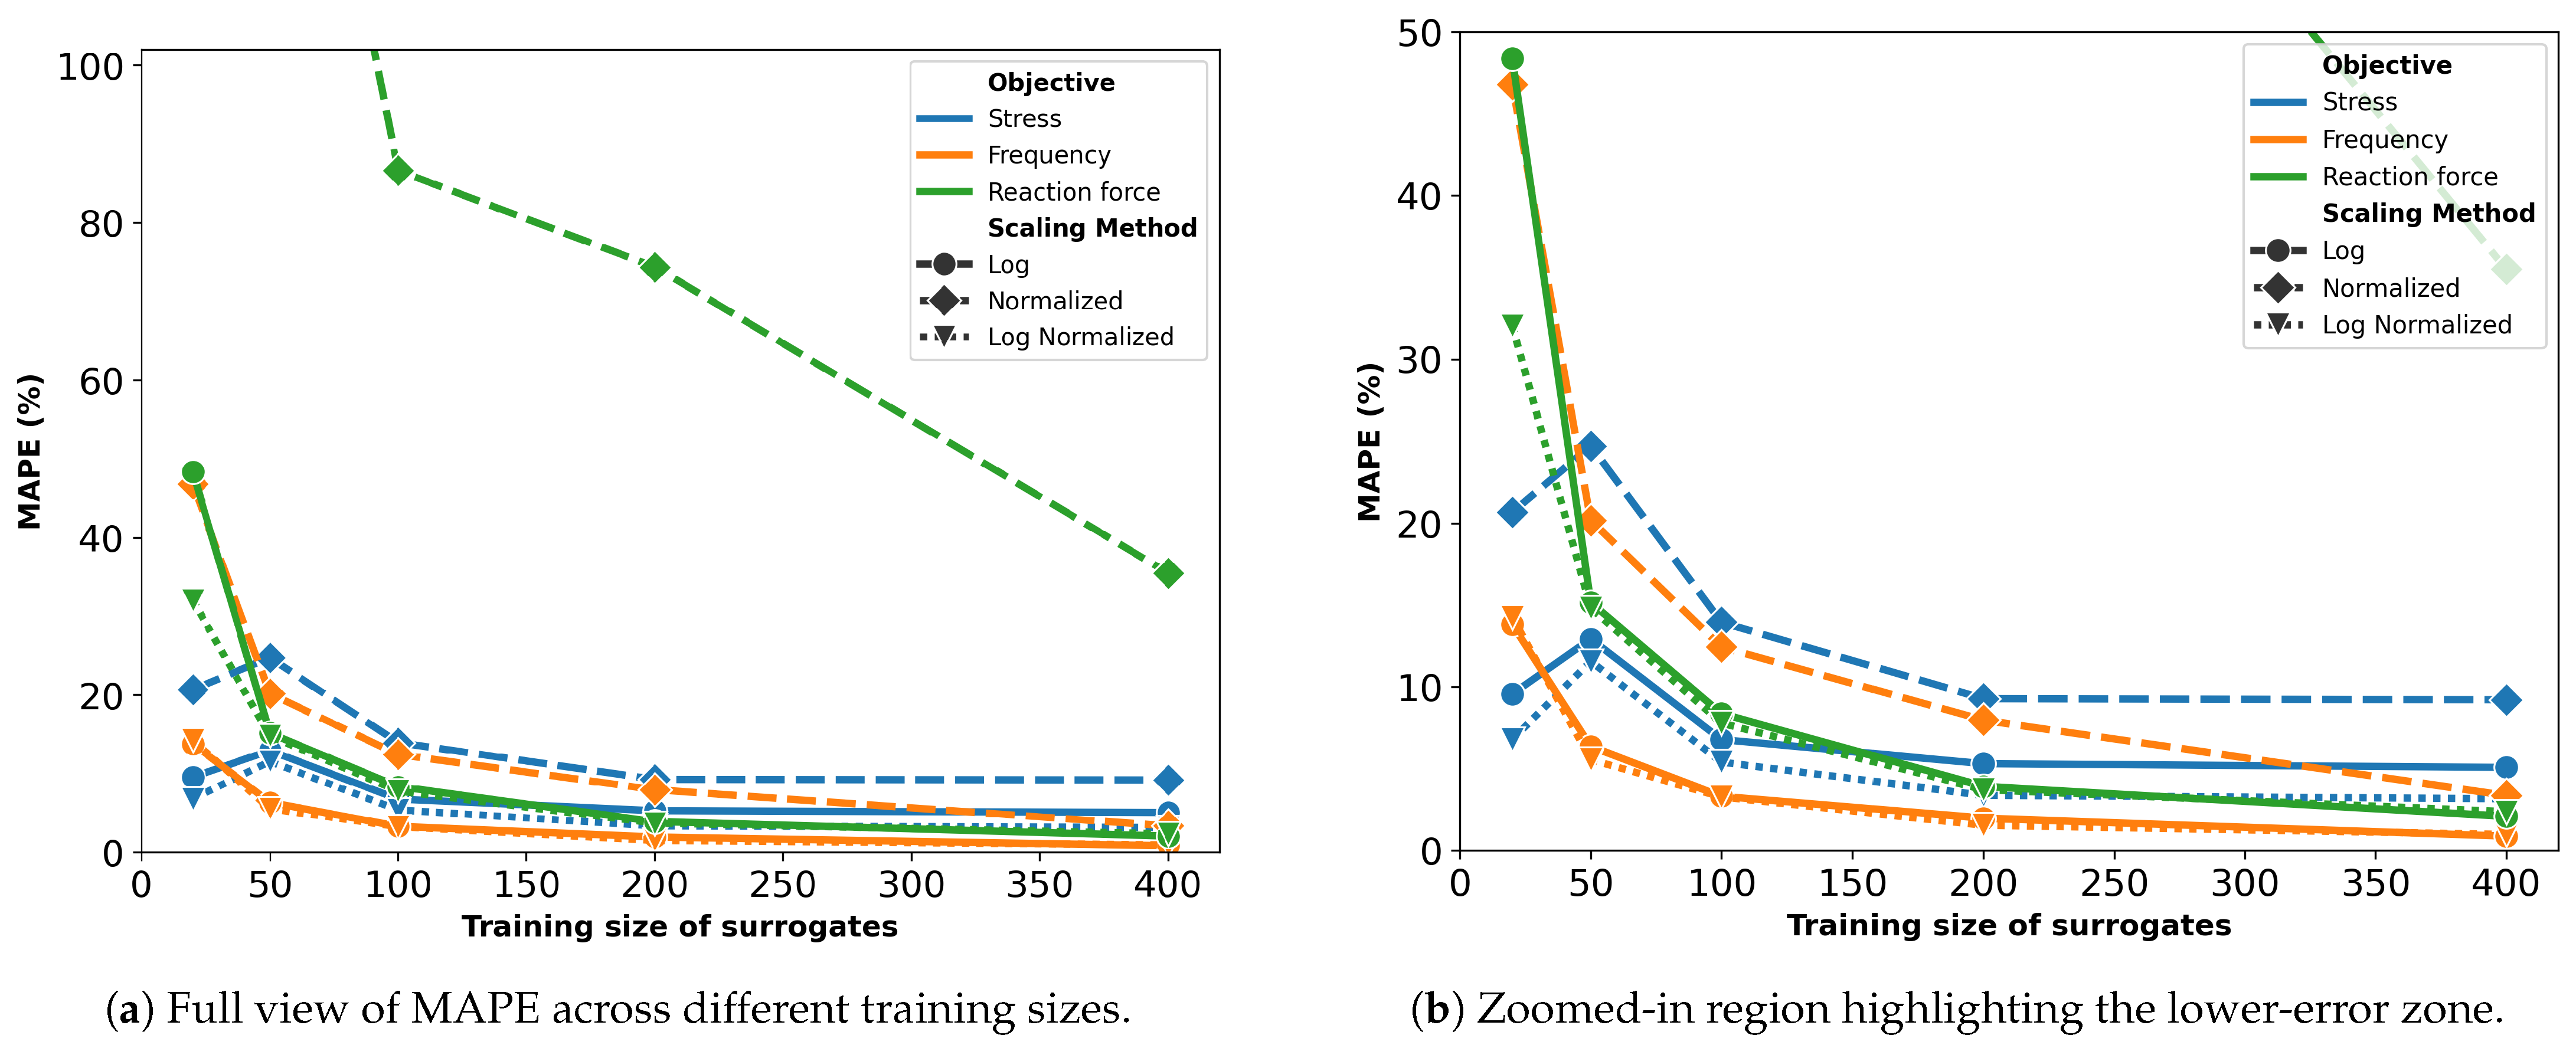
Figure 3 displays the prediction performance of the surrogates, trained on varying sample sizes, in terms of MAPE. To improve readability, the y-axis is capped at 100%. As expected, the error decreases with larger training sizes, as they provide more information for the model.
Surrogates trained on normalized objectives perform the worst, especially for the reaction force, with a best MAPE of 35.5%. For the other two objectives, errors are lower but still higher compared to other scaling methods. Surrogates trained using log scaling or a combination of log scaling with normalization yield a similar performance, with a slight advantage in favor of the latter. Thus, only these surrogates are used in the optimization process.
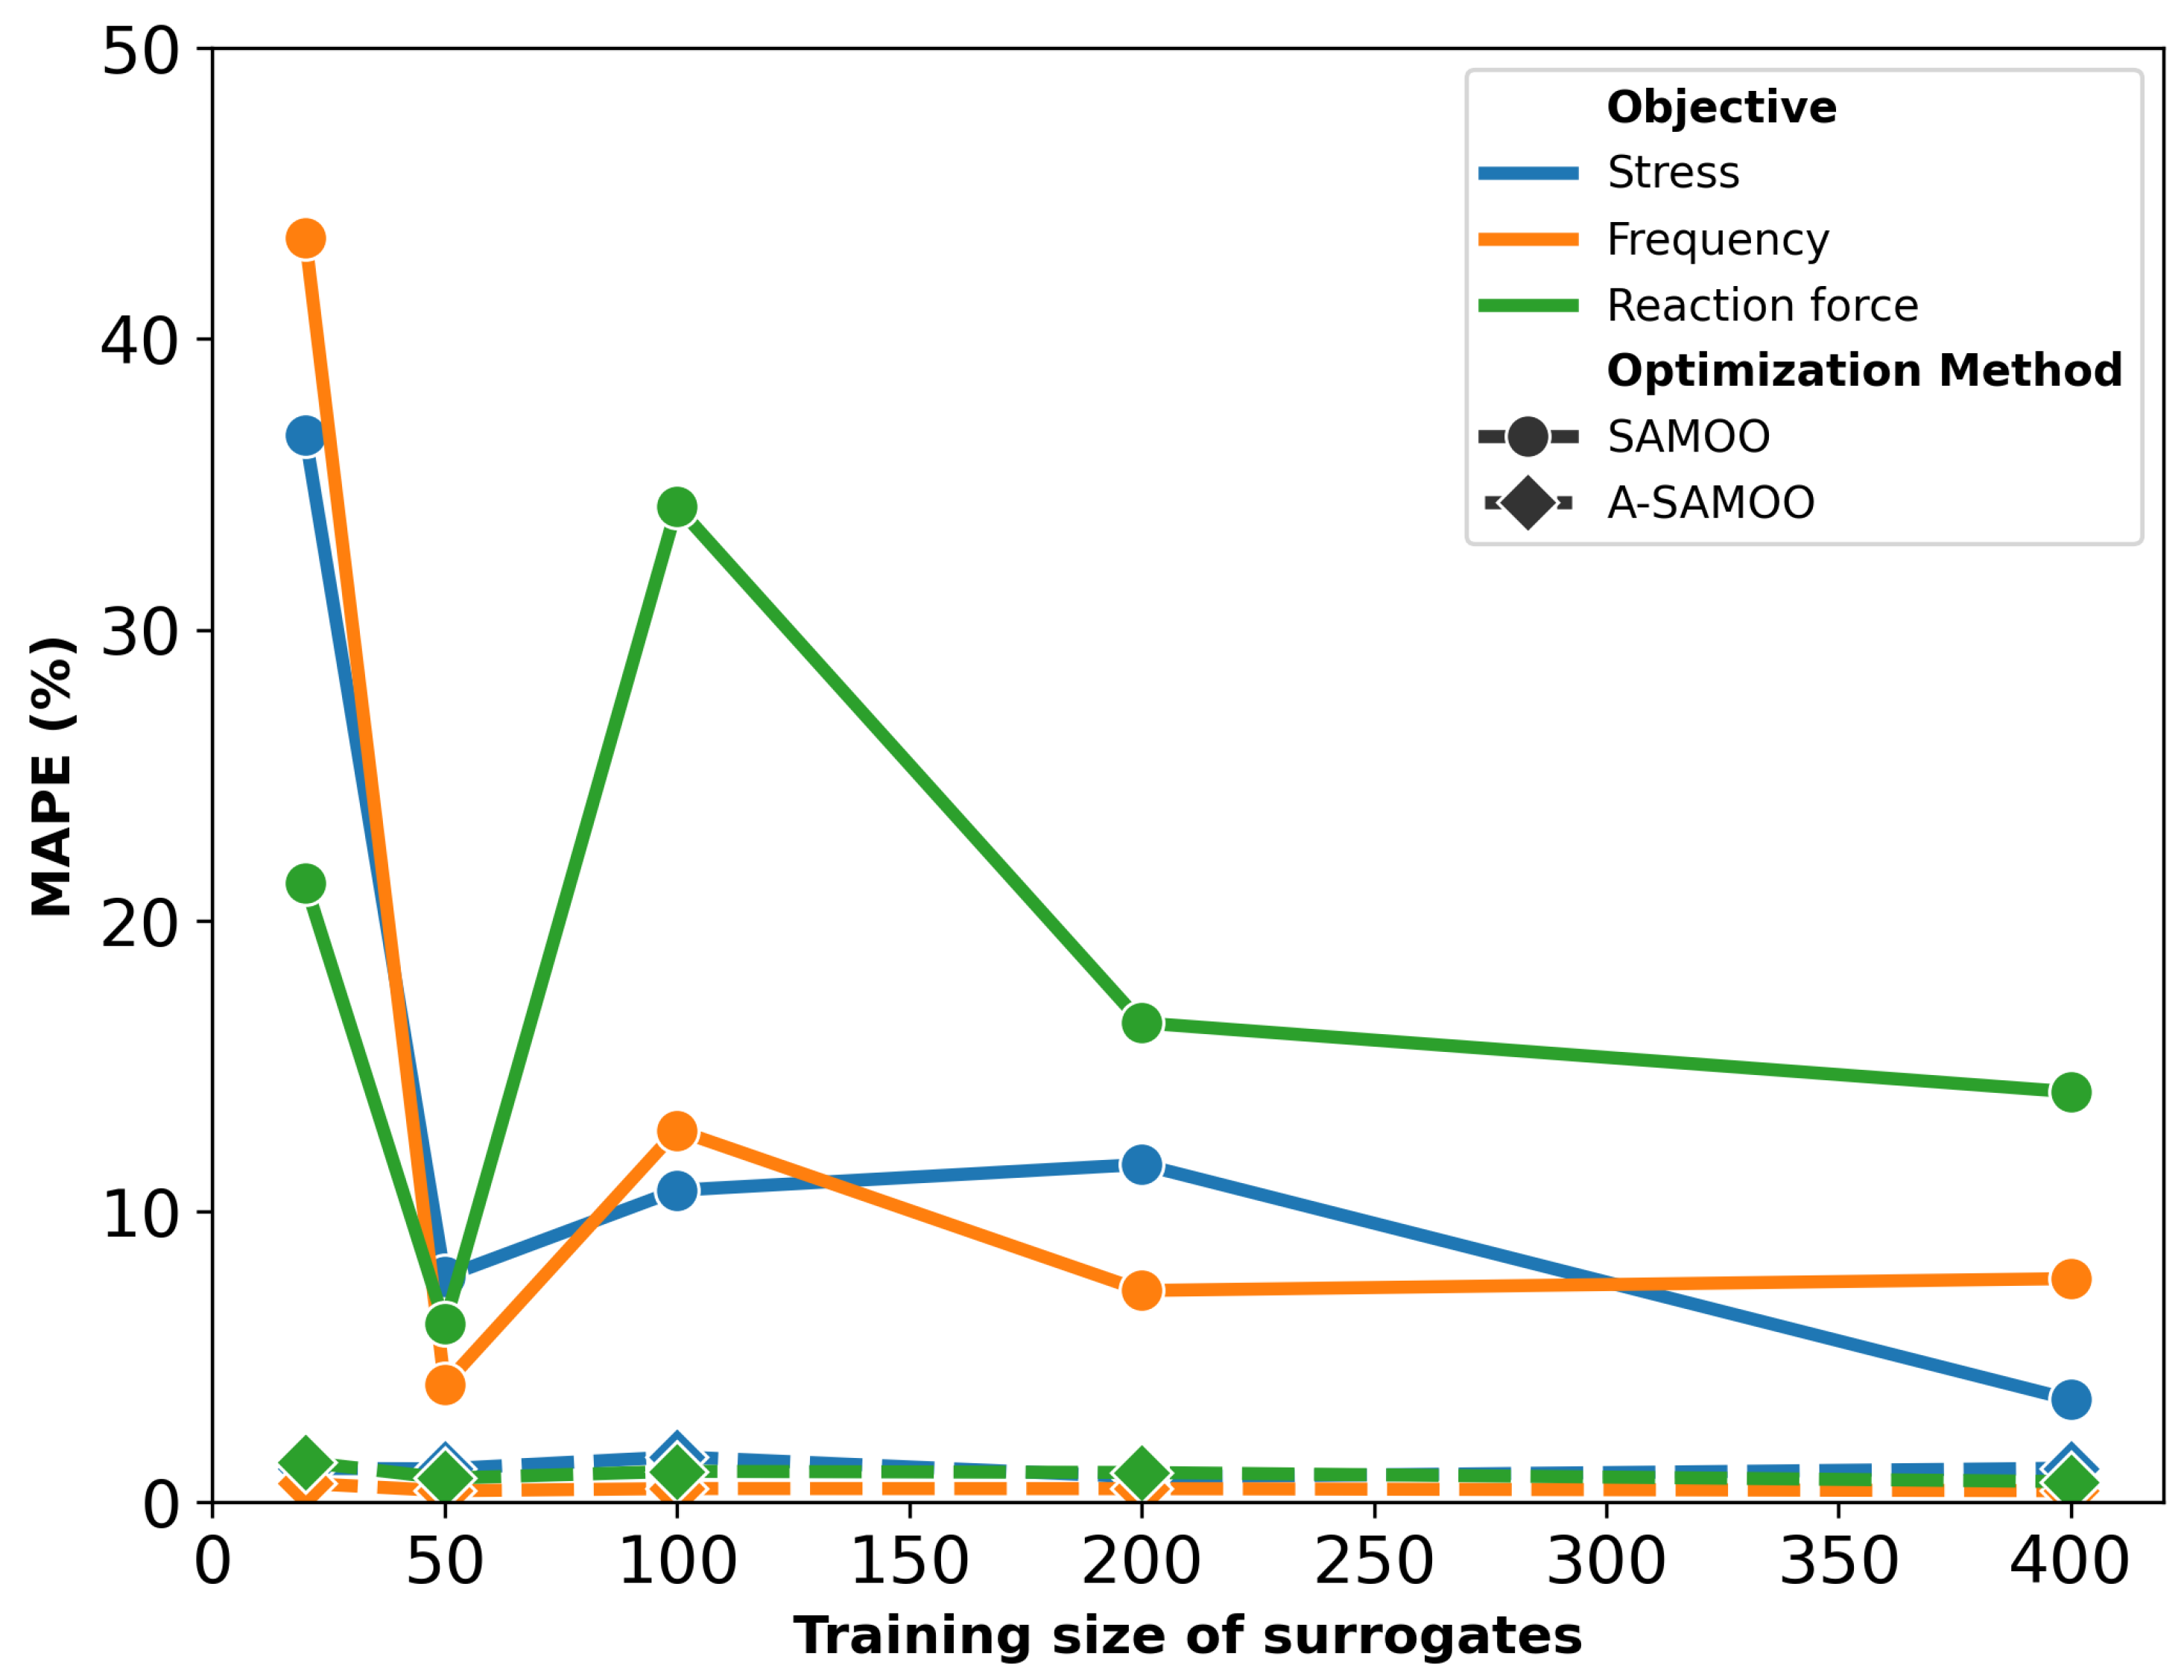
After optimization is conducted using both SAMOO and A-SAMOO, the resulting solutions are evaluated through simulation to assess their quality.
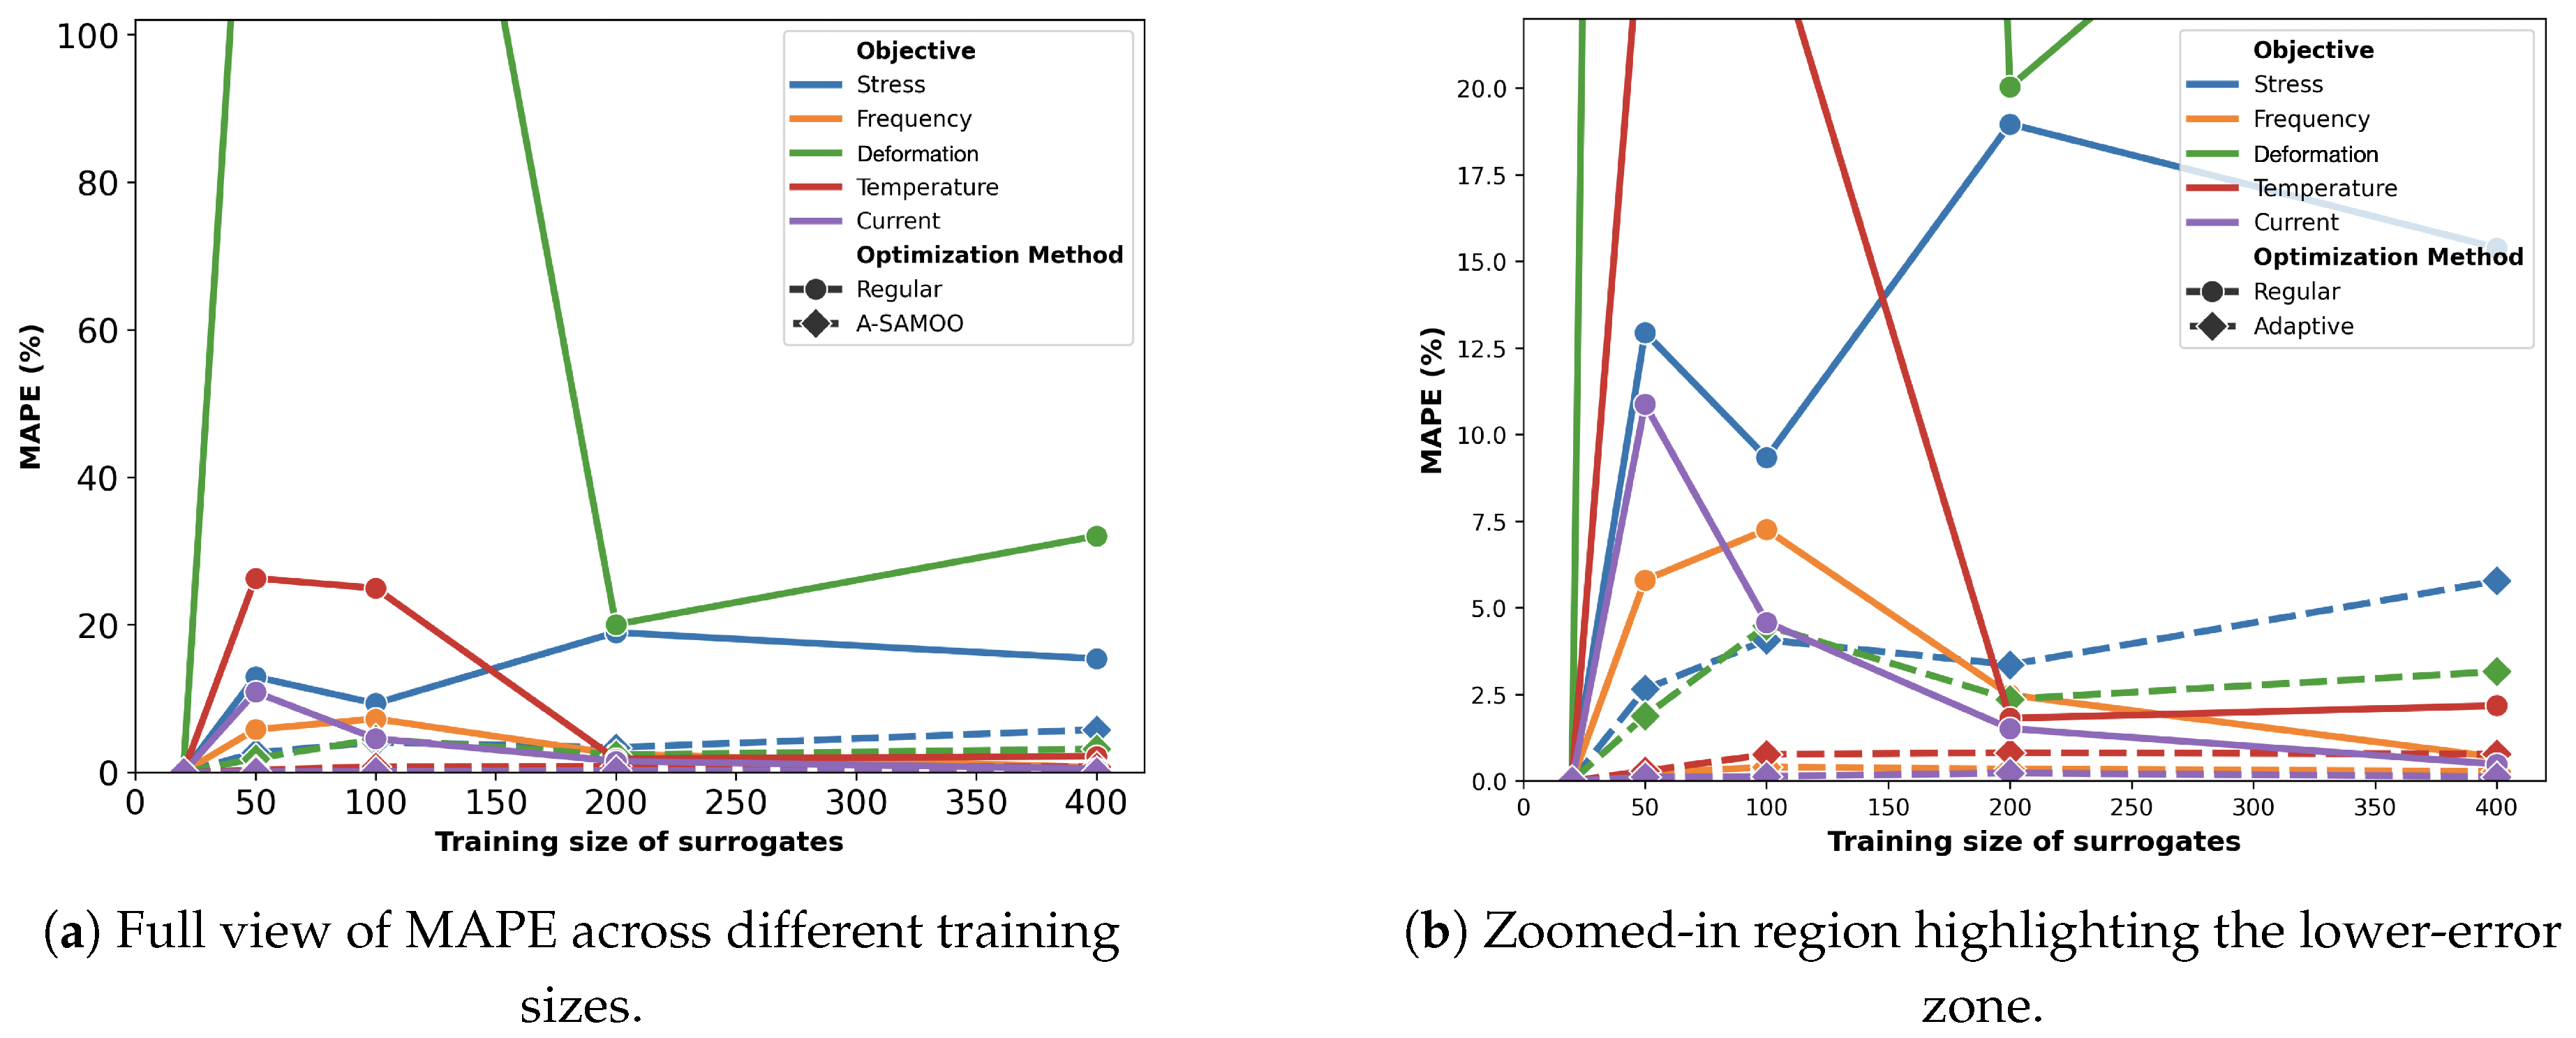
Figure 4 demonstrates the MAPE of all objectives after the optimization for both algorithms. As it can be viewed, the error for A-SAMOO is significantly lower. For the sampling size of 200, for instance, the MAPE values are just 0.87%, 0.47%, and 1.02% for stress, frequency, and reaction force, respectively. This can be explained by the fact that optimal solutions or likely concentrated in a small region of the design space and the static modeling technique simply leaves those regions under-sampled. However, A-SAMOO, updates the model in promising regions that could benefit from higher accuracy. Another important outcome is that the optimizer is less vulnerable to being misled by inaccurate surrogate predictions to sub-optimal directions. It is noteworthy that A-SAMOO, even with the smallest surrogate model (size 20), still performed significantly better in terms of accuracy compared to the largest model used in SAMOO, which was trained on 20 times more data points.
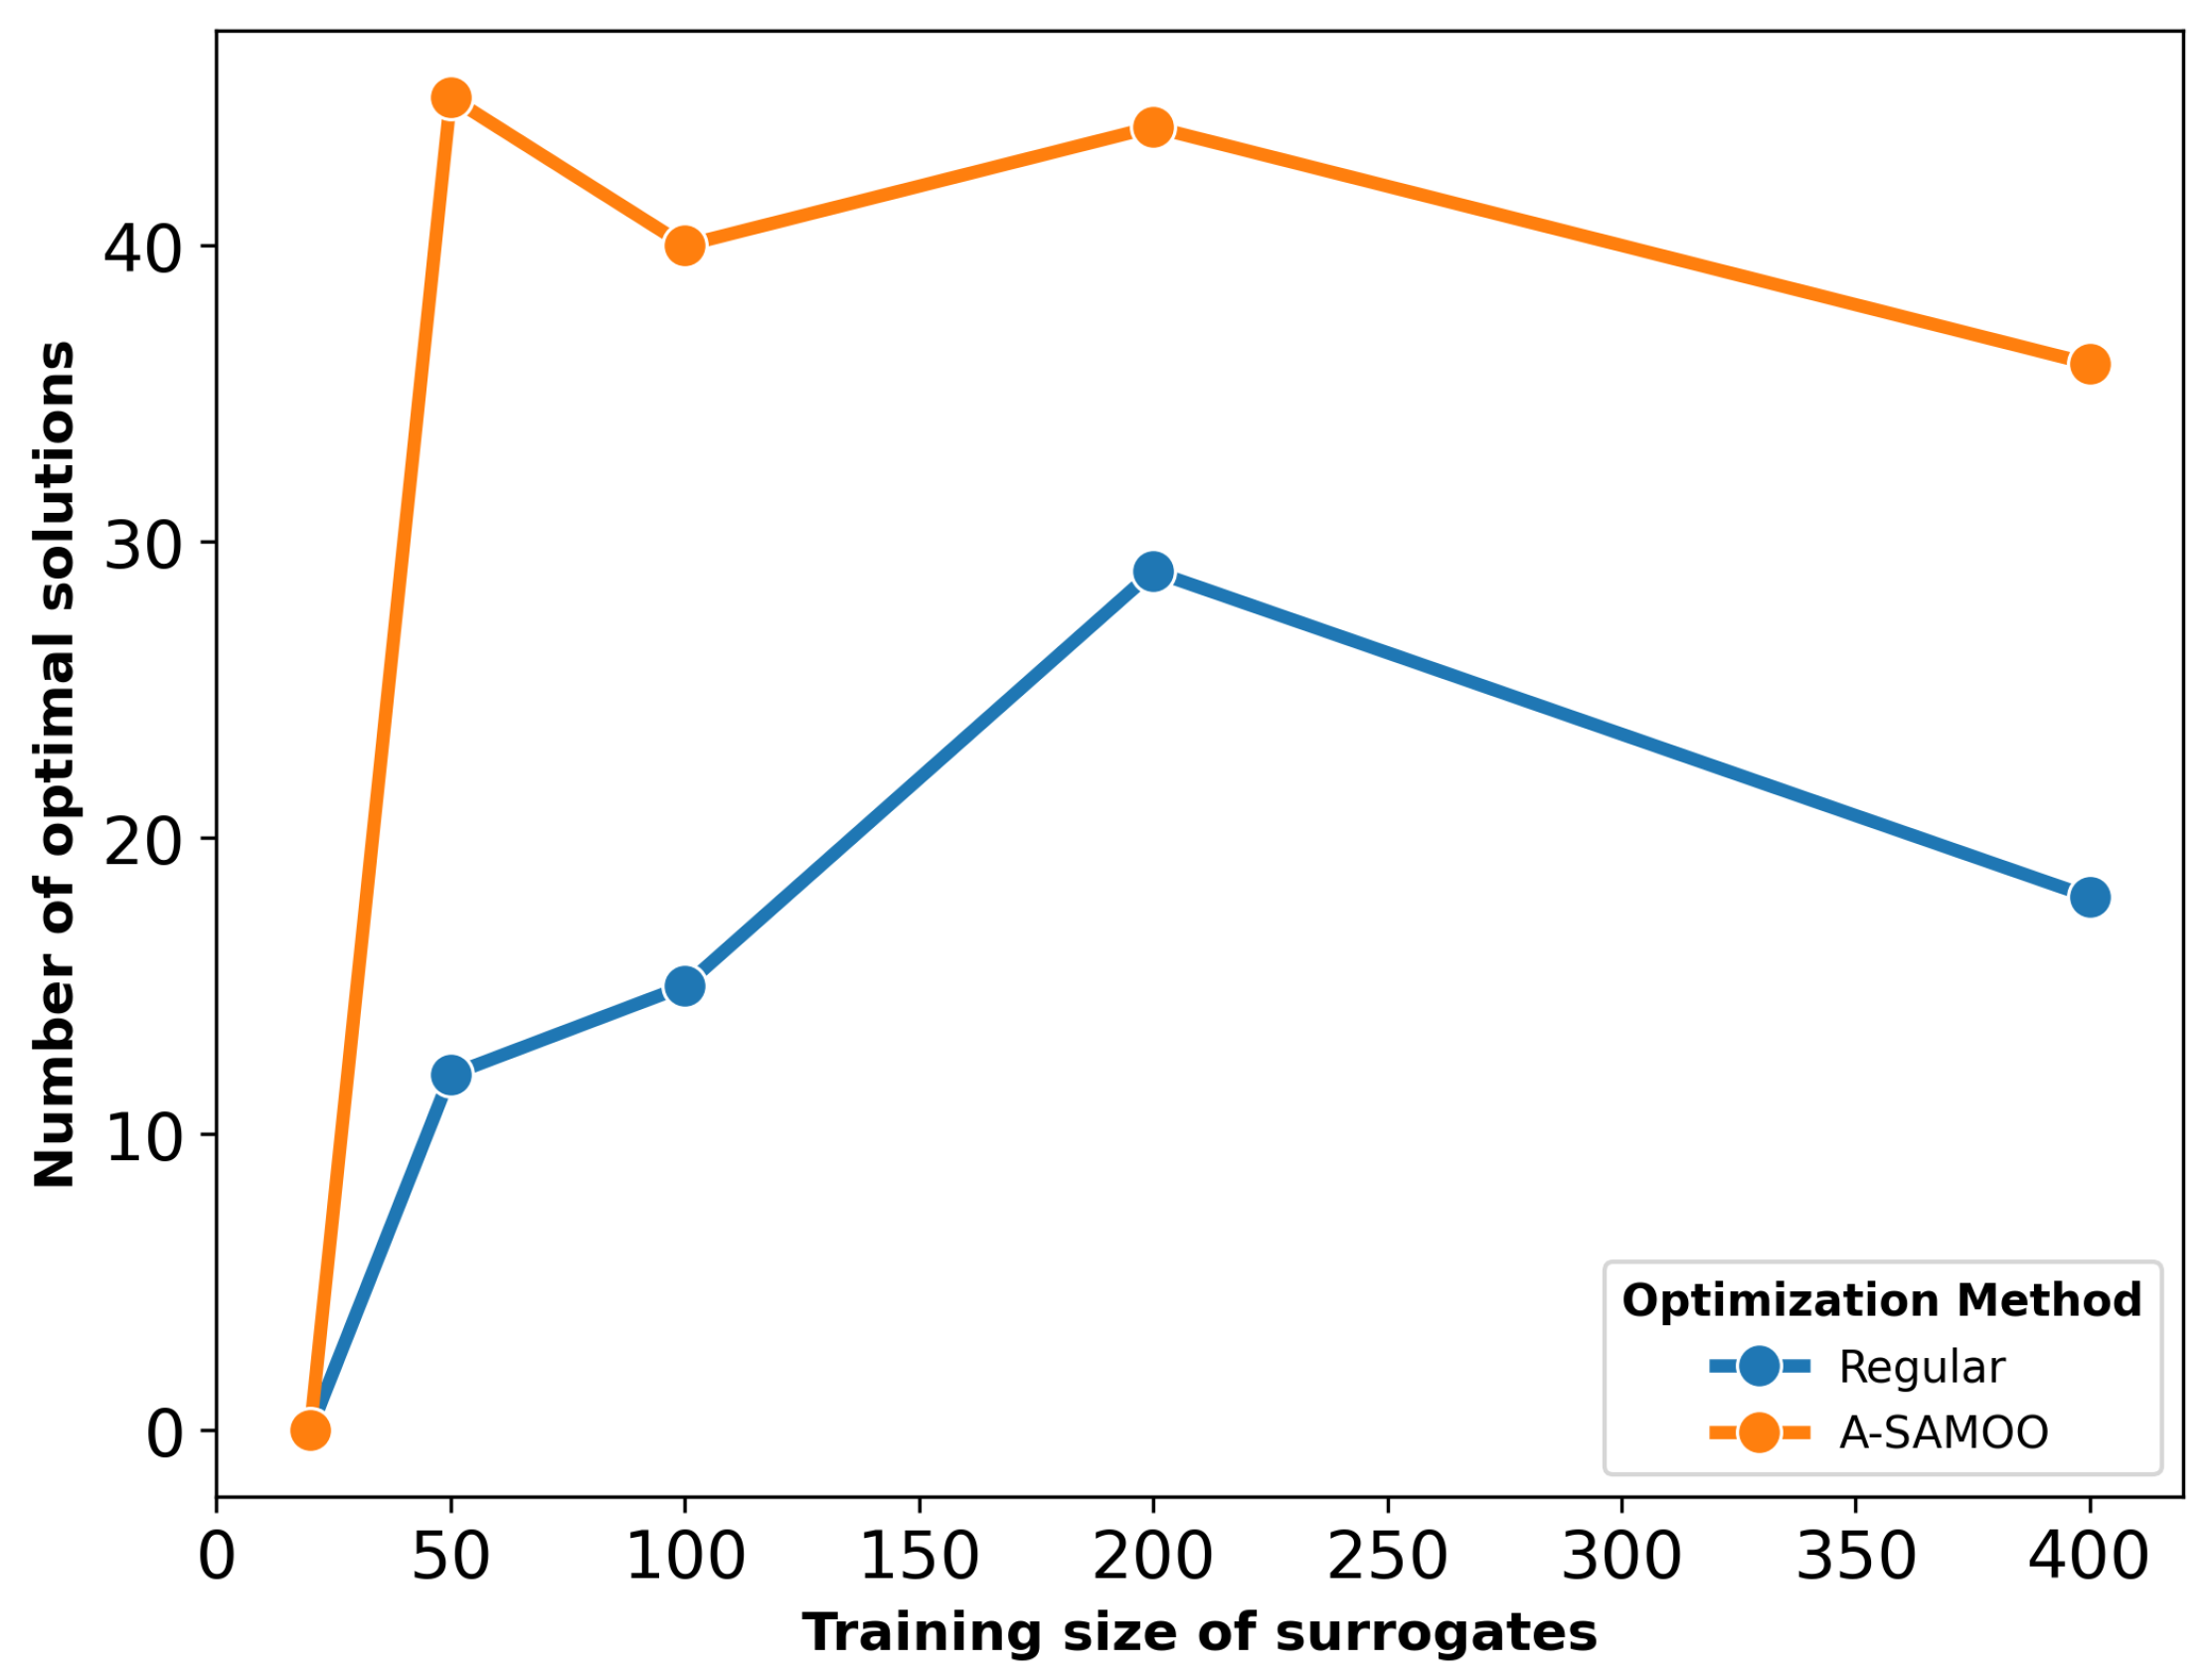
The number of optimal solutions produced is another critical aspect of optimization results. Both SAMOO and its adaptive variant predicted that all the solutions they returned are optimal. The term optimal refers to the union of solutions that are within objective constraints and are Pareto-optimal (non-dominated with respect to each other). However,
Figure 5, which depicts the number of optimal solutions, suggests otherwise.
Once again, A-SAMOO performs significantly better, as the number of its optimal solutions is very close to the maximum possible, the population size of 50. In contrast, the numbers are lower for SAMOO. This discrepancy is due to the lower prediction quality of its surrogate model.
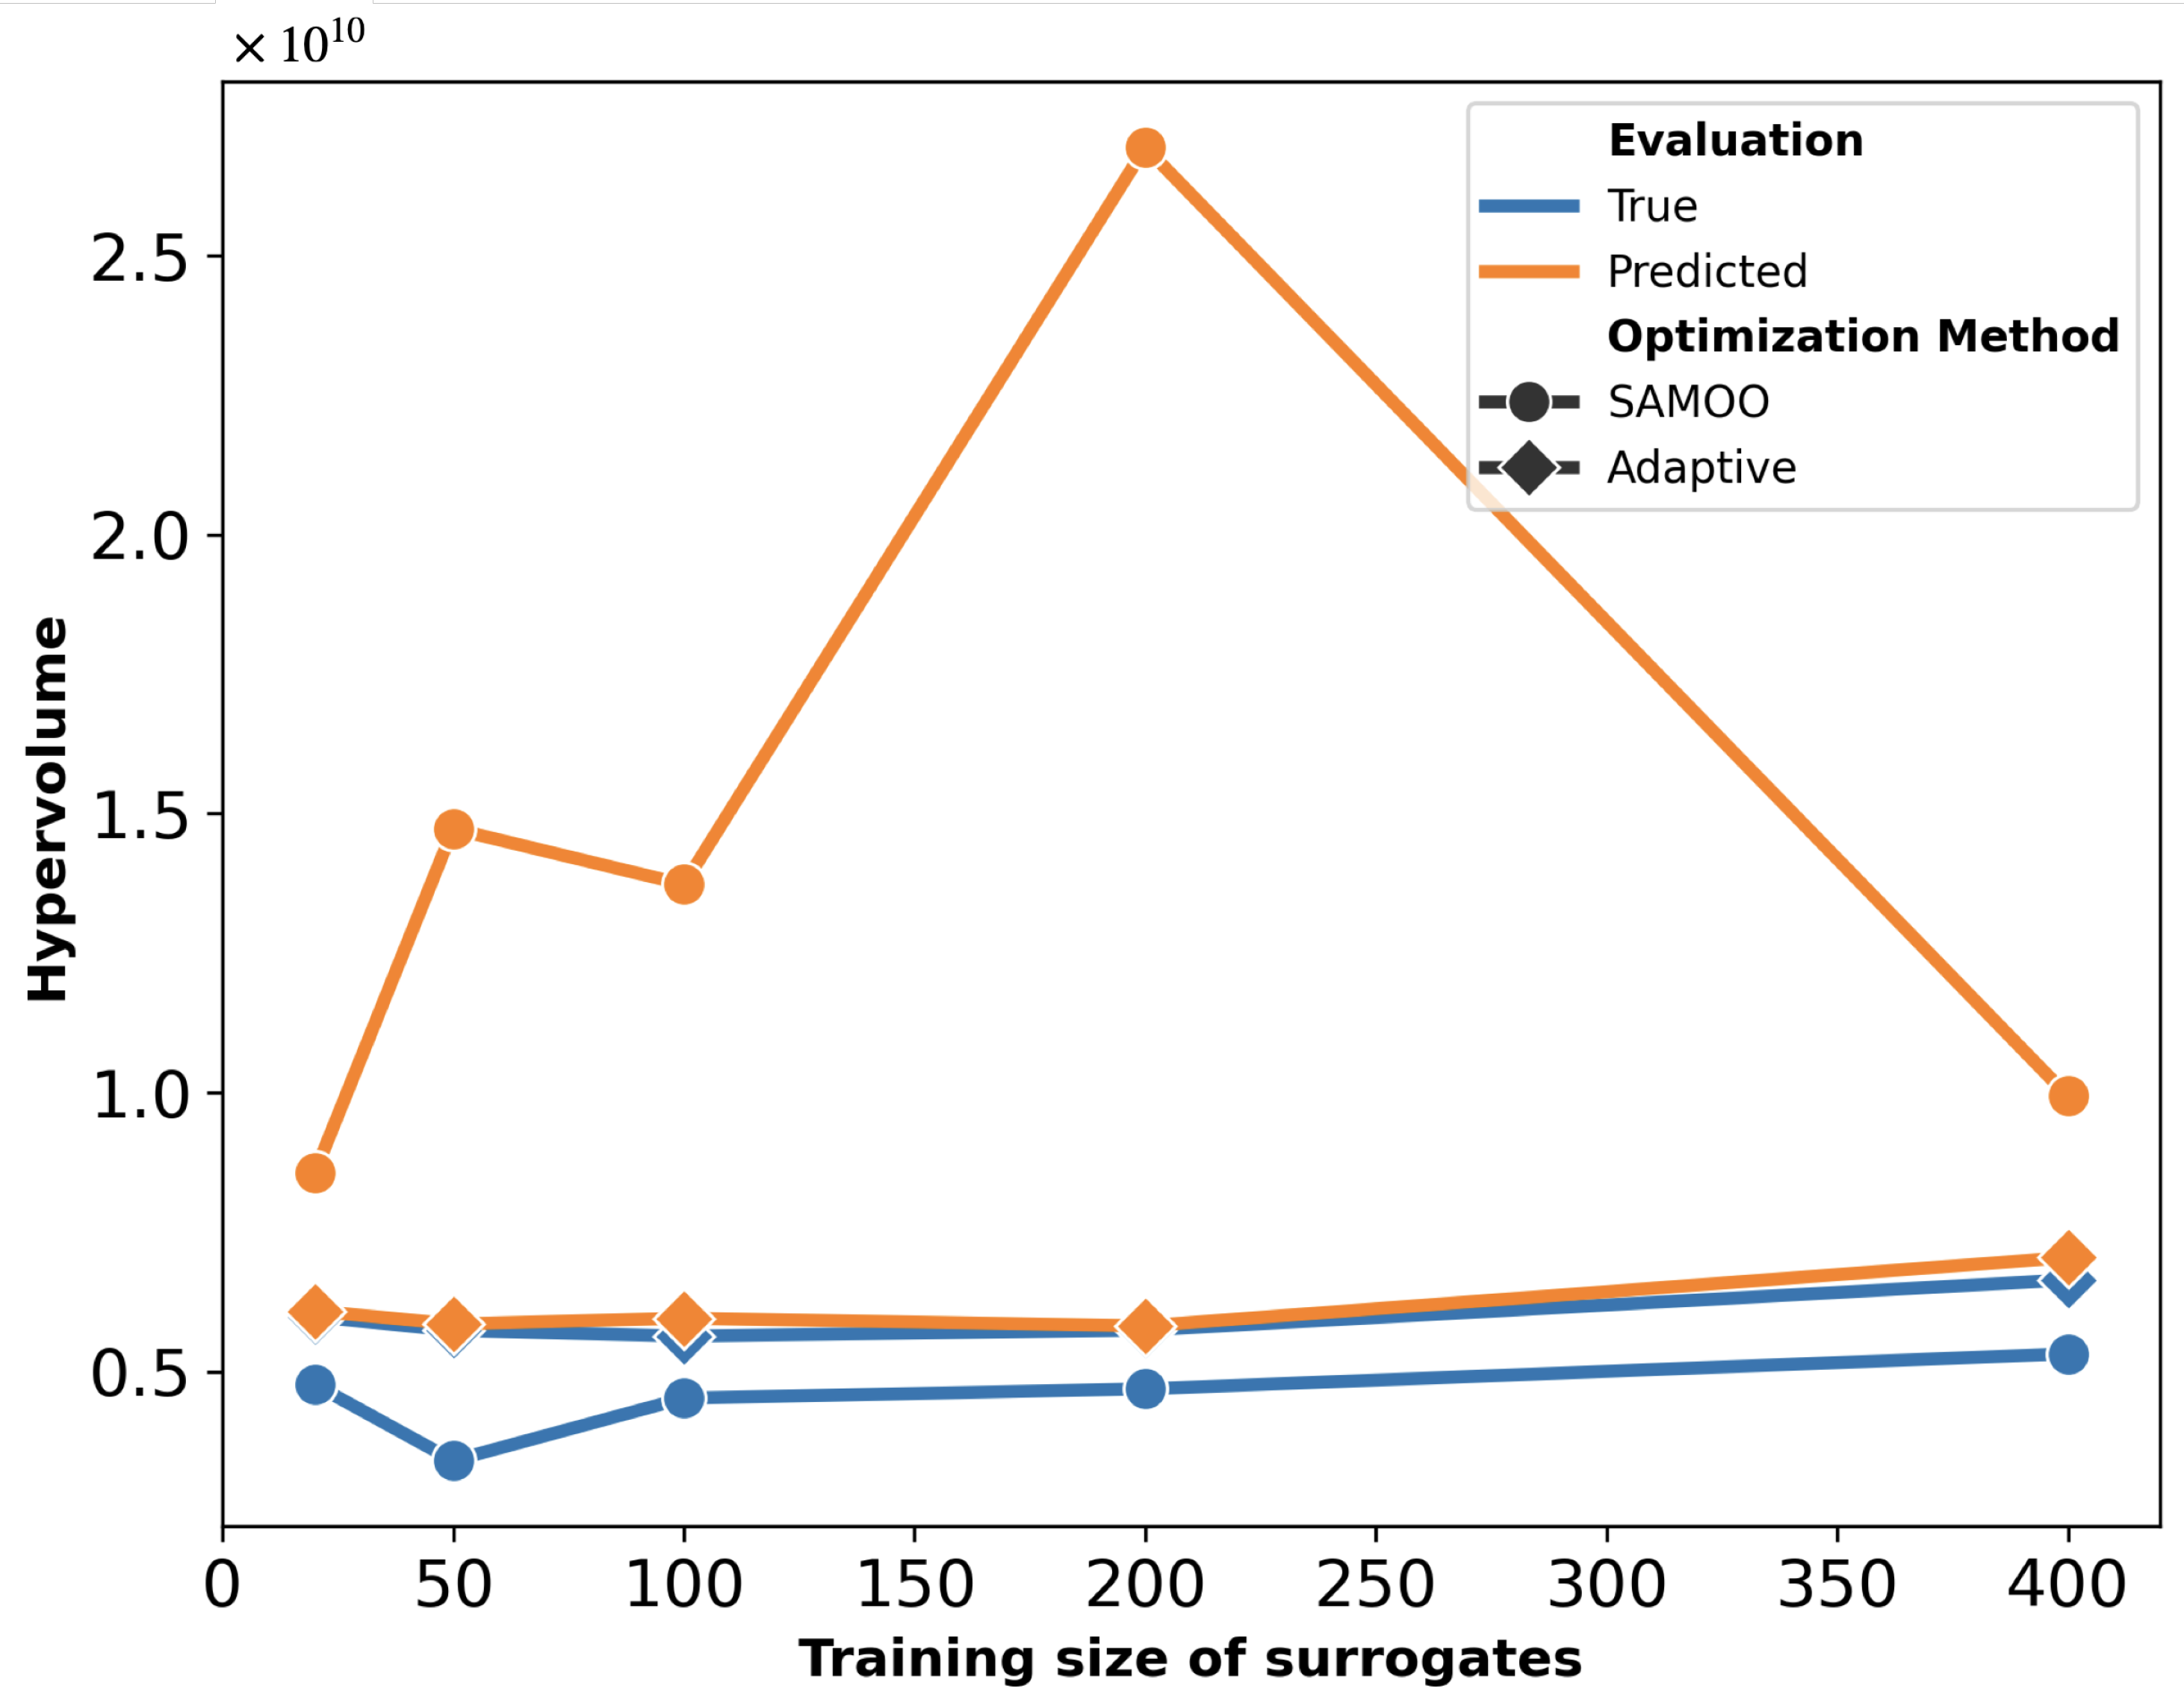
The hypervolume quality metrics for the solution sets of both algorithms are shown in
Figure 6. The “Predicted” values represent the hypervolume measured immediately after optimization, while the “True” values correspond to the results after FEM re-evaluation. This plot can be interpreted from two perspectives. Firstly, for each scheme, the predicted hypervolume exceeds its true value, indicating that the optimizer overestimated solution quality. This discrepancy is notably larger for SAMOO, especially with smaller training sizes. In contrast, A-SAMOO’s predicted and true hypervolumes nearly overlap, suggesting that online learning significantly aids the optimizer in providing a more accurate estimate of its results. Secondly, regarding the hypervolume values themselves, those for A-SAMOO are consistently higher, indicating that the quality of its solutions is superior. Similar to the observations in
Figure 5, even the smallest adaptive model outperforms the largest surrogate model used in the other algorithm.
4.2. Serpentine Lorentz Force Actuator
The second MEMS studied in this work is a more complex version of the actuator in
Section 4.1 with the distinction that the crossbar is attached to serpentine structures that act as springs. Hence, the MEMS device is called the serpentine Lorentz force actuator, illustrated in
Figure 7. This actuator has an additional discrete design variable
corresponding to a number of spring turns that ranges from 1 to 10. Three new objectives, operational temperature difference compared to ambient condition (25 °C or 298 K), current, and voltage participate in the optimization, all of which to be minimized. Eigenfrequency and solid mechanics studies are similar to those of the U-shaped actuator mentioned in
Section 4.1. The thermal solution is only considering Joule heating and thermal conduction since it is a DC current flow and very small temperature differential. Due to the additional complexity and the introduction of thermal study, the average simulation time is longer compared to that of the U-shaped actuator, being 26.2 s. The objectives and their allowed ranges are listed in
Table 5.
The mean absolute percentage error (MAPE) for surrogates trained on various sampling sizes and preprocessing methods are plotted in
Figure 8. Similar to the U-shaped actuator, the combination of log scaling and normalization produced the most accurate models.
However, there are key differences compared to
Figure 3. First, the actuator with serpentine springs shows generally higher error values due to its increased complexity, which demands more data for accurate modeling. Second, unlike the simpler U-shaped actuator, resonant frequency is not the most accurately predicted objective for the more complex Lorentz force actuator. The addition of serpentine springs has increased the complexity of frequency modeling more than that of stress and reaction force.
Figure 9 presents, as an example, the actual versus predicted plot for the surrogate model trained with the best-performing scaling method and a sample size of 200. Most data points lie close to the
line, indicating reasonable predictive accuracy despite the increased complexity.
As shown in
Figure 10, the error values for SAMOO solution sets after optimization are excessively high. This results from two main factors: the use of initial lower-quality surrogates compared to those for the U-shaped actuator, and the additional design variable and complexity. A-SAMOO generates much more accurate results, though the errors remain higher than those in
Figure 4.
The substantial improvement in optimization results achieved by A-SAMOO over SAMOO is further supported by the higher number of desirable solutions and the greater hypervolume, as shown in
Figure 11 and
Figure 12, respectively.
4.3. Thermal Actuator
Another MEMS considered for the optimization in this work is the thermal actuator. As it can be seen in
Figure 13, the actuator consists of two primary hot and cold arms. The difference in cross-sectional area of the arms mean that the narrower one reaches significantly higher temperatures and as a result, expands to a larger degree. This differential expansion results in a bending motion, and hence, deformation, which is the core functionality of such devices.
Similar to Lorentz force actuators, the material chosen for the thermal actuator structure is polycrystalline silicon, with the same parameters as those listed in
Table 2. The width and length of the junction between the two arms is equal to the width of the hot arm.
At micro-scale, heat transfer via radiation is negligible [
46,
47]. Furthermore, conduction dominates convection [
48]. Hence, for the thermal modeling, it is assumed that the only form of heat transfer is via conduction to the substrate. Meshing type is set to “Physics-controlled” with the automatic size of “Extra fine”. The average computation time was 22 s.
Six design variables, provided in
Table 6, are considered. The width and length of the cold arm are determined via ratios of those of the hot arm. By using ratios, we can easily adjust the relative dimensions of the cold arm to modify the structure geometries without being constrained by absolute measurements. This also allows us to assess our optimization scheme in cases where some design variables are ratios and not geometric variables.
Five objectives are chosen for the optimization, shown in
Table 7. Temperature refers to the temperature difference of the hottest spot in the structure, under operation, to that of the ambient condition. Similar to Lorentz force actuators, all objectives are to be minimized, except for the resonant frequency and deformation.
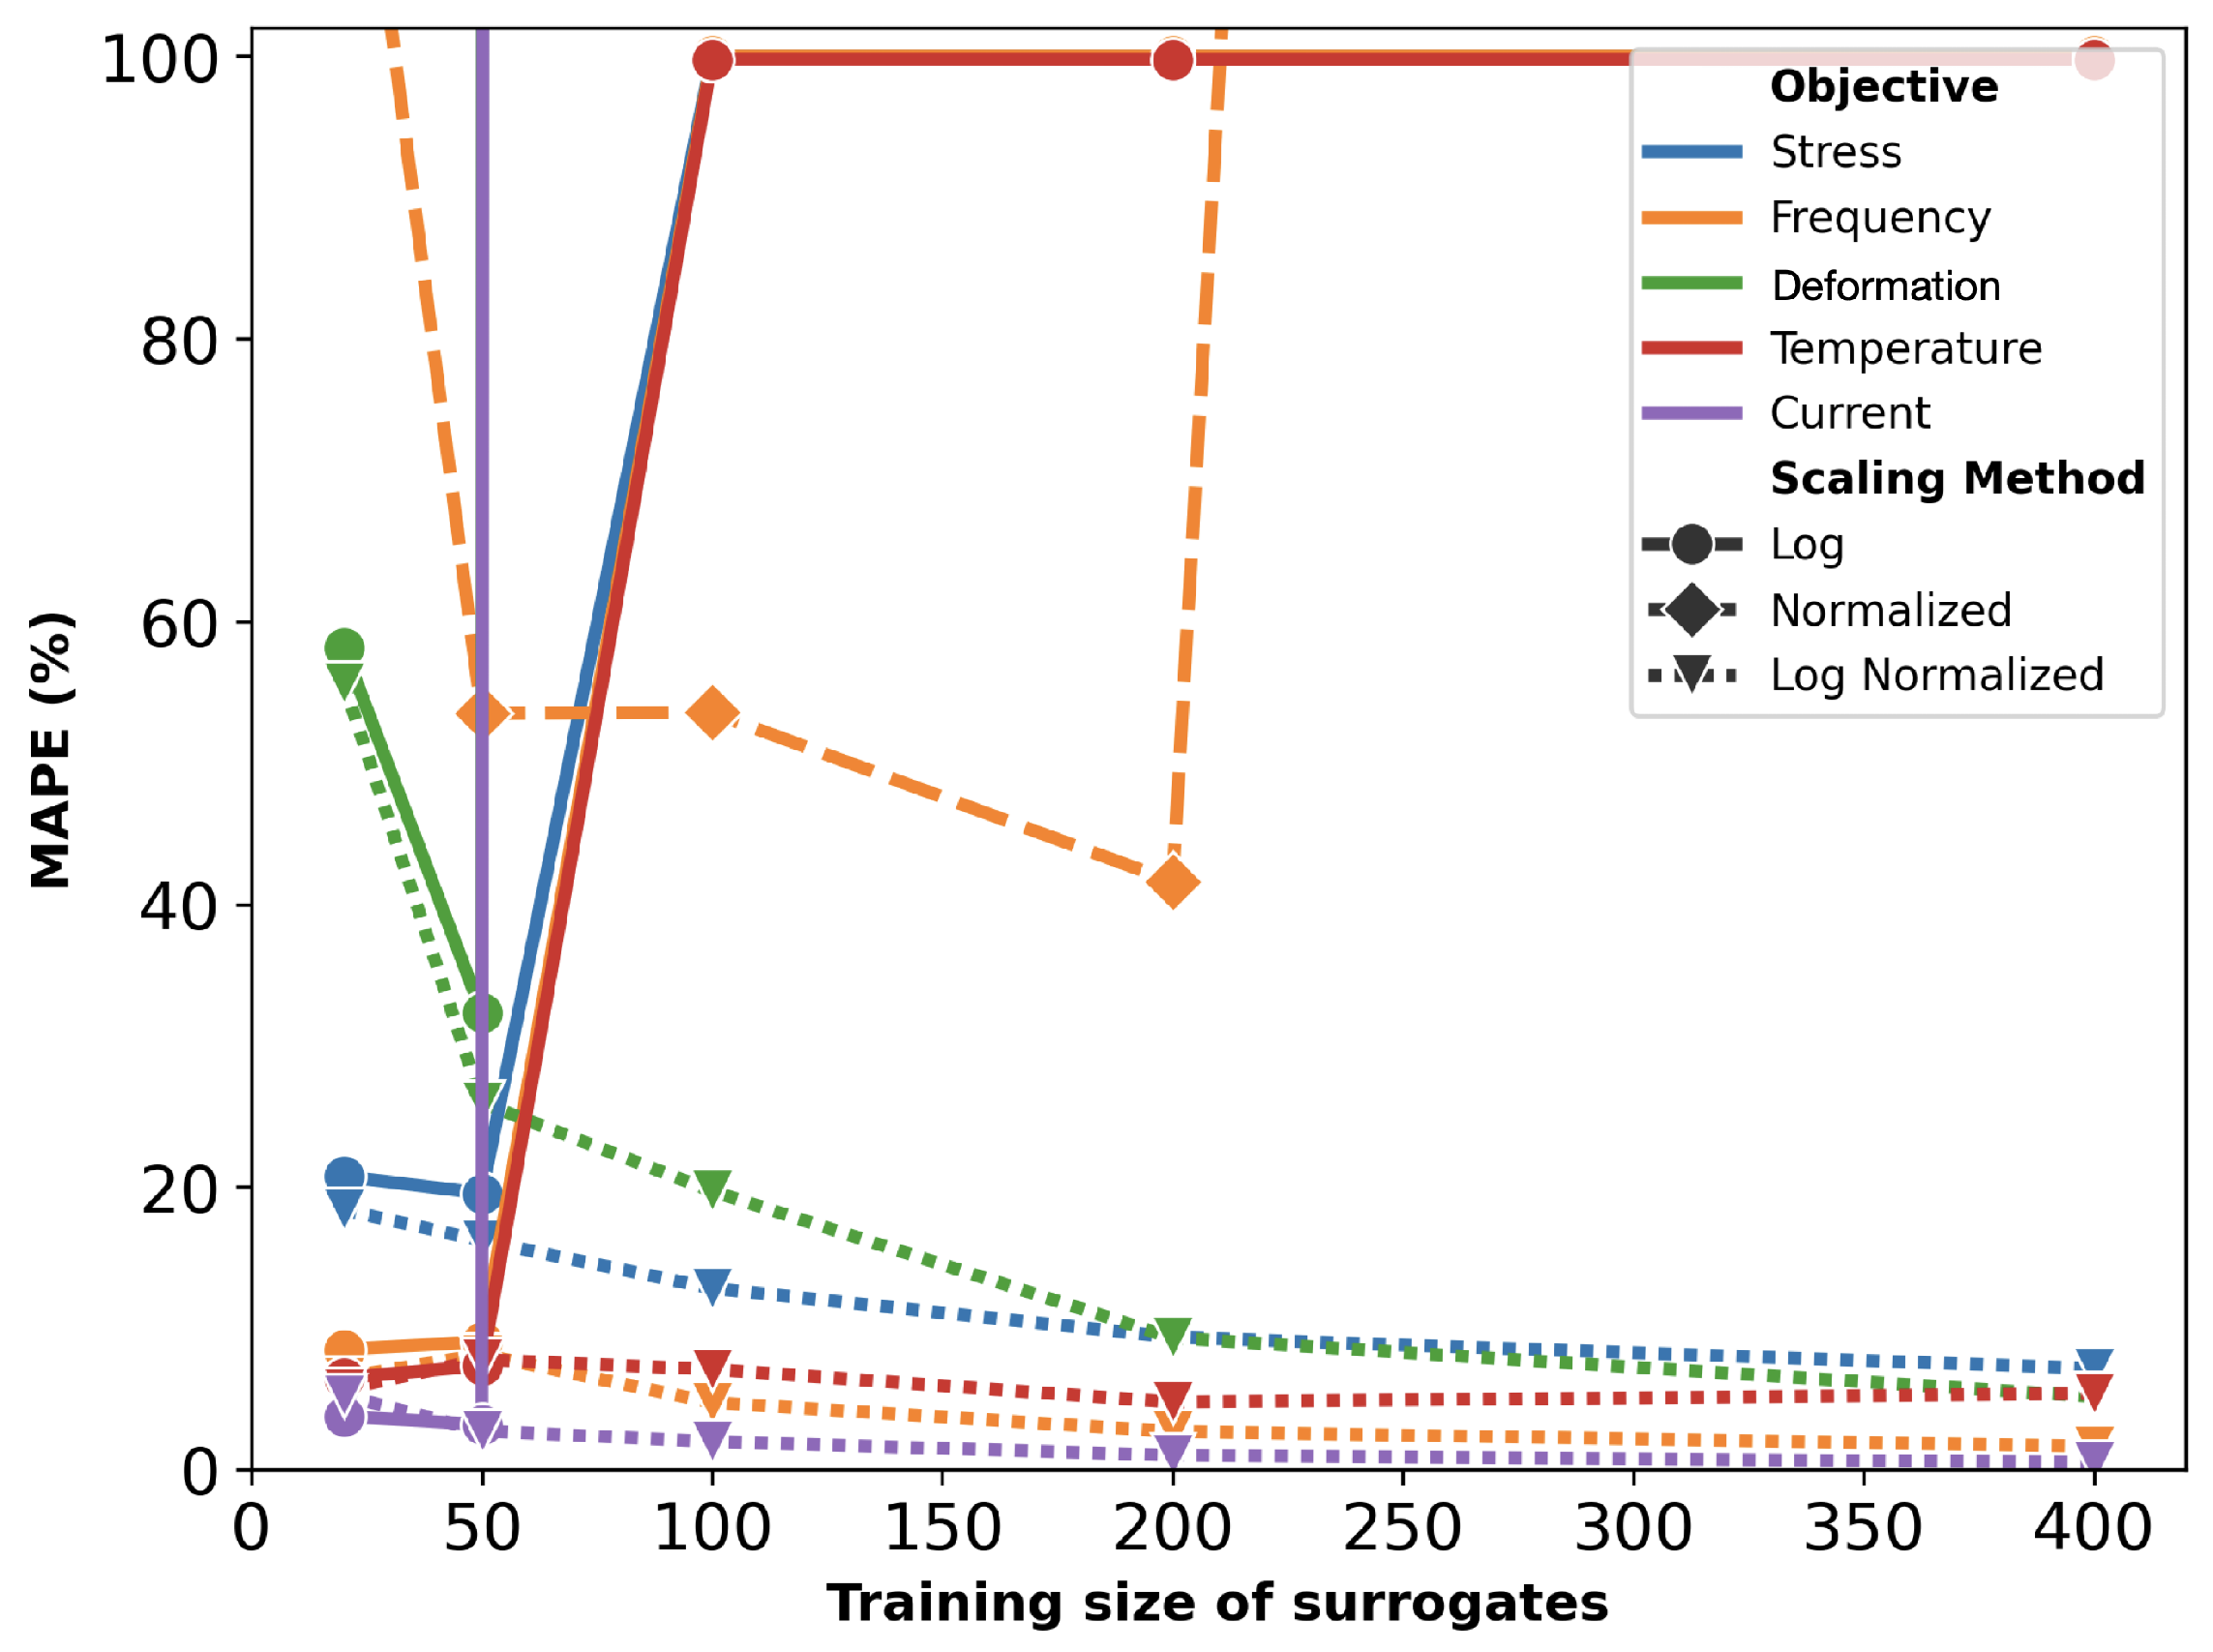
Figure 14 illustrates the MAPE for surrogate models trained with varying dataset sizes for the thermal actuator. The choice of scaling method significantly influences the predictive accuracy of the surrogate models. Error values corresponding to log scaling and normalization are generally larger than 100% and therefore do not fit in the plot. Similar to previous cases, the combination of log scaling and normalization consistently provides the most accurate predictions.
In contrast to previous actuators, the thermal actuator does not benefit as much from log scaling alone. This difference is likely attributable to the considerably broader range of objectives associated with the thermal actuator, where most objectives span at least three orders of magnitude, excluding the resonant frequency; while the specific reasons for the heightened impact of normalization remain unclear, it is evident that the wide range of values plays a critical role in shaping the predictive performance. As an example, actual vs. predicted plots of objectives for surrogates with the training size of 200 are provided in
Figure 15, demonstrating accurate predictions, particularly for current.
The MAPE values after optimization are provided in
Figure 16. With a training size of 20 samples, the optimizer fails to produce any optimal designs, making MAPE reporting irrelevant—an issue not previously encountered, even with adaptive optimization. This can be attributed strict objective constraints. For instance, the average stress value of initial samples was 2.82 × 10
9 Pa, nearly 10 times that of the constraint. For deformation, the average was 5.29 μm, only slightly better than the constraint, 5 μm.
Figure 17 shows the number of optimal solutions versus training sizes for surrogates used in optimization. The results reaffirm that online training in the A-SAMOO approach enables the NSGA-II optimizer to find more optimal solutions compared to offline training.
Figure 18 further supports the advantages of A-SAMOO through hypervolume analysis. Most training sizes show a large discrepancy between actual and predicted hypervolume values for SAMOO, suggesting that offline-trained surrogates tend to overestimate solution quality. An anomaly occurs at a training size of 400, where the actual hypervolume for regular optimization slightly surpasses that of the adaptive approach. This difference is minor and does not undermine A-SAMOO’s overall benefits. It likely arises from inherent surrogate inaccuracies, which can occasionally lead to favorable outcomes.
Surrogate inaccuracies generally lower actual hypervolumes. However, in this instance, the inaccurate prediction (e.g., predicting 180 MPa stress instead of 200 MPa) aligned favorably with the optimization objectives. This pattern, where some predicted values outperform actual results, is consistently observed across all actuators, as seen in the actual versus predicted plots.
As summarized in
Table 8, our work advances the state of the art in surrogate-assisted MEMS optimization by addressing several key limitations of previous studies; while most existing methods rely on static surrogate models, single-objective formulations, or lack proper constraint handling, our framework introduces an adaptive, multi-objective optimization approach (A-SAMOO) with integrated constraint management. By continuously refining the surrogate model during optimization, we ensure improved accuracy in the most critical regions of the design space. Furthermore, we validate our method across three distinct MEMS actuators, highlighting its robustness and general applicability. This comprehensive strategy not only enhances optimization reliability but also provides designers with a diverse set of Pareto-optimal solutions tailored to application-specific requirements.


 ,
, 


