


Pulsatile Physiological Control of Blood Pump-Cardiovascular System Based on Feedforward Compensation


Abstract
1. Introduction
2. Models and Methods
2.1. Mathematical Model
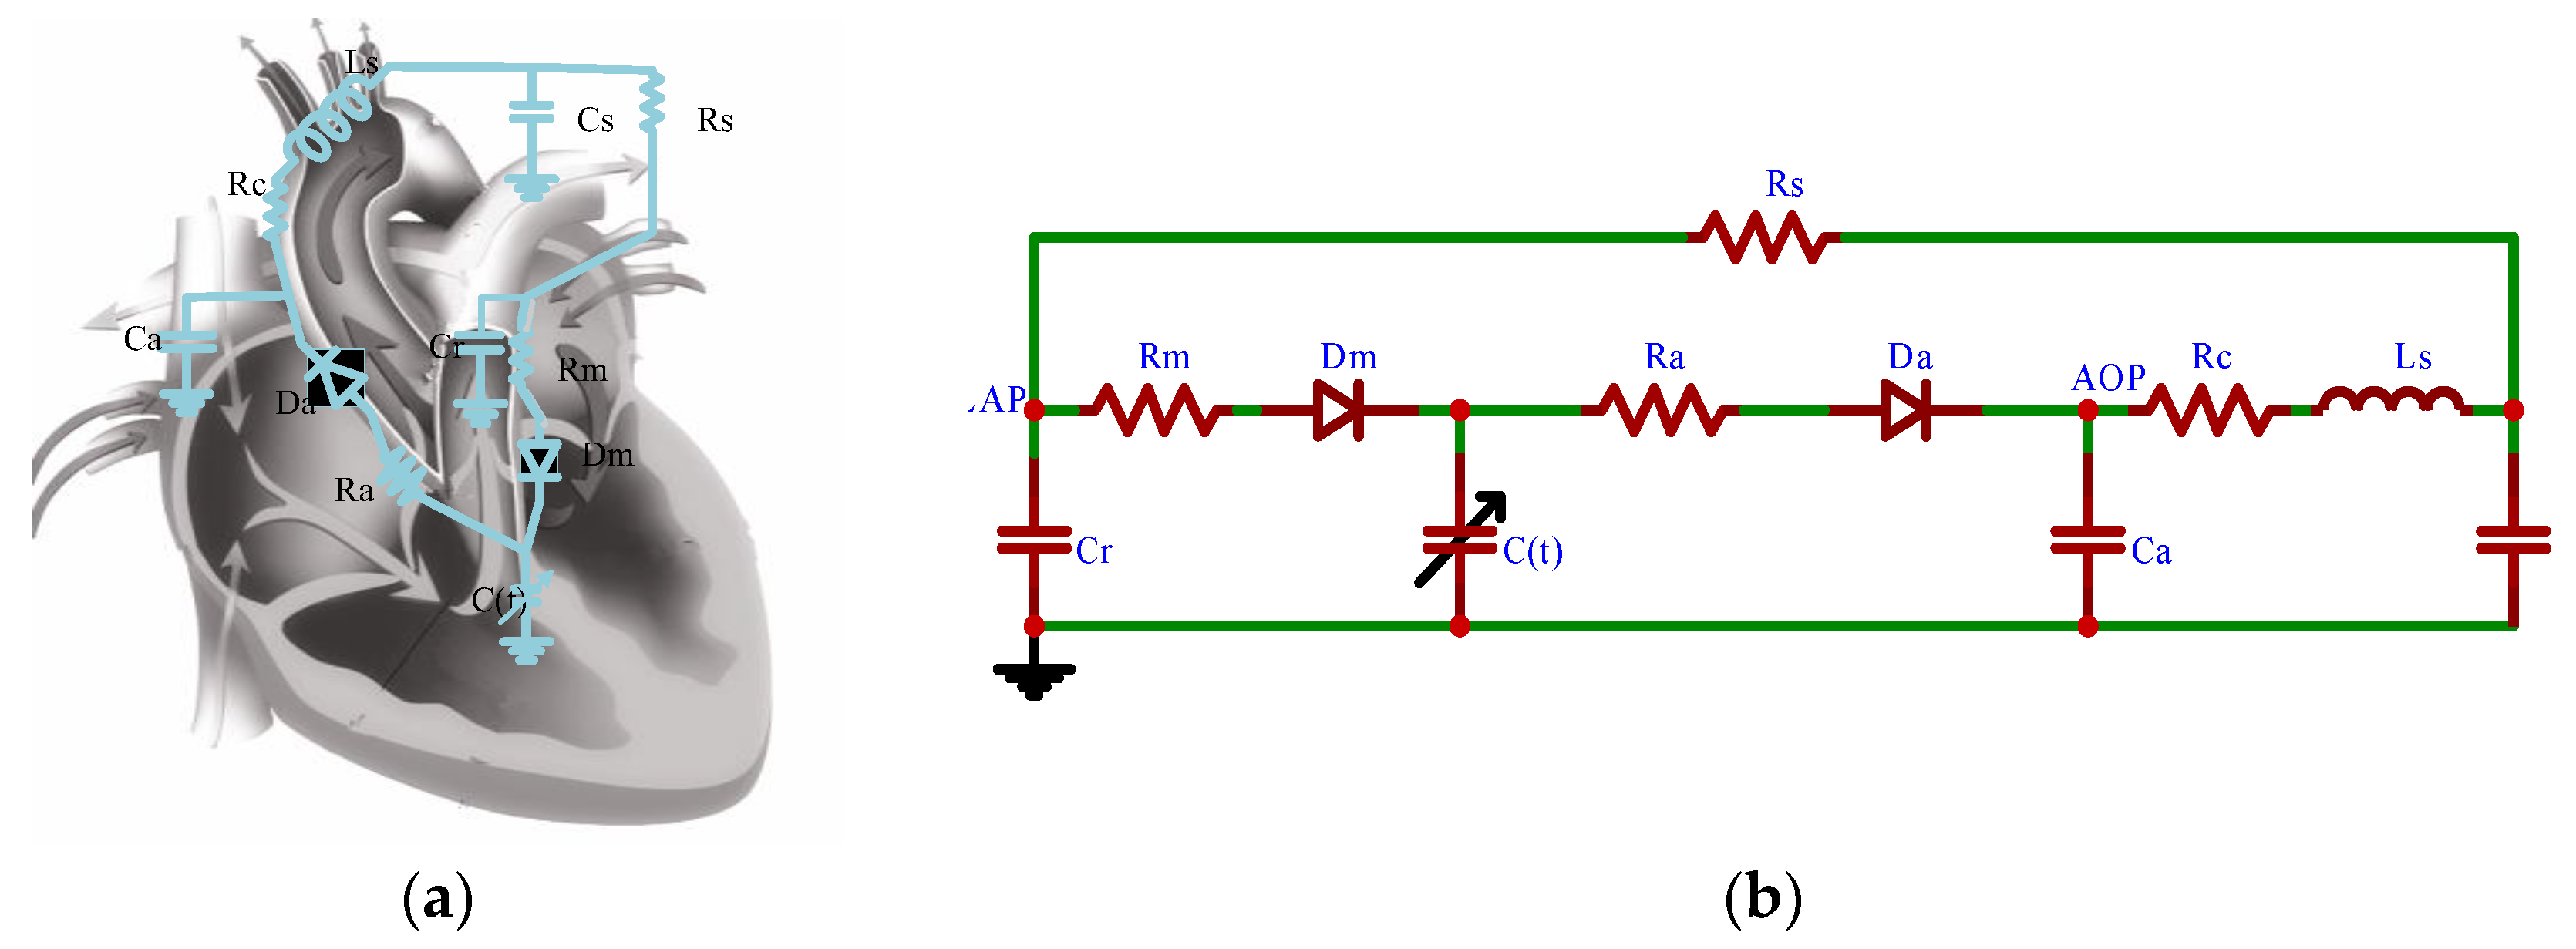
2.1.1. Vascular Network Model
2.1.2. Heart Model
2.1.3. Heart Valve Model
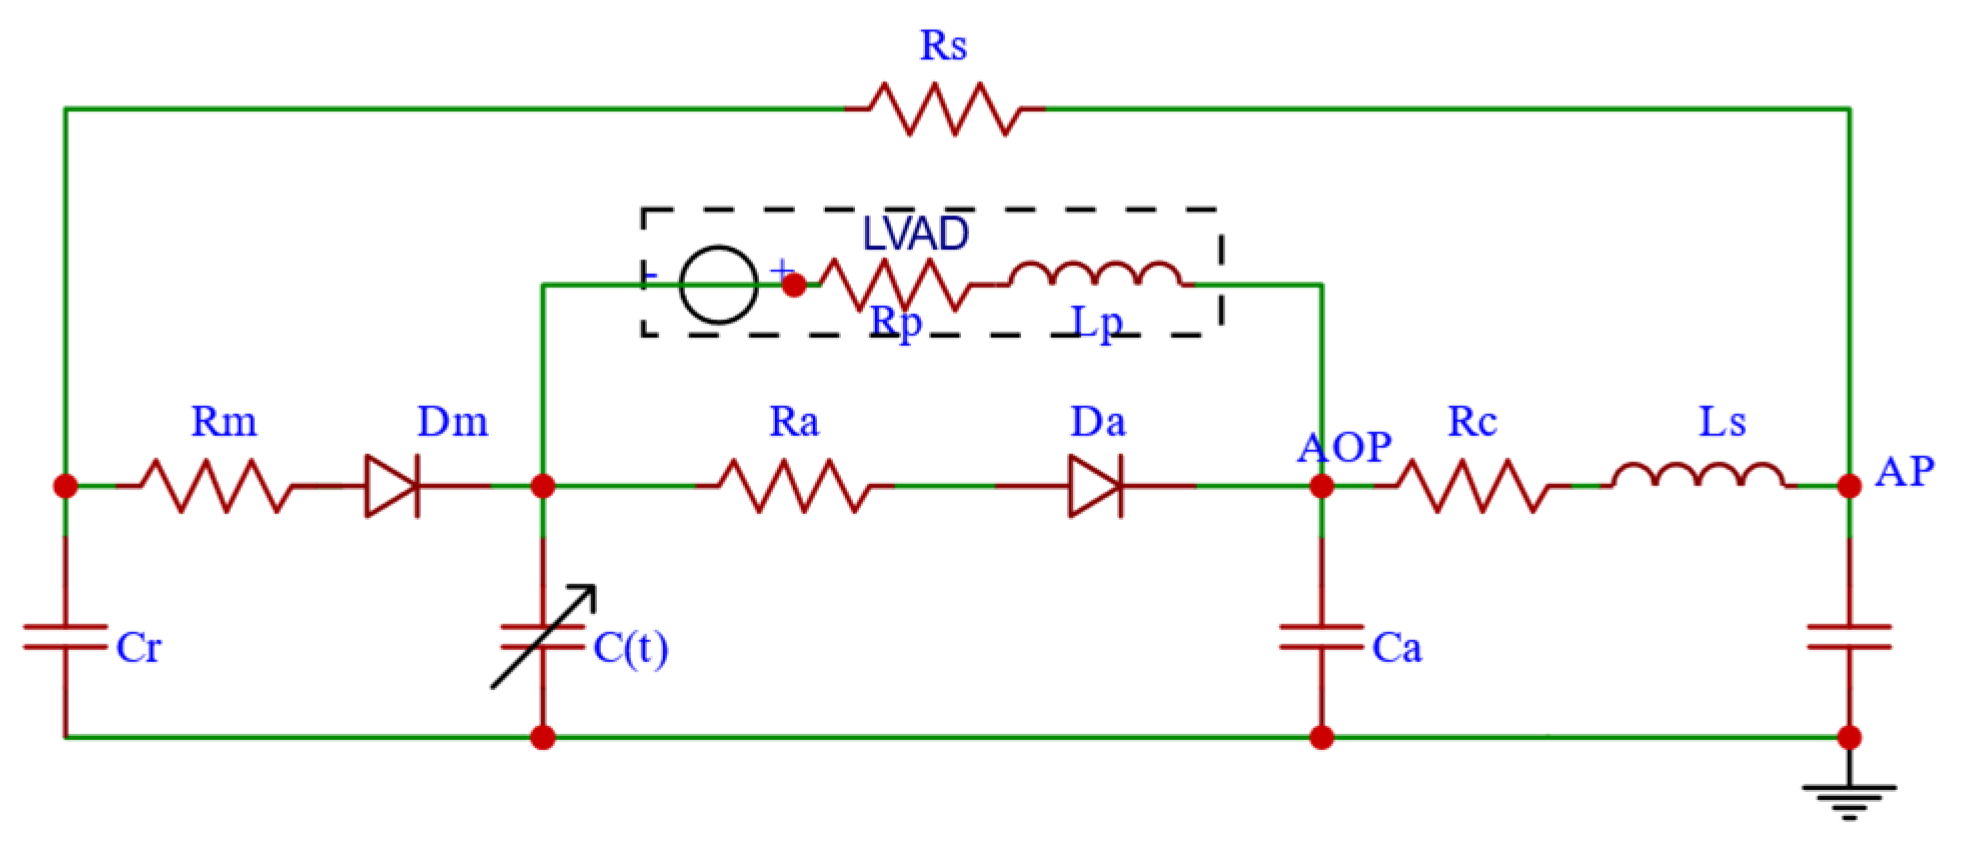
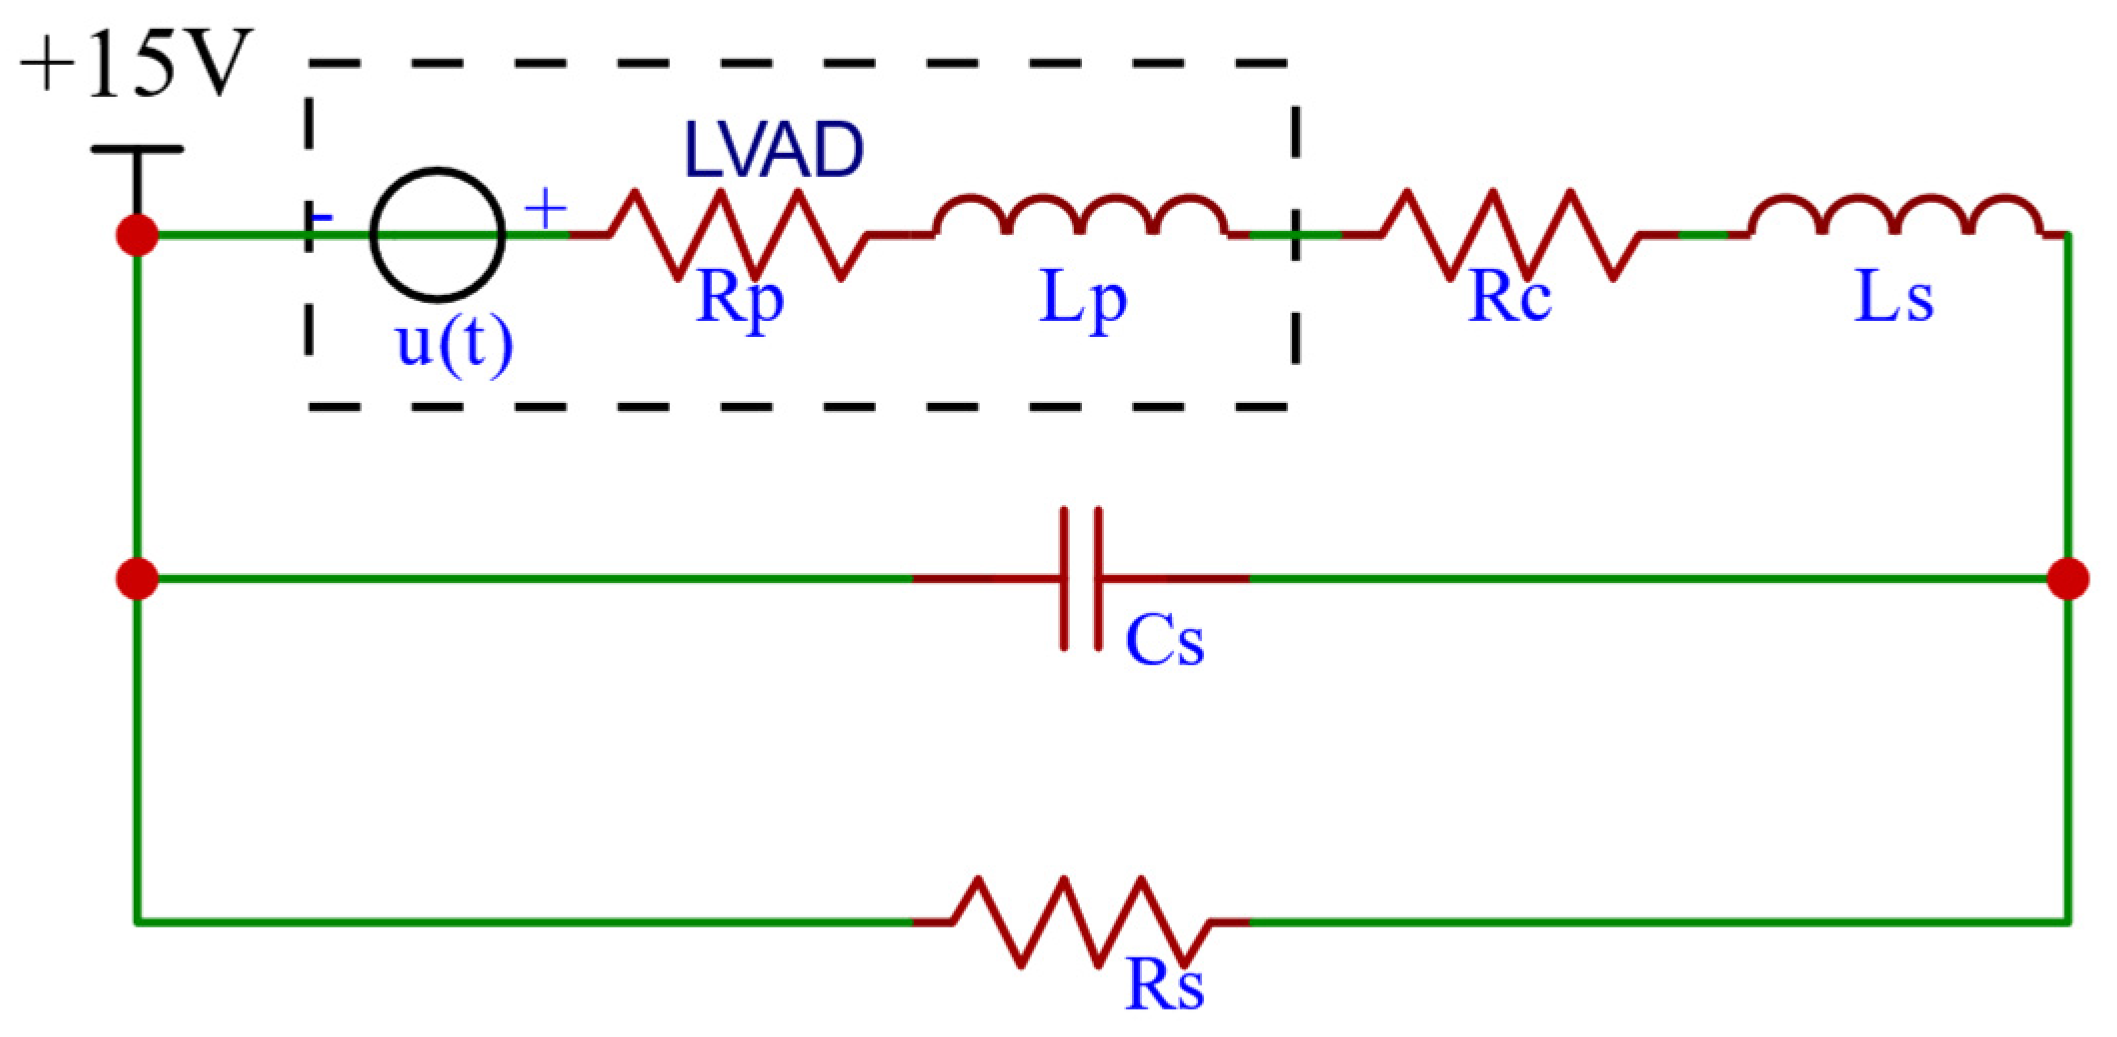
2.1.4. RBP Model
2.1.5. CVS-RBP Equivalent Circuit Model
2.2. Control Strategies
2.2.1. Selection of Desired Aortic Pressure Signals
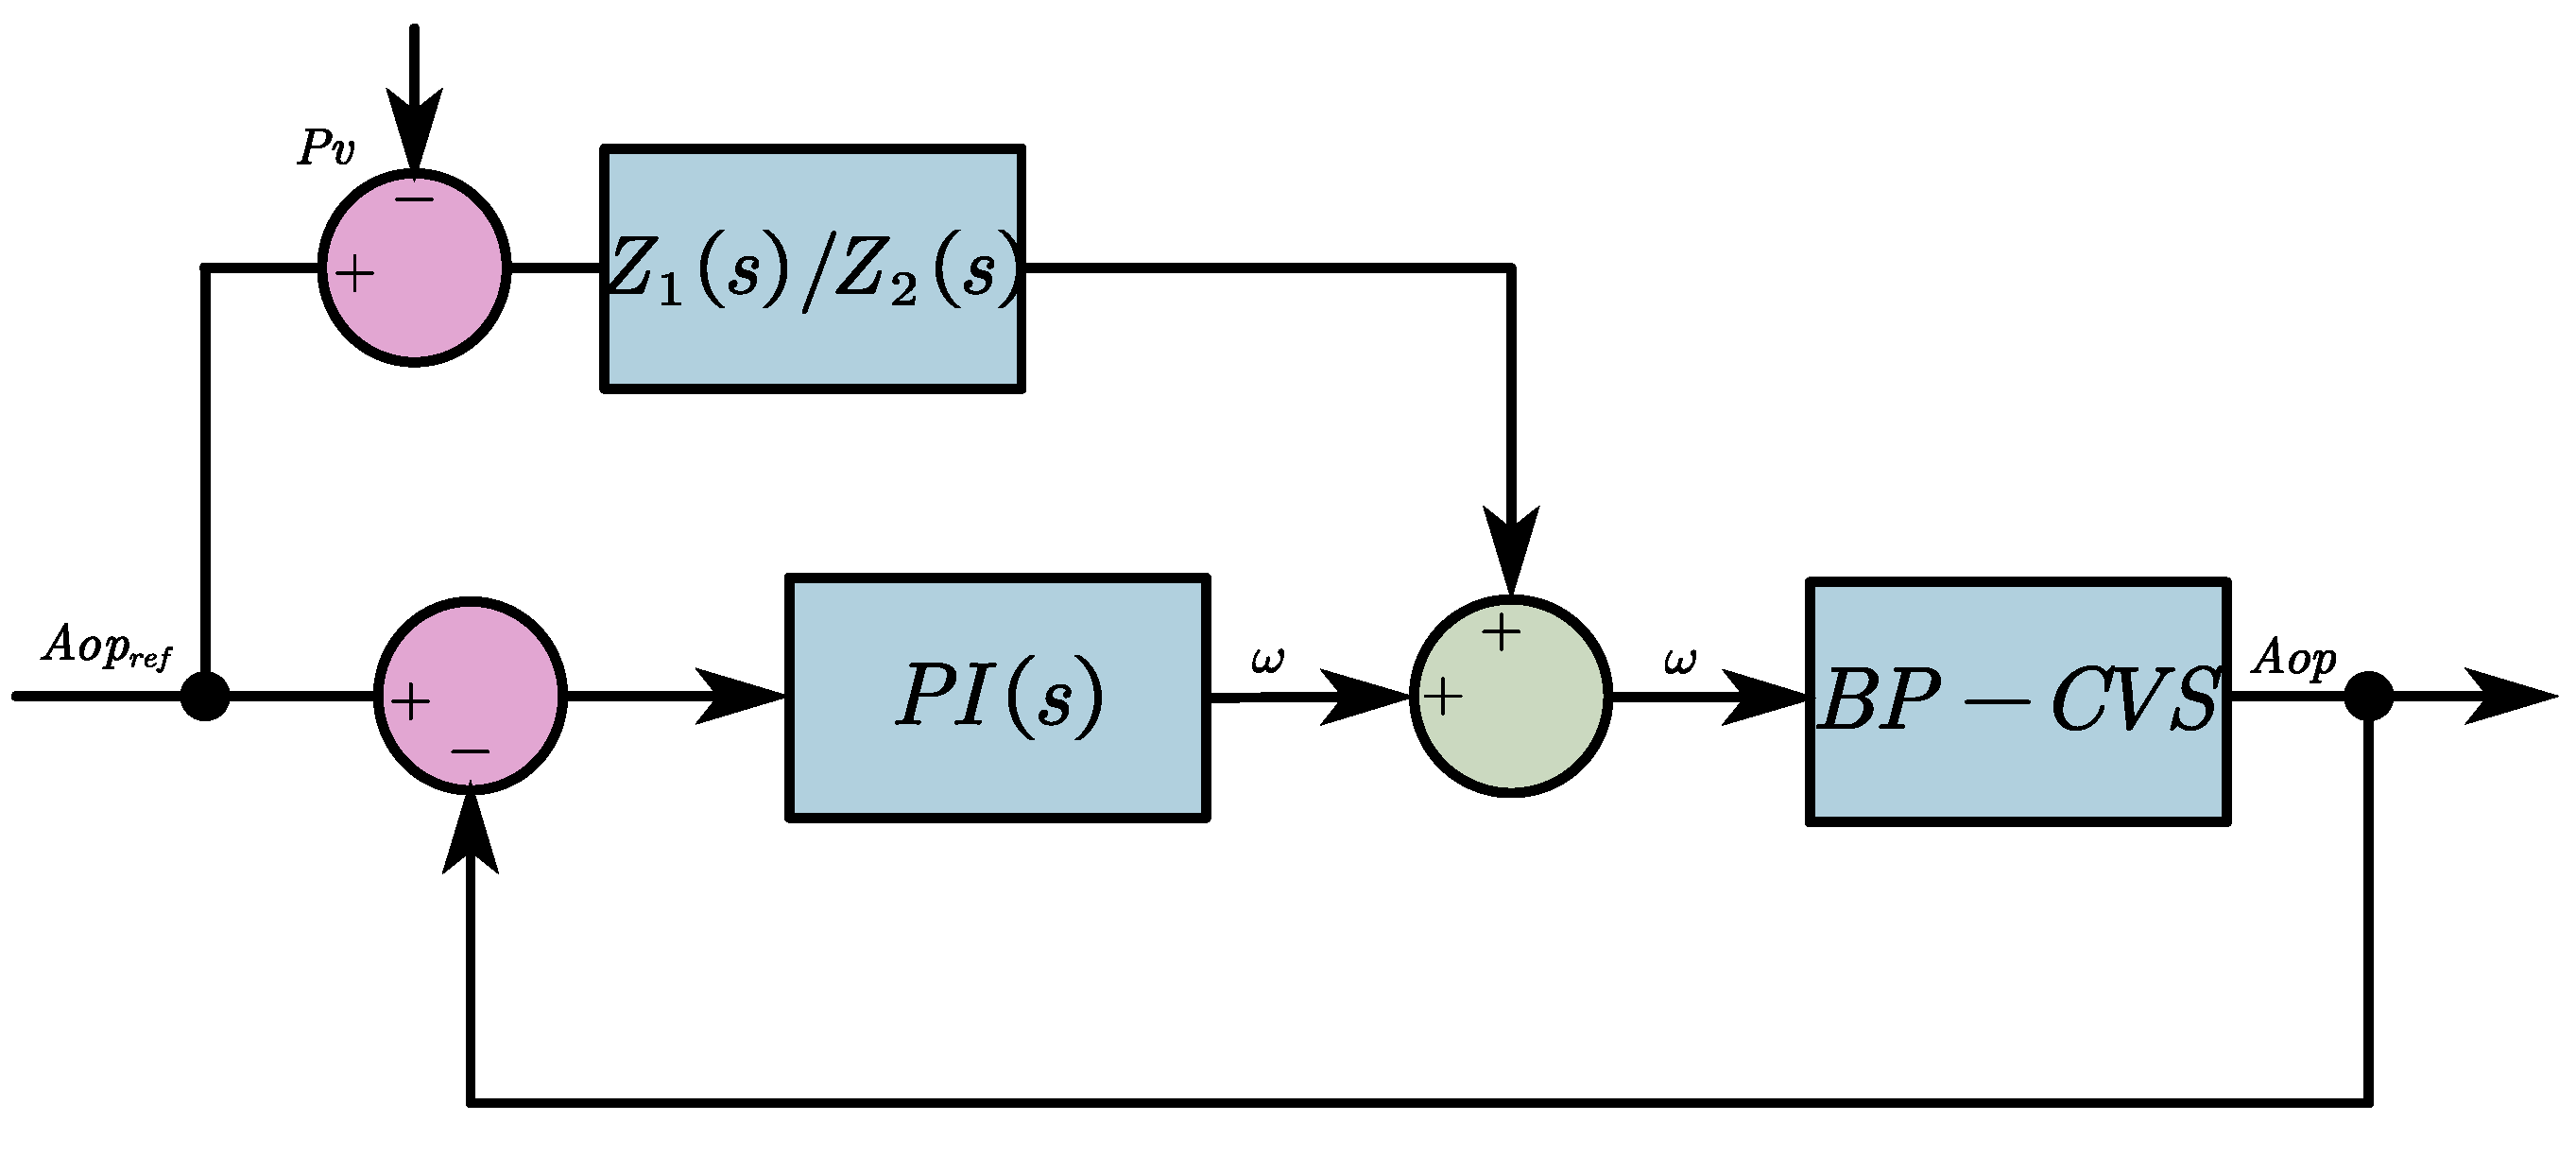
2.2.2. The FFC-Based Pulsatile Control Algorithm
2.2.3. The Anti-Reflux Algorithm
3. Results and Discussion
3.1. Numerical Simulation Validation
3.1.1. Tracking Performance Evaluation
3.1.2. Auxiliary Performance Evaluation
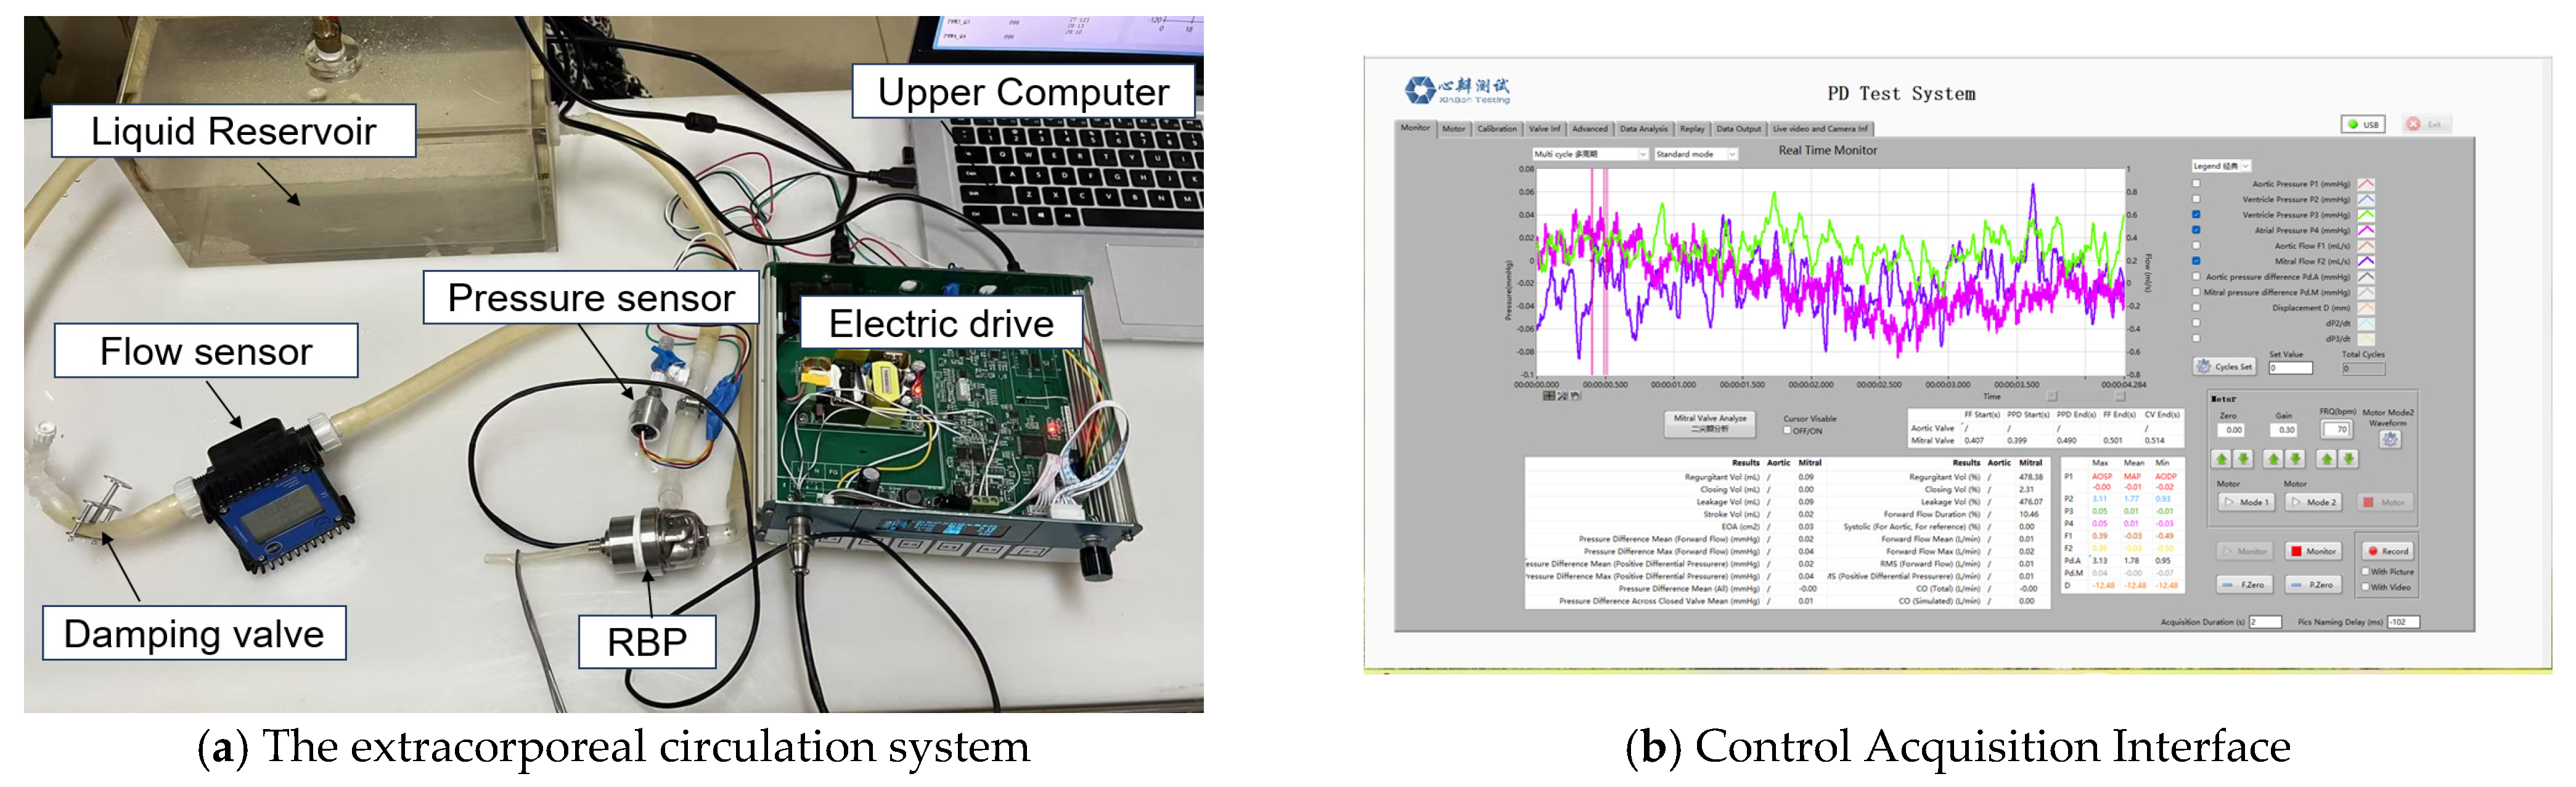
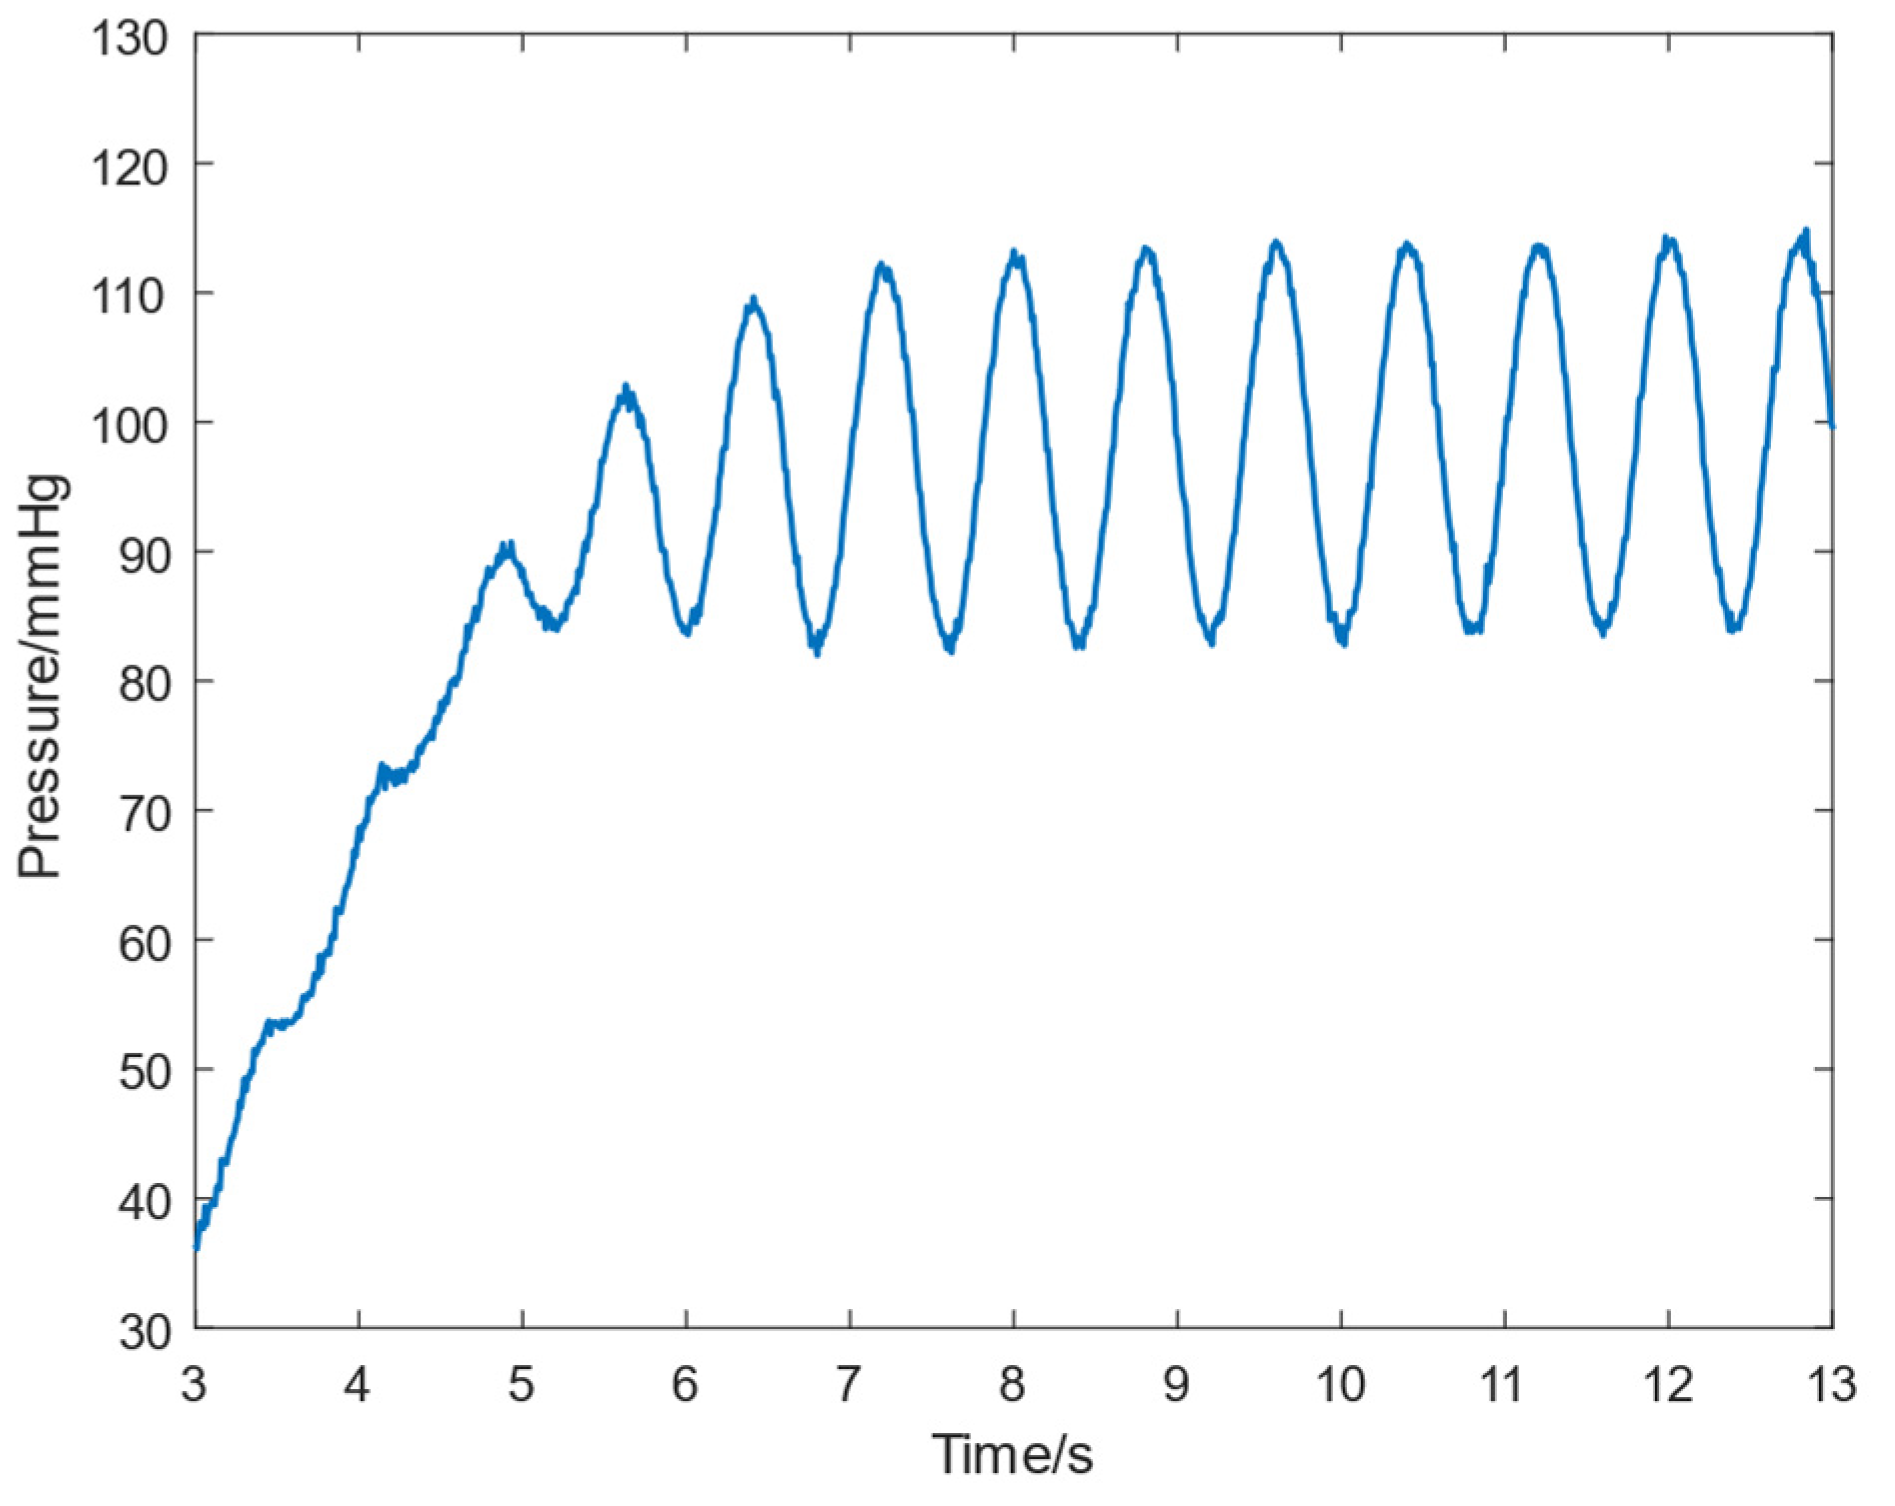
3.2. In Vitro Experimental Validation
3.3. Discussion
4. Conclusions
- The designed FFC loop reduced the maximum tracking error by approximately 81% and the average error by about 80%.
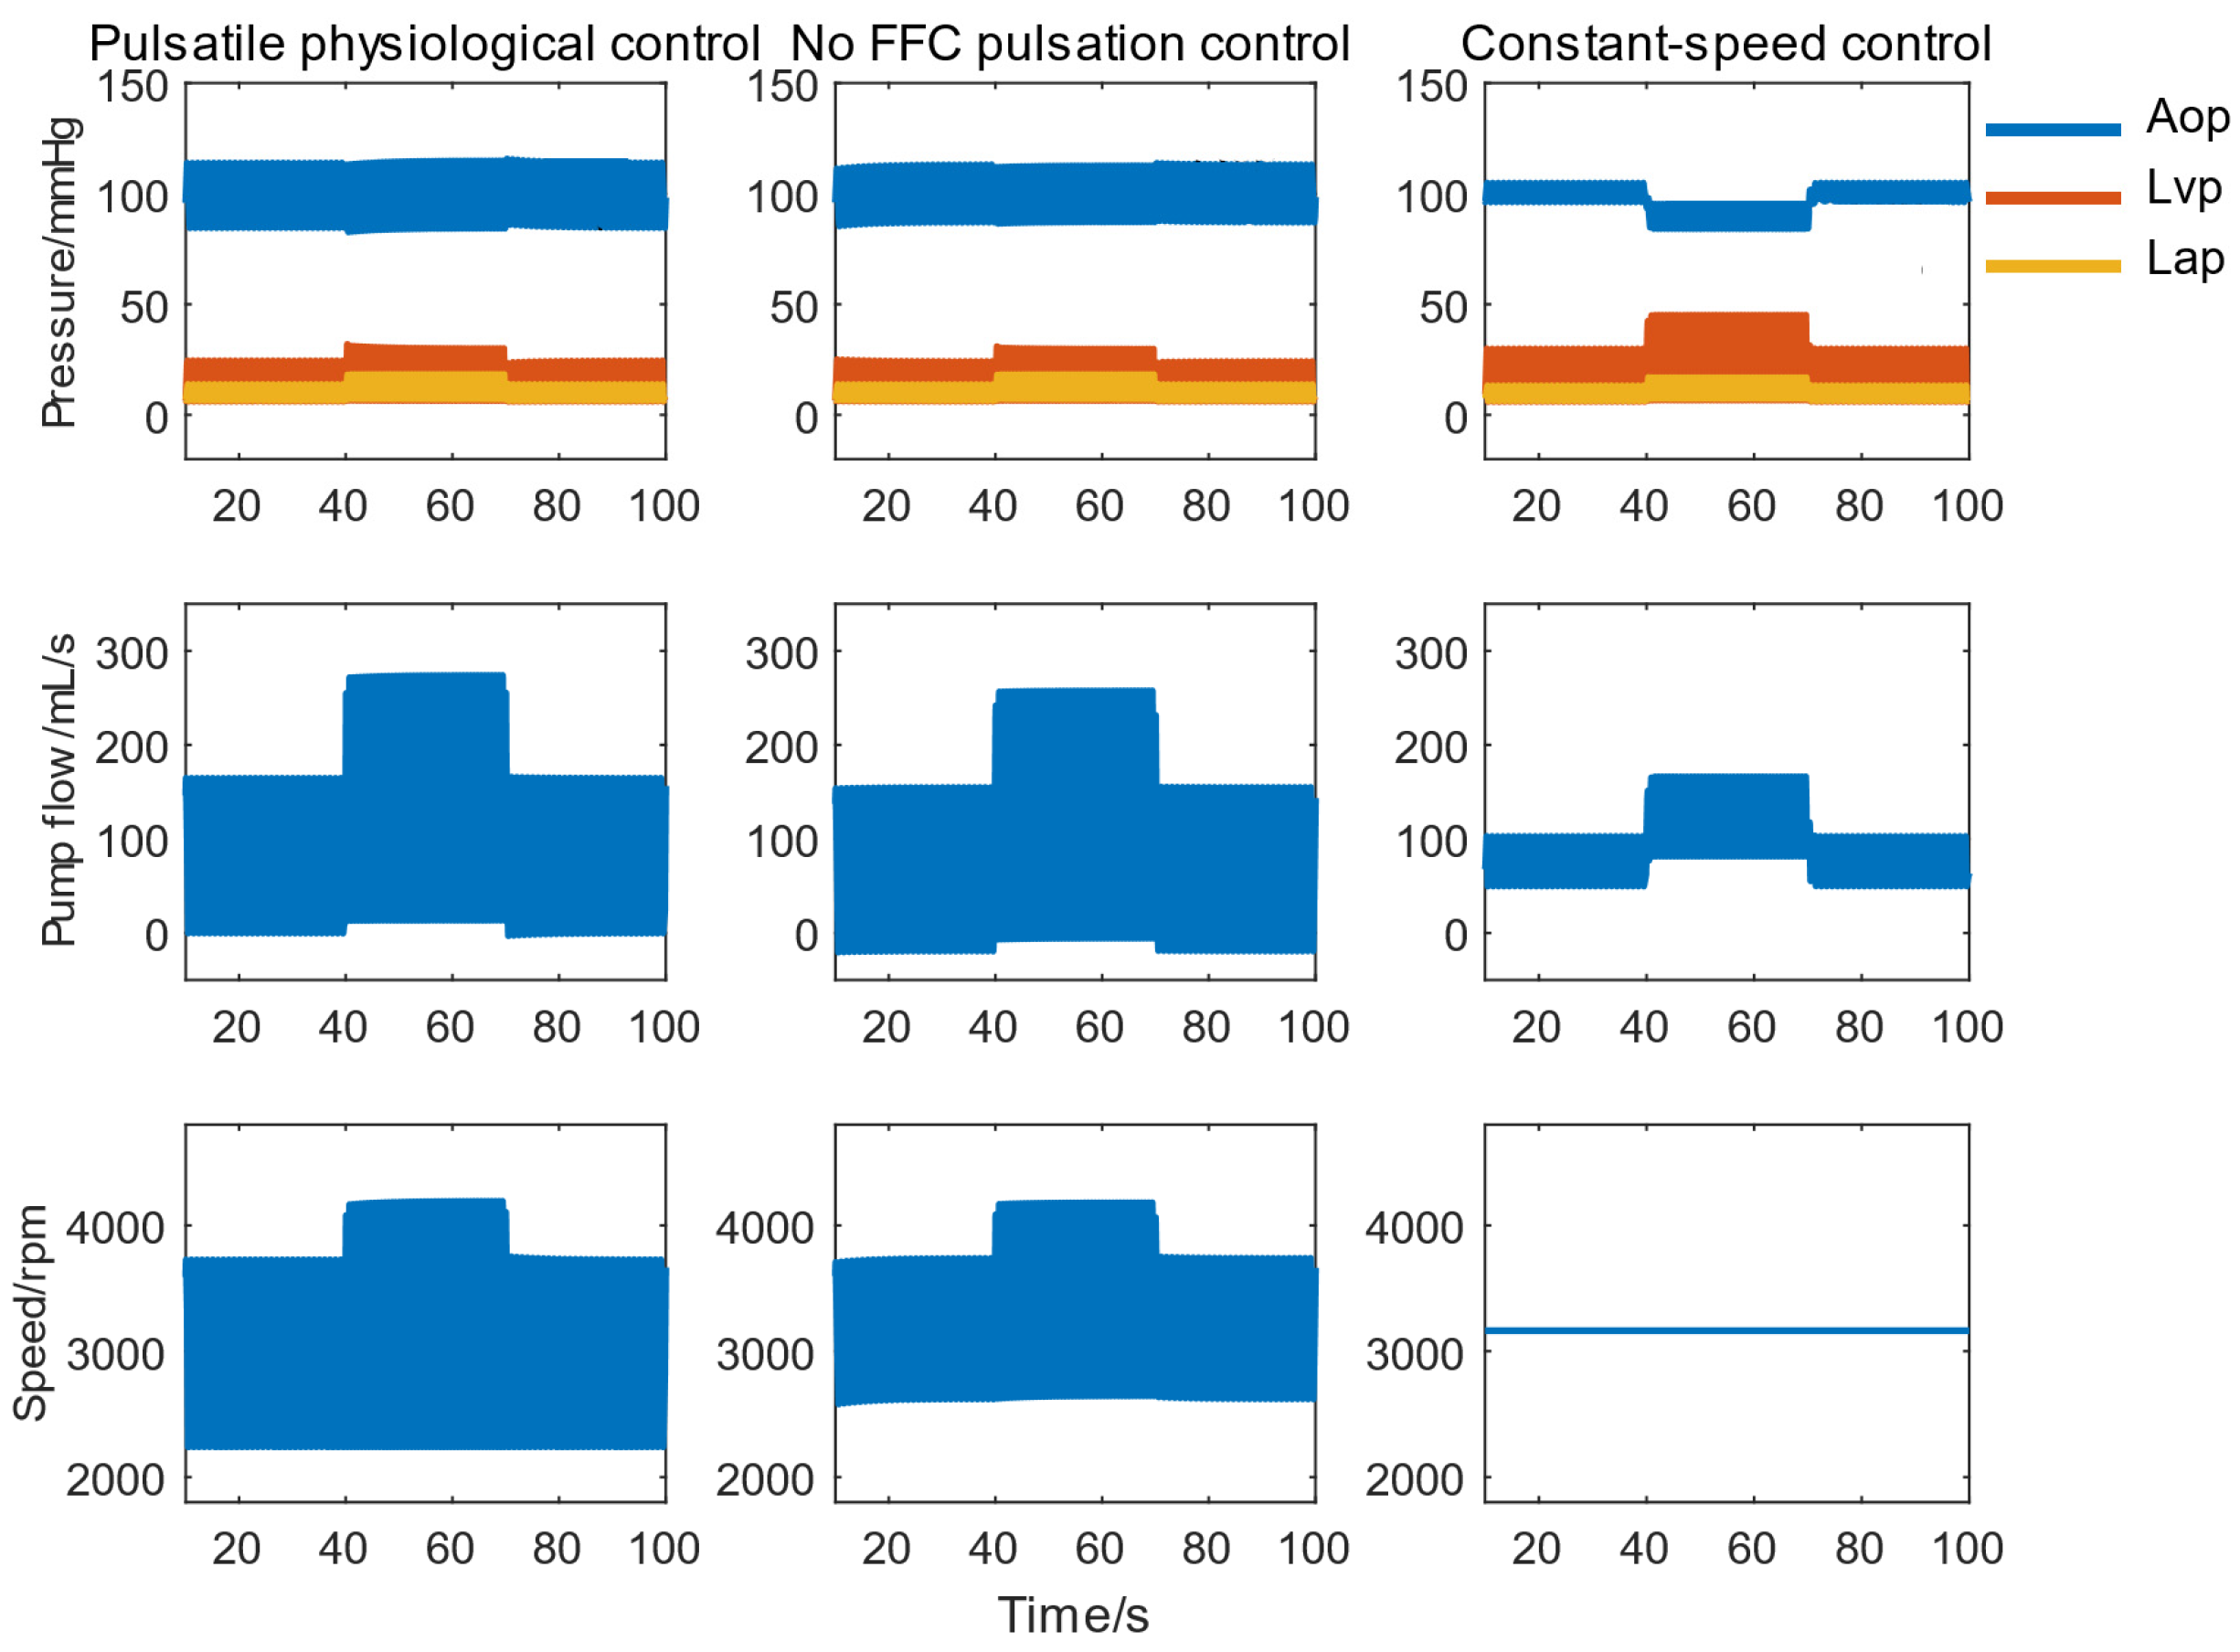
- The pulsatile physiological control achieved rapid and stable responses under high disturbances with a 50% variation in CVS parameters, effectively preventing reflux events.
- The system provided excellent pressure and flow pulsatility, generating a physiological pulse pressure of 30 mmHg during both exercise and rest. The delivered SHE was 5–10 times that of constant-speed control.
- The system achieved the largest LVVD while maintaining the lowest LVSW, promoting ventricular unloading and myocardial recovery.
Author Contributions
Funding
Data Availability Statement
Conflicts of Interest
Abbreviations
| RBP | Rotary Blood Pump |
| FFC | Feed-forward compensation |
| CVS | Cardiovascular system |
| ECG | Electrocardiogram |
| LVAD | Left Ventricular Assist Device |
| HR | Heart rate |
| Emax | Maximum elastance |
| Rs | Resistance |
| QI | Pulsatility index |
| PP | Pulse Pressure |
| SHE | Surplus hemodynamic energy |
| CO | Total cardiac output |
| LVSW | Left ventricular stroke work |
| LVVD | Left ventricular volume difference |
| NMPC | Nonlinear model predictive control |
References
- Levine, A.; Gass, A. Third-Generation LVADs: Has Anything Changed? Cardiol. Rev. 2019, 27, 293–301. [Google Scholar] [CrossRef] [PubMed]
- Cheng, A.; Williamitis, C.A.; Slaughter, M.S. Comparison of continuous-flow and pulsatile-flow left ventricular assist devices: Is there an advantage to pulsatility? Ann. Cardiothorac. Surg. 2014, 3, 573–581. [Google Scholar] [CrossRef] [PubMed]
- Ising, M.S.; Sobieski, M.A.; Slaughter, M.S.; Koenig, S.C.; Giridharan, G.A. Feasibility of Pump Speed Modulation for Restoring Vascular Pulsatility with Rotary Blood Pumps. ASAIO J. 2015, 61, 526–532. [Google Scholar] [CrossRef]
- Arakawa, M.; Nishimura, T.; Takewa, Y.; Umeki, A.; Ando, M.; Kishimoto, Y.; Fujii, Y.; Kyo, S.; Adachi, H.; Tatsumi, E. Novel control system to prevent right ventricular failure induced by rotary blood pump. J. Artif. Organs 2014, 17, 135–141. [Google Scholar] [CrossRef] [PubMed]
- Petrou, A.; Monn, M.; Meboldt, M.; Schmid Daners, M. A Novel Multi-objective Physiological Control System for Rotary Left Ventricular Assist Devices. Ann. Biomed. Eng. 2017, 45, 2899–2910. [Google Scholar] [CrossRef]
- Zhu, N.; Li, L.; Zhang, D. Decision-making in the management of heart valve disease. Chin. J. Fam. Med. 2012, 11, 4. [Google Scholar]
- Wang, F.; Zhang, Y.; He, W.; Chen, S.; Jing, T.; Zhang, Z. Numerical study on the influence of left ventricular assist device control mode on biventricular beat synchronization. J. Biomed. Eng. 2021, 38, 72–79. [Google Scholar] [CrossRef]
- Huang, F.; Ruan, X.; Fu, X. Pulse-pressure-enhancing controller for better physiologic perfusion of rotary blood pumps based on speed modulation. ASAIO J. 2014, 60, 269–279. [Google Scholar] [CrossRef]
- Bakouri, M.A.; Salamonsen, R.F.; Savkin, A.V.; Alomari, A.H.H.; Lim, E.; Lovell, N.H. A Sliding Mode-Based Starling-Like Controller for Implantable Rotary Blood Pumps. Artif. Organs 2014, 38, 587–593. [Google Scholar] [CrossRef]
- Arndt, A.; Nüsser, P.; Graichen, K.; Müller, J.; Lampe, B. Physiological Control of a Rotary Blood Pump With Selectable Therapeutic Options: Control of Pulsatility Gradient. Artif. Organs 2008, 32, 761–771. [Google Scholar] [CrossRef]
- Lacourse, J.R.; Mohanakrishnan, G.; Sivaprasad, K. Simulations of arterial pressure pulses using a transmission line model. J. Biomech. 1986, 19, 771–780. [Google Scholar] [CrossRef] [PubMed]
- Carusi, A.; Burrage, K.; Rodríguez, B. Bridging experiments, models and simulations: An integrative approach to validation in computational cardiac electrophysiology. Am. J. Physiol. Heart Circ. Physiol. 2012, 303, H144. [Google Scholar] [CrossRef] [PubMed]
- Ursino, M. Interaction between carotid baroregulation and the pulsating heart: A mathematical model. Am. J. Physiol. 1998, 275, 1733–1747. [Google Scholar] [CrossRef]
- Gao, Y.; Hu, Y.; Yang, Y.; Feng, K.; Han, X.; Li, P. Optimization of Operating Parameters for Straw Returning Machine Based on Vibration Characteristic. Agronomy 2024, 14, 2388. [Google Scholar] [CrossRef]
- Hydren, J.R.; Richardson, R.S.; Wever-Pinzon, O. The “double whammy” of a continuous-flow left ventricular assist device on von Willebrand factor. J. Thorac. Cardiovasc. Surg. 2020, 159, 910–915. [Google Scholar] [CrossRef]
- Xia, X.N.; Yin, Z.L.; Li, C. Finite-time dynamic surface control for nonlinear systems with input delay and prescribed performance. J. Jiangsu Univ. Nat. Sci. Ed. 2024, 45, 316–322. [Google Scholar] [CrossRef]
- Cui, L.; Xue, X.; Le, F.; Mao, H.; Ding, S. Design and experiment of electro hydraulic active suspension for controlling the rolling motion of spray boom. Int. J. Agric. Biol. Eng. 2019, 12, 72–81. [Google Scholar] [CrossRef]
- Xing, D.; Chen, X.; Wu, Y.; Xu, X.; Chen, Q.; Li, L.; Zhang, C. Rapid prediction of the re-watering time point of Orychophragmus violaceus L. based on the online monitoring of electrophysiological indexes. Sci. Hortic. 2019, 256, 108642. [Google Scholar] [CrossRef]
- Zhao, W. Research on Hemodynamics and Physiological Control of Pulsatile Flow Left Ventricular Assist Device. Ph.D. Thesis, Harbin Institute of Technology, Harbin, China, 2023. [Google Scholar]
- Meki, M.H.; Wang, Y.; Sethu, P.; Ghazal, M.; Giridharan, G.A. A Sensorless Rotational Speed-Based Control System for Continuous Flow Left Ventricular Assist Devices. IEEE Trans. Biomed. Eng. 2019, 67, 1050–1060. [Google Scholar] [CrossRef]
- Diakos, N.A.; Selzman, C.H.; Sachse, F.B.; Stehlik, J.; Kfoury, A.G.; Weverpinzon, O.; Catino, A.; Alharethi, R.; Reid, B.B.; Miller, D.V. Myocardial atrophy and chronic mechanical unloading of the failing human heart: Implications for cardiac assist device-induced myocardial recovery. J. Am. Coll. Cardiol. 2014, 64, 1602–1612. [Google Scholar] [CrossRef]
- Bozkurt, S.; van de Vosse, F.N.; Rutten, M.C. Enhancement of Arterial Pressure Pulsatility by Controlling Continuous-Flow Left Ventricular Assist Device Flow Rate in Mock Circulatory System. J. Med. Biol. Eng. 2016, 36, 308–315. [Google Scholar] [CrossRef] [PubMed]
- Bludszuweit, C. Three-dimensional numerical prediction of stress loading of blood particles in a centrifugal pump. Artif. Organs 2010, 19, 590–596. [Google Scholar] [CrossRef] [PubMed]
- Taskin, M.E.; Fraser, K.H.; Zhang, T.; Wu, C.; Griffith, B.P.; Wu, Z.J. Evaluation of Eulerian and Lagrangian Models for Hemolysis Estimation. ASAIO J. 2012, 58, 363. [Google Scholar] [CrossRef]
- Golesorkhie, F.; Yang, F.; Vlacic, L.; Tansley, G. Field Oriented Control-Based Reduction of the Vibration and Power Consumption of a Blood Pump. Energies 2020, 13, 3907. [Google Scholar] [CrossRef]
- Lee, J.J.; Kim, W.E.; Choi, J.; Park, J.W.; Chung, J.; Nam, K. Robust Motor Speed Control under Time Varying Loads in Moving Actuator Type artificial Heart (AnyHeart). Int. J. Artif. Organs 2018, 27, 787–795. [Google Scholar] [CrossRef]
- Jing, T.; Pan, A.D.; Gu, F.D. Numerical simulation and hemolysis analysis of aortic perforating type axial blood pump impeller with folded-edge structure. J. Drain. Irrig. Mach. Eng. 2024, 42, 109–117. [Google Scholar]


| Parameter | Value | Unit | Meaning |
|---|---|---|---|
| HR | bpm | Heart rate | |
| mmHg/mL | Left ventricular end-systolic compliance | ||
| 0.0600 | mmHg/mL | Left ventricular end-diastolic compliance | |
| Rs | mmHg·s/mL | Peripheral vascular resistance | |
| Rm | 0.0050 | mmHg·s/mL | Mitral valve resistance |
| Ra | 0.0010 | mmHg·s/mL | Aortic valve resistance |
| Rc | 0.0398 | mmHg·s/mL | Aortic resistance |
| Cr | 4.4000 | mL/mmHg | Left atrial compliance |
| Ca | 0.0800 | mL/mmHg | Aortic compliance |
| Cs | 1.3300 | mL/mmHg | Peripheral vascular compliance |
| mL/mmHg | Left ventricular compliance | ||
| Ls | 0.0005 | mmHg·s2/mL | Aortic blood inertia |
| Dm | - | - | Mitral valve |
| Da | - | - | Aortic valve |
| Rp | −0.00183 | mmHg·s2/mL | Blood pump and cannula equivalent inertia |
| Lp | −0.39100 | mmHg·s/mL | Blood pump and cannula equivalent resistance |
| 1.147 × 10⁻⁵ | mmHg·s2/rad2 | Blood pump speed related constants |
| Scheme | Sign | Initial Value | Meaning |
|---|---|---|---|
| Vlv(t) | 140 mL | Left ventricular volume | |
| Lap(t) | 7.6 mmHg | Left atrial pressure | |
| Ap(t) | 67 mmHg | Arterial pressure | |
| Aop(t) | 80 mmHg | Aortic pressure | |
| Q(t) | 0 mL/s | Aortic flow | |
| Qp(t) | 0 mL/s | Pump flow |
| Proportional Gain | With or Without FFC | Maximum Error (mmHg) | Reduction Ratio | Average Error (mmHg) | Reduction Ratio |
|---|---|---|---|---|---|
| without | 35.17 | 81% | 6.920 | 79% | |
| with | 6.833 | 1.437 | |||
| without | 24.45 | 80% | 6.715 | 80% | |
| with | 4.911 | 1.376 | |||
| without | 12.93 | 82% | 5.187 | 80% | |
| with | 2.325 | 1.035 |
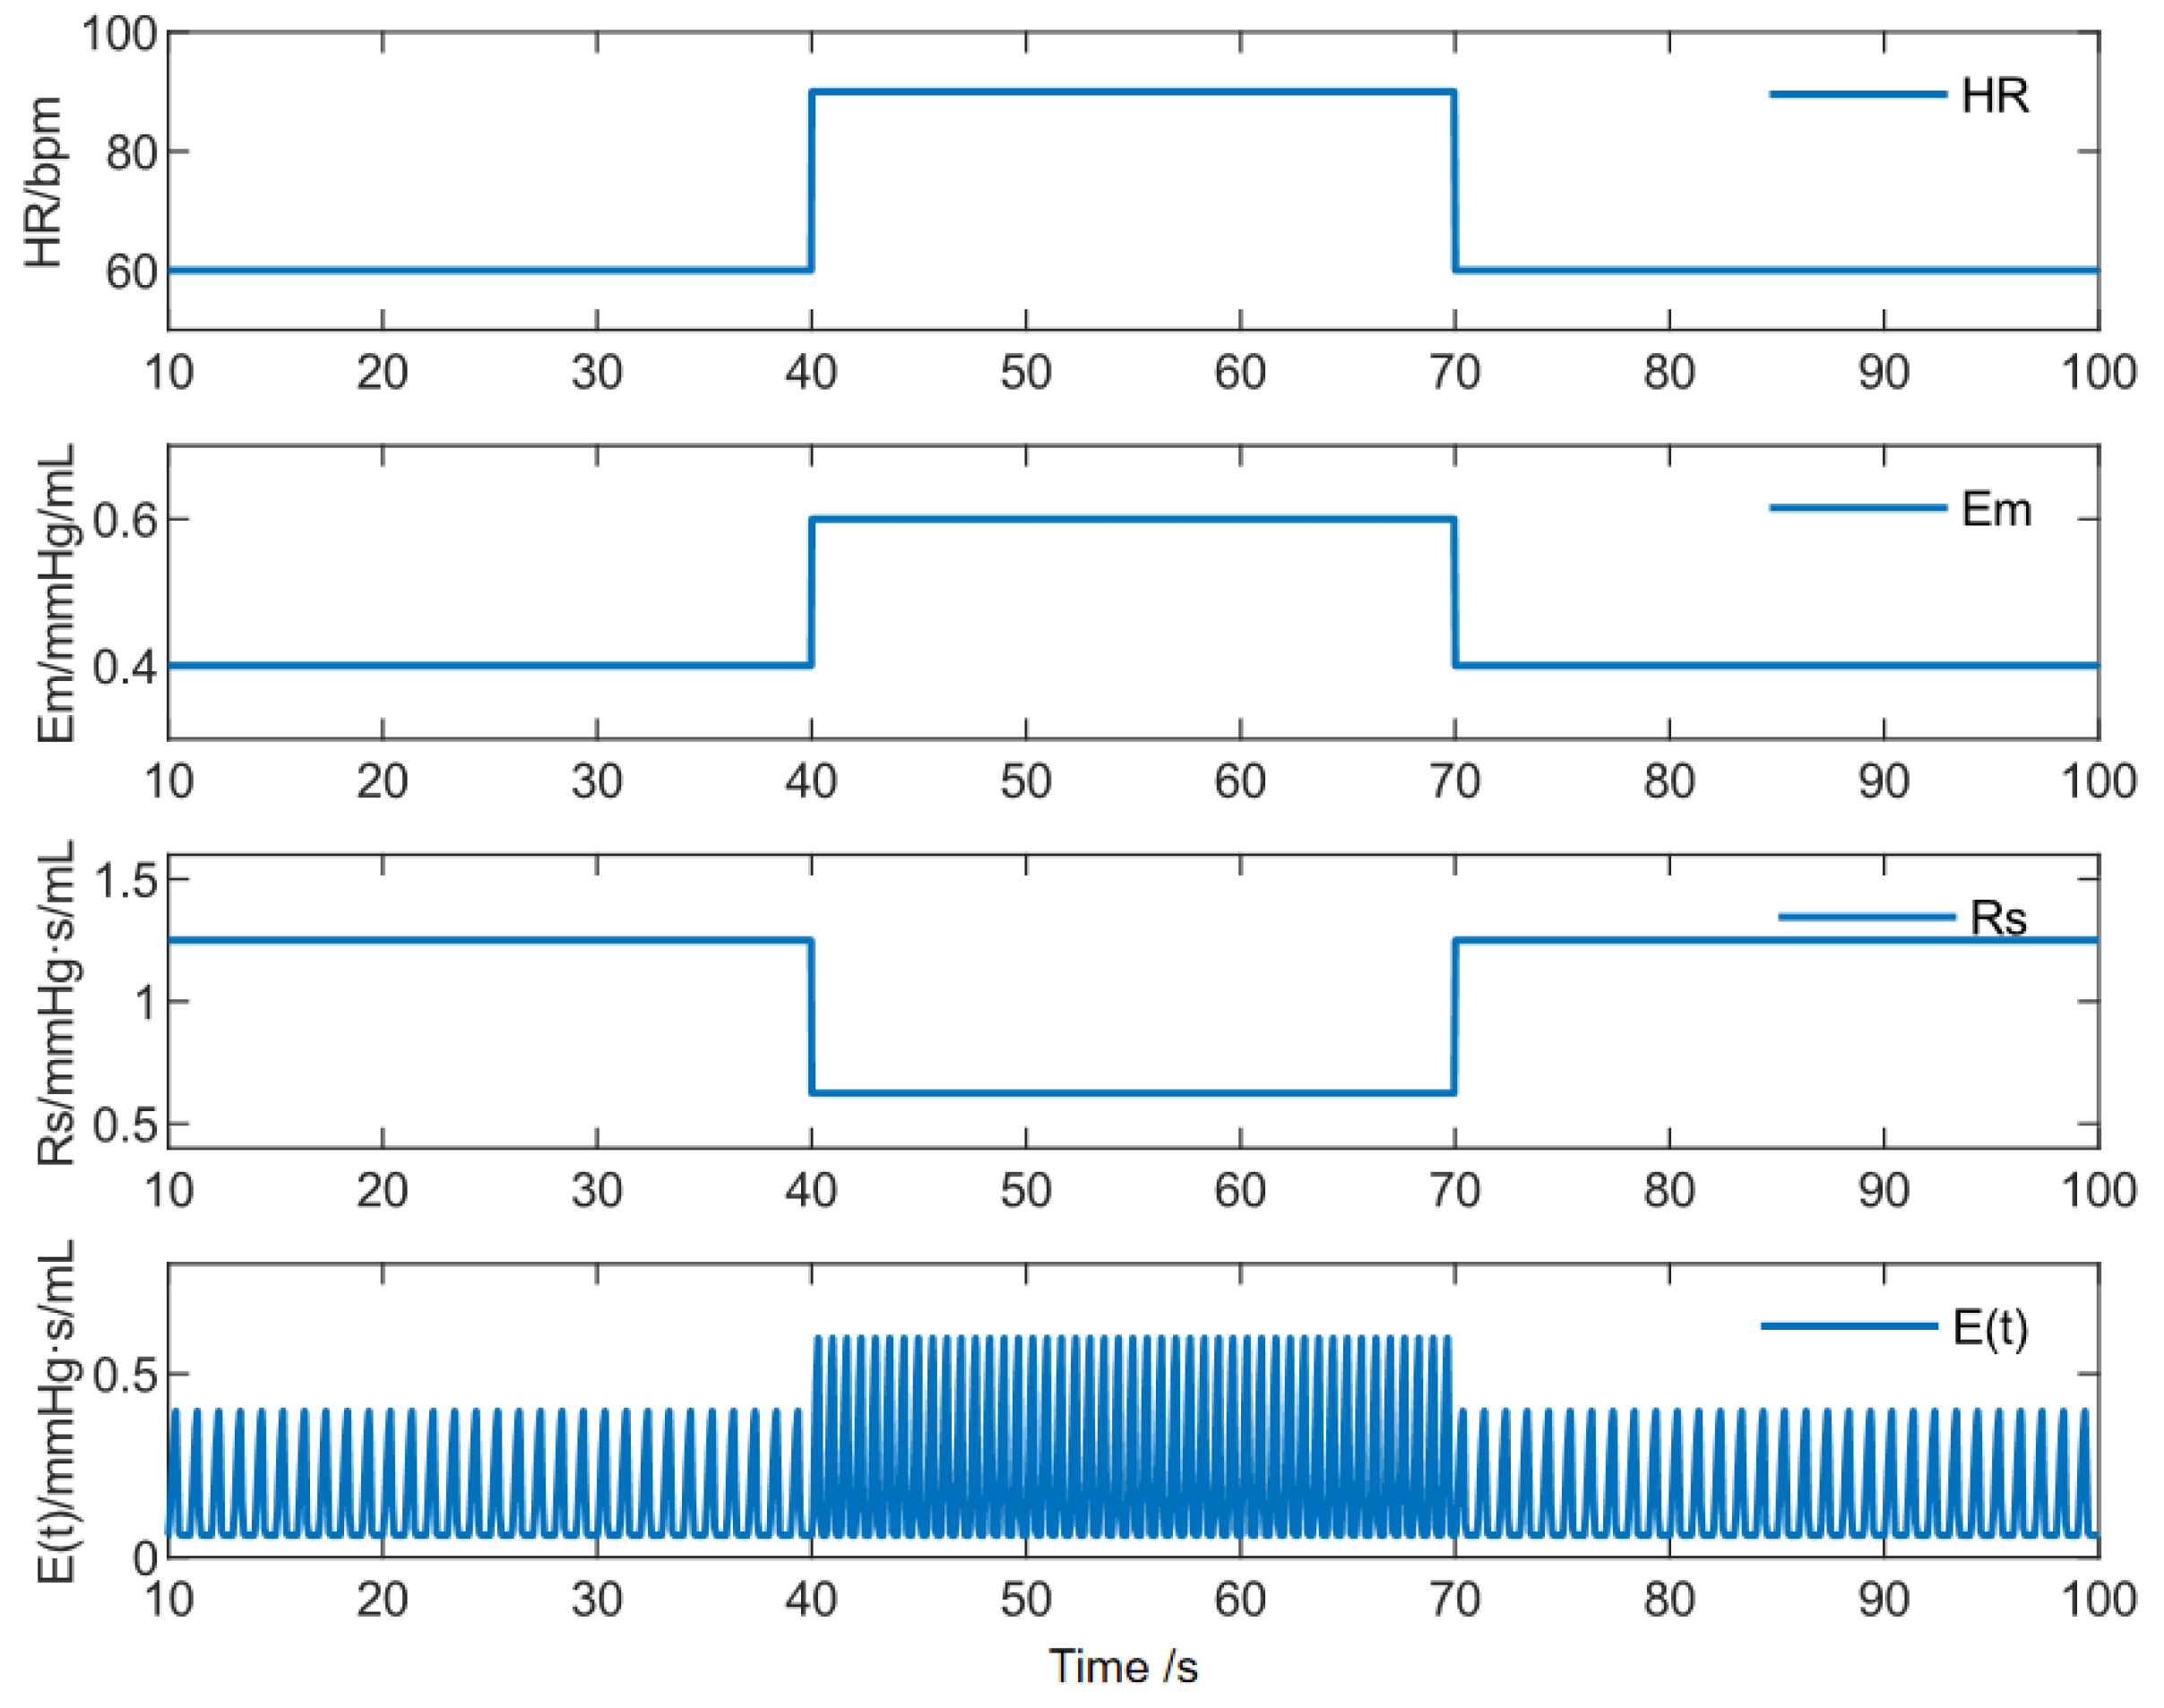
| Parameter | Baseline Value | Resting State | Exercise State |
|---|---|---|---|
| HR | 60 bpm | 60 bpm | 90 bpm |
| Emax | 0.4 mmHg/mL | 0.4 mmHg/mL | 0.6 mmHg/mL |
| Rs | 1.25 mmHg·s/mL | 1.25 mmHg·s/mL | 0.75 mmHg·s/mL |
Disclaimer/Publisher’s Note: The statements, opinions and data contained in all publications are solely those of the individual author(s) and contributor(s) and not of MDPI and/or the editor(s). MDPI and/or the editor(s) disclaim responsibility for any injury to people or property resulting from any ideas, methods, instructions or products referred to in the content. |
© 2025 by the authors. Licensee MDPI, Basel, Switzerland. This article is an open access article distributed under the terms and conditions of the Creative Commons Attribution (CC BY) license (https://creativecommons.org/licenses/by/4.0/).
Share and Cite
Bao, Y.; Jing, T.; Ru, W.; Zhou, L. Pulsatile Physiological Control of Blood Pump-Cardiovascular System Based on Feedforward Compensation. Micromachines 2025, 16, 664. https://doi.org/10.3390/mi16060664
Bao Y, Jing T, Ru W, Zhou L. Pulsatile Physiological Control of Blood Pump-Cardiovascular System Based on Feedforward Compensation. Micromachines. 2025; 16(6):664. https://doi.org/10.3390/mi16060664
Chicago/Turabian StyleBao, Yanjun, Teng Jing, Weimin Ru, and Ling Zhou. 2025. "Pulsatile Physiological Control of Blood Pump-Cardiovascular System Based on Feedforward Compensation" Micromachines 16, no. 6: 664. https://doi.org/10.3390/mi16060664
APA StyleBao, Y., Jing, T., Ru, W., & Zhou, L. (2025). Pulsatile Physiological Control of Blood Pump-Cardiovascular System Based on Feedforward Compensation. Micromachines, 16(6), 664. https://doi.org/10.3390/mi16060664