1. Introduction
Hydrogen sensors are widely applied in the fields of biomedical applications, clean energy, and nuclear industries for the detection of hydrogen concentration in devices or systems [
1,
2]. Certain gas sensors have problems of complicated structures, large volumes, and high manufacturing costs though various high-quality sensors have existed so far [
2,
3]. In order to break through the limitations, researchers have proposed a new method for gas detection based on Knudsen force effects [
4,
5,
6,
7,
8,
9]. Knudsen force effects are a peculiar physical phenomenon in rarefied gas environments (Knudsen number
). Specifically, directional gas flows are induced by directly or indirectly imposing thermal gradients or temperature differences on walls without initial pressure gradients in low-pressure environments or micro-electromechanical systems (MEMS) [
10,
11]. For example, for one of the most noted flows, thermal creep flows [
11], over the walls with temperature gradients, when the fast hot molecules and slow cold molecules impinge on walls, net tangential momentum
in the direction of temperature gradient is transferred to walls. The reaction force formed by
drives the gas flows in the opposite direction of the temperature gradient, from which thermal creep flows are generated. On the other hand, there are significant differences in the momentum exchanged in the process of collisions of cold and hot molecules with walls, therefore exerting a net force on the solid structure, i.e., Knudsen force [
12]. The value of Knudsen force is closely related to gas species and concentration, which can be applied to gas detection [
4,
5,
6,
7,
8,
9]. It is noted that compared with the conventional systems, MEMS has significantly enlarged surface area–volume ratios. Therefore, gas–surface interaction has significant effects on detection performance as well as on the characteristics of rarefied gas inside of MEMS hydrogen sensors based on Knudsen force.
A large number of studies have revealed that the interactions of gas–surface molecules are mainly determined by factors such as surface roughness, surface material, surface temperature, and gas species [
13,
14,
15]. It is demonstrated that surface roughness has a significant effect on the characteristic behavior of friction factor, mass flow, heat transfer, flow patterns, flow velocity, and compression ratio by using experimental and numerical analysis methods [
16,
17,
18,
19,
20,
21]. In particular, surface roughness is usually modeled as a series of tiny obstacles uniformly distributed along the ideal smooth surface in numerical investigations. Moreover, the geometric shapes, structure parameters, and spacing of the obstacles can significantly impact the rarefied gas flow characteristics [
19,
20,
21].
In physical reality, apart from surface roughness, wall conditions are closely related to surface material. Therefore, surface roughness and surface material are usually decoupled and separately studied for the effects on flow fields [
15,
22]. Investigations into the effects of surface material can be conducted by employing the common gas–surface interaction models (specular reflection, diffusive reflection, as well as the Maxwell [
23] and Cercignani–Lampis–Lord (CLL) models [
24,
25]) and varying the accommodation coefficients of the model [
22,
23,
24,
25,
26,
27,
28,
29,
30,
31,
32]. For example, Baier et al. [
26,
27] imposed specular reflection and diffuse reflection conditions on both sides of the plate, respectively, to achieve the applications of gas pumping and gas separation driven by temperature gradients. Based on the Maxwell model, by setting accommodation coefficients of the vertical and inclined walls of channels at different values, significant changes can be observed in the gas flow characteristics, including the increase in pumping speed and the reversal of pumping direction [
33,
34].
However, a large number of experimental and numerical results present that the CLL model, with two independent accommodation coefficients, provides many more correct physical descriptions of gas transport phenomena than the Maxwell model [
35,
36,
37]. Therefore, the CLL model is currently considered to be the most reliable gas–surface interaction model. For the CLL model, the effects of normal energy accommodation coefficient (NEAC) and tangential momentum accommodation coefficient (TMAC) on the gas flow characteristics and force acting on solid structures were studied, respectively. It is found that TMAC has a more significant effect on the flow fields in micro-channels than NEAC [
15]. For micro-beam systems (actuators) with different temperatures, when only the accommodation coefficients of the cold beam are changed, Knudsen force on the cold beam increases approximately linearly with the decrease in NEAC, but decreases nonlinearly as TMAC is reduced [
22]. On the contrary, Knudsen force on the cold beams decreases nonlinearly as NEAC decreases, but it increases nonlinearly, with TMAC reducing, when the accommodation coefficients of both cold and hot beams are simultaneously changed [
30]. It is noted that the research on each cold beam surface separately configured with different accommodation coefficients has not been reported yet. For a sphere with uniform temperature, the force acting on the sphere always increases with the increase in NEAC, but the qualitative effect of TMAC on the force depends on rarefaction parameters [
31]. In addition, the value of the accommodation coefficient is also related to the gas species. For example, for a variety of smooth metal (aluminum, platinum, and stainless steel) surfaces, the NEAC for helium is between 0 and 0.1, but ranges from 0.5 to 0.95 for argon; the TMACs for helium and argon are both between 0.5 and 1 [
38,
39].
On the other hand, the velocity of gas molecules reflected from a solid surface depends on the gas species and the surface temperature. More specifically, the molecular velocity is inversely proportional to the square root of the molecule mass and directly proportional to the square root of the surface temperature. Therefore, the gas species and the surface temperature have a significant influence on the gas flows (thermal creep flow, thermal edge flow, radiometric flow, etc.) induced by the peculiar thermal effects near the boundary in the rarefied gas, as well as the force exerting on the solid structure. For example, as the temperature difference between adjacent surfaces of the ratchets increases, the degree of gas separation increases nonlinearly [
40]. Within a small temperature difference range, the mass flow rate increases approximately linearly as the temperature difference between the cold and hot walls rises [
41]. However, over large temperature difference ranges, the dependence of mass flow rate on temperature difference is nonlinear [
34,
41,
42]. For Knudsen force, as temperature of the immersed structure increases, the maximal value of the force is obtained under higher ambient pressure [
9]. Under the condition that the temperature difference between the cold and hot beams increases from 10 K to 100 K, the maximal value of Knudsen force can be increased by more than 7 times [
43]. In addition, through investigating Knudsen force exerted on solid structures in different carrier gas atmospheres, it can be observed that the values of Knudsen force also depend on the diameter of gas molecules [
44,
45,
46,
47]. That is, Knudsen force increases as the diameter of the carrier gas molecule decreases. For binary gas mixtures, the Knudsen force is a linear function of any species concentration, and the line slope is related to the molecular diameter and ambient pressure [
46,
47].
Considering the background mentioned above, the performance of hydrogen detection of MEMS sensors composed of rectangle hot beams and triangle cold beams is assessed in the present work. Compared to the rectangular hot–cold beam configuration in previous studies, beams or blades with sharp edges can enhance the sensor operation performance [
48,
49]. At the same time, Knudsen force characteristics can be further enhanced when different surface accommodation coefficients are imposed on the inclined top/bottom surfaces and vertical right surface of the cold beam. Currently, the main objective of this study is to numerically investigate the effects of some key parameters of gas–surface interaction, such as accommodation coefficients of beam surfaces, temperature difference of the cold and hot beams, carrier gas, and Knudsen numbers that determine the gas flow scale in sensors. The remaining part of this paper is structured as follows:
Section 2 presents the configuration of MEMS hydrogen sensors composed of triangular cold beams and rectangular hot beams.
Section 3 describes the direct simulation Monte Carlo (DSMC) method applied to the research, relevant modeling assumptions, and calculation parameters. In
Section 4, DSMC simulation results for different factors are given and analyzed. Lastly, conclusions of the work are presented in
Section 5.
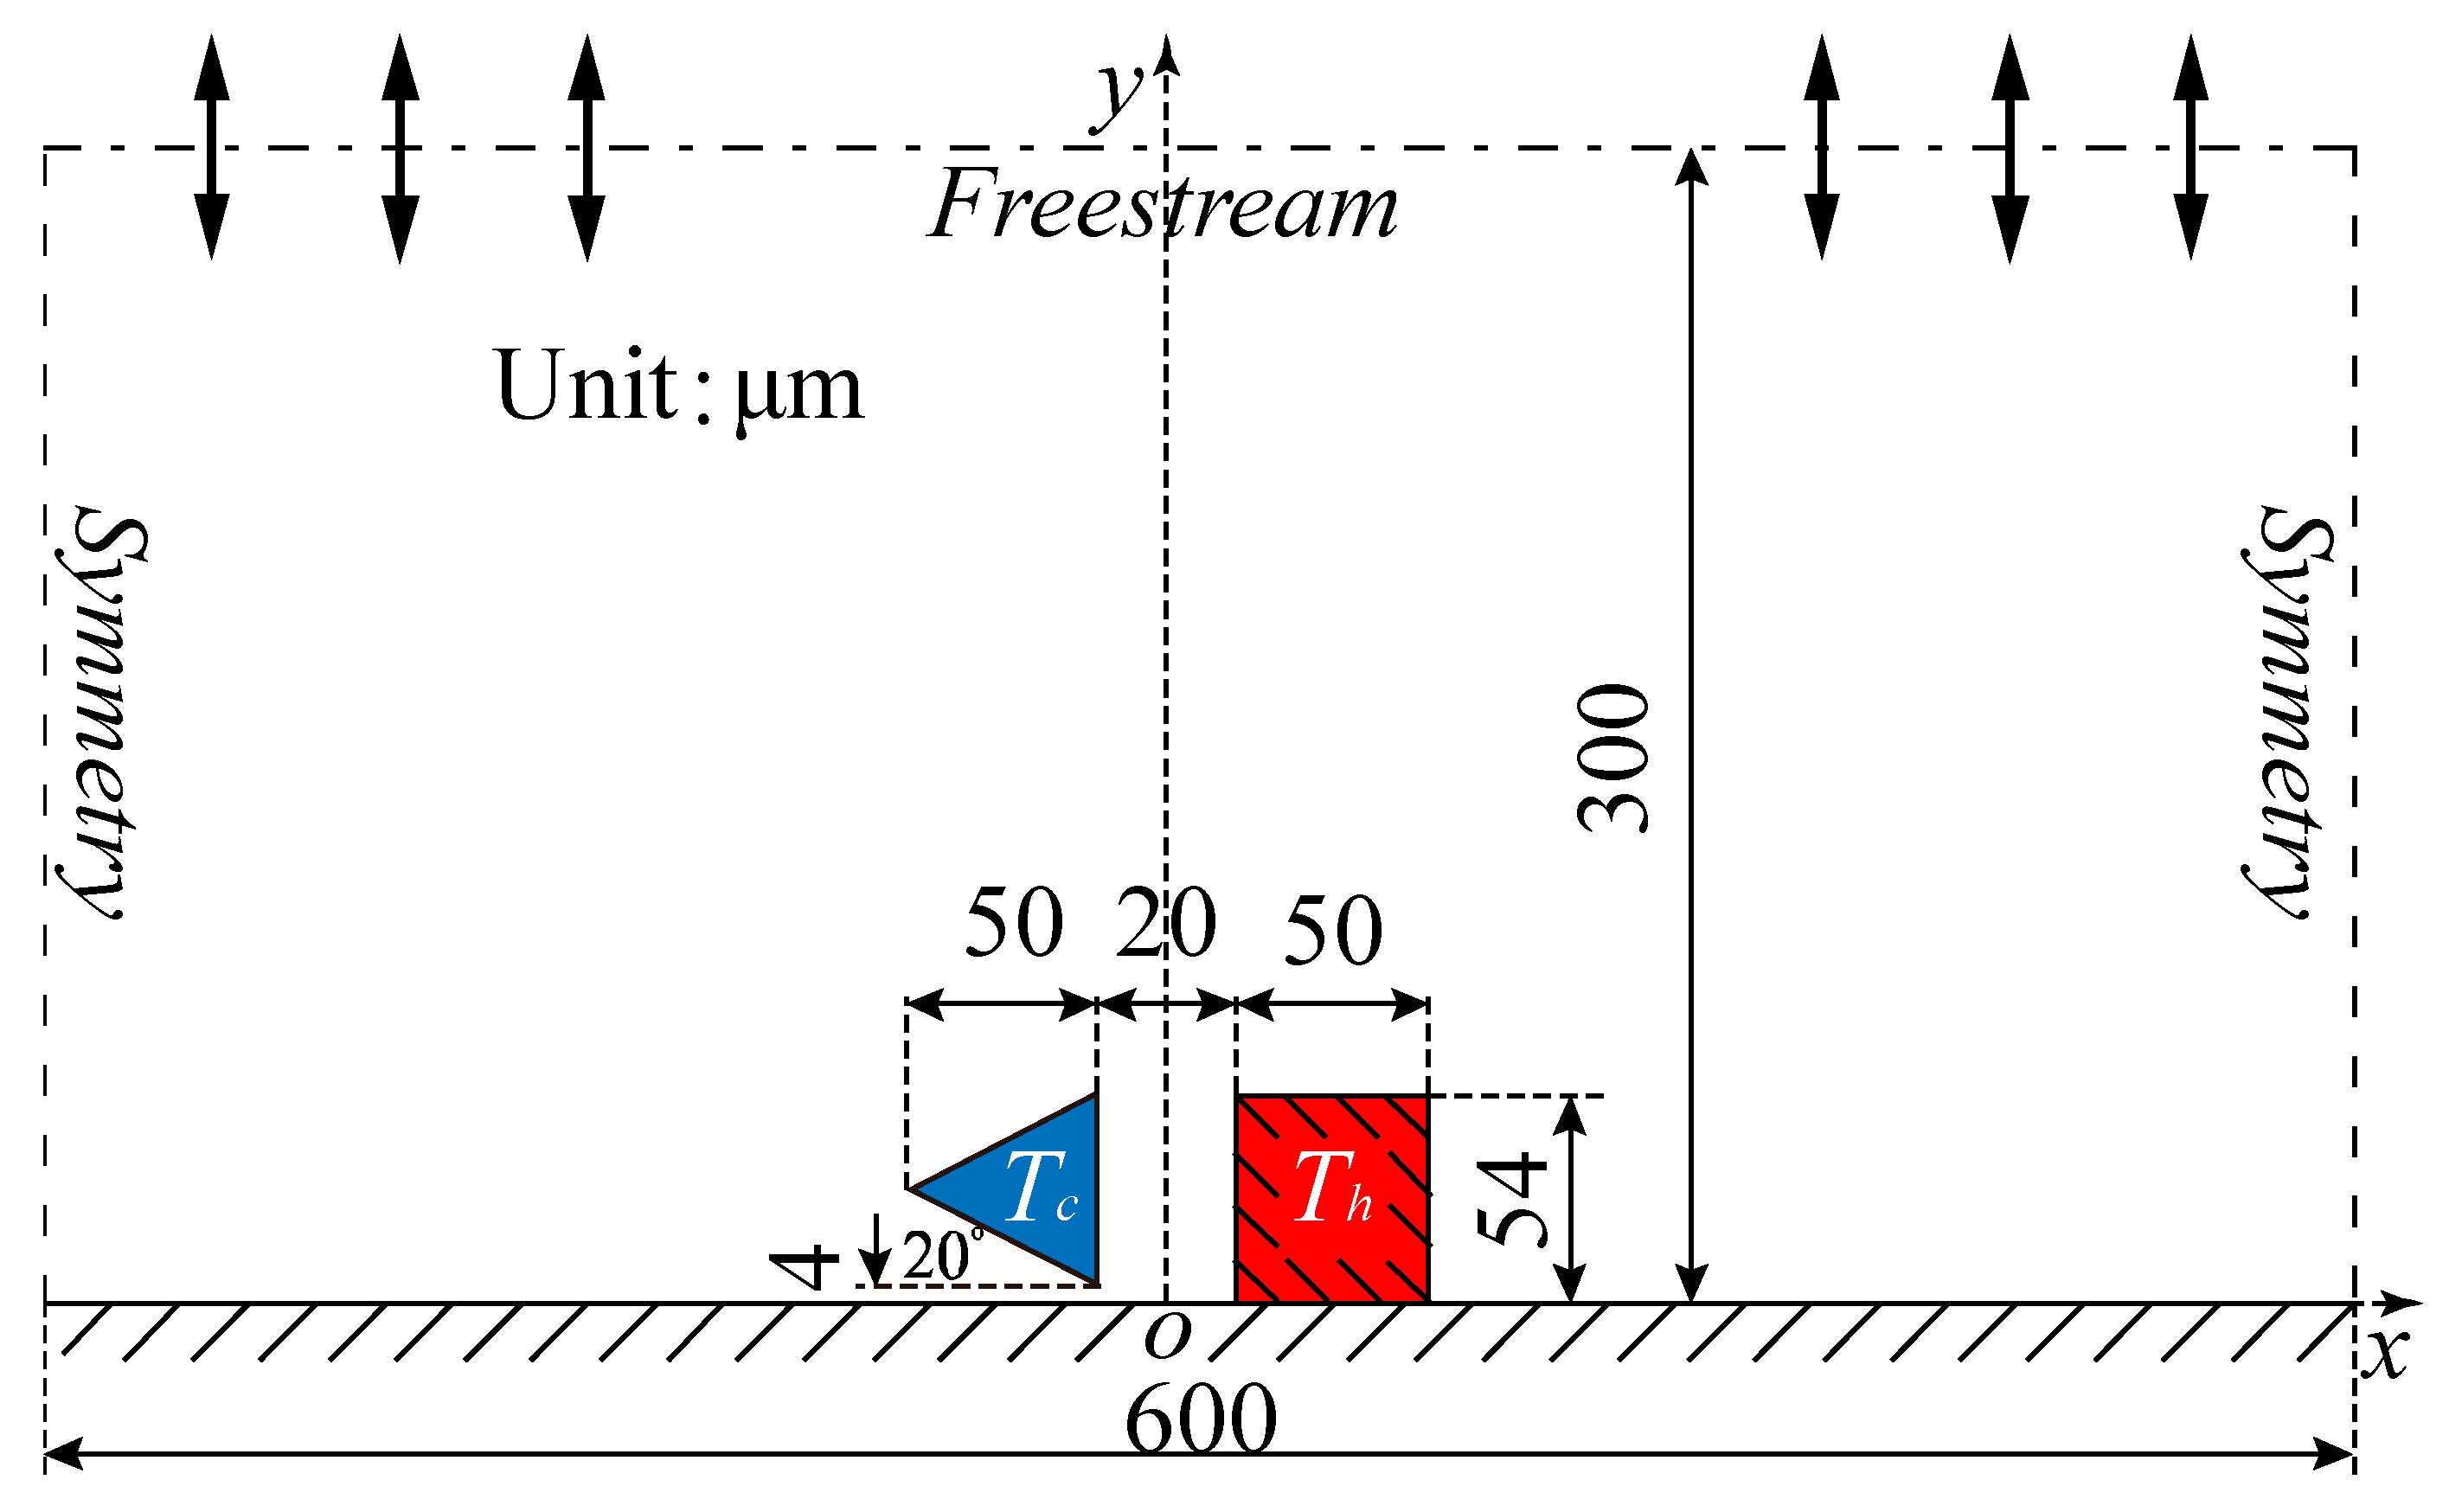
2. Problem Statement
Figure 1 schematically illustrates the MEMS hydrogen sensor configuration consisting of a series of rectangular hot beams and triangular cold beams. The cross-section dimension of the triangular cold beam at
is
, and the angle between the bottom surface and
direction is
.
and
are the width and height of the cold beam, respectively. The rectangular hot beam, at
, having a
distance from the cold beam, has a cross-section dimension of
. In the research, only the force acting on the cold beam is considered. Thus, the hot beam is fixed to the substrate, while the cold beam is suspended
above the substrate. Wall boundary condition is applied to the substrate, with wall temperature
. In order to improve the simulation efficiency, only one cold–hot beam pair is investigated within the domain of
for the gas flows and force characteristics. Moreover, the beam length in
direction is considered to be much larger than the cross-section dimension. Therefore, two-dimensional DSMC simulations are carried out.
In the DSMC simulations, symmetric boundary conditions were imposed on the left and right sides of the computational domain, as illustrated in
Figure 1. When simulation particles hit the symmetric boundaries, specular reflection occurs and the particles come back to the domain. Freestream boundary conditions (
) with parameters of the initial gas mixtures are imposed on the upper side of the domain. The simulated particles can flow in or out the domain through freestream boundary.
In this work, the reference configuration parameters are used when no specific descriptions of the factors are given. That is, (i) accommodation coefficients TMAC () and NEAC () of all the walls are set as 1; (ii) carrier gas is the binary gas mixtures consisting of 50% H2 and 50% N2. Moreover, in order to be physically practical (to increase Knudsen force), only the accommodation coefficients of the cold beam-inclined walls (the top and bottom surfaces) () vary in the range of , while the accommodation coefficients of the vertical right surface of the cold beam and all the surfaces of the hot beam remain unchanged ().
4. Results and Discussion
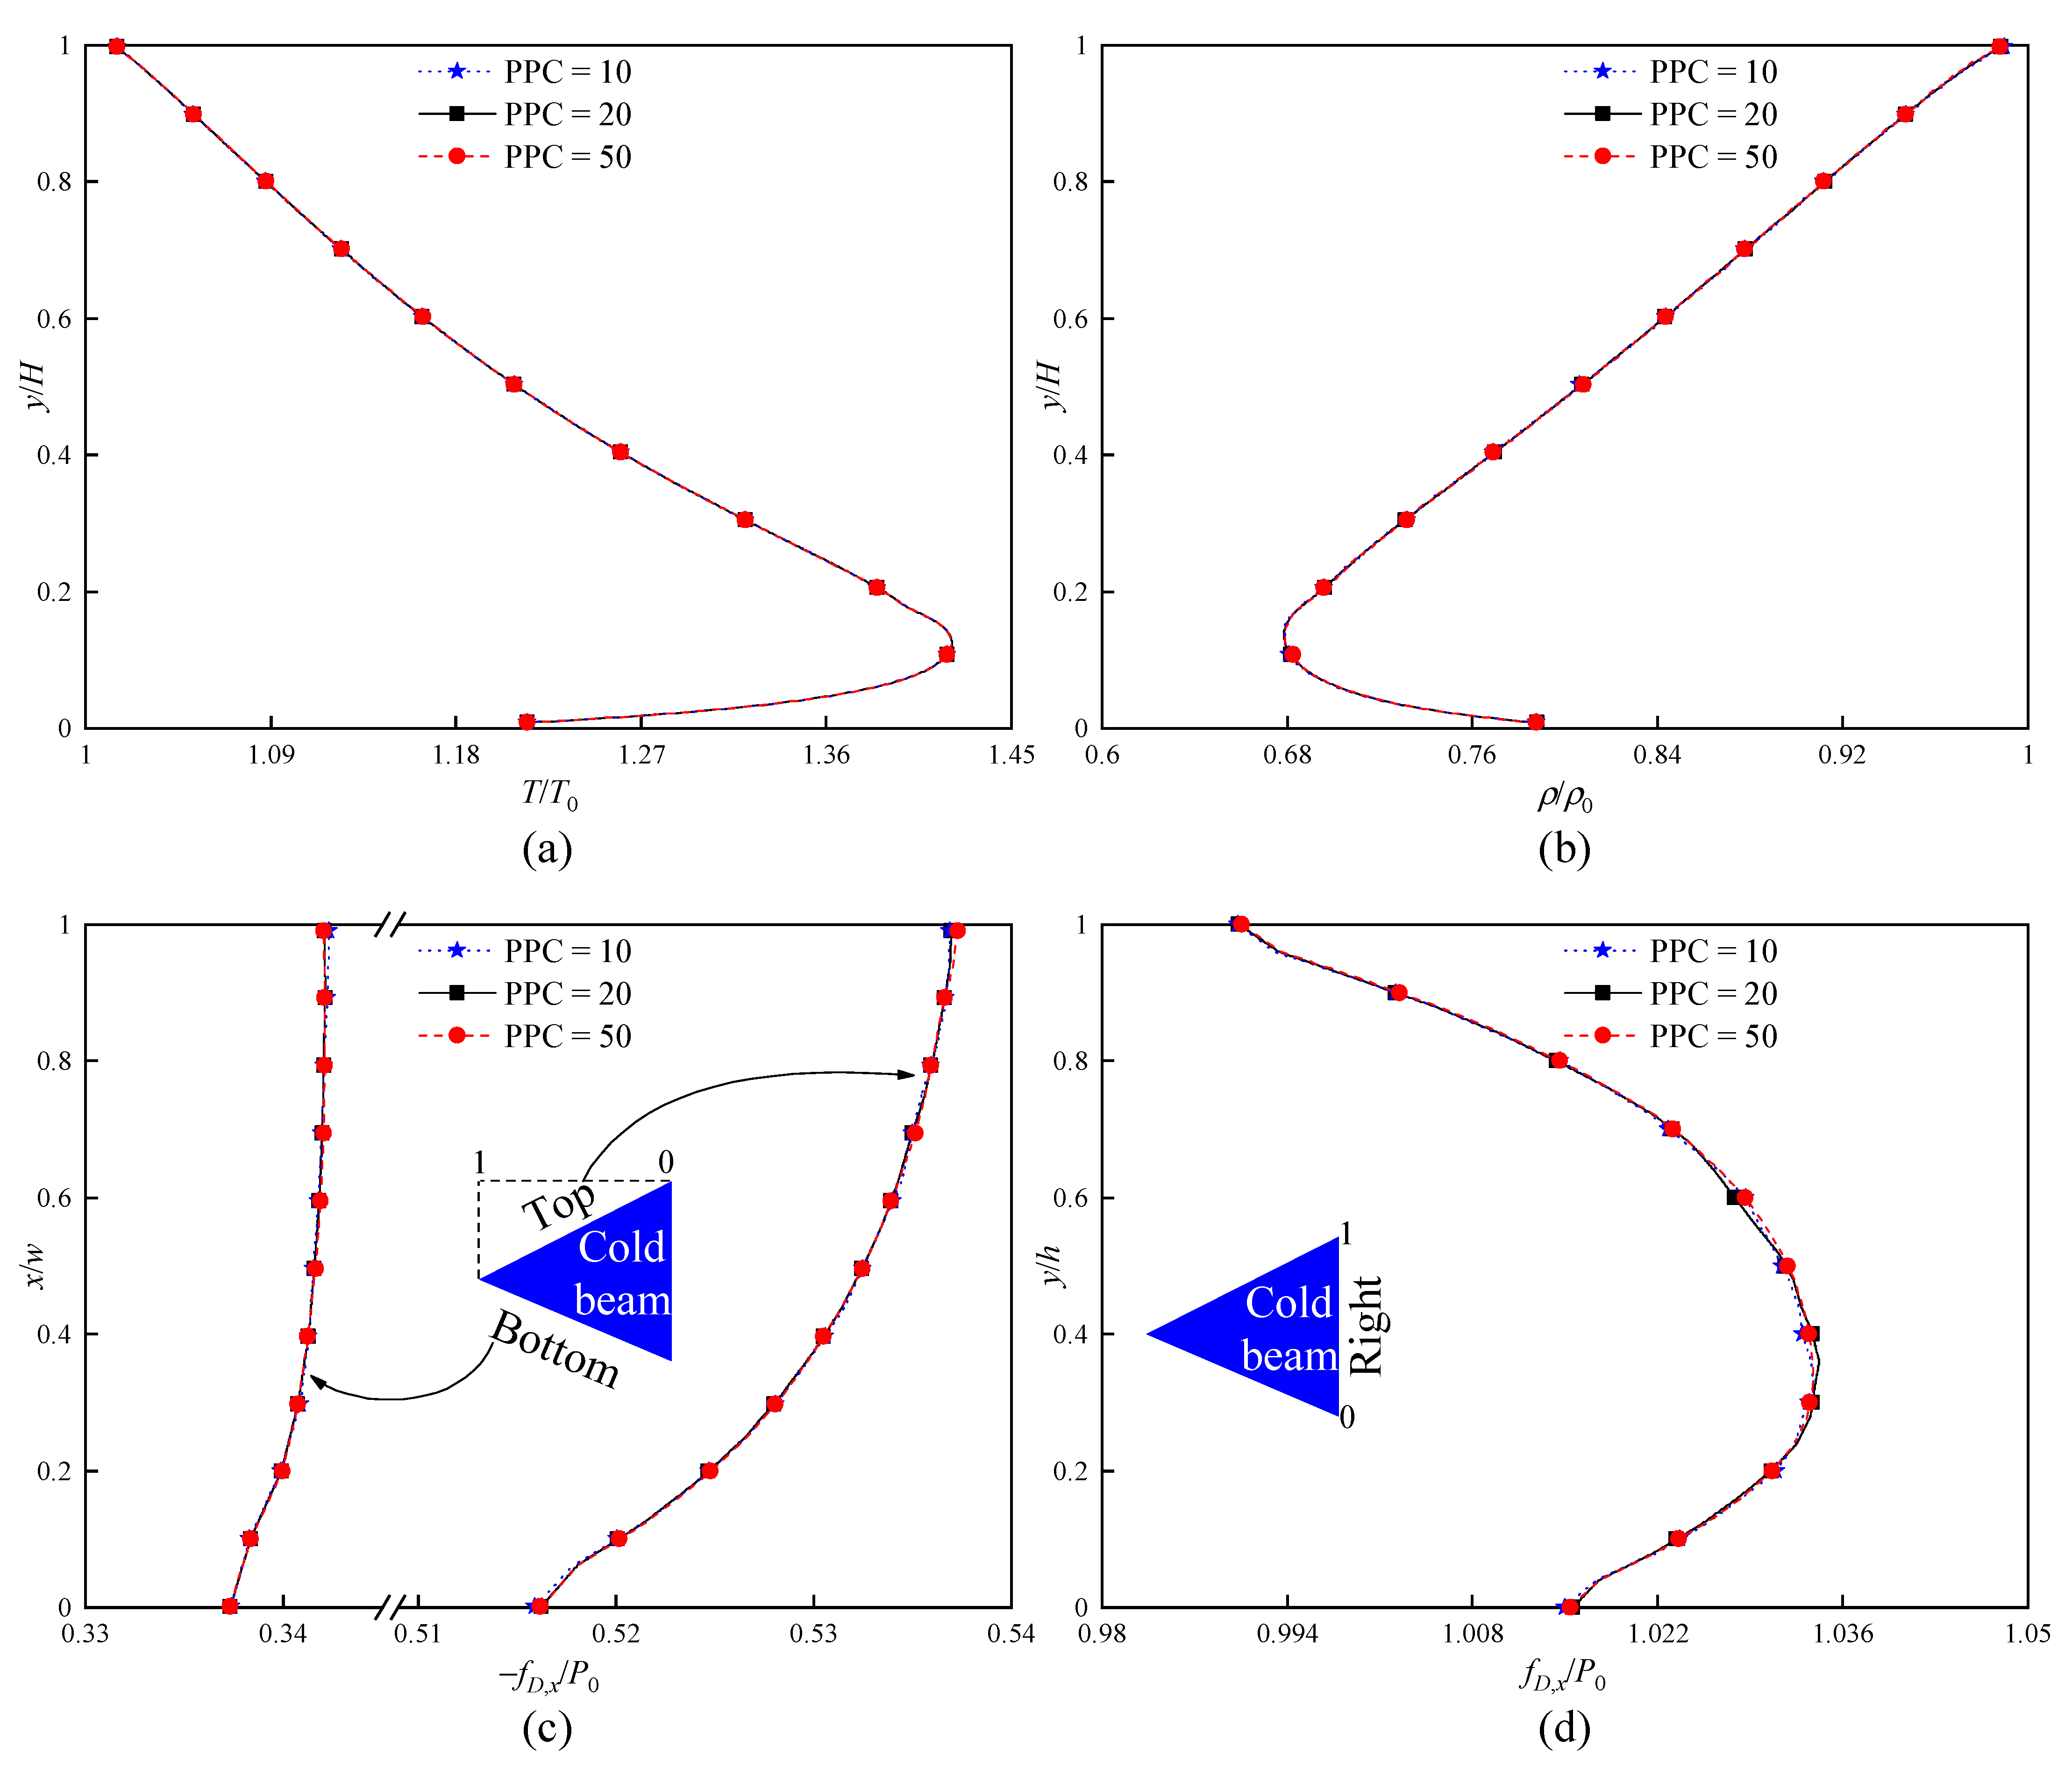
4.1. Independence Tests for Solution Parameters
It is well known that cell size, PPC, , and can influence the accuracy of DSMC results. Therefore, the validation investigations into the four numerical parameters with the reference configuration at the largest pressure and temperature, i.e., and , are carried out.
Firstly, the dependence checks for three cell sizes are conducted, that is, 10,942 cells (coarse grids), 44,470 cells (standard grids), and 177,880 cells (fine grids).
Figure 2 illustrates the flow field characteristics (temperatures and density) over the vertical line at
and the force distributions along the cold beam surfaces obtained for three different grids. It is found that the results of the standard and fine grids are slightly different, while the difference between these two grids and the coarse grid results is significantly different. Therefore, it is indicated that the application of standard grids is sufficient to provide solutions independent of the grids.
Secondly, the dependence tests for PPC are performed with the standard grids, that is, PPC = 10, 20, and 50. The obtained temperature, density, and force distributions based on the three PPCs are illustrated in
Figure 3. It can be found that the difference in the results for three PPCs is almost negligible. Therefore, it is assumed that the simulation results independent of PPC can be sufficiently provided at PPC = 20.
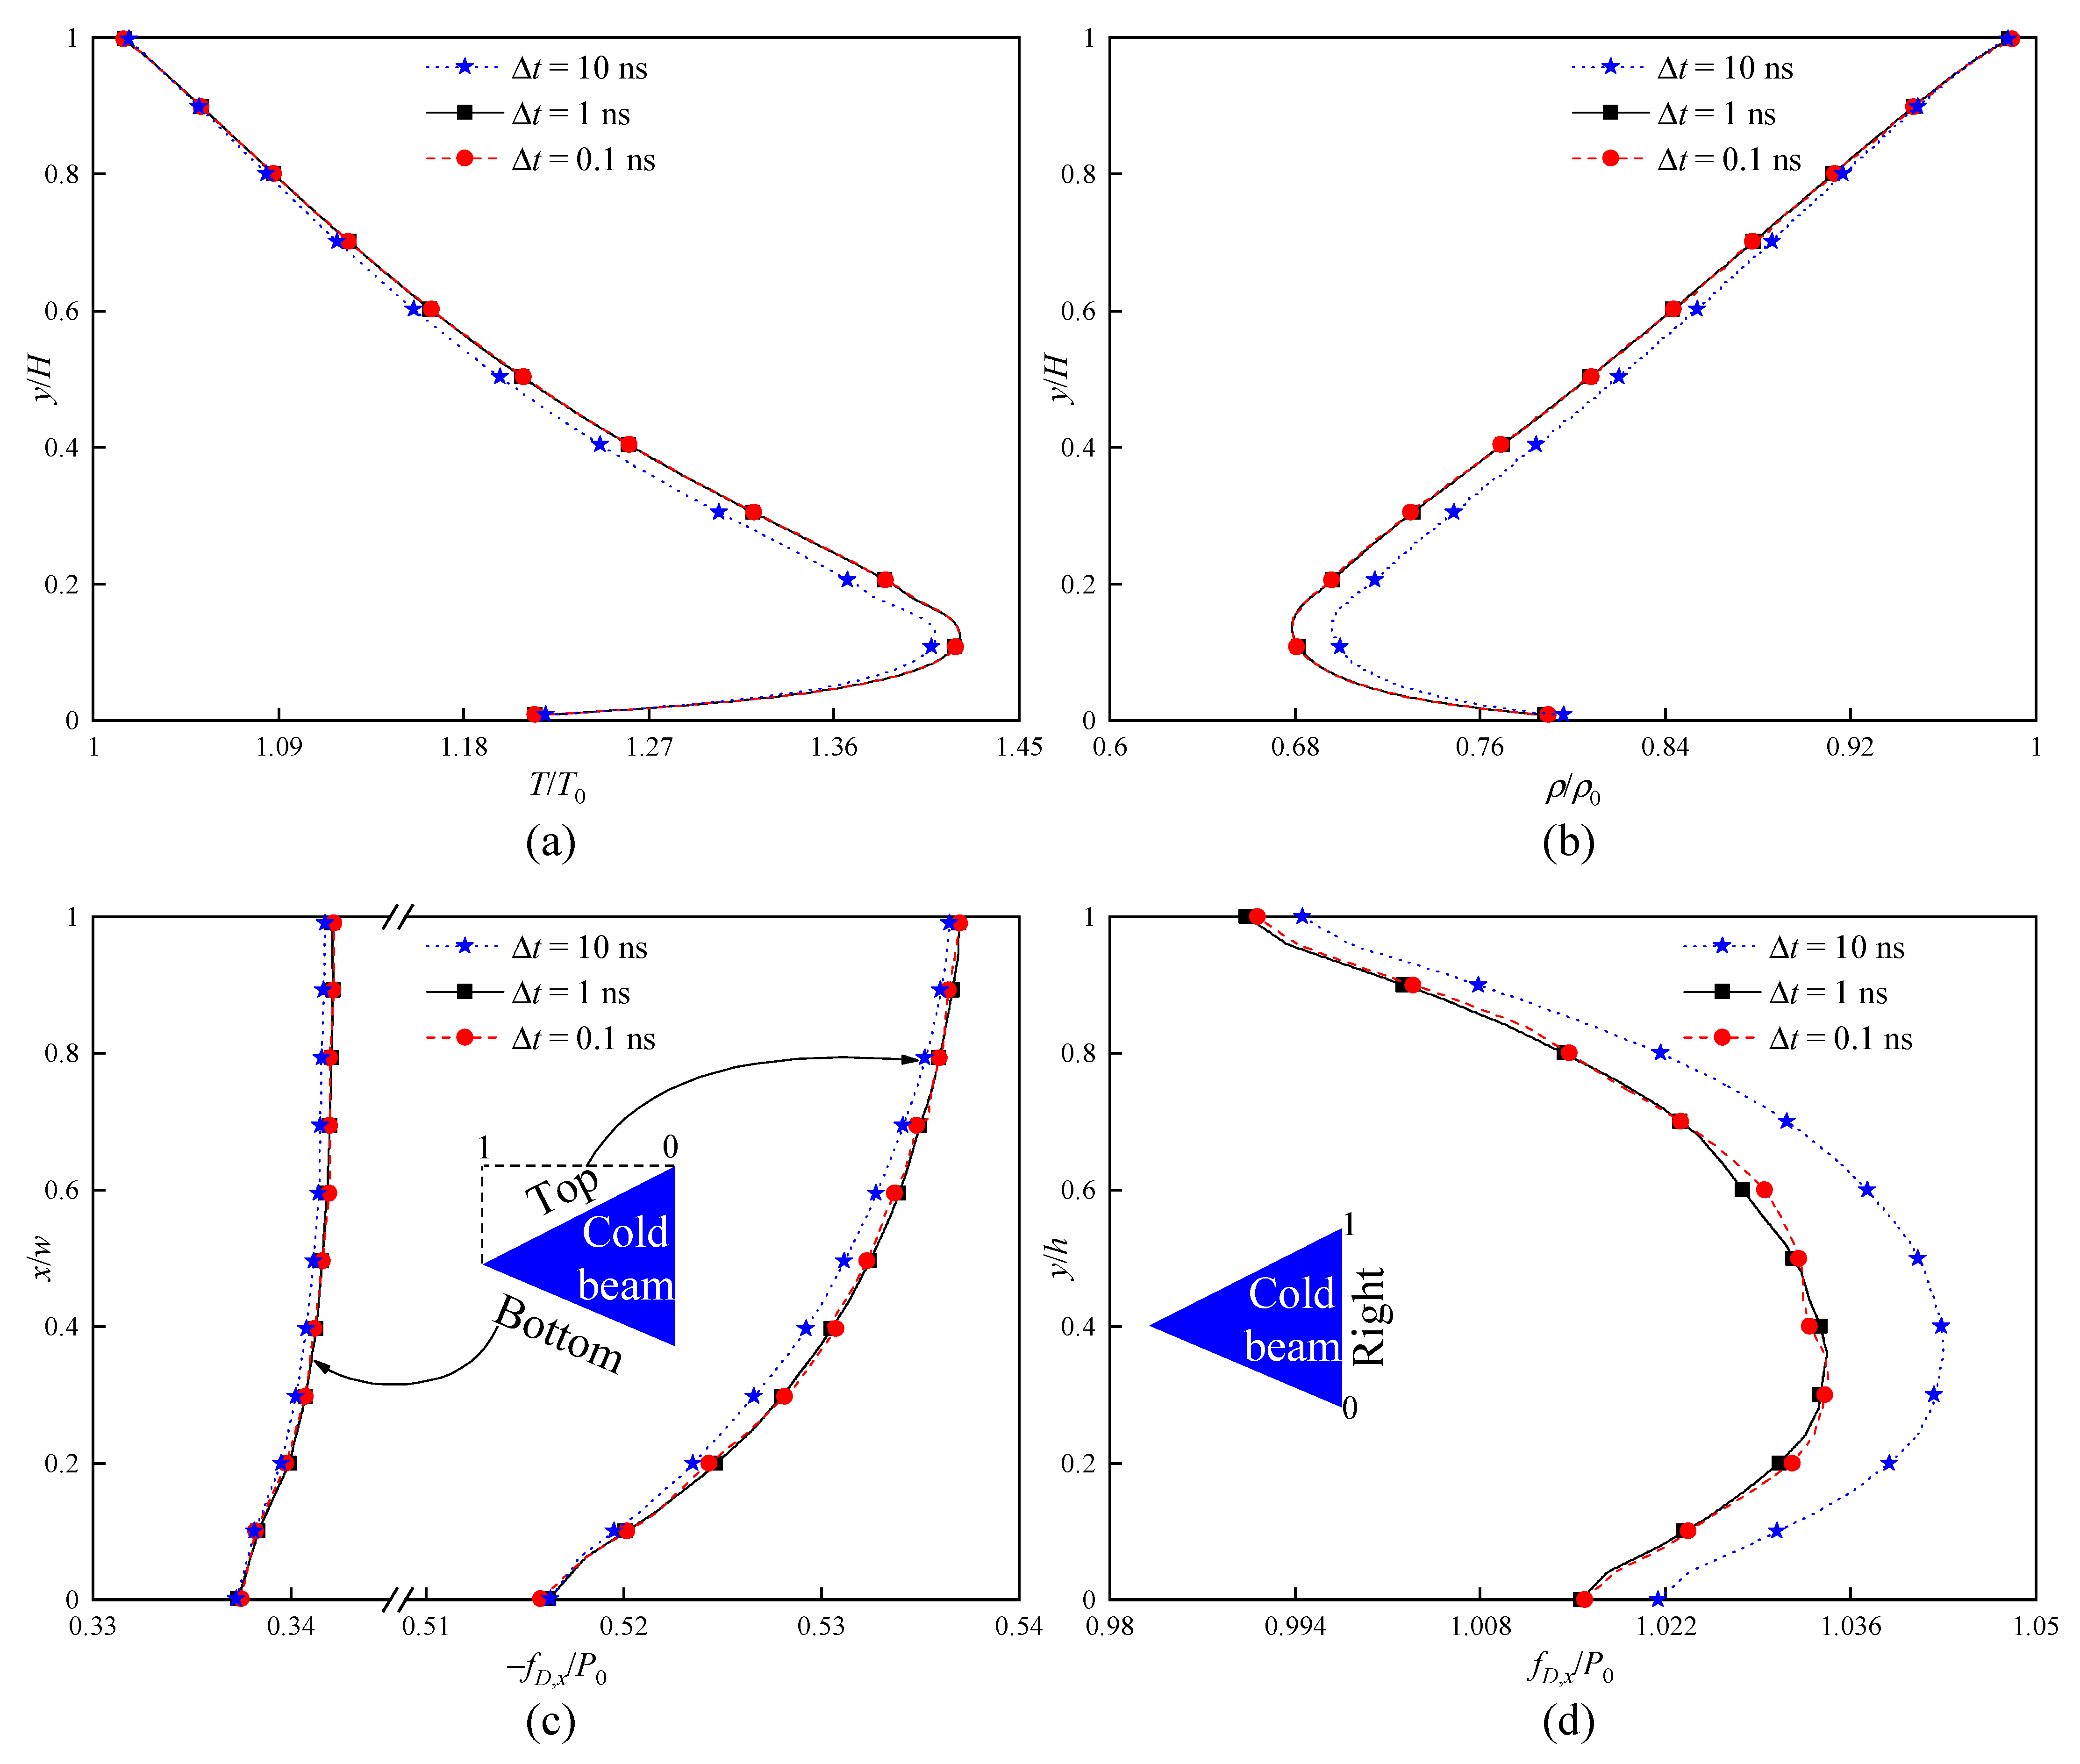
In addition, the influence of time step
is tested based on the numerical parameters of standard grids and PPC = 20. Compared with the basic case of time step (
), two news cases of
are separately reduced and increased by 10%, i.e.,
and
.
Figure 4 illustrates the temperature, density, and force distributions for three different
. It can be found that the difference between the results of the cases of
and
is almost negligible, while the results of the case of
significantly differ from data of the cases of
and
. This reveals the strong dependence of flow fields and force characteristics on time step
. For the current issue, the application of
to the calculation of field characteristics is sufficient.
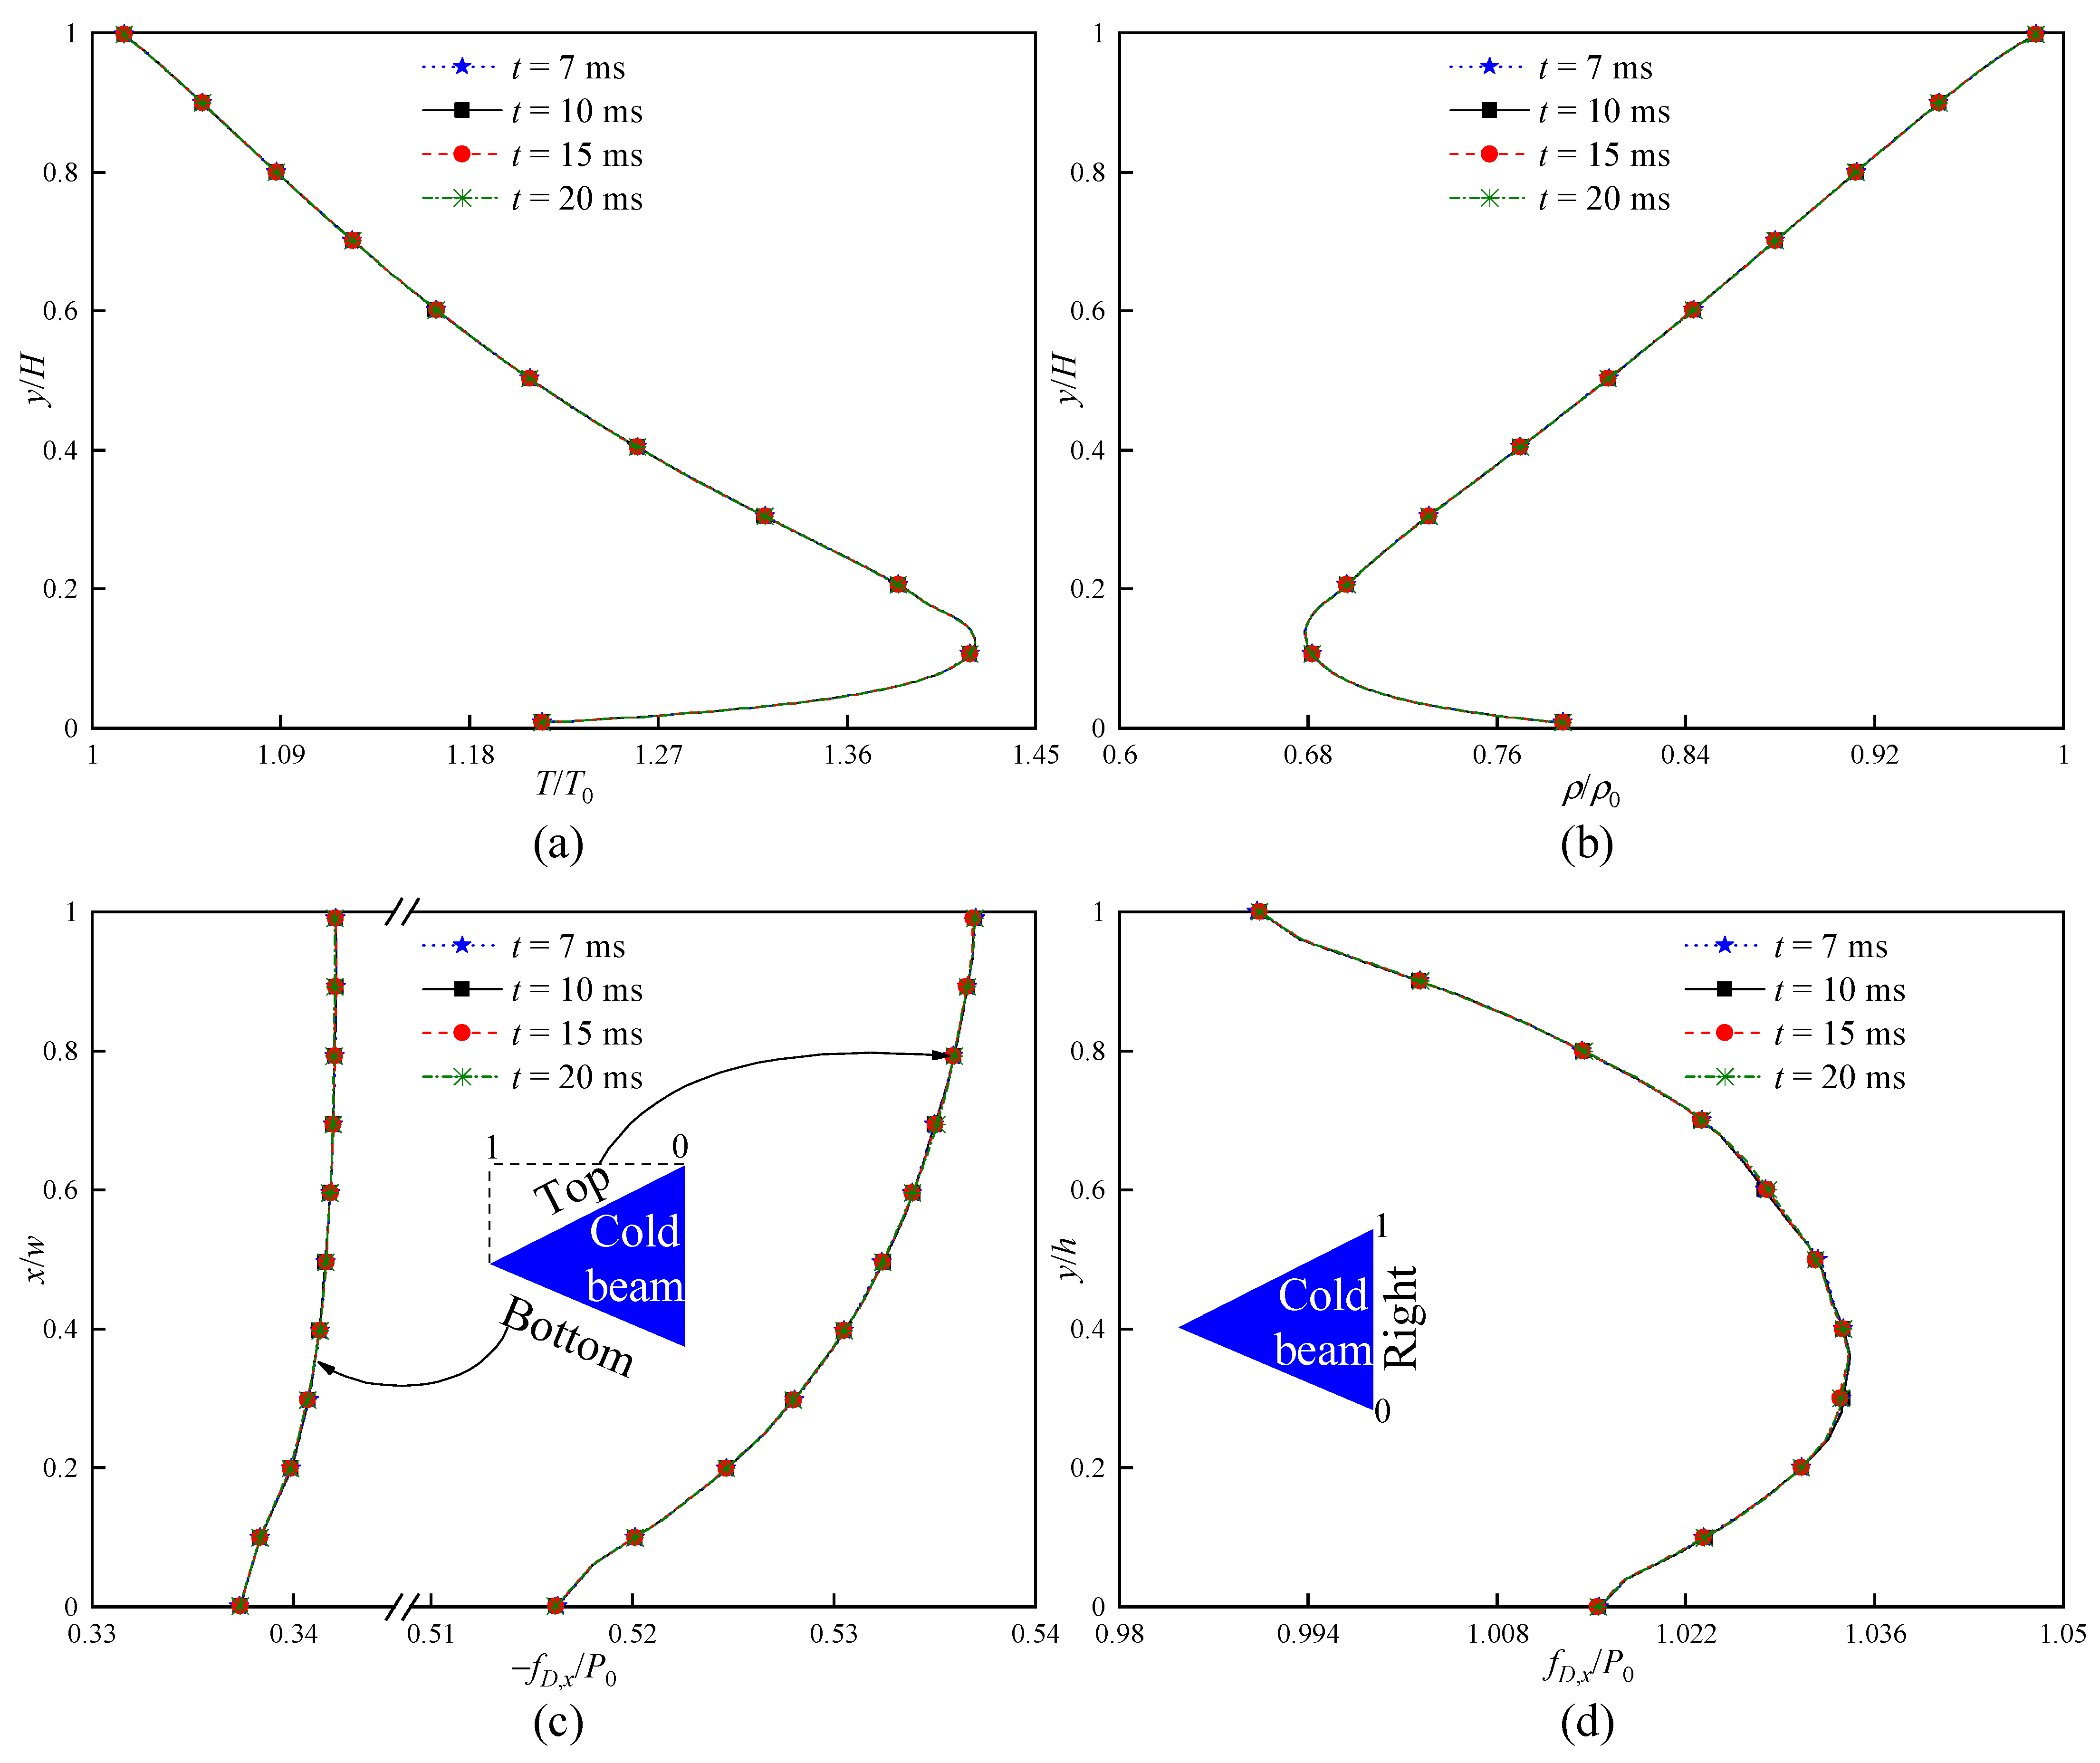
Lastly, the influence of the total simulation time
on the result stability is checked by applying the numerical parameters of standard grids, PPC = 20, and
. Four
are considered, i.e., 7 ms, 10 ms, 15 ms, and 20 ms.
Figure 5 presents the temperature, density, and force distributions for the four different
. It is revealed that the difference in the results for the four
is almost negligible. This means that, after the cases run for
, the results can basically reach a stable condition. Moreover, the errors of the predicted flow characteristics are reduced to the acceptable level.
In addition, the results of the average flow field characteristics over a vertical line at
and Knudsen force on the cold beam for different cell sizes, PPCs,
, and
are reported in
Table 2 and
Table 3. All these figures and tables clearly exhibit that the dependence of flow fields and force characteristics on the numerical parameters are almost negligible within the considered ranges of cell sizes (standard and fine grids),
,
, and
. The computations of DSMC solution schemes become more costly for small cell size and
, as well as large PPCs. Therefore, the numerical parameters of standard grid (44,470 cells), PPC = 20,
, and
are applied to all DSMC calculations in the current research.
4.2. Effects of Accommodation Coefficients
In this part, the influence of the surface material is investigated by varying the accommodation coefficients of cold beam-inclined top and bottom surfaces, with the geometry and position of the beams remaining unchanged.
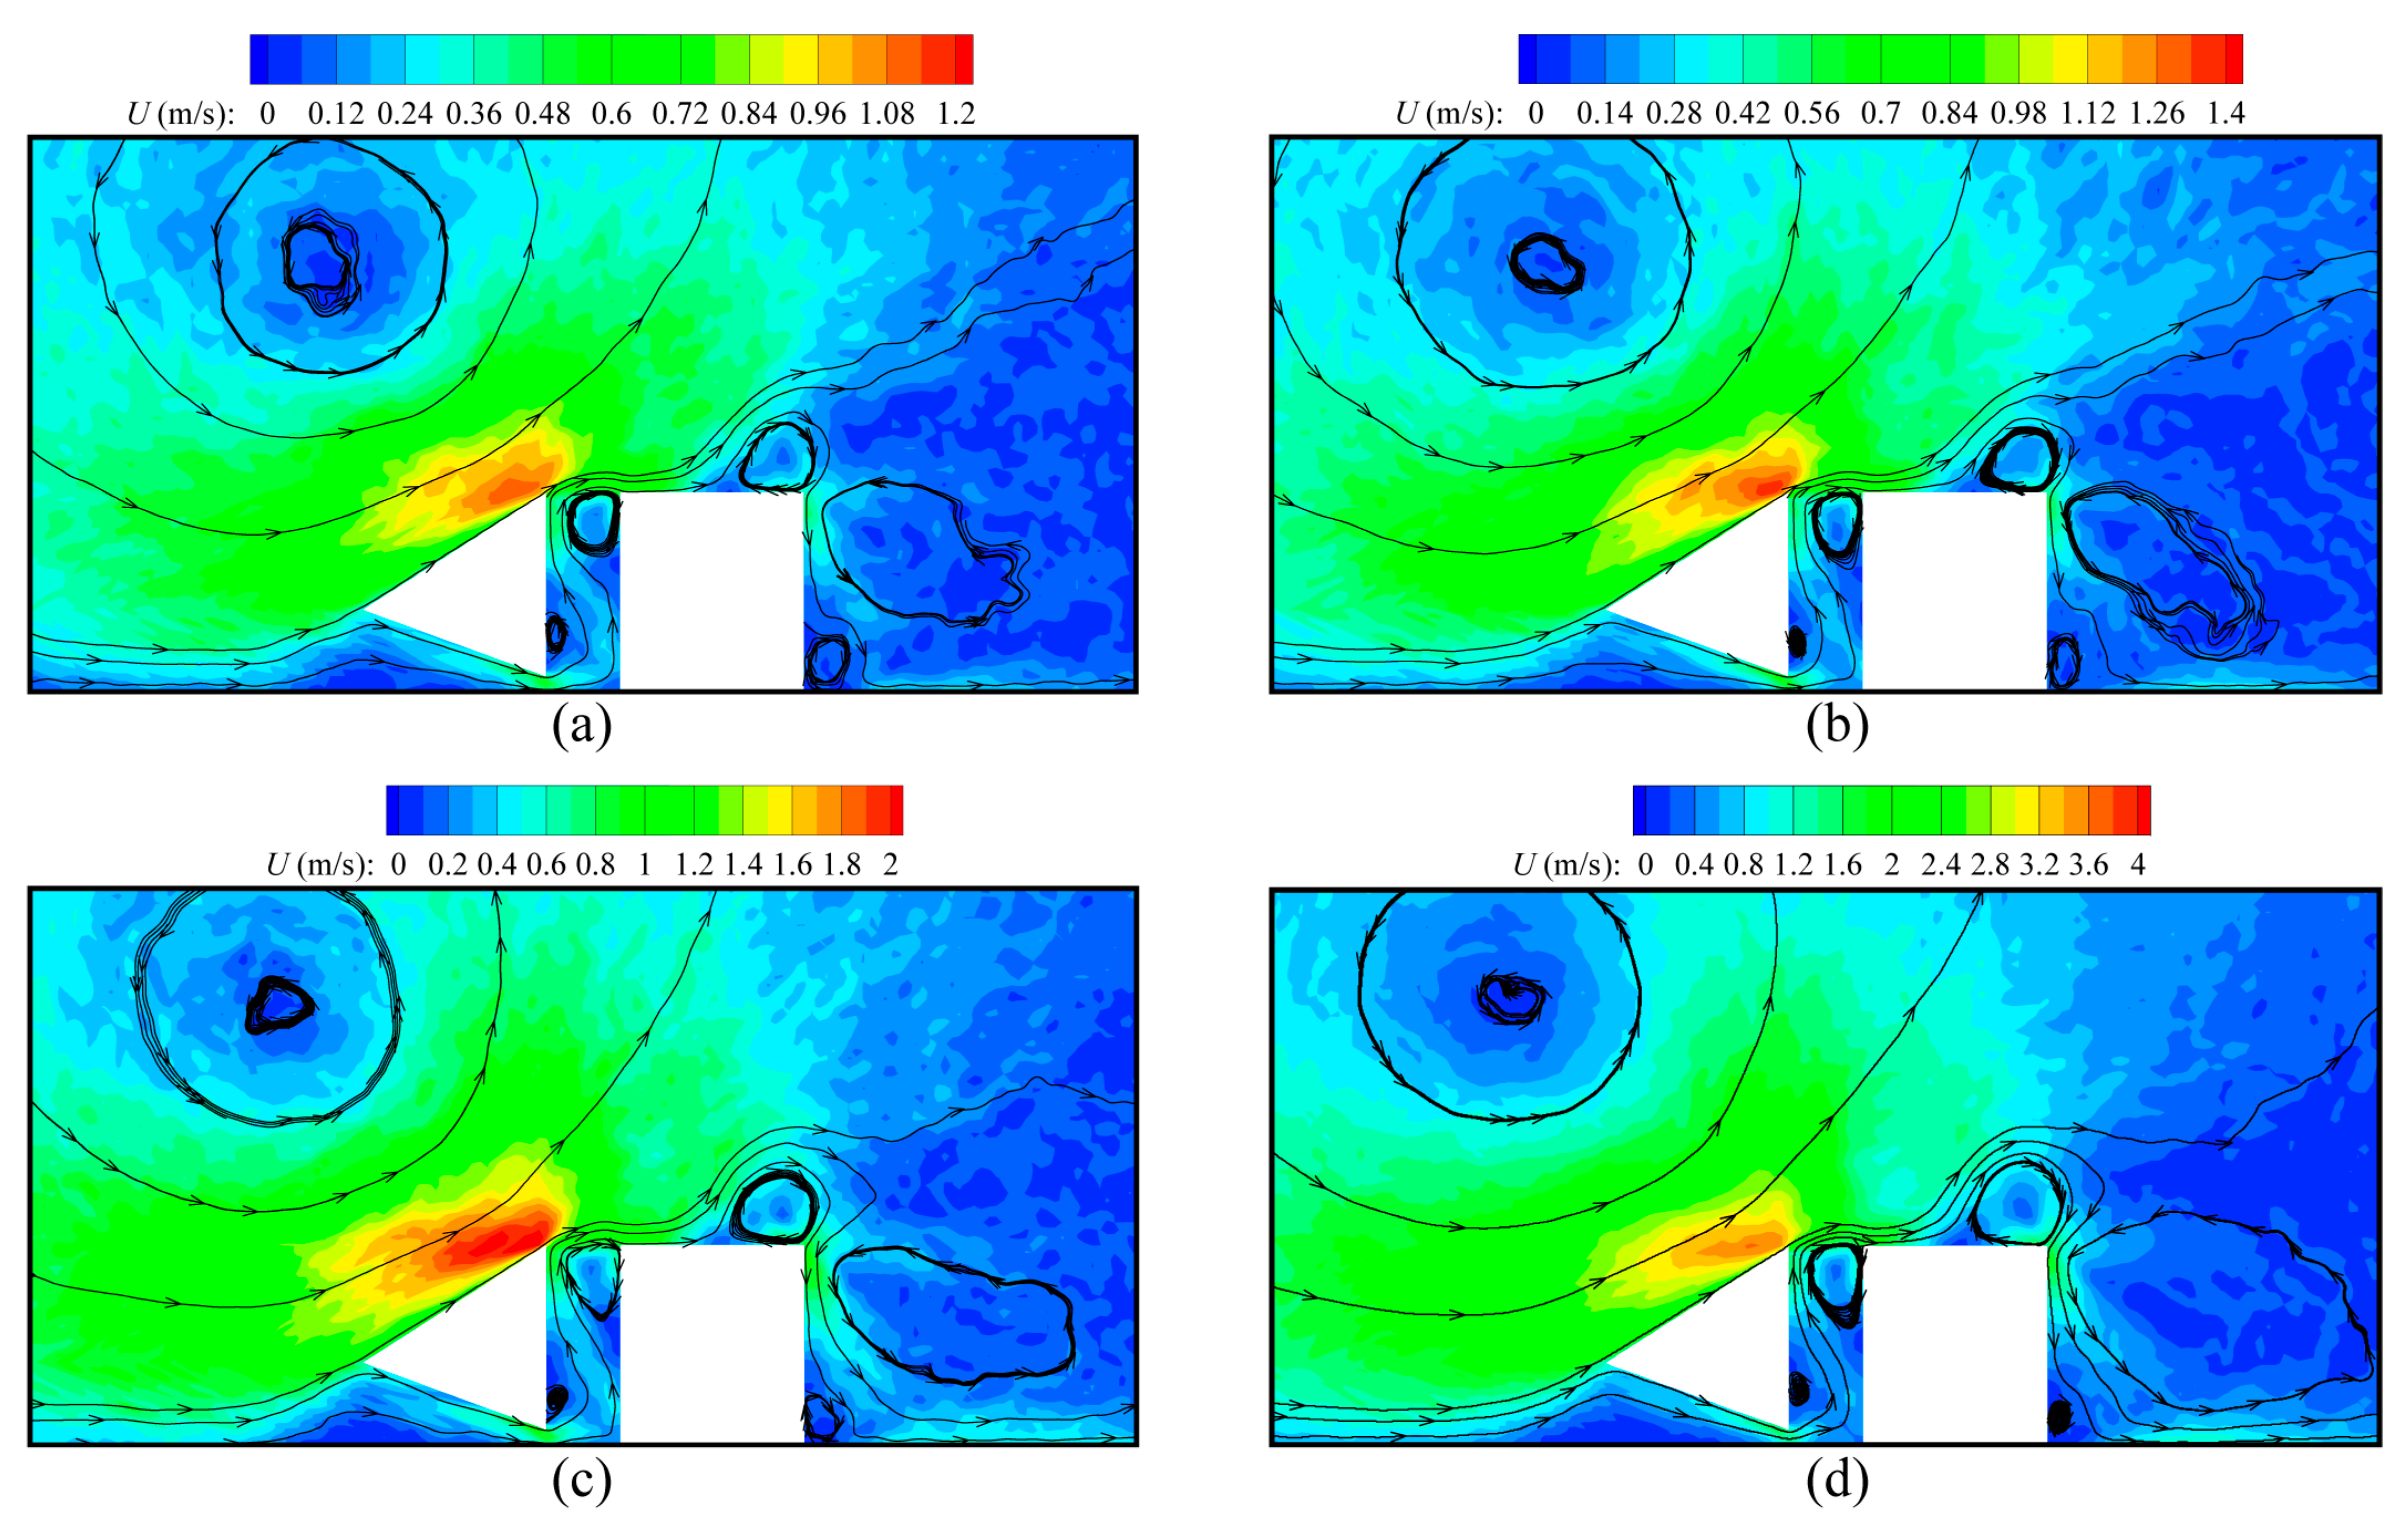
The speed contours and velocity streamlines around beams for various values of the accommodation coefficient
are illustrated in
Figure 6. As expected, the gas flow characteristics strongly depend on
. The temperature gradients near the inclined walls increase owing to the decrease in
, which is more effective to induce gas flows. Thus, the overall speed of gas flows significantly increases as
reduces. This qualitative behavior is similar to the results reported in Ref. [
29]. In addition, it is found that the difference in flow patterns due to the change in
only appears near the cold beam lower tip. That is, with
reducing, the size of the vortex near the cold beam lower tip decreases and even disappears, because the stronger rightward flows occur for a small
. However, different from the current results, the previous research reported that
causes a big difference in the flow patterns [
30]. In fact, in Ref. [
30], the accommodation coefficients of all surfaces vary, whereas only the accommodation coefficients of the cold beam-inclined walls are changed in the current work.
Knudsen force, an important parameter for the current cold–hot micro-beam hydrogen sensors, can be obtained from the simulation. In DSMC, the force density
acting on the solid walls can be obtained from the incident and reflected the momentum of molecules colliding with surfaces per unit area, is expressed as follows:
where
denotes the real number of gas molecules denoted by one simulation particle,
represents the unit area of particles impinging on walls,
indicates the number of simulation particles colliding with walls per unit area
within time step
,
is the mass of simulation particles,
is the velocity of simulation particles, the superscripts
and
represent incident and reflected particles, respectively.
The cold beam is assumed to move only in direction; thus, only the force density of component on the cold beam is considered. It is noted that force density in direction leads to the attraction between cold and hot beams, while in direction causes the repulsion between cold and hot beams. Therefore, in and directions are considered to be negative and positive, respectively. Lastly, the net Knudsen force exerting on a cold beam can be obtained from the integration of the force density on all surfaces of the cold beam.
In order to quantitatively analyze the influence of
on the force exerting on a cold beam,
Figure 7 illustrates the dimensionless force density
distributions over all cold beam surfaces and the net Knudsen force. Similar to the results reported in Refs. [
29,
30,
31,
32],
Figure 7 exhibits a strong dependence of force on
. For the top surface, when
reduces, the overall variation tendency of
decreases. This is completely correct, because a small
means less molecules exchanging momentum with the wall. However, it is found that, in the region close to the cold-beam upper tip (
),
slightly increases when
reduces from 0.8 to 0.2, as illustrated in
Figure 7a. The reason appears to be that, for a small
, the transferred momentum of the fast molecules with higher temperature impinging on the wall can offset the momentum of less molecules exchanging with the wall. Compared with the situations on the top surface, the phenomenon of less molecules exchanging momentum with the wall dominates the bottom surface. This is also the reason for the fact that
significantly decreases as
reduces, as presented in
Figure 7b. Note that, at
,
for both the top and bottom surfaces occurs. This can be expected, because all molecules impinging on the surfaces perform specular reflection, i.e., no momentum or energy exchanged between the gas molecules and the walls. On the other hand, from
Figure 7c, it is observed that the difference in
distributions on the right surface for different
of the inclined walls is almost negligible. This means that the force exerting on the wall heavily depends on
of the wall itself, while the influence of
on the other walls is negligible.
As expected, the Knudsen force depends nonlinearly on
, and it increases as
reduces, as illustrated in
Figure 7d. In particular, when
decreases from 1 to 0.1, the magnitude of the increase in Knudsen force is small, while Knudsen force rapidly increases when
verges on zero. This means that using special material or treating the surfaces differently to make
verge on zero is extremely important to maximize Knudsen force. The results also demonstrate that, in a high-pressure environment, the dependence of Knudsen force on
is stronger than that in a low-pressure environment. Quantitatively, when
varies from 1 to 0, Knudsen force increases by approximately 34 times at
, but rises by approximately 736 times at
. The similar qualitative behavior is reported in Refs. [
29,
30,
31,
32]. In fact, within the
range for the generation of Knudsen force, the behavior is triggered by the fact that a higher pressure corresponds to a higher gas density; thus, more molecules interact with the walls.
Therefore, changing surface accommodation coefficients through the application of different material or different treatments on surfaces can be an effective way to adjust the value of Knudsen force.
Table 4 presents the effects of surface accommodation coefficients of each beam on Knudsen force from the current research and the previous literature.
4.3. Effects of Temperature Difference
Here, the effects of work conditions on the gas flows and Knudsen force are analyzed. The temperature difference between the cold and hot beams is an important factor, because temperature is the energy source to induce the rarefied gas flows in the current issue. The influence of is investigated at varying the hot beam temperature , with all other parameters remaining at the reference conditions. In practice, the variation in temperature can be achieved by simultaneously increasing the power of the hot beam heating elements and enhancing the cooling efficiency of the cold beam.
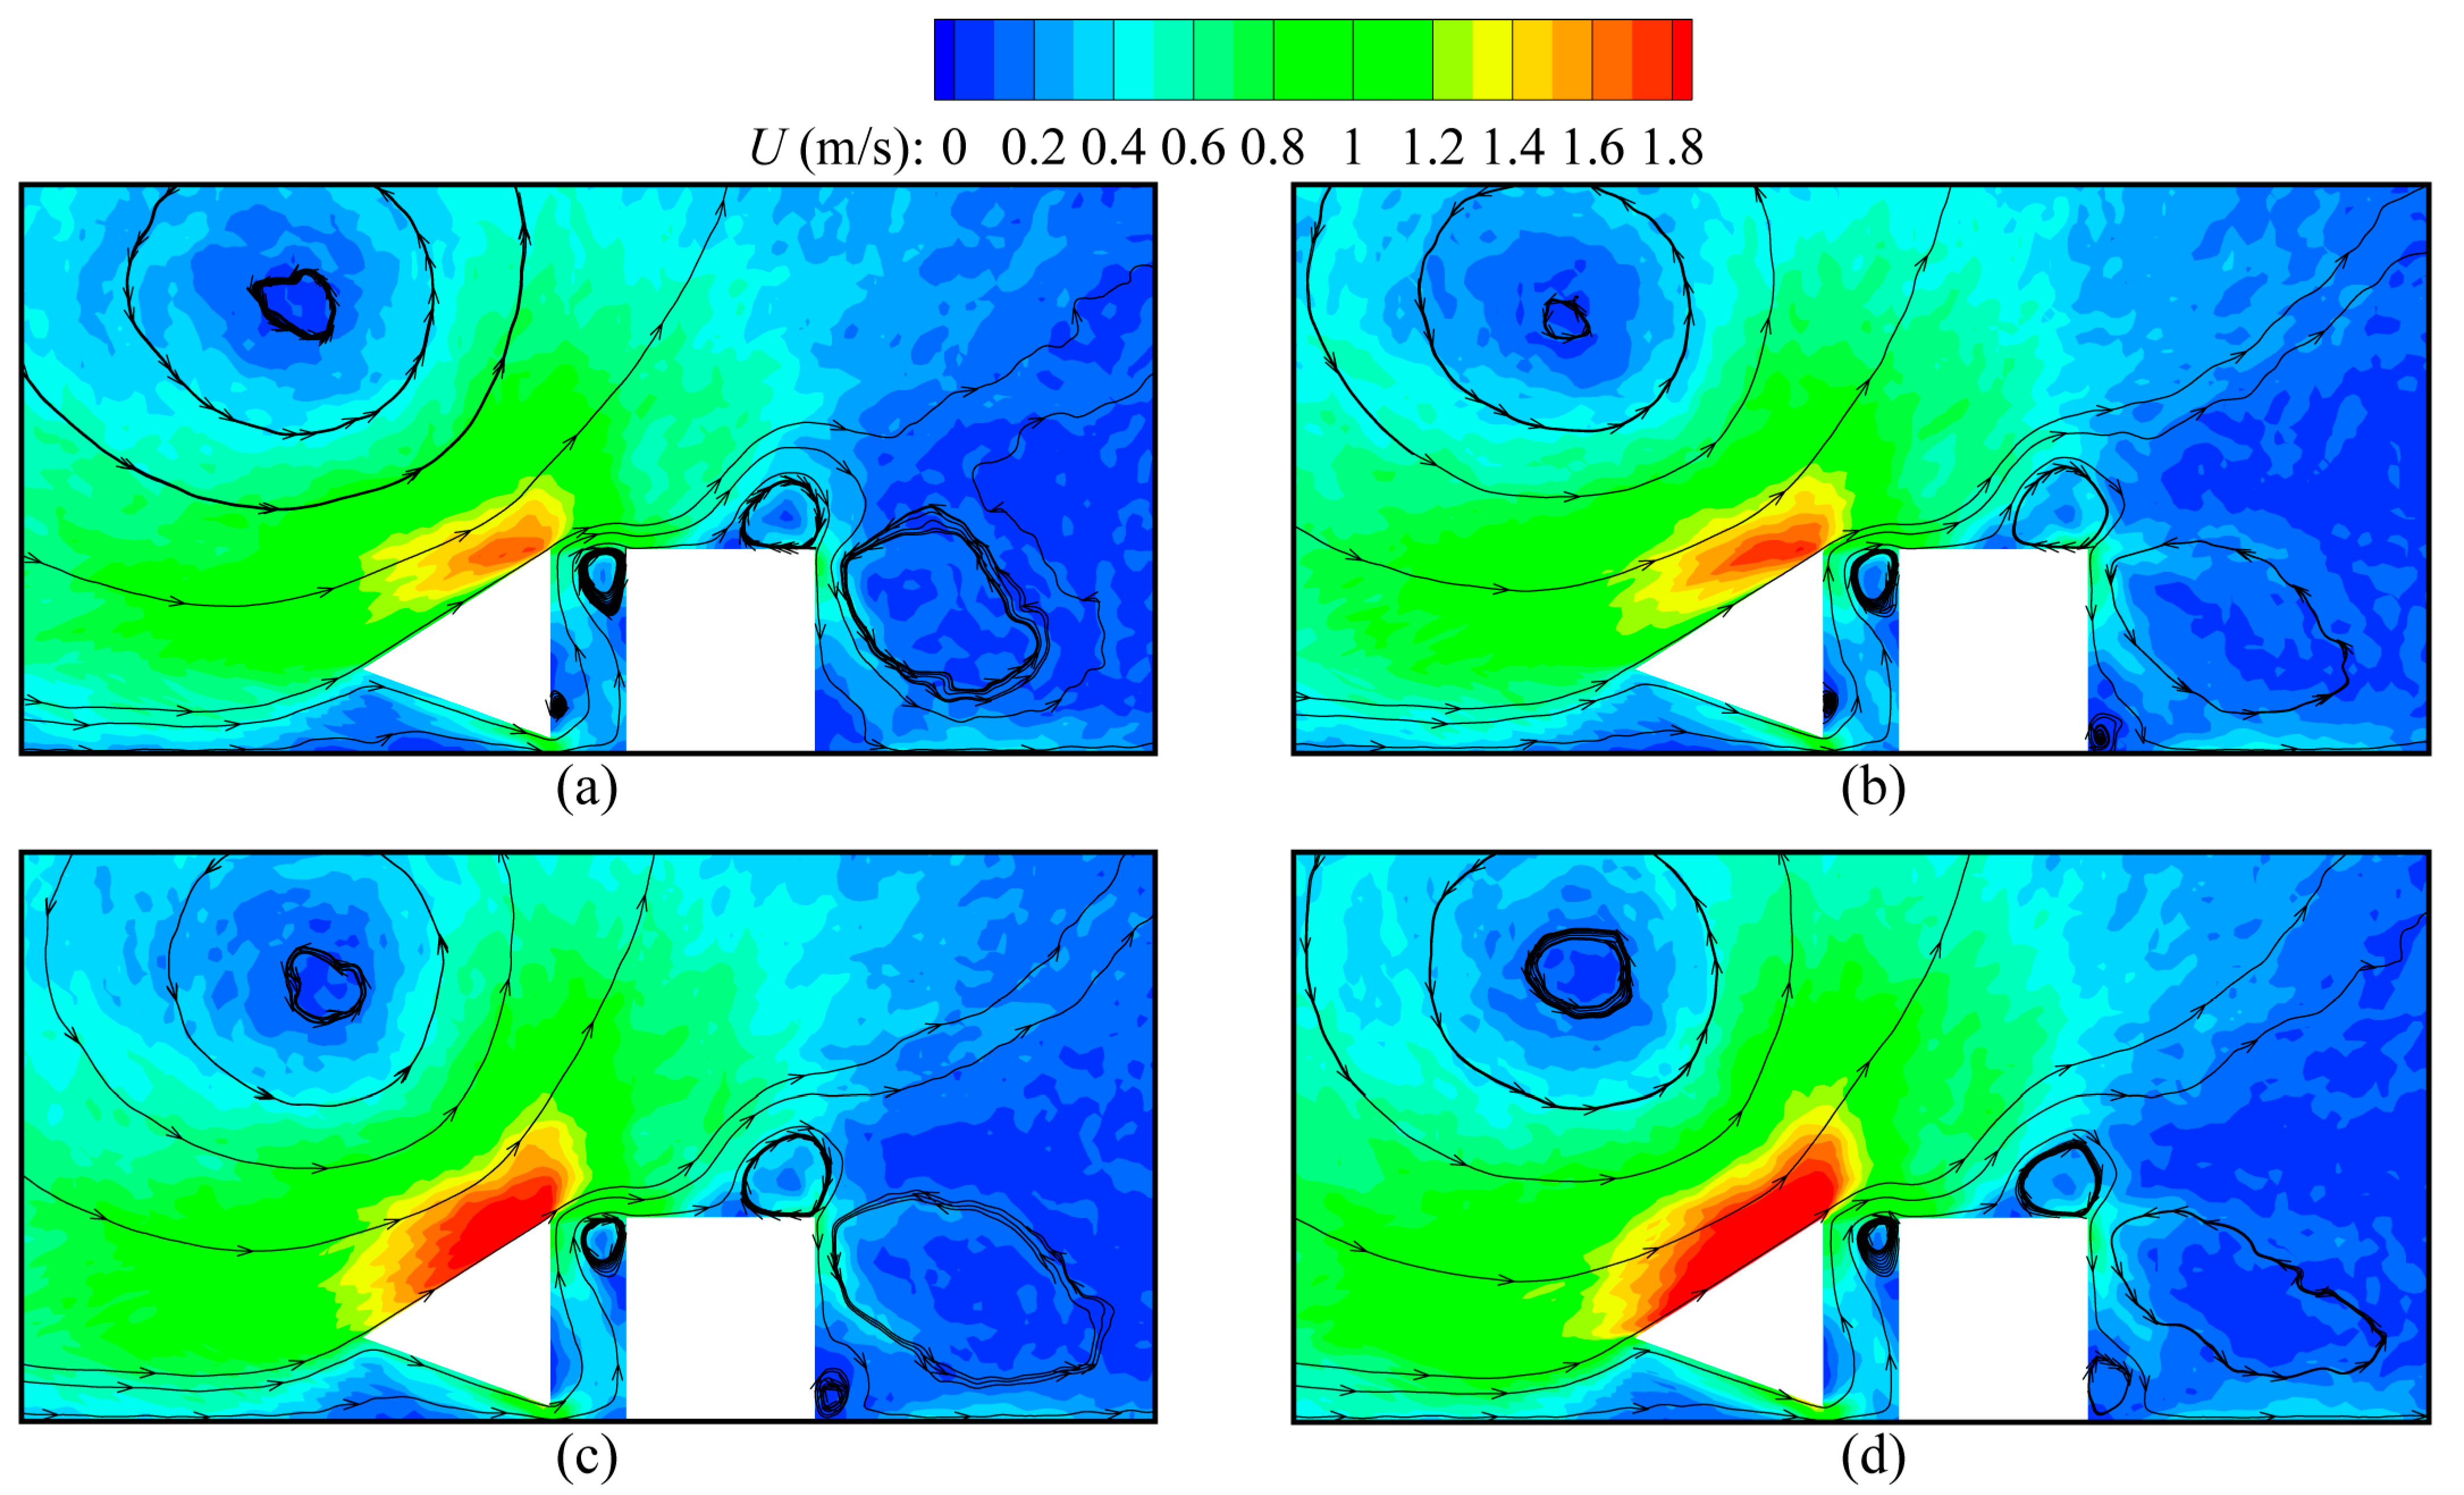
Figure 8 illustrates the speed contours and velocity streamlines around beams for
, 80 K, 150 K, and 300 K at
and
. As expected,
has a strong effect on the gas flows inside the device. The overall speed of the gas flows significantly increases as
increases, which can be expected as a large
corresponds to stronger temperature gradients, i.e., a larger inducing velocity. Likewise, compared with the situations for a low temperature gradient (
), the streamline patterns are clearer in the case of a high temperature gradient (
), as illustrated in
Figure 8d. This similar qualitative behavior can be found in the previous literature [
43]. On the other hand, as
rises, the sizes of the vortices near the hot beam upper-right tip decrease, and one of the vortices even disappears owing to the competitive effect between the thermal edge flows and the rightward flows. Although the flows are enhanced by the increase in
, the rightward flows depend more on the temperature gradients than the thermal edge flows. That is, with
increasing, the contribution of the rightward flows to the overall gas flows within the device becomes more dominant.
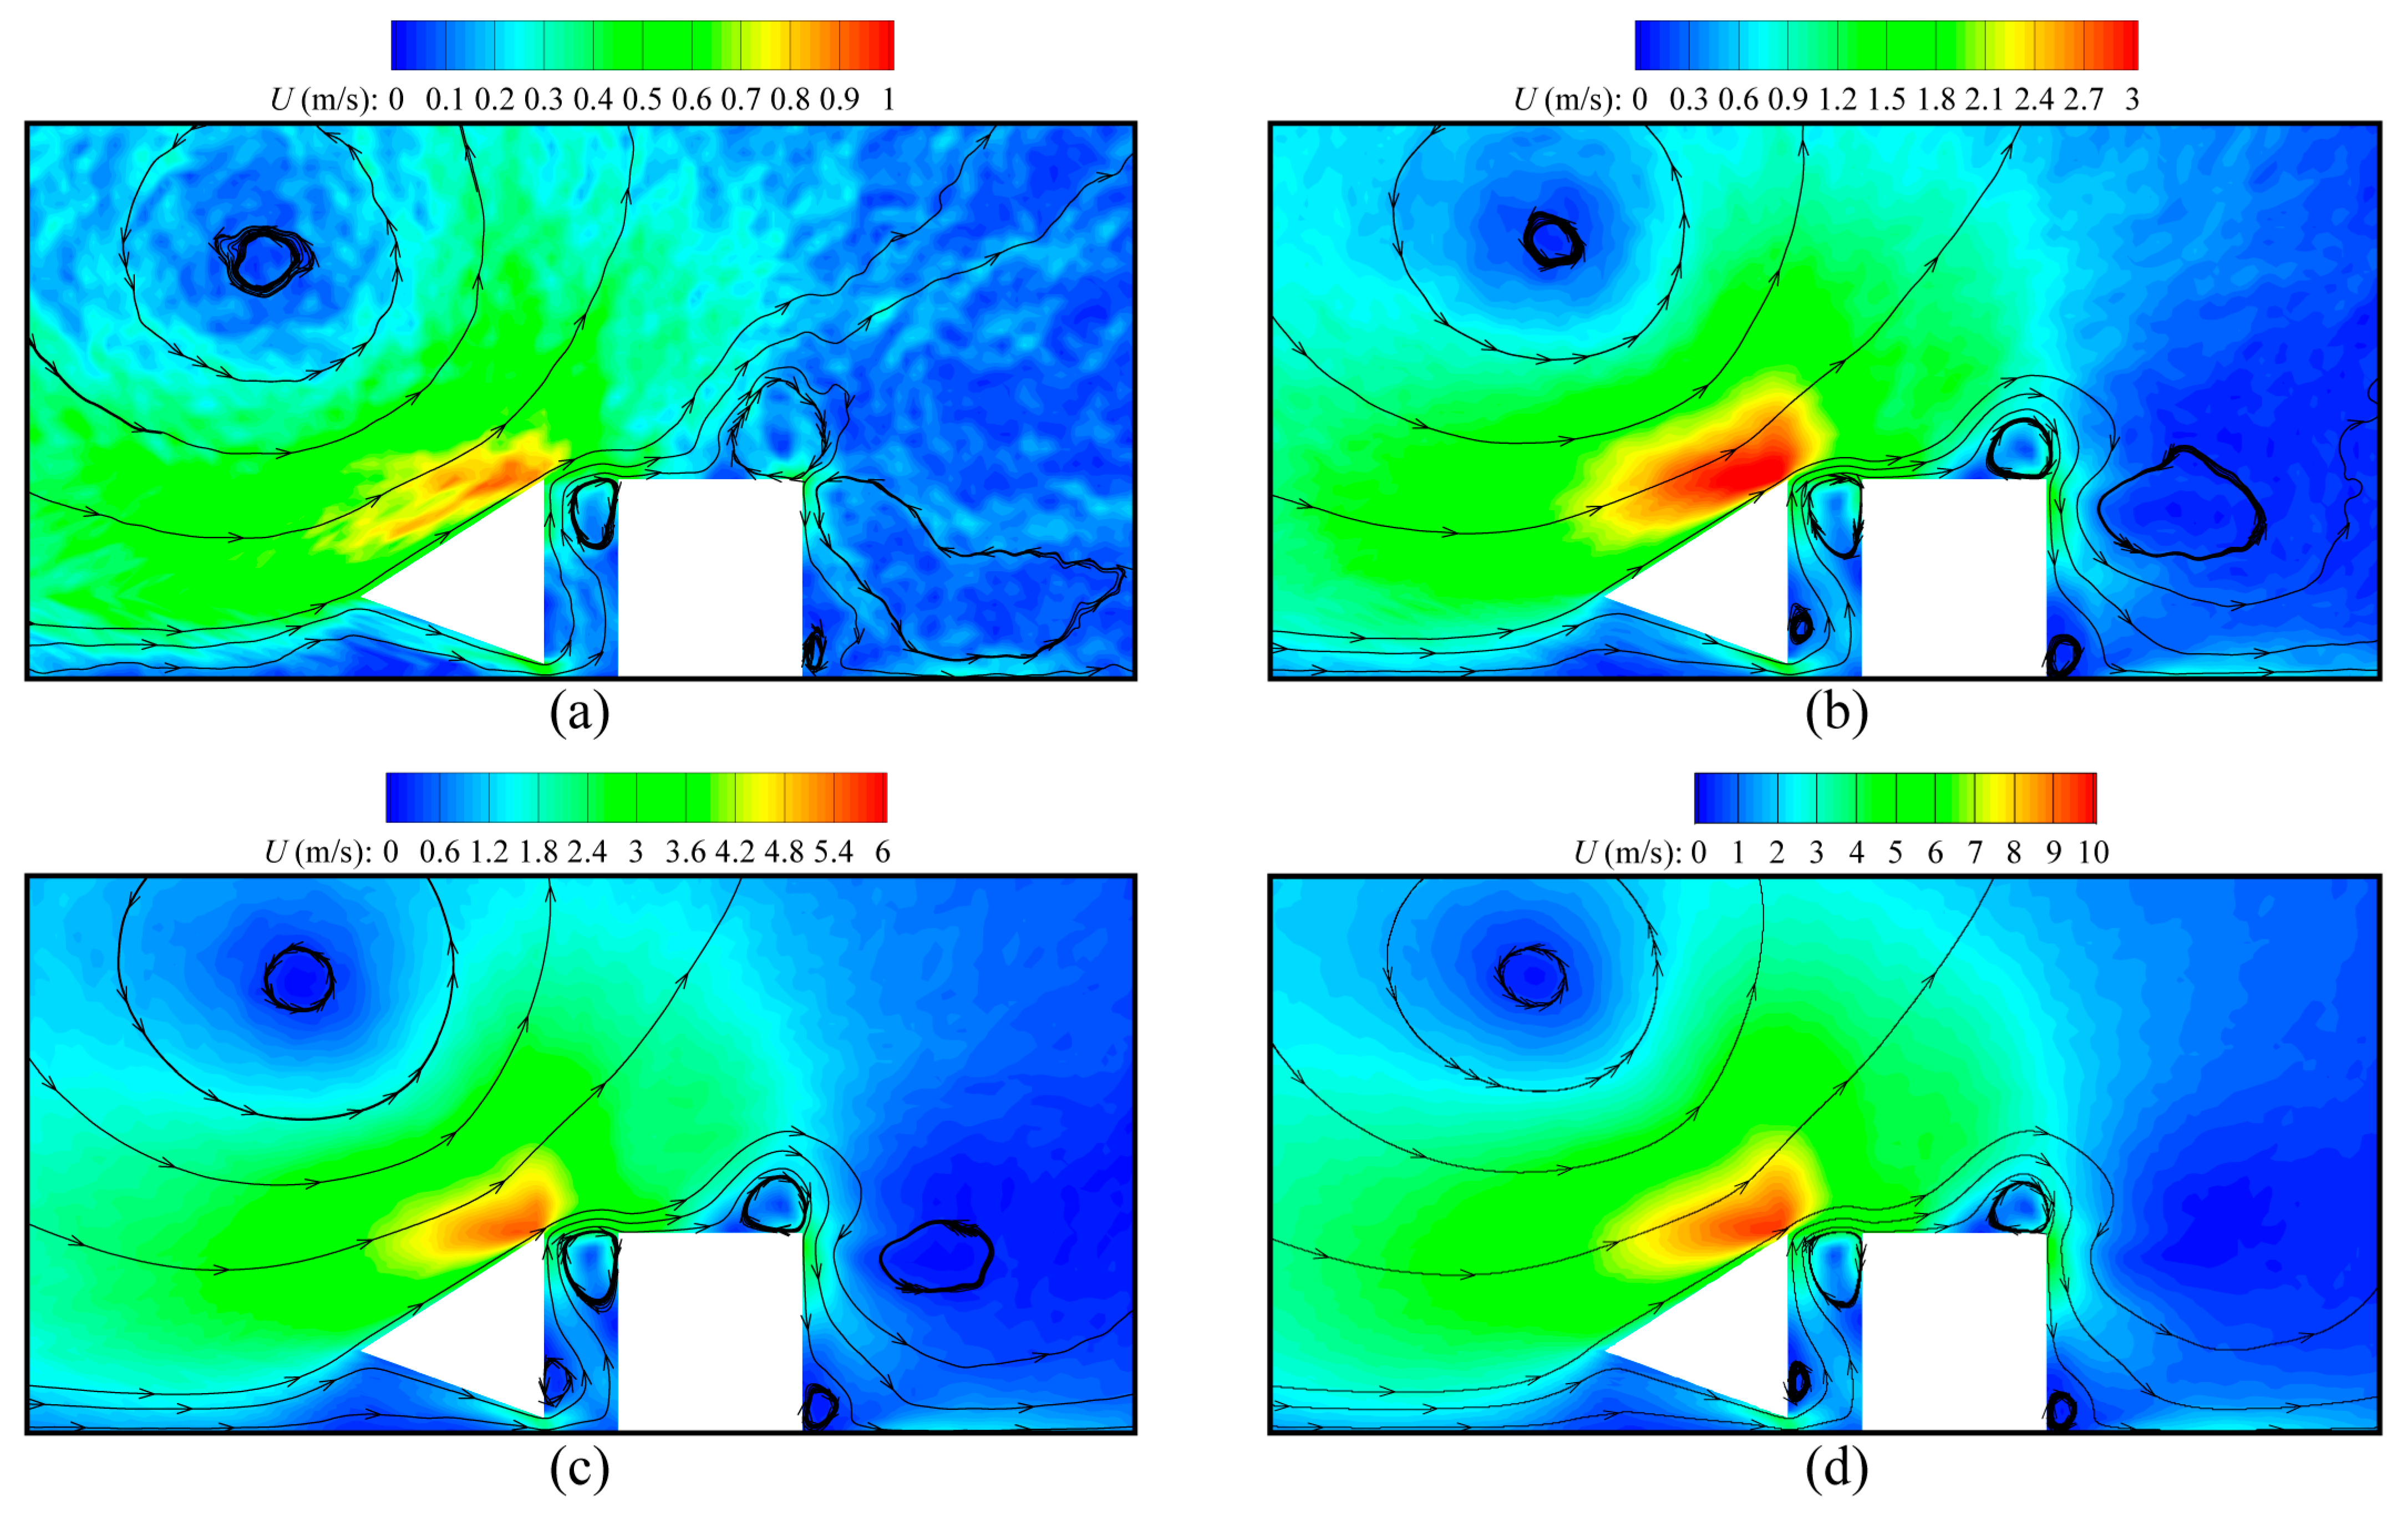
Figure 9 illustrates the close-up views of the normalized temperature
contours around the beams for several representative cases corresponding to
, 80 K, 150 K, and 300 K at
and
. It can be observed that temperature contours change dramatically for different
. As expected, the values of isolines increase as
increases. For all cases, the isolines far from the tip regions of beams are generally uniform, while the isolines near the beam tips change sharply. In addition, the isolines near the beam tips vary more dramatically as
increases. It is demonstrated that the increase in
can trigger stronger thermal edge flows.
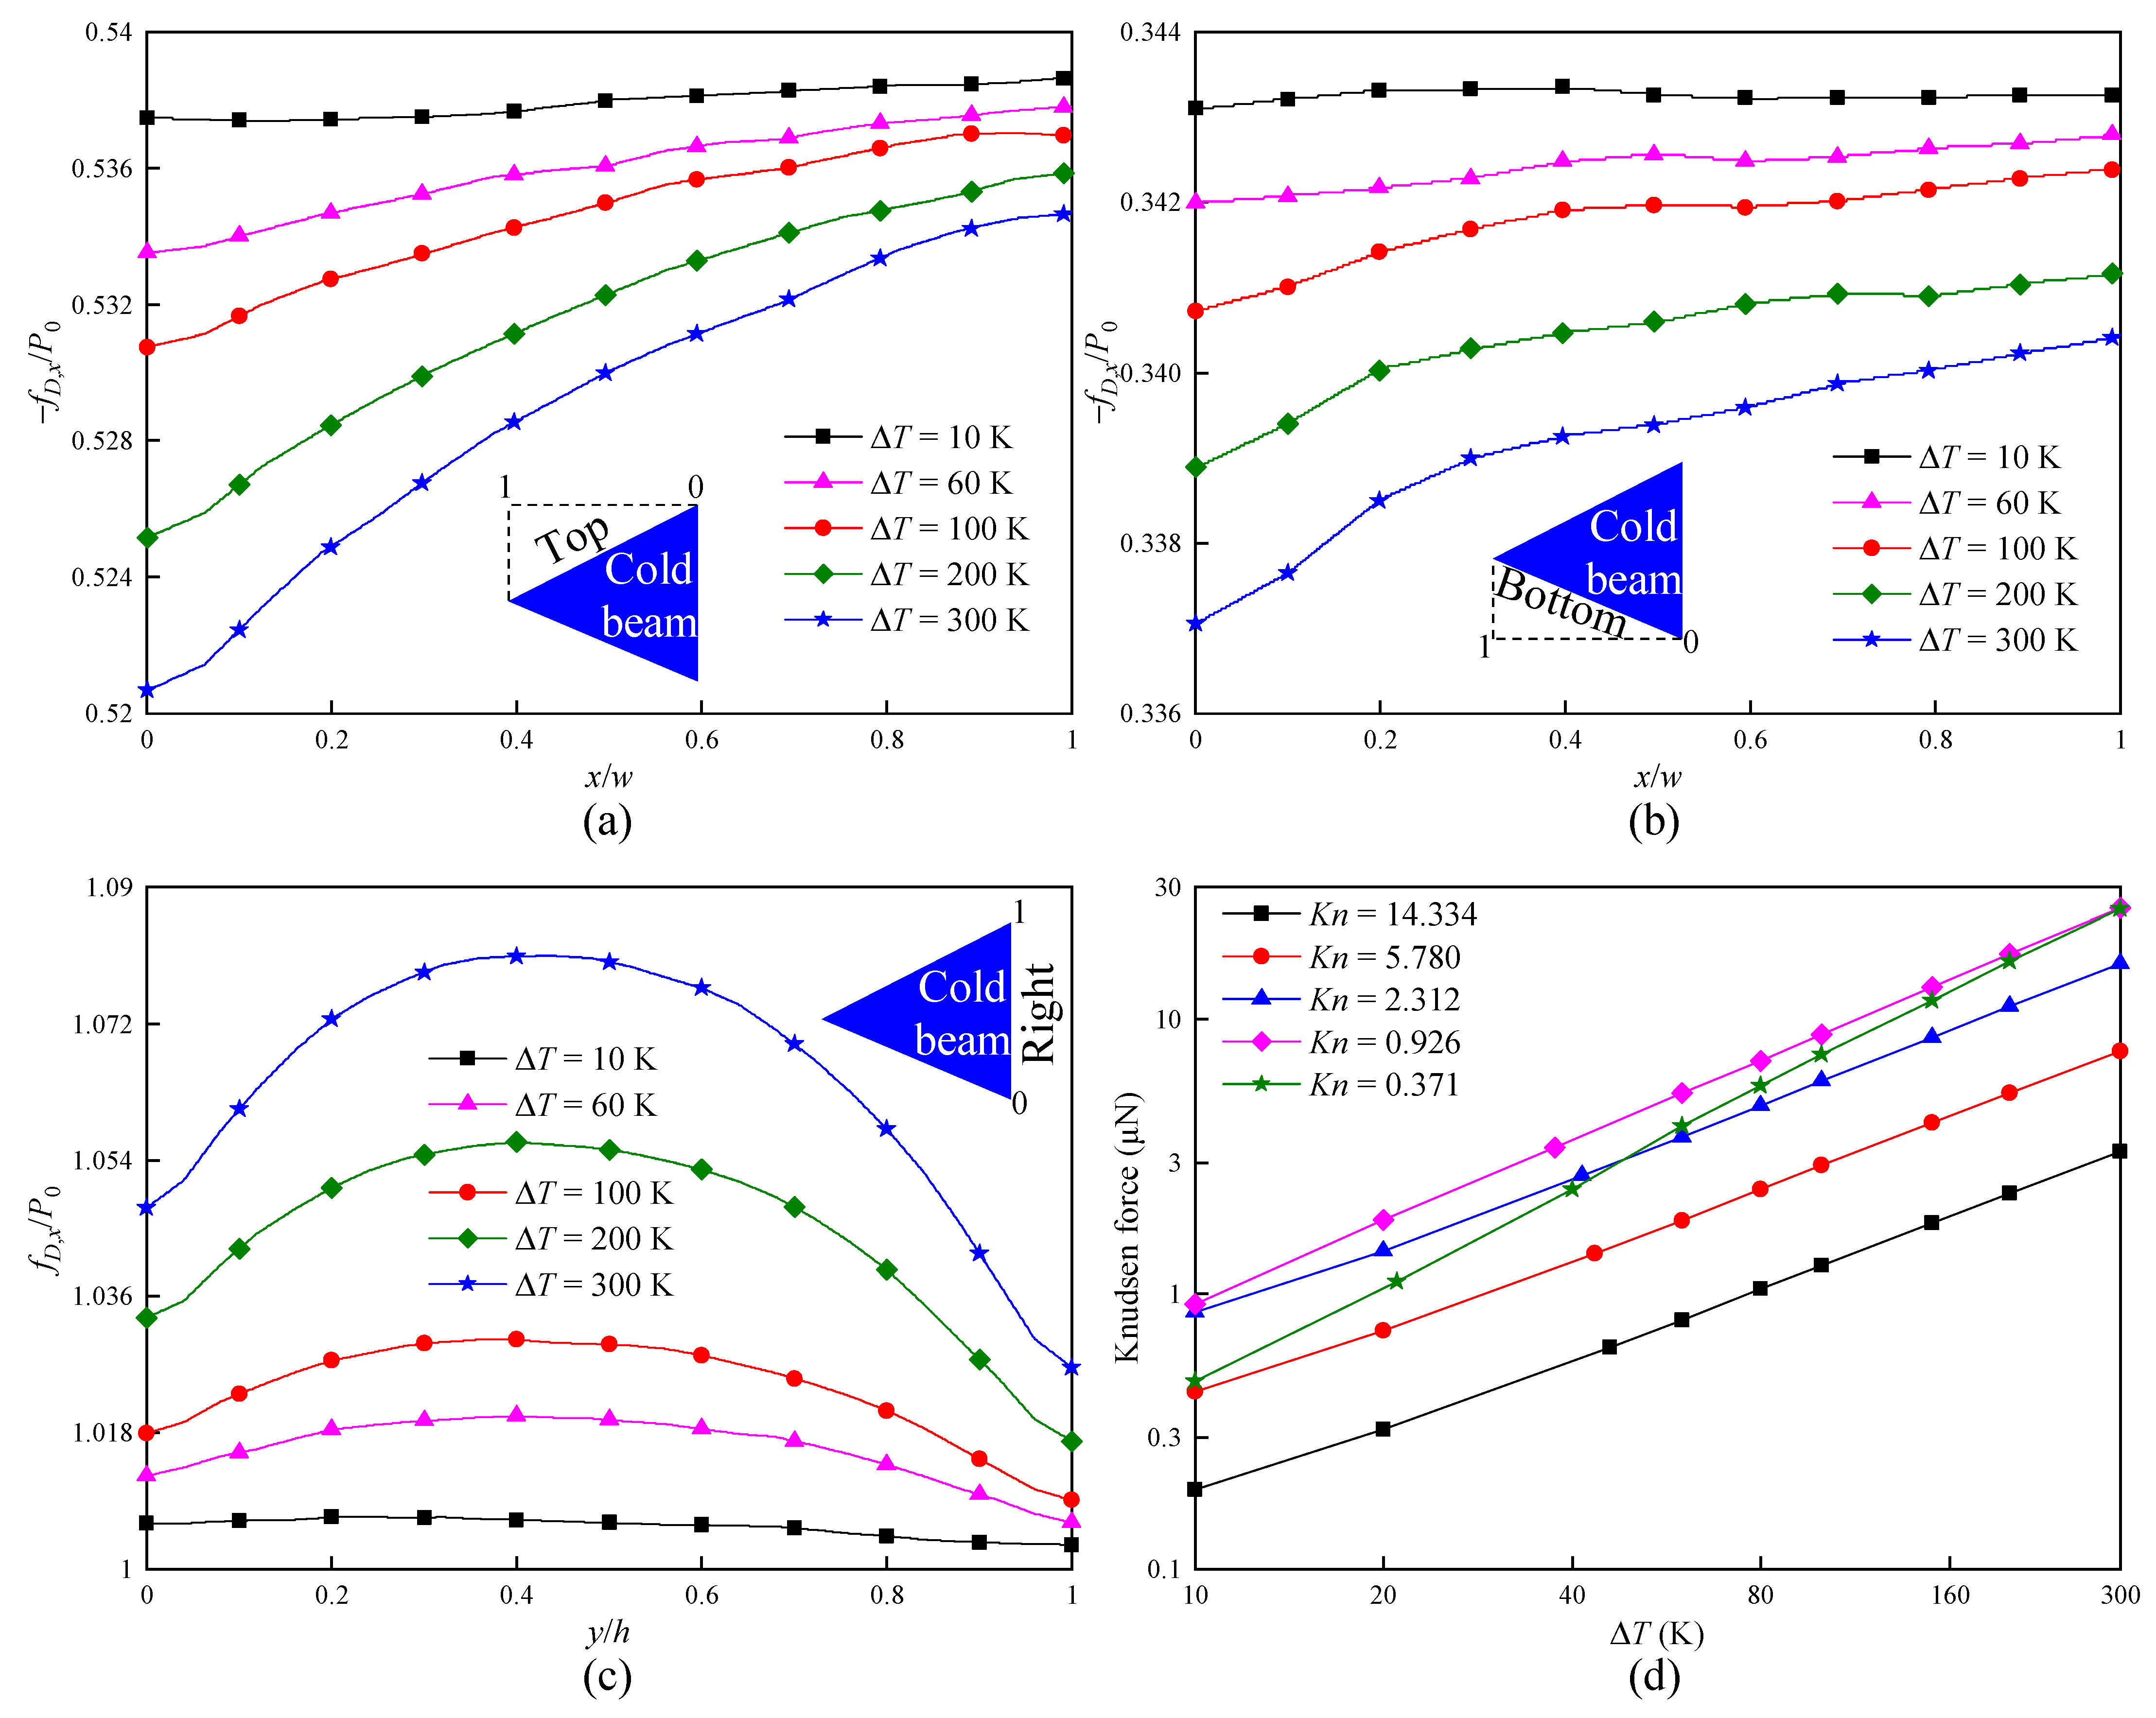
In order to quantitatively analyze the influence of
on the force exerting on the cold beam,
Figure 10 presents the dimensionless force density
distributions over all cold beam surfaces and the net Knudsen force. It can be observed that, when
rises from 10 K to 300 K, the variations in
on the inclined surfaces and the vertical surface behave totally differently. For example, for the inclined top and bottom surfaces, both
significantly decrease as
rises, as illustrated in
Figure 10a,b. In contrast, for the vertical right surface,
significantly increases with the increase in
, as illustrated in
Figure 10c. The difference lies in the following two facts: (i) Under the same pressure conditions, the gas density is smaller in gases with a high temperature. Moreover, the low-velocity molecules reflected from the cold beam hinder the collisions of new molecules around the cold beam. This means less molecules impinge on the surfaces and transfer momentum. (ii) The molecular velocity is directly proportional to square root of the gas temperature. The high-velocity molecules at high temperature collide with the low-velocity molecules reflected from the cold beam, and momentum is exchanged. In this way, the low-velocity molecules can impinge on the cold beam again at a larger velocity. The former (the first fact) dominates the generation of the force on the top and bottom surfaces, while the latter (the second fact) plays a dominant role in the force produced on the right surface. At the same time, the highest gas temperature along the surfaces corresponds to
(the bottom and top surfaces) and
(the right surface); thus, the effects of
on
near the regions are the strongest.
As expected, Knudsen force increases with an increase in
, as illustrated in
Figure 10d. In fact, this qualitative behavior can be found in Ref. [
43]. However, from
Figure 10d, it is observed that Knudsen force is almost a linear function of
. In particular, with
decreasing, the slopes of the Knudsen force curves obviously rise. It can be concluded that Knudsen force depends more on
at high pressure than at low pressure. For example, when
rises from 10 K to 300 K at
, Knudsen force increases by approximately 17 times, while rising by roughly 53 times at
. This is because more gas molecules impinge on the walls and transfer energy in a high-pressure environment. Therefore, in actual applications, a simple increase in heating input power of a hot beam can enhance Knudsen force, which leads to an improvement in the performance of sensors.
4.4. Effects of Species Concentration
This type of device is designed for gas detection in practice; thus, the influence of gas compositions is investigated by varying the equilibrium mole concentration
of H
2 in the gas mixtures.
Figure 11 illustrates the speed contours and velocity streamlines around the beams obtained by the DSMC method for different
. It is observed that the overall speed of gas flows has a significant dependence on
, and significantly increases as
rises. The reason for this is that the molecular velocity is inversely proportional to the square root of the molecular mass; thus, the velocity of the lighter H
2 is larger than that of the heavier N
2. As a result, the overall speed of the H
2-dominating mixtures is considerably higher than that of the N
2-dominating mixtures. On the other hand, for any case of
, the flow patterns are the same. This means that the influence of
on the gas flow patterns is negligible. The qualitative behavior was also reported in Refs. [
46,
47].
To quantitatively evaluate the effects of
on Knudsen force performance,
Figure 12 illustrates the function relation of
to Knudsen force. It can be observed that, for all cases of
, the obtained Knudsen force strongly depends on
, increasing as
rises. This result is similar to data reported in Refs. [
46,
47]. In fact, the molecular mass and the molecular diameter (or collision frequency) are the two main factors. As mentioned above, the first factor can change the molecular velocity; thus, the increase in
increases the velocity of molecules impinging on the walls. The second factor can vary the number of molecules colliding with the walls, leading to the variations in Knudsen force. More specifically, the molecular diameter of H
2 is substantially smaller than that of N
2. Thus, the mean free path of H
2 is larger. This means that, in the H
2-dominating (a larger
) mixtures, more molecules impinge on the surfaces per unit time, and a larger Knudsen force is obtained.
In addition, from
Figure 12, it can be found that the dependence of Knudsen force on
is almost linear. Thus, it can be predicted that the linear correlation of Knudsen force with
in N
2-H
2 mixtures can be applicable to the assessment of hydrogen concentration in practice. The expression is as follows:
where
represents the force generated in the pure nitrogen environment,
denotes the concentration of hydrogen in the gas mixtures, and
is the slope for each line in
Figure 12. Note that, when the diameter of the gas molecule is larger than that of nitrogen, the value of slope
is negative; otherwise, the value of
is positive [
46,
47]. Compared with the absolute values of
in Refs. [
46,
47], the value of
in this research is substantially larger. The reason appears to be the sharper edge of the current cold beam, resulting in stronger Knudsen force.
On the other hand, with increasing, the slopes of Knudsen force curves significantly increase. For example, when rises from 0 to 1, at , Knudsen force increases by approximately 104%, while rises by roughly 322% at . This means that the dependence of Knudsen force on is stronger in a high-pressure environment than in a low-pressure environment. Therefore, an appropriate enhancement of the working pressure can improve the sensitivity of the hydrogen sensors in practice. Evidently, based on the linear relation of Knudsen force to species concentrations, the calculation of approximate concentration of any species can be easy in binary mixtures, achieving the detection of species concentration in physical reality.
5. Concluding Remarks
In this study, the direct simulation Monte Carlo (DSMC) method is applied to investigate the effects of gas–surface interaction conditions (accommodation coefficients , temperature, and carrier gas) on rarefied gas flows and hydrogen detection performance (Knudsen force) in MEMS sensors composed on triangle cold beams and rectangle hot beams at different pressures. The results demonstrate that gas flows and Knudsen force are strongly dependent on accommodation coefficients, temperature, and carrier gas. The Knudsen force nonlinearly increases as decreases. Therefore, in order to achieve better detection performance, the application of special material to the device fabrication or the different treatments for the surfaces is extremely important. On the other hand, regarding the influence of working conditions, it is revealed that Knudsen force linearly depends on the temperature gradients , rising with the increase in . Specifically, when rises from 10 K to 300 K, the largest Knudsen force increases by approximately 28 times. In addition, a small Knudsen number corresponds to a larger gas density; thus, the curve slopes for Knudsen force rise as is reduced. This means that, when the gas flows tend to be in the transition regime, the dependence of Knudsen force on become more significant. This behavior can also be observed for the influence of carrier gas on Knudsen force. In addition, it is found that Knudsen force is almost a linear function of hydrogen concentration. Therefore, a correlation expression is proposed in this research for the application of the device to the detection of species concentration in practice. Based on the formula, the approximate species concentration in the H2-N2 mixtures can be easily calculated. In summary, the DSMC simulation results contribute to a better understanding of the dependence of hydrogen detection performance on gas–surface interaction conditions.


