1. Introduction
The necessity of addressing problems extending from the microscale to macroscale has led to the exploration of past theories and practical implementations as sources of solutions to these physical problems. One promising concept is the Tesla valve, which operates passively, using only its geometry to create asymmetric flow resistance. When the fluid flows through the forward direction, the pressure drop is lower than in the reverse-direction flow, whereas, in the reverse flow, higher flow resistance arises. Based on these principles, the Tesla valve can be implemented in various applications across fields such as medical devices [
1,
2,
3], chemical processing [
4,
5] and applied physics, including mixing, heat sinks and pumps [
6,
7,
8]. Although a common characteristic of the above applications is that they involve microfluidic devices, the Tesla valve could find applicability in macroscale applications, such as in the marine [
9] and health [
10] fields. Moreover, based on flow control, the Tesla valve has also achieved significant results in various other fields [
11,
12,
13,
14].
The diodicity (D) is an indicator of whether the geometry has good performance, defined as the ratio of the pressure drop in reverse flow to that in forward flow [
15]. Several studies have emphasized the optimization of the valve geometry [
16,
17] in order to achieve higher diodicity, while other studies have focused on the relationship between the Reynolds number (Re) and diodicity [
18,
19]. The main characteristics of the Tesla valve are the contact angle, the total length of the valve, the number of staged valves, the shape of the loops, and the inlet–outlet dimensions. All these characteristics can be optimized in order to maximize D.
The double Tesla valve
was investigated in our previous work as a micromixer [
20,
21], with higher performance compared to other micromixers and geometries. Since the geometry is functional as a micromixer for very low Re ≈ 2 but not optimized, the present work focuses on the relation between D and Re, focusing on Re up to 450 for the existing geometry. The primary objective of this work was to find a critical Re where, during the reverse flow, the velocity is higher within the loops and exceeds the main path. Additionally, this work aimed to study the valve performance and investigate the effects of additional valves for various Re under the same initial conditions on D.
2. Materials and Methods
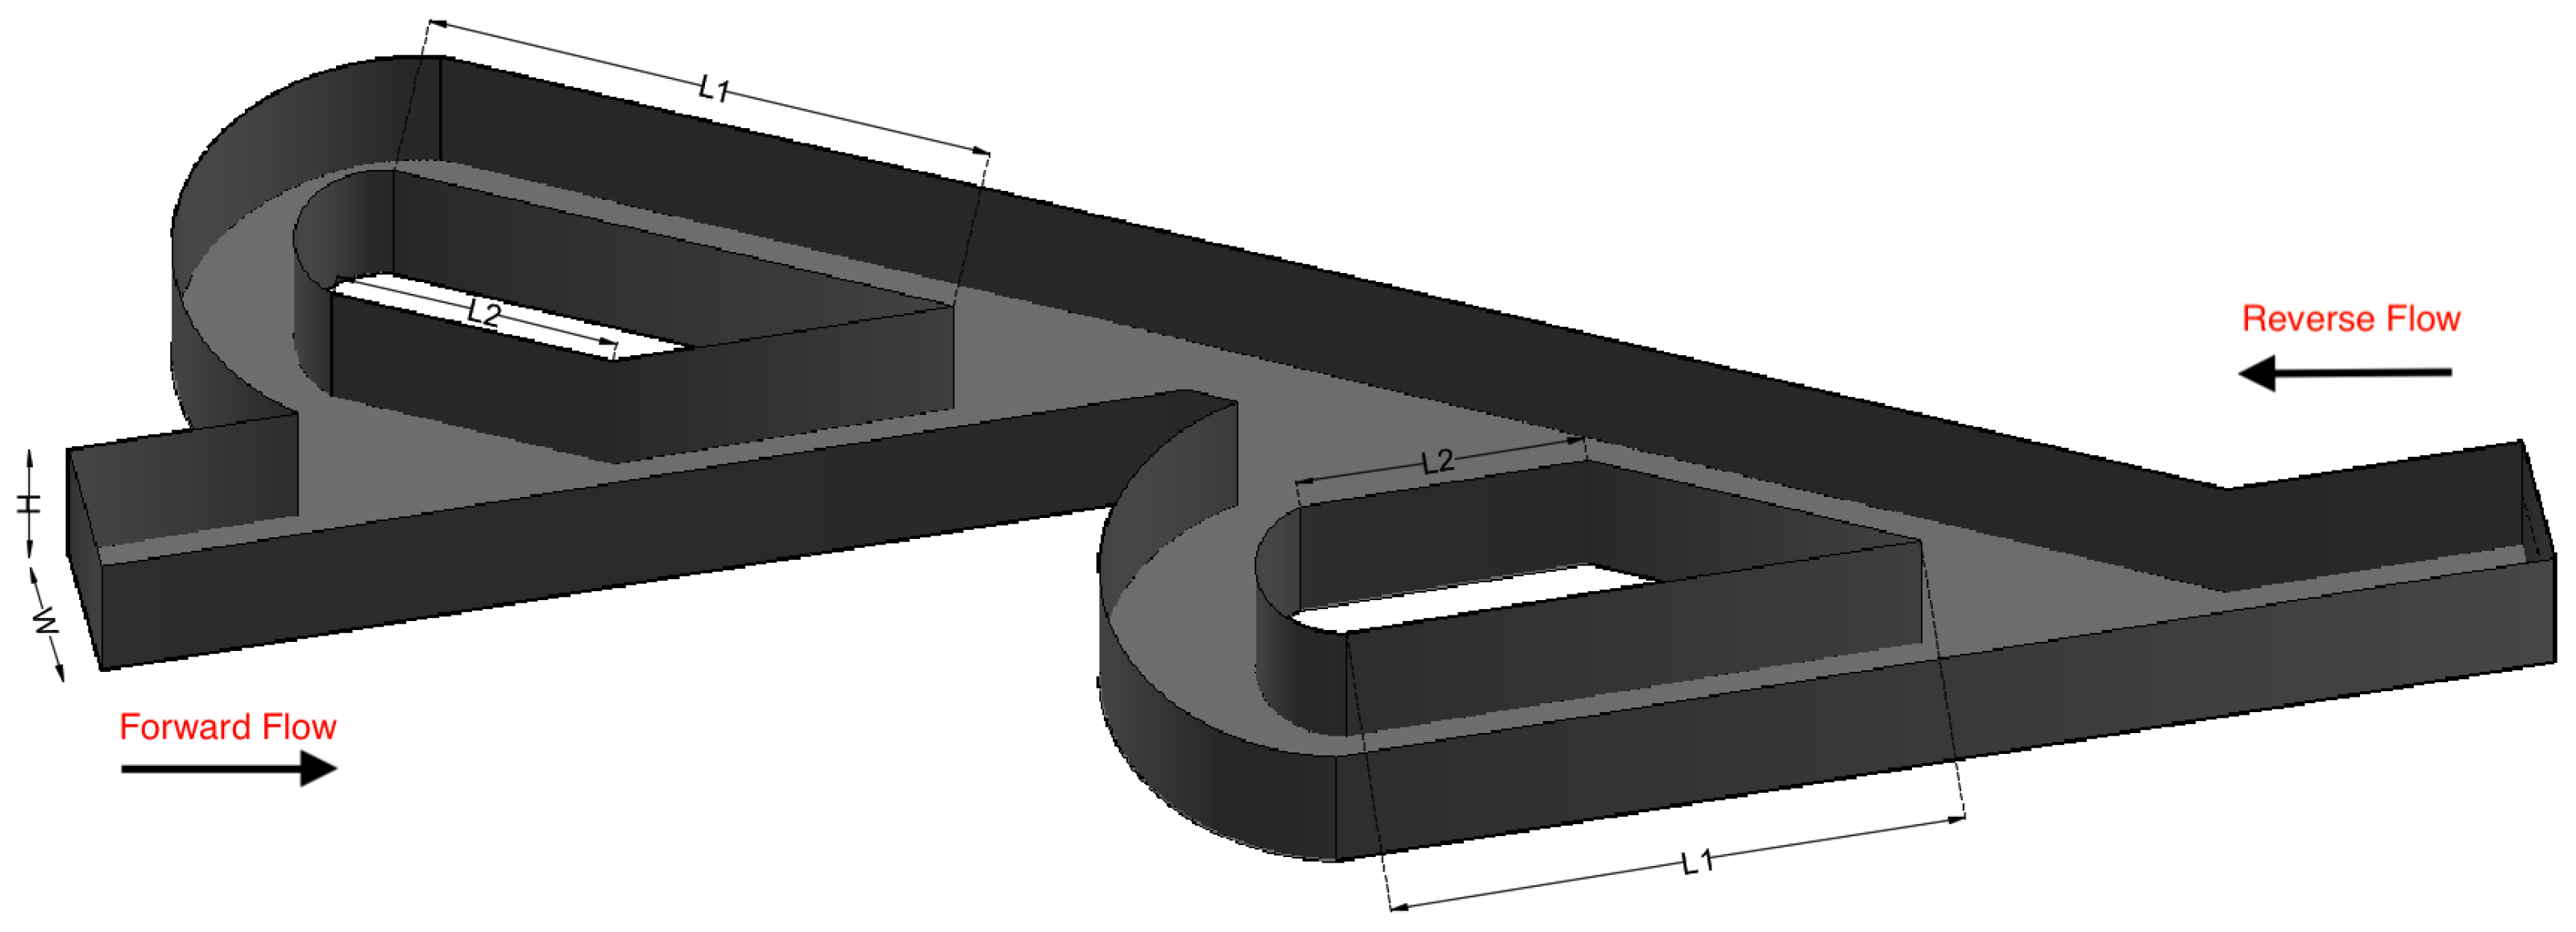
A series of simulations was performed for both micro Tesla valve geometries under various Reynolds numbers (Re). The Tesla micromixer geometry uses two units of valves that are connected in series, with both the inlet and outlet of the micromixer being a squared cross-section of height and width
m, corresponding to the length of each side (a). The length ratio of
was selected from an existing Tesla structure [
22]. The geometry of the double Tesla
multi-staged valve design is identical to that in our previous work [
21] and is illustrated in
Figure 1. In the present simulations, both the inlet and the outlet were extended by 15 mm according to [
18], as shown in
Figure 2. Furthermore, the six-staged
and ten-staged
valves are based on the double Tesla, as shown in
Figure 3 and
Figure 4, respectively.
Since the inlet for a forward or reverse flow is a square, the Re can be calculated from [
23]
where, for the fluid (water),
u (m/s) is the velocity,
m
2/s is the kinematic viscosity,
kg/m
3 is the density, and
is the dynamic viscosity.
is the hydraulic diameter of the pipe and
a represents the side length of the square cross-section. In both cases, the Re number depends on the fluid velocity, since all other parameters remain constant during the simulations. Thus, the above equation can be simplified as
Another interesting parameter is the volumetric flow rate, which can be calculated from
where
u (
) is the velocity of the fluid and
is the inlet surface area in this study. Under the microscale used,
Q is expressed in μL/s. The diodicity (D) is a performance indicator for the Tesla valve and is defined as the ratio
where
is the pressure difference between
for the reverse flow and
is the pressure difference between
for the forward flow. Additionally, the entrance and exit lengths were extended by 1.2 mm in order to resolve any potential issues at the outlet boundary condition for the reverse flow [
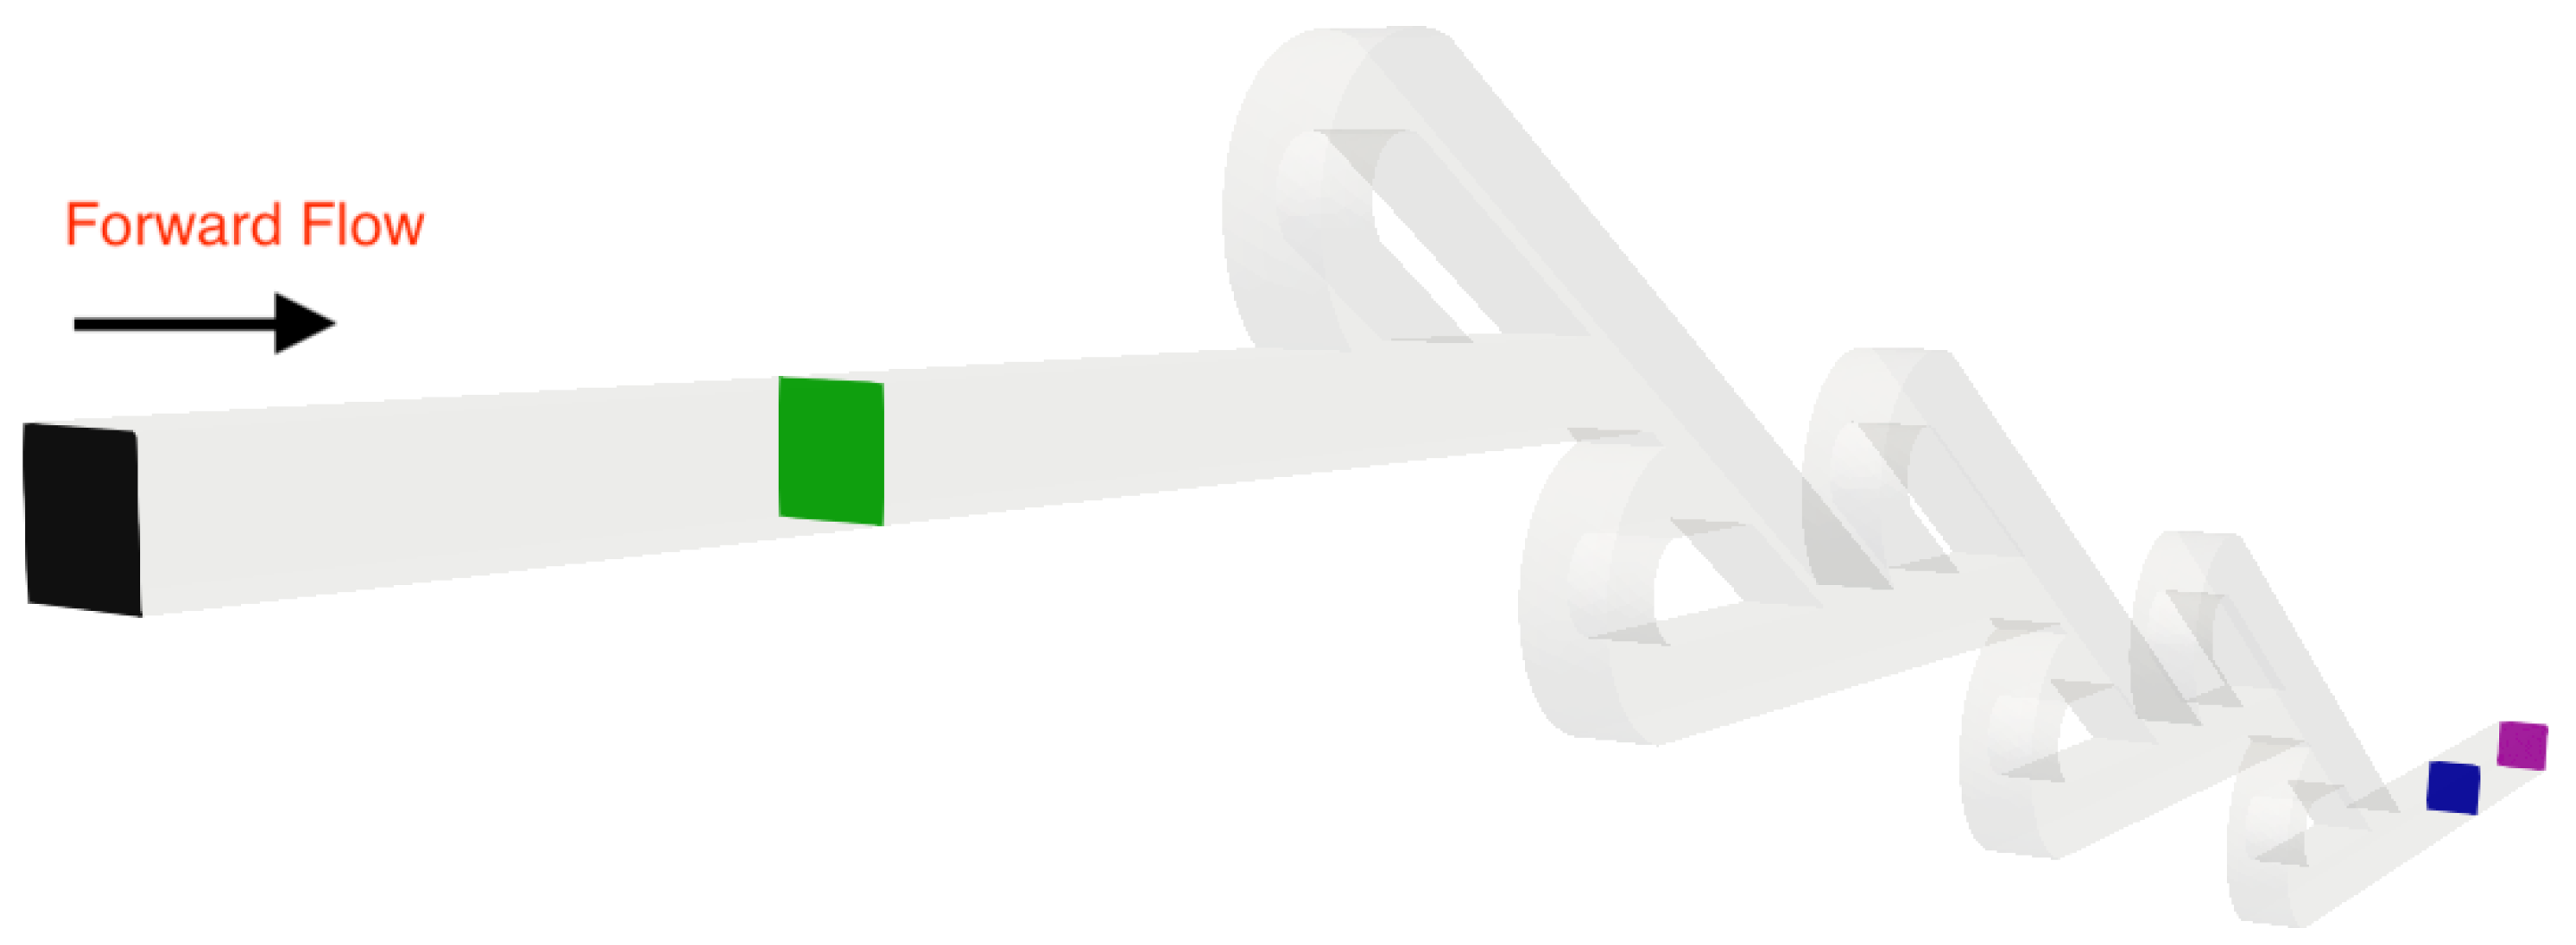
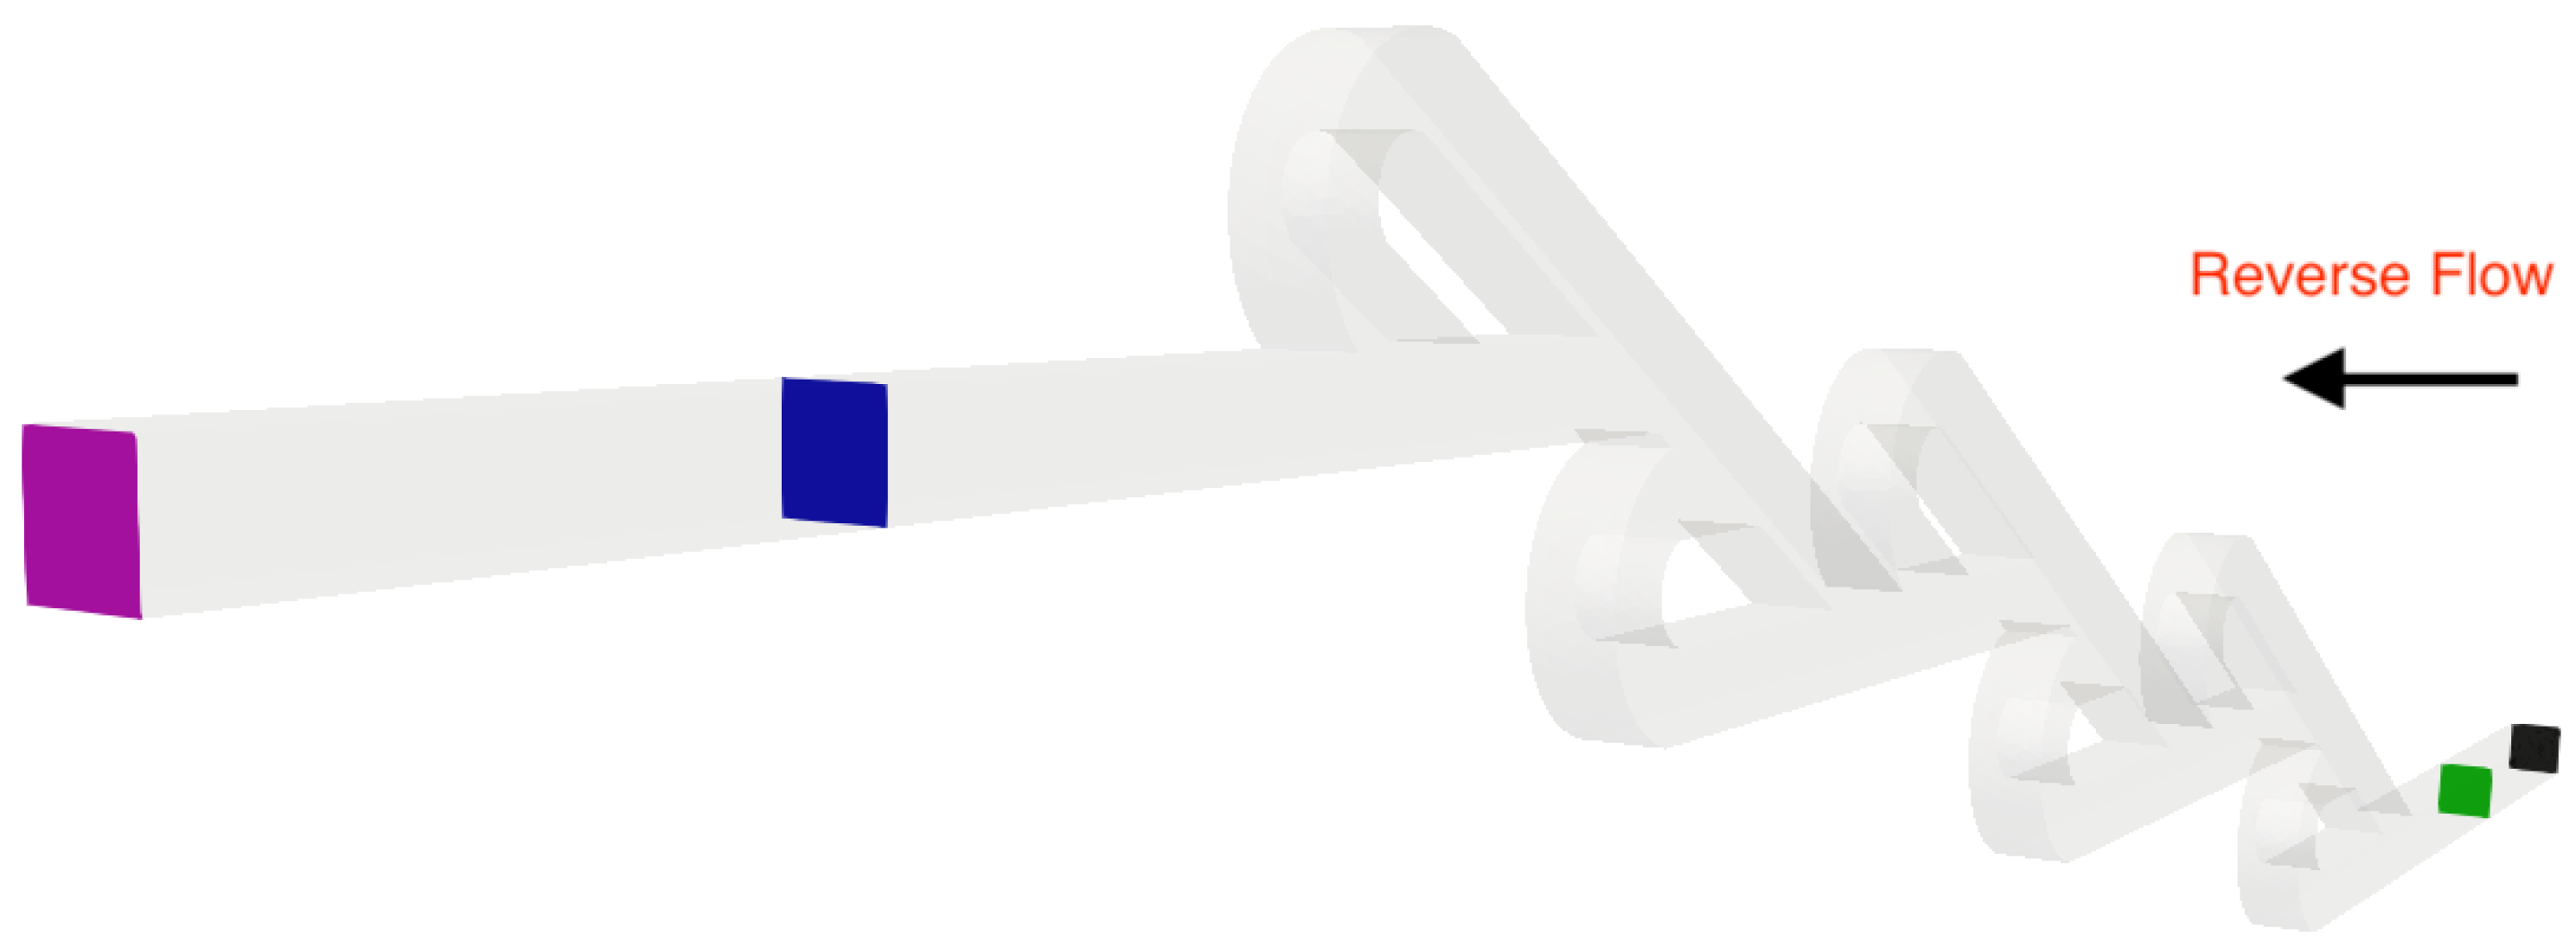
18]. The inlet and the outlet slices for all scenarios are colored black and purple, respectively. Moreover, the average pressure was measured at four different locations (patches) for each simulation, as illustrated in
Figure 5 and
Figure 6. Thus, the diodicity was first evaluated using the patches at the inlet and the outlet (where the mesh validation was performed) and re-evaluated using intermediate patches (blue and green) that were located
mm from the inlet and outlet boundaries of the geometry, following the procedure in [
18]. The same approach was applied for the double- and ten-staged micro Tesla valves.
Moreover, all geometries and computational meshes were created using the open-source software GMSH (version 4.13.1). The simulations were performed with OpenFoam (version 10), which is also a free software platform. In these simulations, the velocity and pressure fields were obtained by employing a suitable solver that corresponded to the problem requirements. The solver was based on the Semi-Implicit Method for Pressure-Linked Equations (SIMPLE). The governing equations were the continuity (
5) and momentum (
6) equations. The above equations were solved for the fluid phase and are based on the incompressible Navier–Stokes equations, where
p and
u are the pressure and velocity, respectively. The viscosity and density of the water are denoted by
and
, respectively:
The use of computational fluid dynamics demands a mesh independence study, which was performed for all geometries considered. Since the evaluation of the diodicity required two separate simulations for each case (one for the forward and one for the reverse flow), this increased the computational cost. Therefore, the selection of the most suitable mesh was crucial in balancing accuracy and efficiency. To achieve this, two mesh independence studies were performed for the forward and reverse flows, followed by an estimation of the diodicity error. Specifically, the mesh independence analysis was carried out for the following initial conditions: inlet velocity equal to
, corresponding to
, which represents the highest inlet velocity and consecutively the highest Re among the simulated cases. Experimental investigations on soft-walled microchannels [
24] reported attainable Reynolds numbers in the range of 400–500, limited by the bonding strength and pressure constraints of the microfabricated devices. The pressure difference value
used for mesh validation was measured at the inlet and outlet of the geometry for all selected meshes (coarse, medium and fine) for all valve configurations. Additionally, the growth rate of the elements was kept constant (≈2) for the different meshes, as presented in
Table 1.
The Richardson extrapolation method and grid convergence index (CGI) were applied for the mesh validation. The indices 1, 2 and 3 correspond to coarse, medium and fine meshes, respectively. Regarding , which is the convergence between the medium and fine meshes, it should be noted that had differences between the flows. More specifically, for the double Tesla, was 0.3% and 1% for the forward and reverse flow, respectively. This difference arose mostly from the phenomena that take place in reverse flow. The diodicity and (forward and reverse) relative errors were calculated and expressed as percentages, and they were our final criteria for mesh validation. Initially, and were calculated, followed by .
Using the above calculations, , and were lower for the medium mesh compared to the coarse one. The diodicity error was , and for the double-, six-staged and ten-staged cases, respectively. Thus, the mesh that was used for all simulations was the medium mesh.
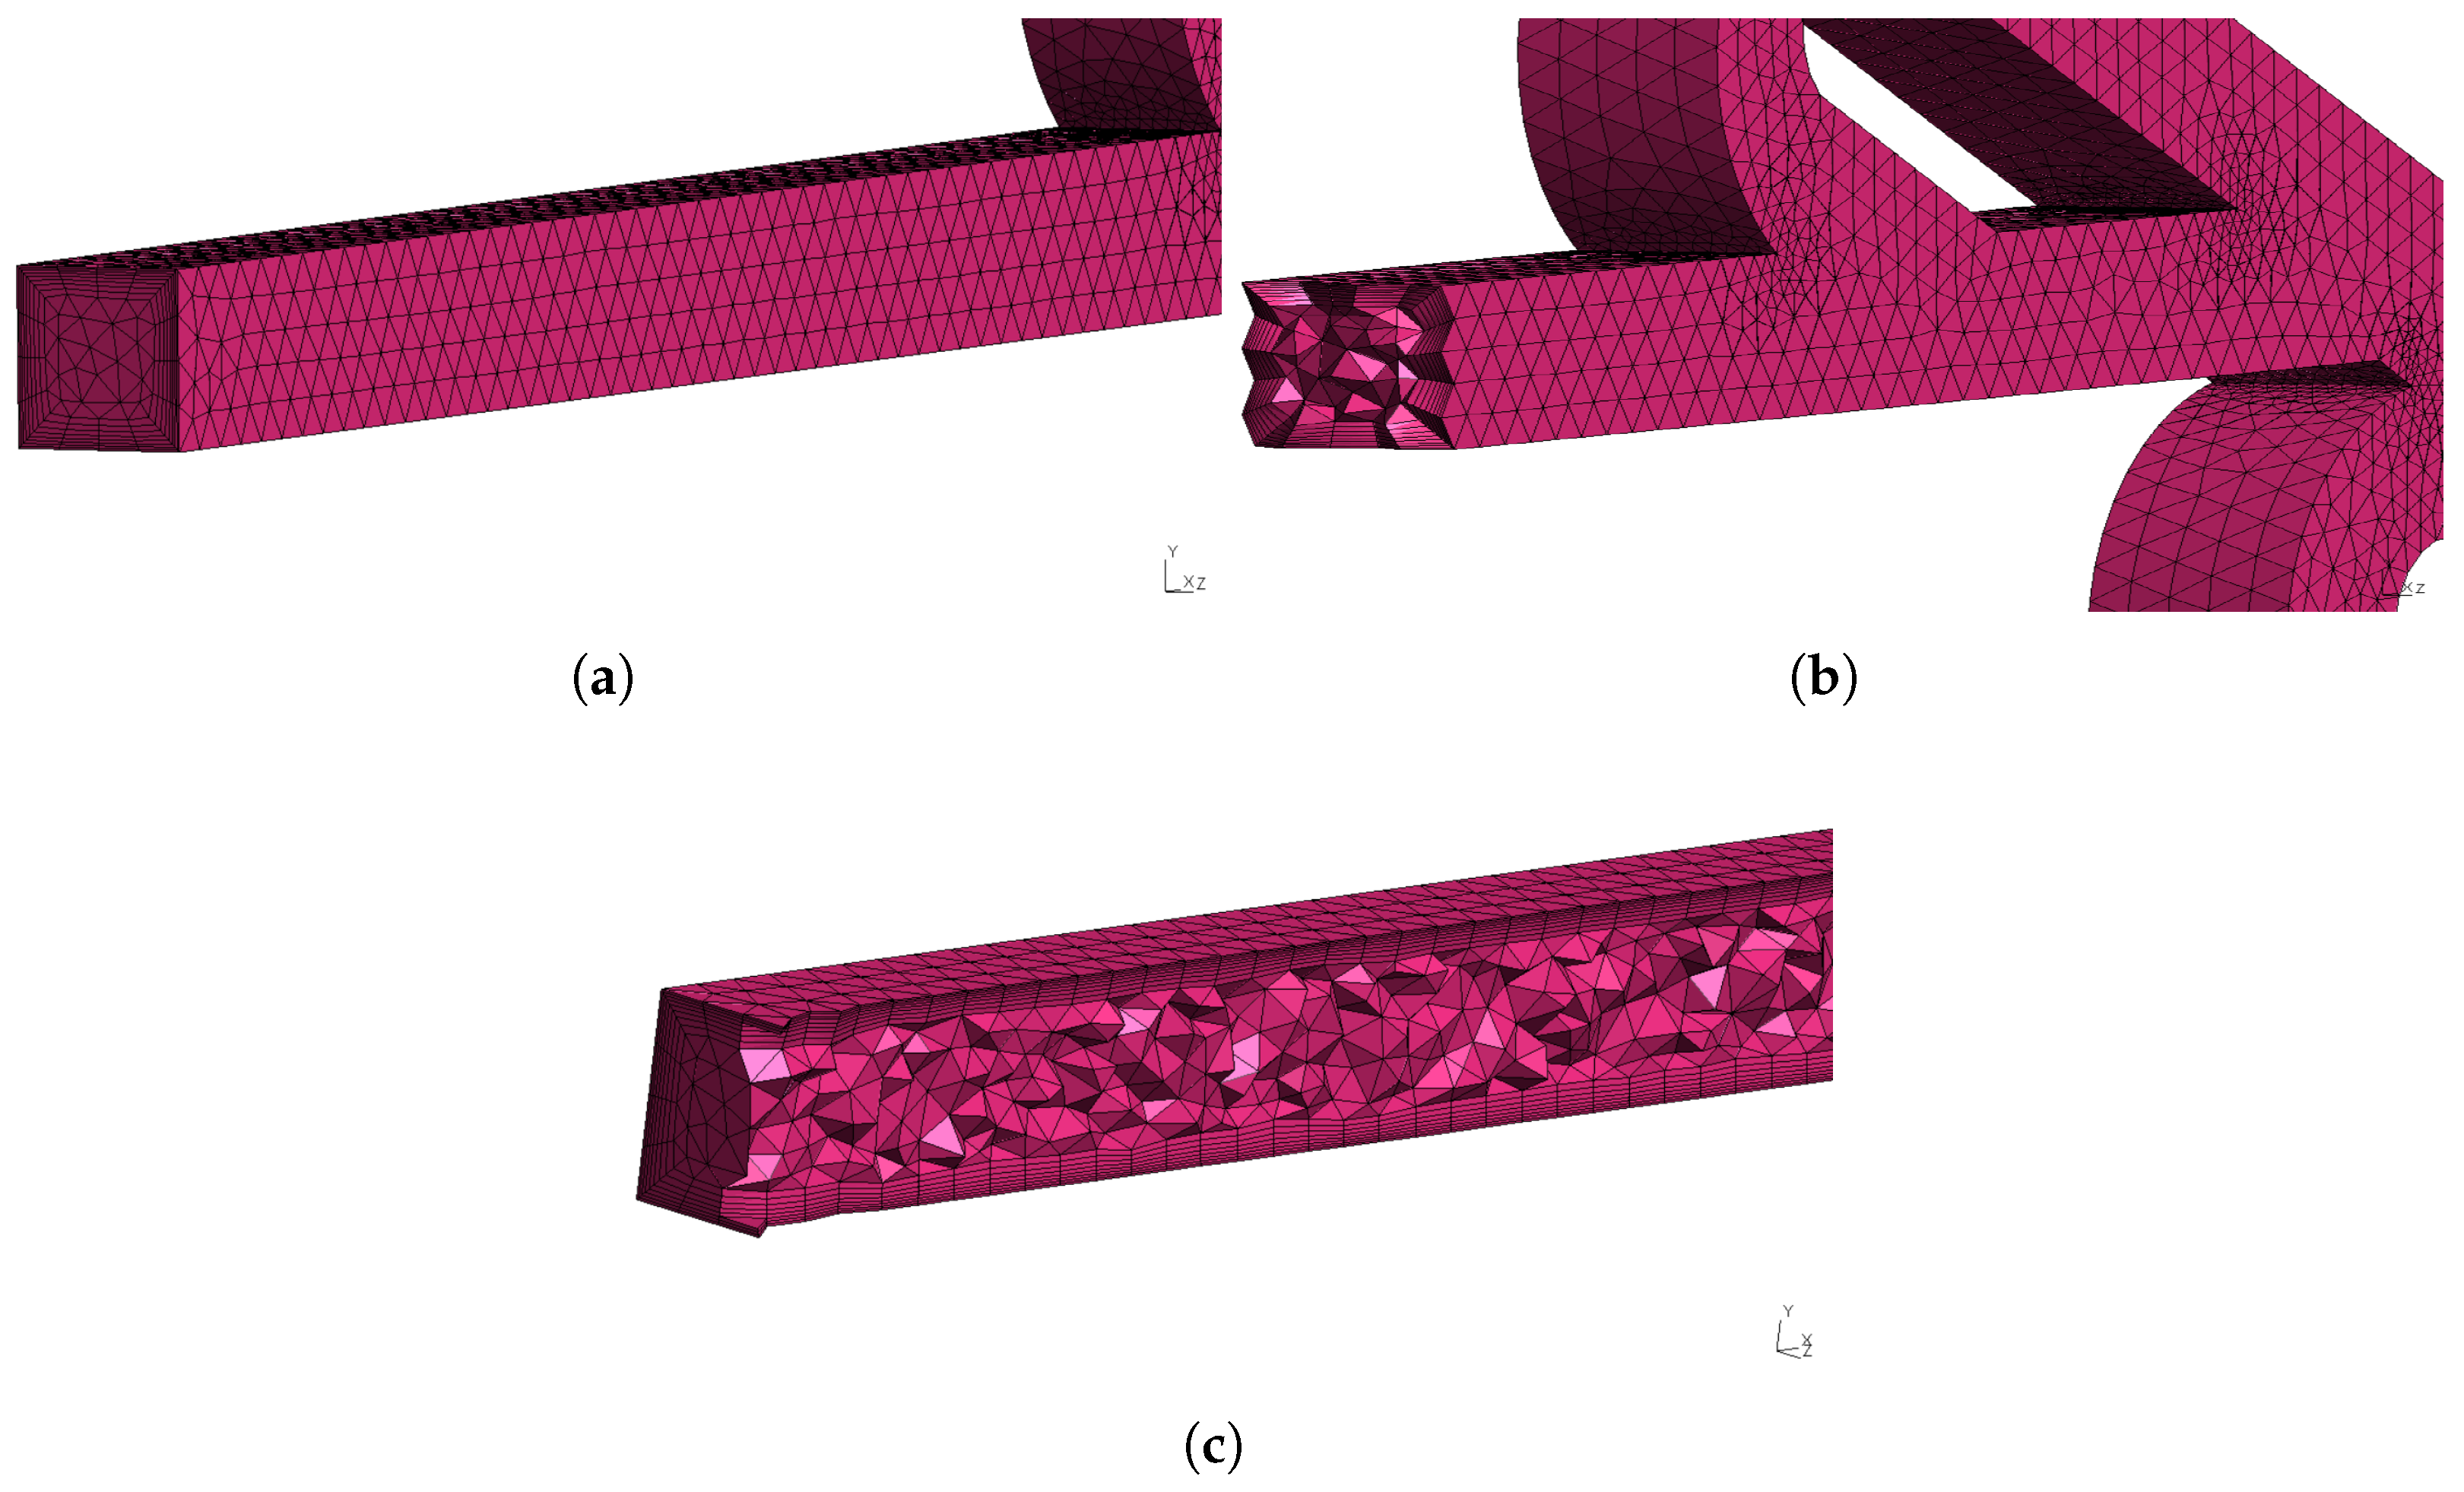
The mesh for the six-staged micro Tesla is presented in
Figure 7. Additionally, the growth rate of the boundary layers was
, and it consisted of 8 layers. More detailed views of the mesh and boundary layers are presented in
Figure 8. Moreover, the meshes for the double- and ten-staged valves were created accordingly following the same mesh strategy. Although using different mesh resolutions for each Re could have reduced the computational cost, this approach requires a mesh independence study for each case, increasing the overall simulation workload. Therefore, under all simulations (different Re), the mesh was kept constant, since it had been validated for
, which corresponded to the most demanding flow conditions.
The main simulation parameters, including the boundary conditions and physical properties of the water, are summarized in
Table 2. Focusing on the inlet boundary condition and using Equations (
2) and (
3), the Re number and volumetric flow rate could be calculated, respectively. Based on these calculations,
Table A1 was obtained, where the ranges of Re and Q are presented. In essence, Re varied from 50 to 450 in increments of 25, which indicated that the flow was laminar. The volumetric flow rate was used as an indicator for the potential applicability of the valve. The range of Q was from 5 to 45 with increments of 2.5 μL/s.
3. Results
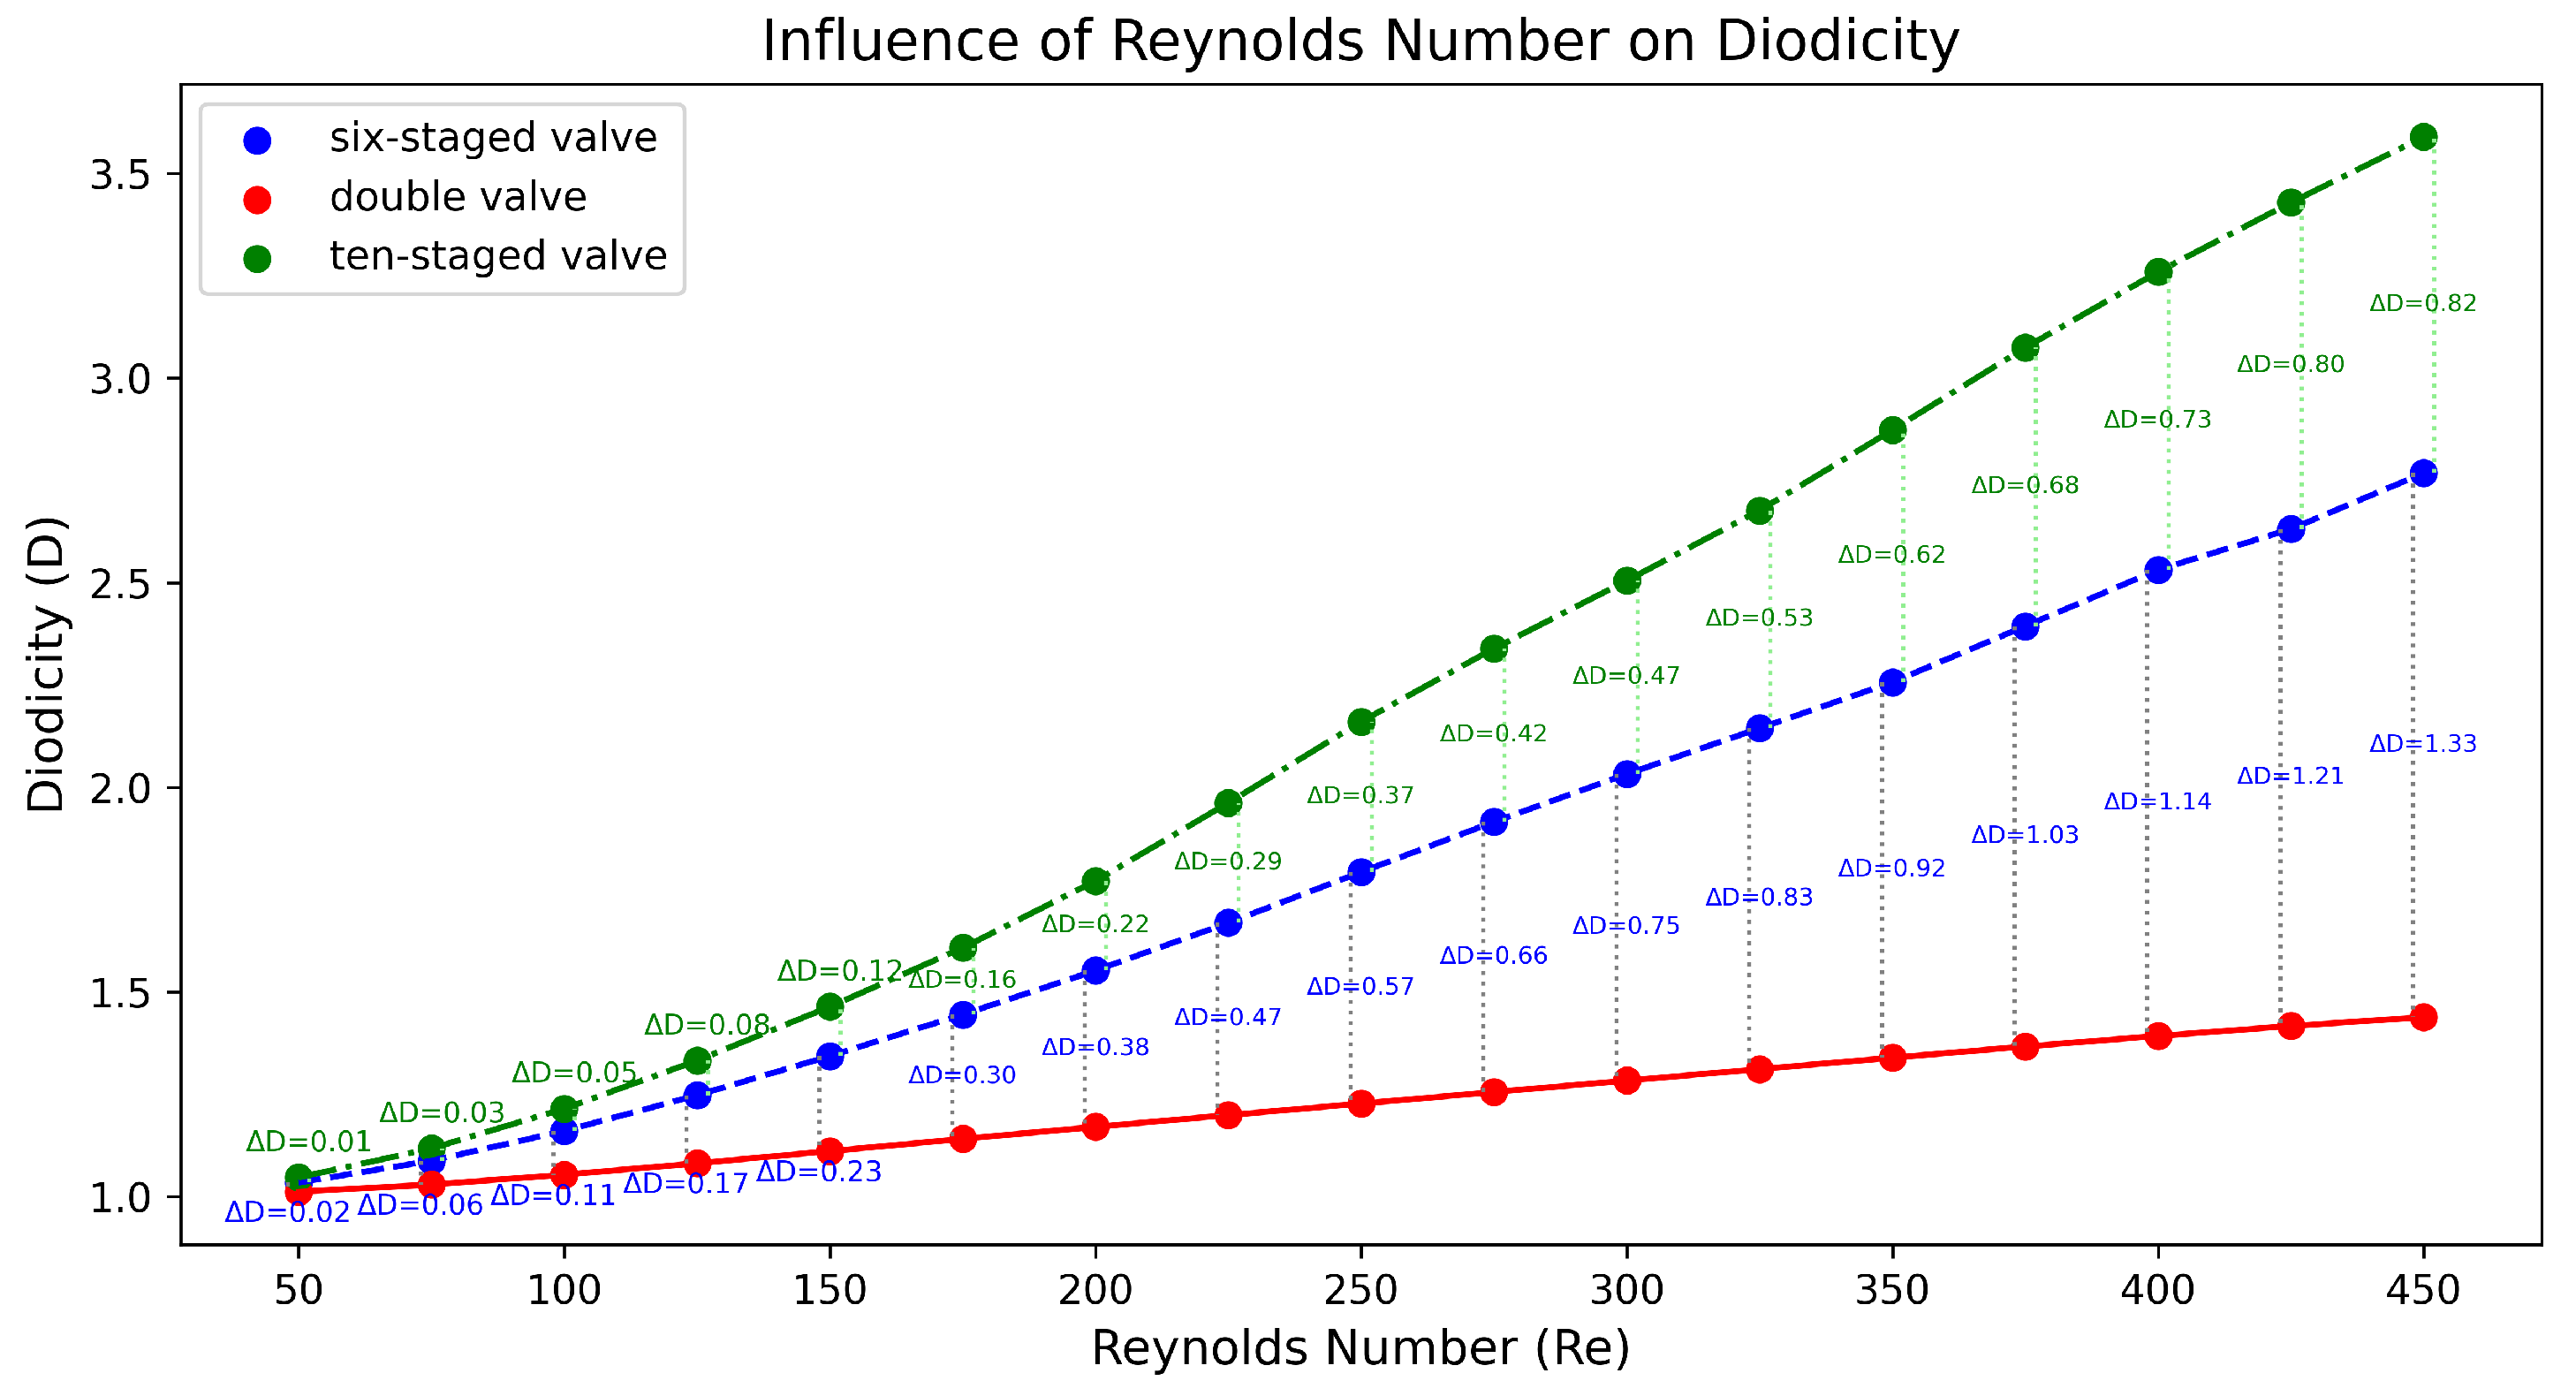
The post-processing analysis was performed with Paraview (version 5.13.3), which is a free software program, while the diagrams were created in Python (version 3.9.6). The results of the double Tesla simulations (at inlet–outlet patches) are presented in
Figure 9 with a red line. Measurements of the average pressure at the inlet and outlet were obtained for the black and purple patches (slices), respectively. As the Re increased, the diodicity of the double Tesla valve also increased. The maximum diodicity was achieved for
and was equal to
. Additionally, with decreasing Re, the diodicity will be decreased. The diodicity must always be ≥1, but it is very close to 1 for a low Re. In the present simulations, the minimum diodicity occurred under
and was found to be equal to
. This arose from the fact that less resistance was generated, so the pressure drop in the reverse and forward flows became closer [
23]. In
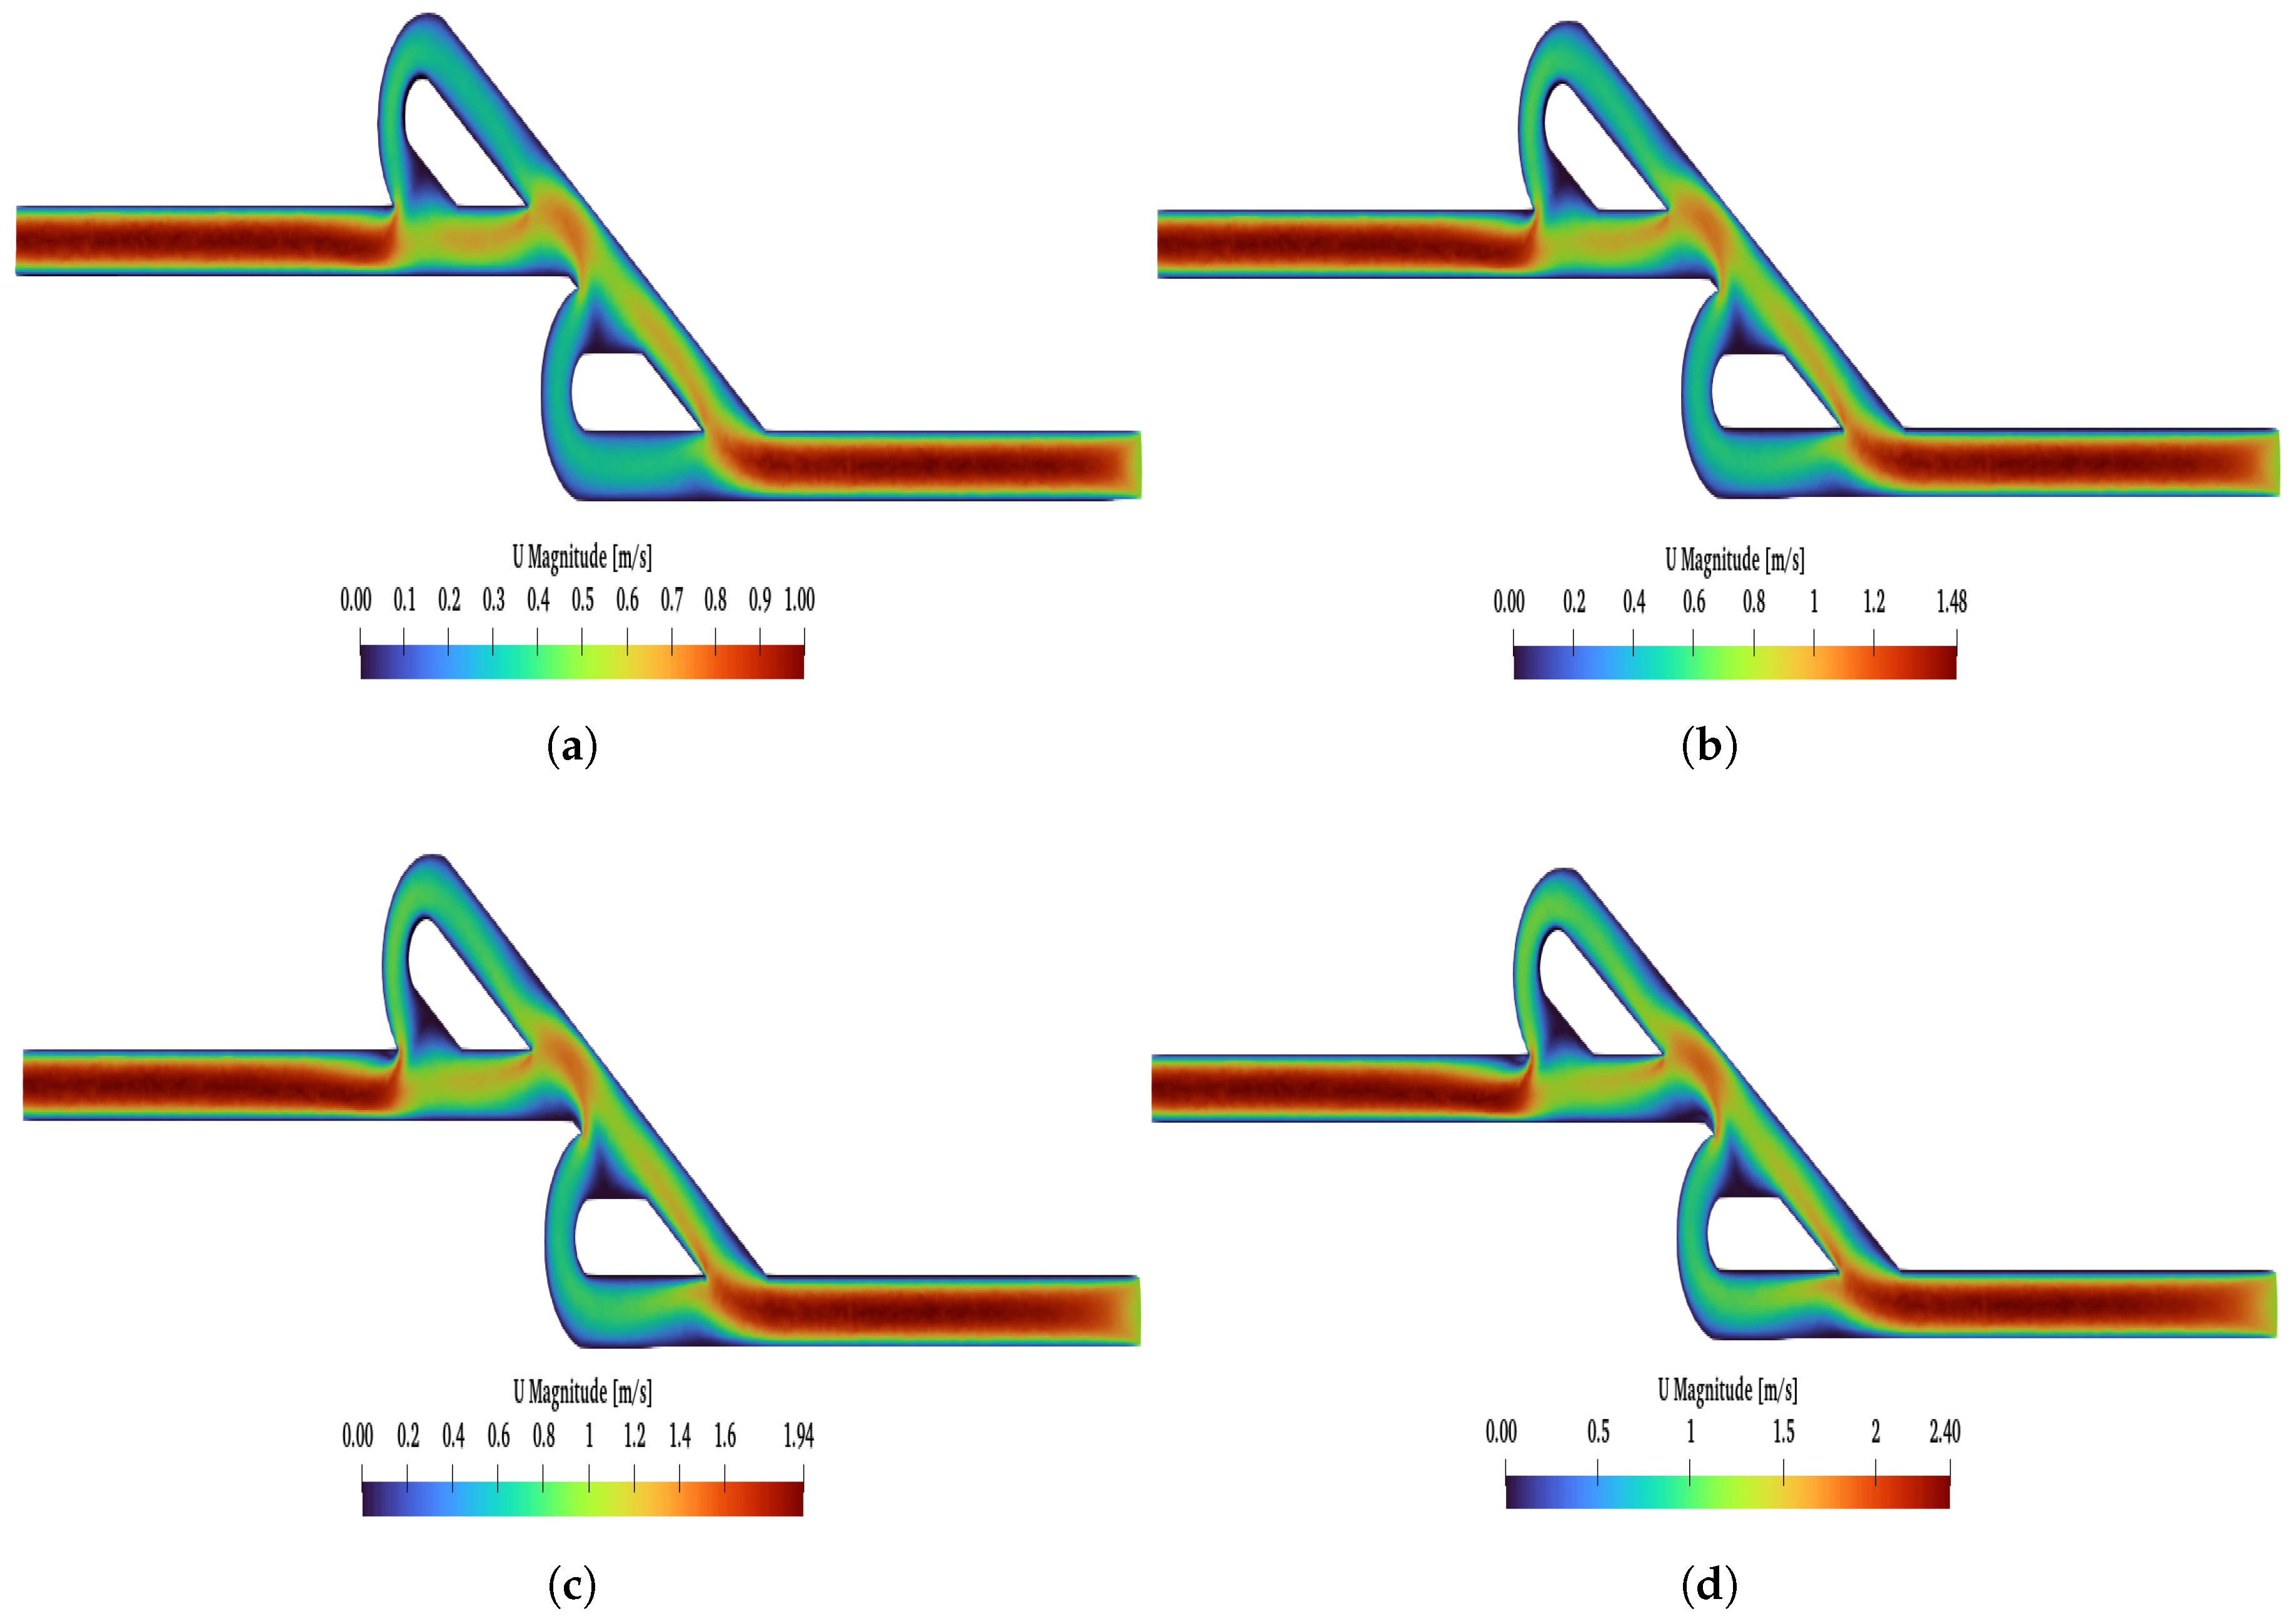
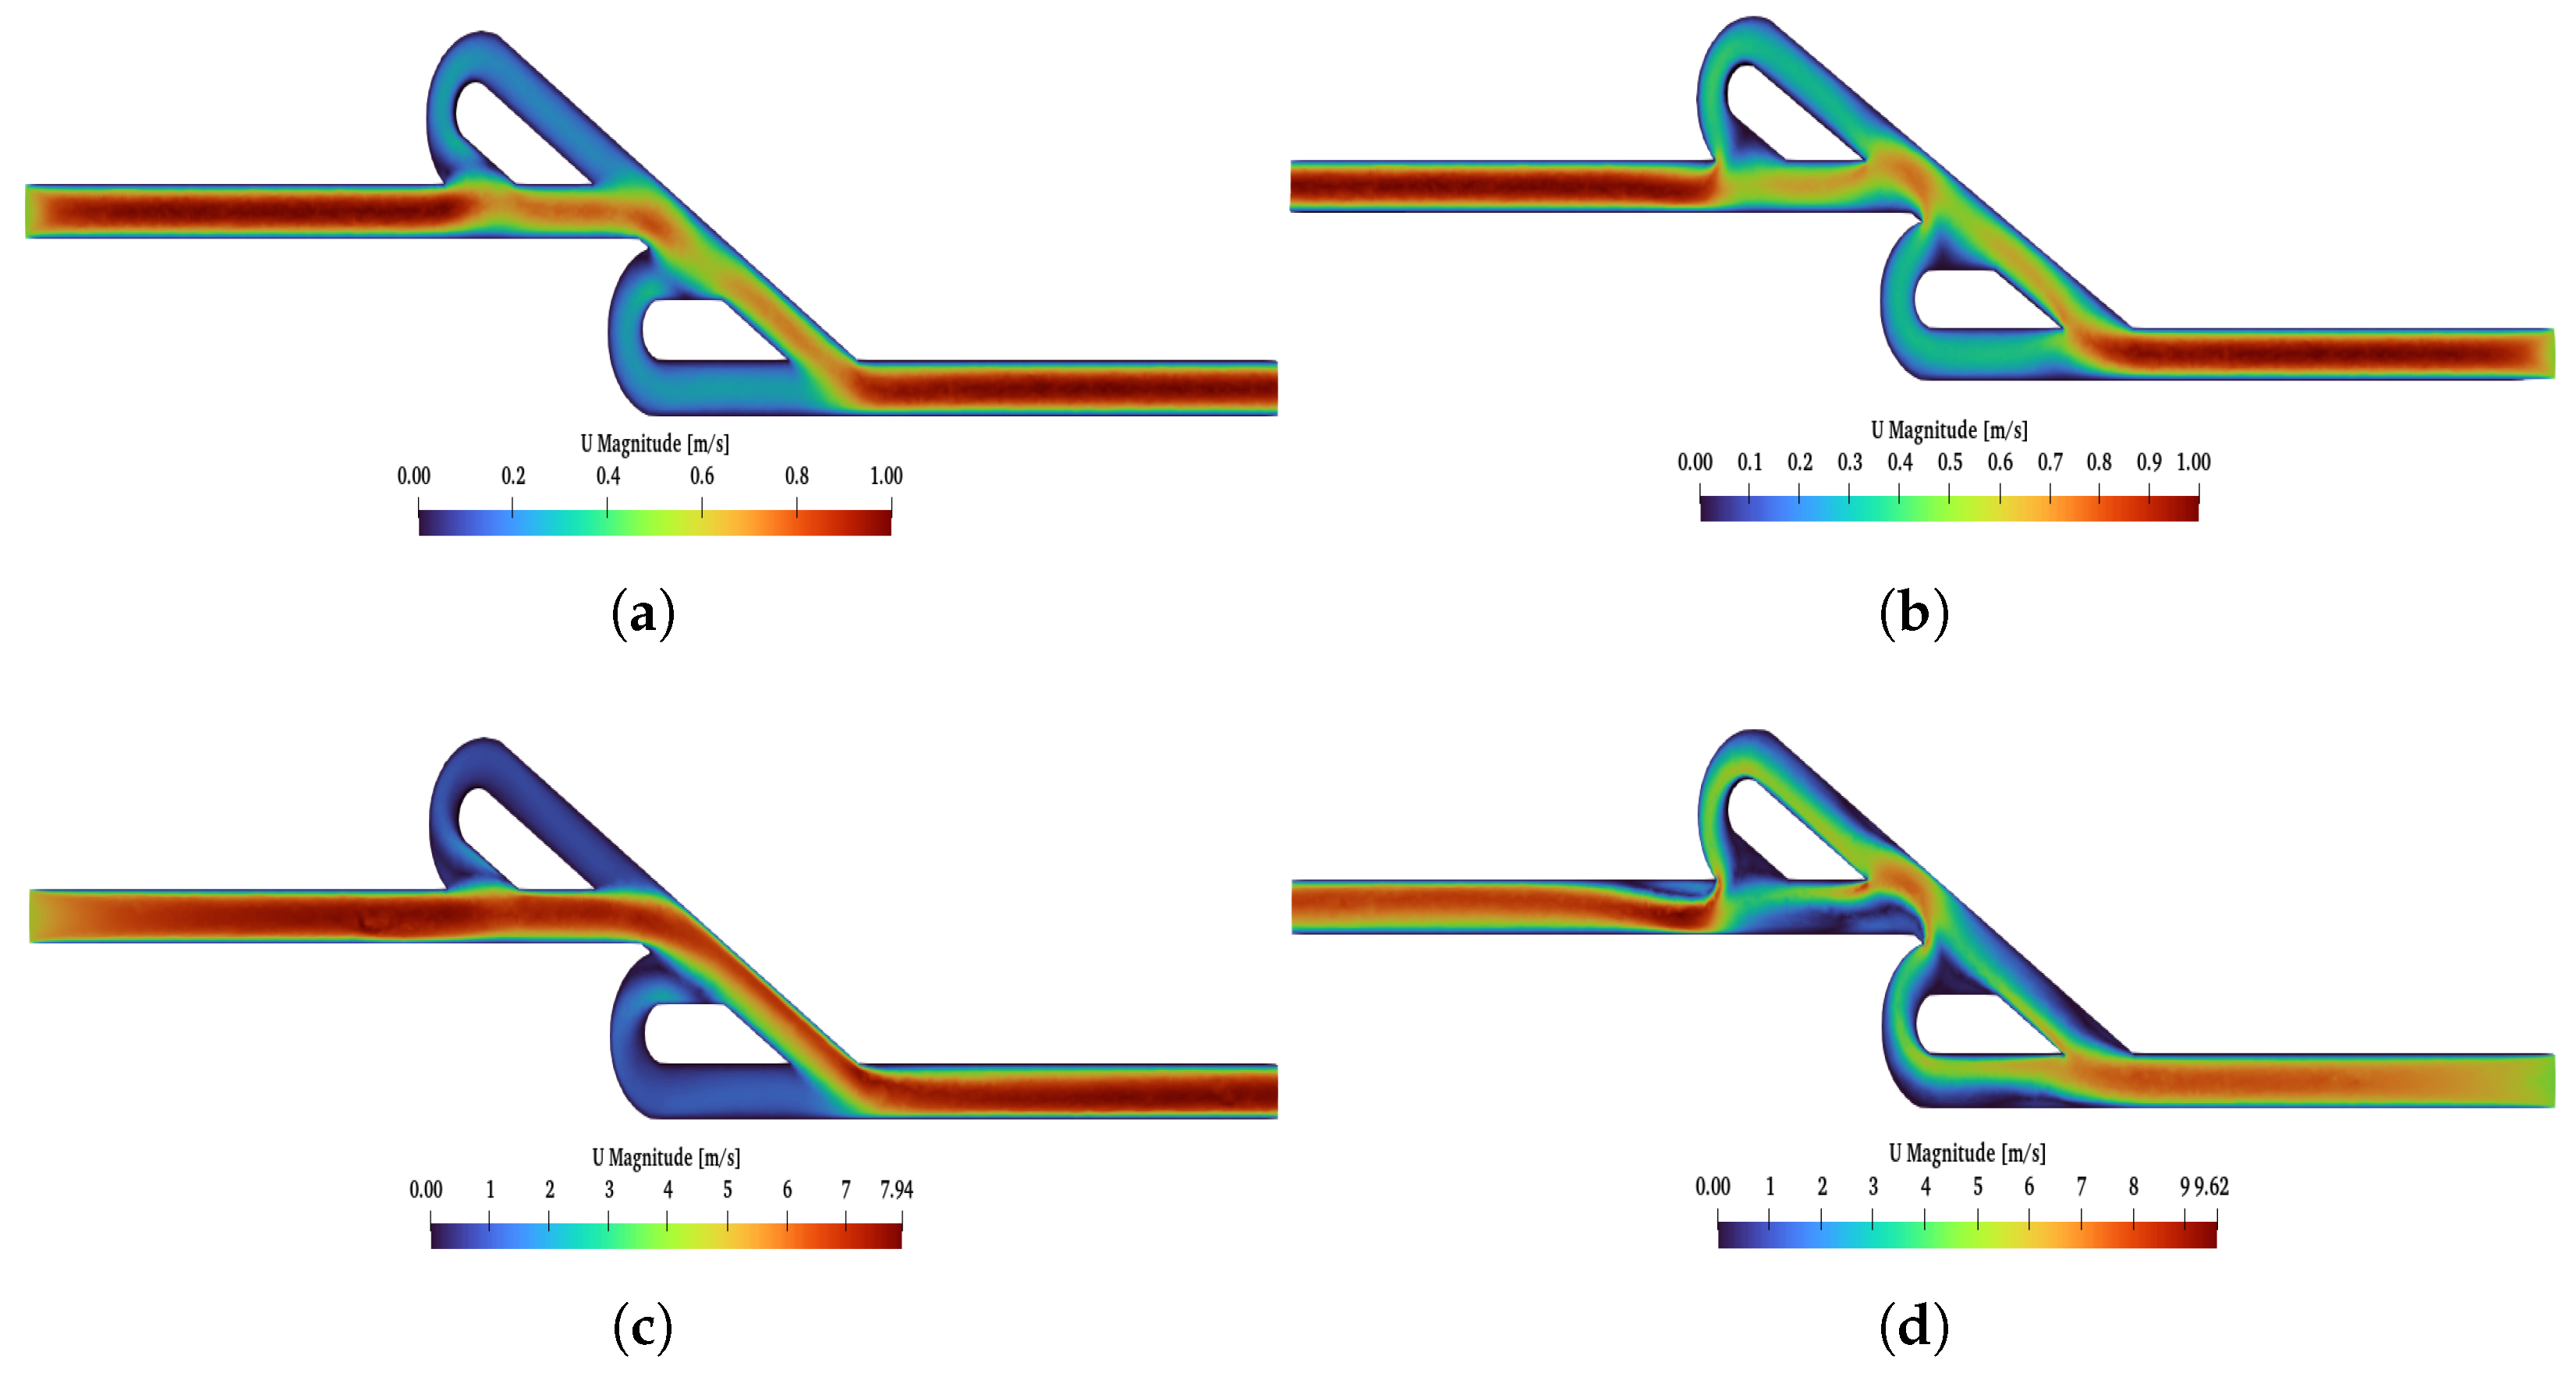
Figure 10, the main differences between these two cases (
,
) are presented. When the reverse flow was applied, and for higher Re at the second loop, a higher velocity was observed, while, at the main path, the velocity decreased after the first loop. The maximum magnitude of the velocity occurred among the first and second loops. Additionally, for
, the maximum velocity in the valve was similar for both flows, while, for
, the maximum velocity was higher for the reverse than the forward flow. Finally, for forward flow, the velocity field had the same behavior for both Re numbers, and the magnitude of the velocity was higher at the main path, as expected.
The post-process analysis (at inlet–outlet patches) for the six-staged micro Tesla is presented in
Figure 9 with a blue line. When Re increases, this causes an increase in diodicity for the six-staged valve, as observed for the double valve. The maximum diodicity was achieved for
and was equal to
, while the minimum was
for
. In
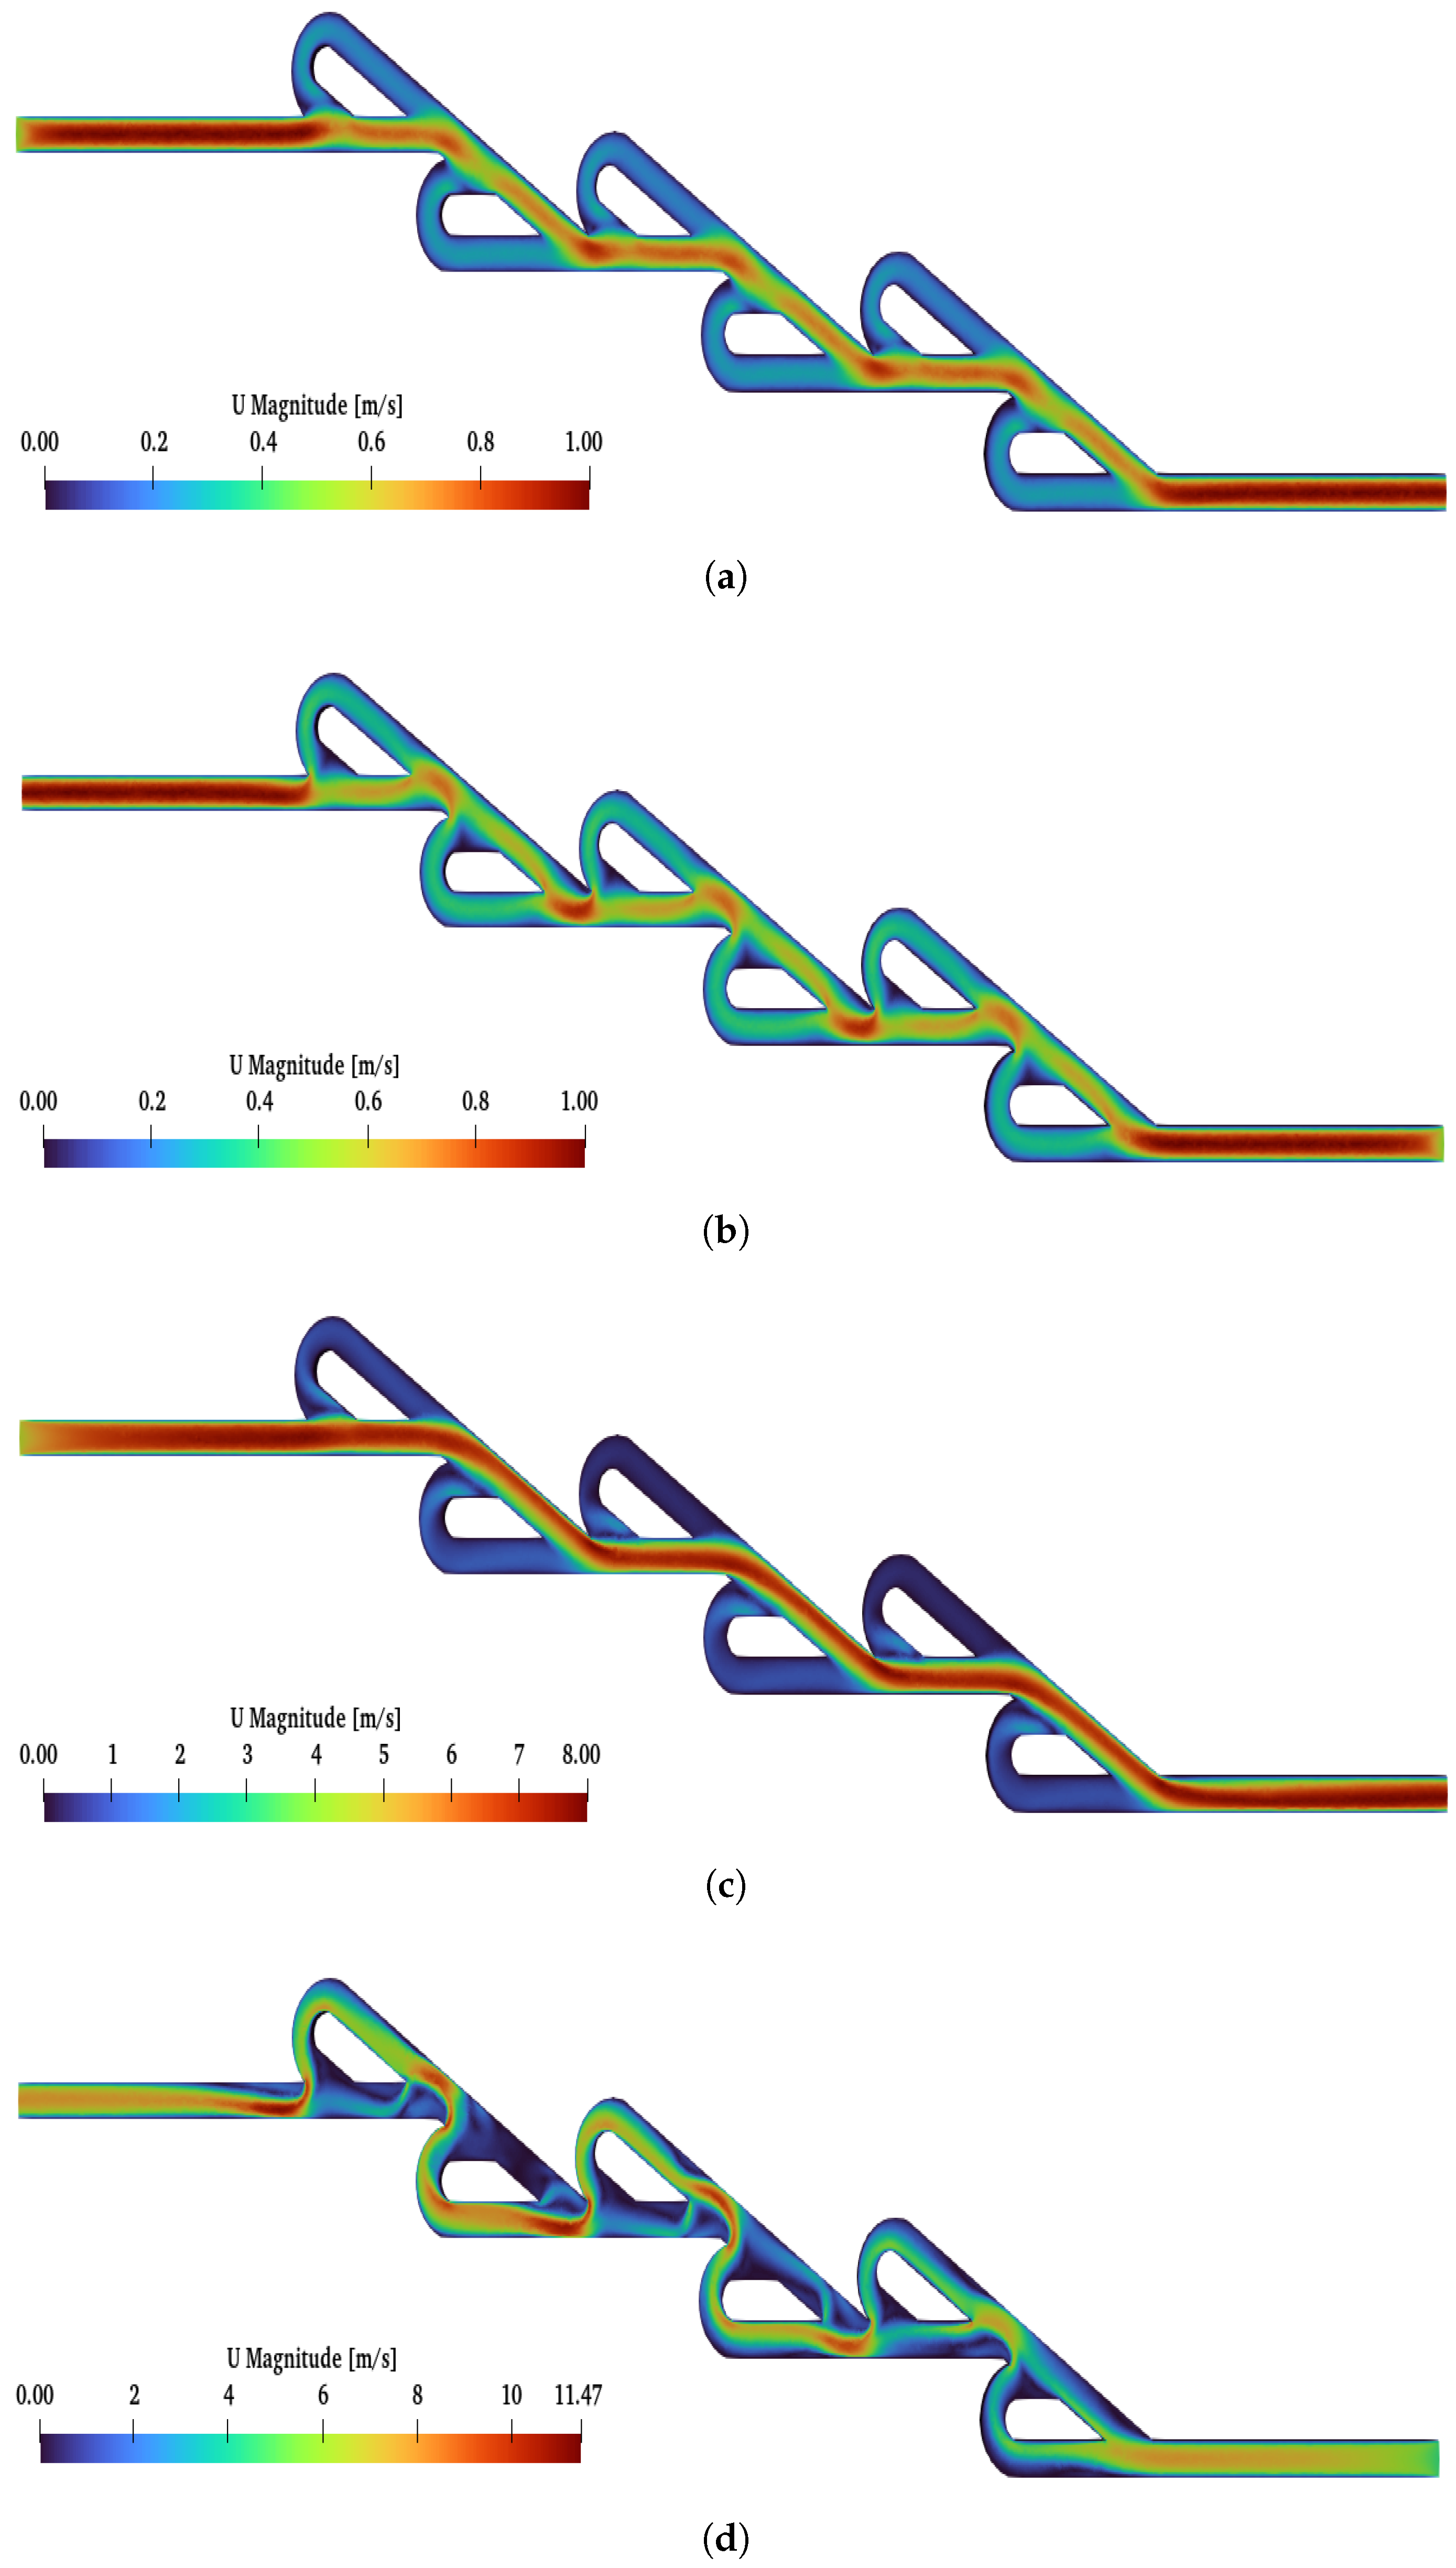
Figure 11, the flows for the two cases (
,
) are presented. When the forward flow is applied for both Re numbers, the maximum velocity is located at the main path, as expected. Moreover, when the reverse flow is applied for both Re numbers, the velocity is increased at the loops compared to the forward flow. Additionally, for
, the magnitude of the velocity is almost uniform at the loops and has the same pattern for all loops. On the other hand, for
, at the main path, many locations are observed with the minimum velocity magnitude; moreover, at the loops, the velocity is not uniform as in the case when
is applied. A significant observation is that, under
and after the second loop, there was a higher velocity at the loops. Finally, for
, the maximum velocity in the valve is similar for both flows, while, for
, the maximum velocity is observed for the reverse flow.
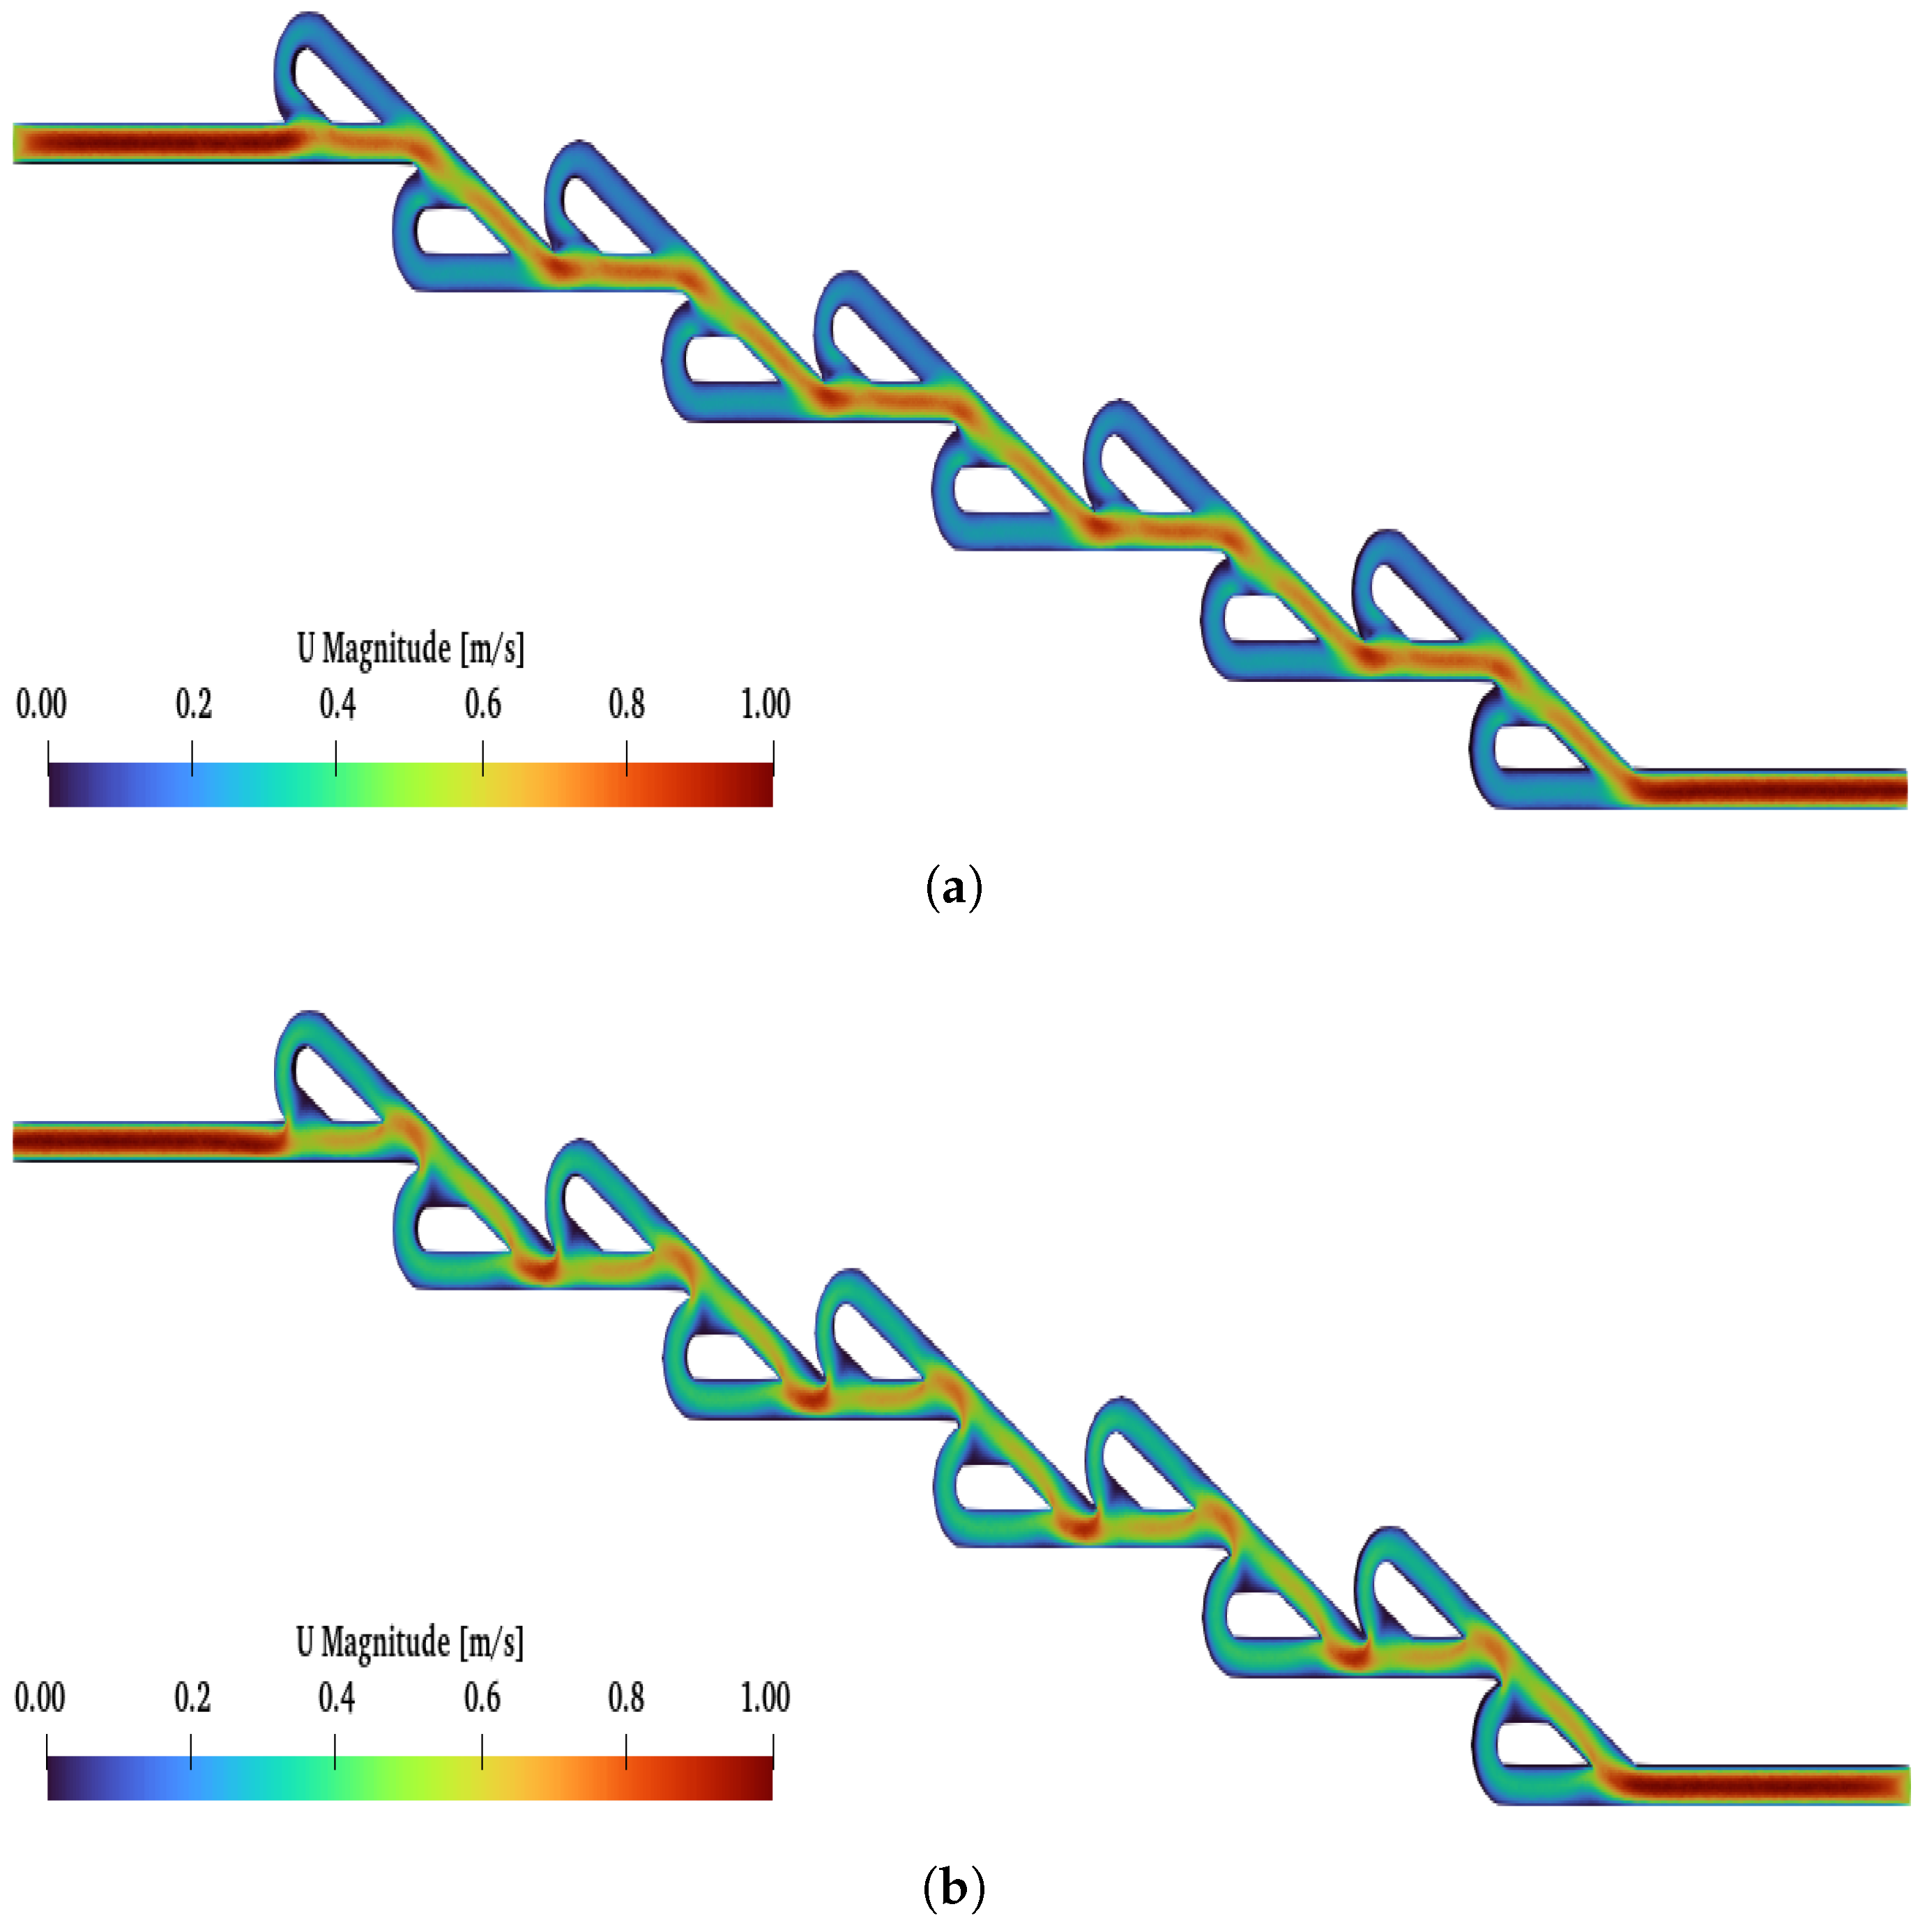
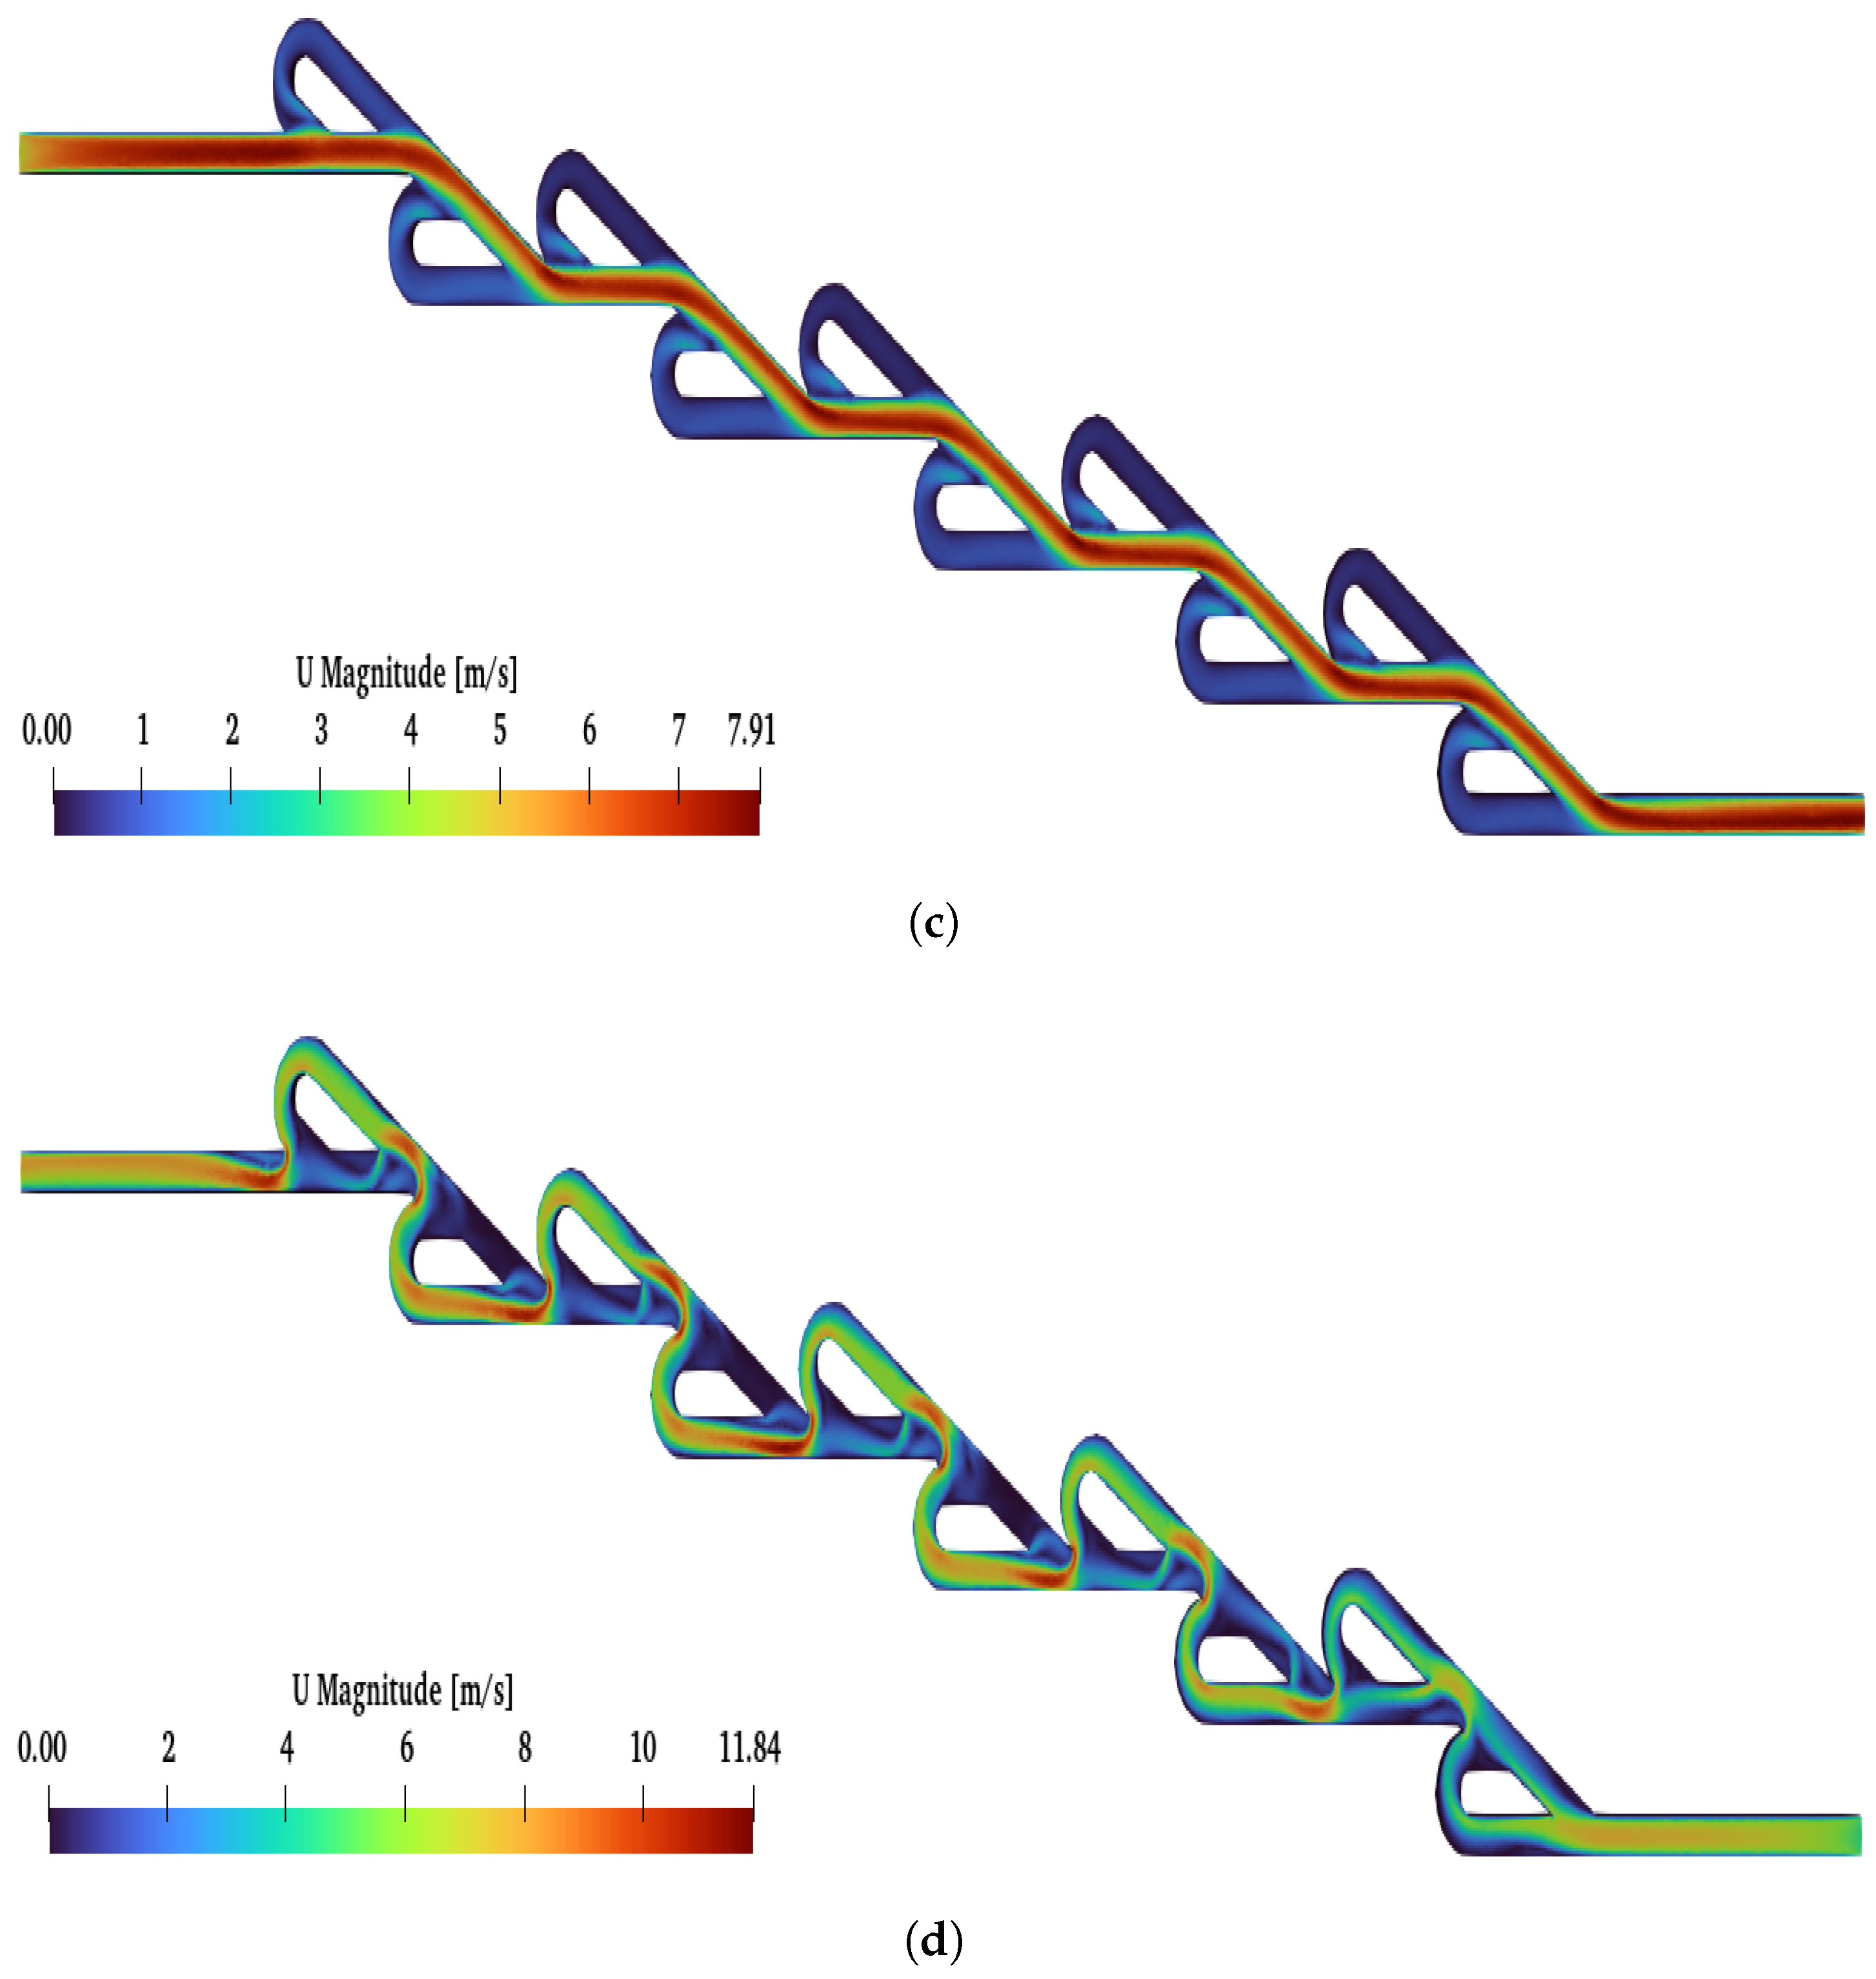
Moreover, when the number of valves was increased further, reaching up to the ten-staged valve, the increase in Re affected the diodicity, as in the previous cases. In
Figure 12, the flows for lower and higher Re numbers are presented. Additionally, in
Figure 9, with the green line, we demonstrate how the increase in Re affects the diodicity. The maximum diodicity achieved was for
and was equal to
, while the minimum was
for
. The ten-staged valve’s results followed the same pattern as for the six-staged valve.
In
Figure 9, the diodicity differences between these cases are also presented. Comparing the double- (
) and six-staged (
) valves, the minimum diodicity difference (
) occurred at
, while the maximum
was found equal to
under
. Moreover, as Re increased,
increased also. Comparing the six-staged (
) and ten-staged (
) values in terms of the increases in Re, the
increased also, while, when the number of valves increased by
(as before from
to
), the maximum
was found equal to
. Hence, the increase in
is not proportional to
the number of valves. While the diodicity and Re seems to act almost linearly, the diodicity and N are not proportional, since the diodicity did not increase with the number of valves.
Finally, further simulations were performed for an even number of valves (
). The selection of the specific staged valves was based on halving
, and we verified that the diodicity was not proportional to the number of valves. The procedure followed was identical to that for the odd numbers of valves (
). In
Figure 13, the diodicity for all N-staged valves is presented; again, as
increases,
D increases also. Moreover, it is now more obvious that the increase in
D is not proportional to the increase in
N, as minor differences appear between the five- and six-staged valves, which are clear from the comparison between
,
and
,
, where D is not proportional to the increase in N. Moreover, in
Table A2, we present the results for the simulations at the inlet–outlet patches, while, in
Table A3, we present the percentage increase in diodicity between the inlet–outlet and 0.6 mm cases for different Tesla valve stages.
4. Discussion
From the current simulations, the direct findings are the maximum and minimum
D for each geometry. Specifically, the maximum diodicity achieved for ten-, six-, five-, three-staged and double valves is
,
,
,
and
under
, respectively. The corresponding minimum diodicity values
,
,
,
and
are obtained for
under ten-, six-, five-, three-staged and double valves, respectively. Even at the lowest Reynolds number examined, measurable differences in diodicity persisted among the various valve configurations, indicating that the geometric staging influences the performance even within a viscous-dominated regime. To better understand the effects of adding additional stages, a quantitative assessment of diminishing returns was performed by evaluating the incremental diodicity gain per stage (
) at
; the diodicity increase per added stage follows in
Table 3.
This progression demonstrates a clear reduction in diodicity enhancement per additional stage, indicating that, beyond a certain geometric complexity, the flow field saturates and additional loops contribute proportionally less to momentum redirection. In practical terms, this means that designers should avoid excessive staging, as the performance gain per added loop decreases rapidly while the fabrication cost and pressure losses continue to rise. At low Reynolds numbers (Re = 50), the incremental improvements are almost negligible, consistent with the dominance of viscous forces that suppress inertial flow separation mechanisms. For intermediate Reynolds numbers, all corresponding diodicity values across the valve configurations can be extracted from
Table A2. Generally, the trend of D exhibits an increase as Re increases; the investigation of higher Re values indicates that they may not be beneficial, as, in microfluidic systems, higher flow rates may lack practical applicability. Even for
, it is difficult to find practical applications [
24,
25,
26]. Furthermore, according to relevant studies [
19], the diodicity decreases for even higher
.
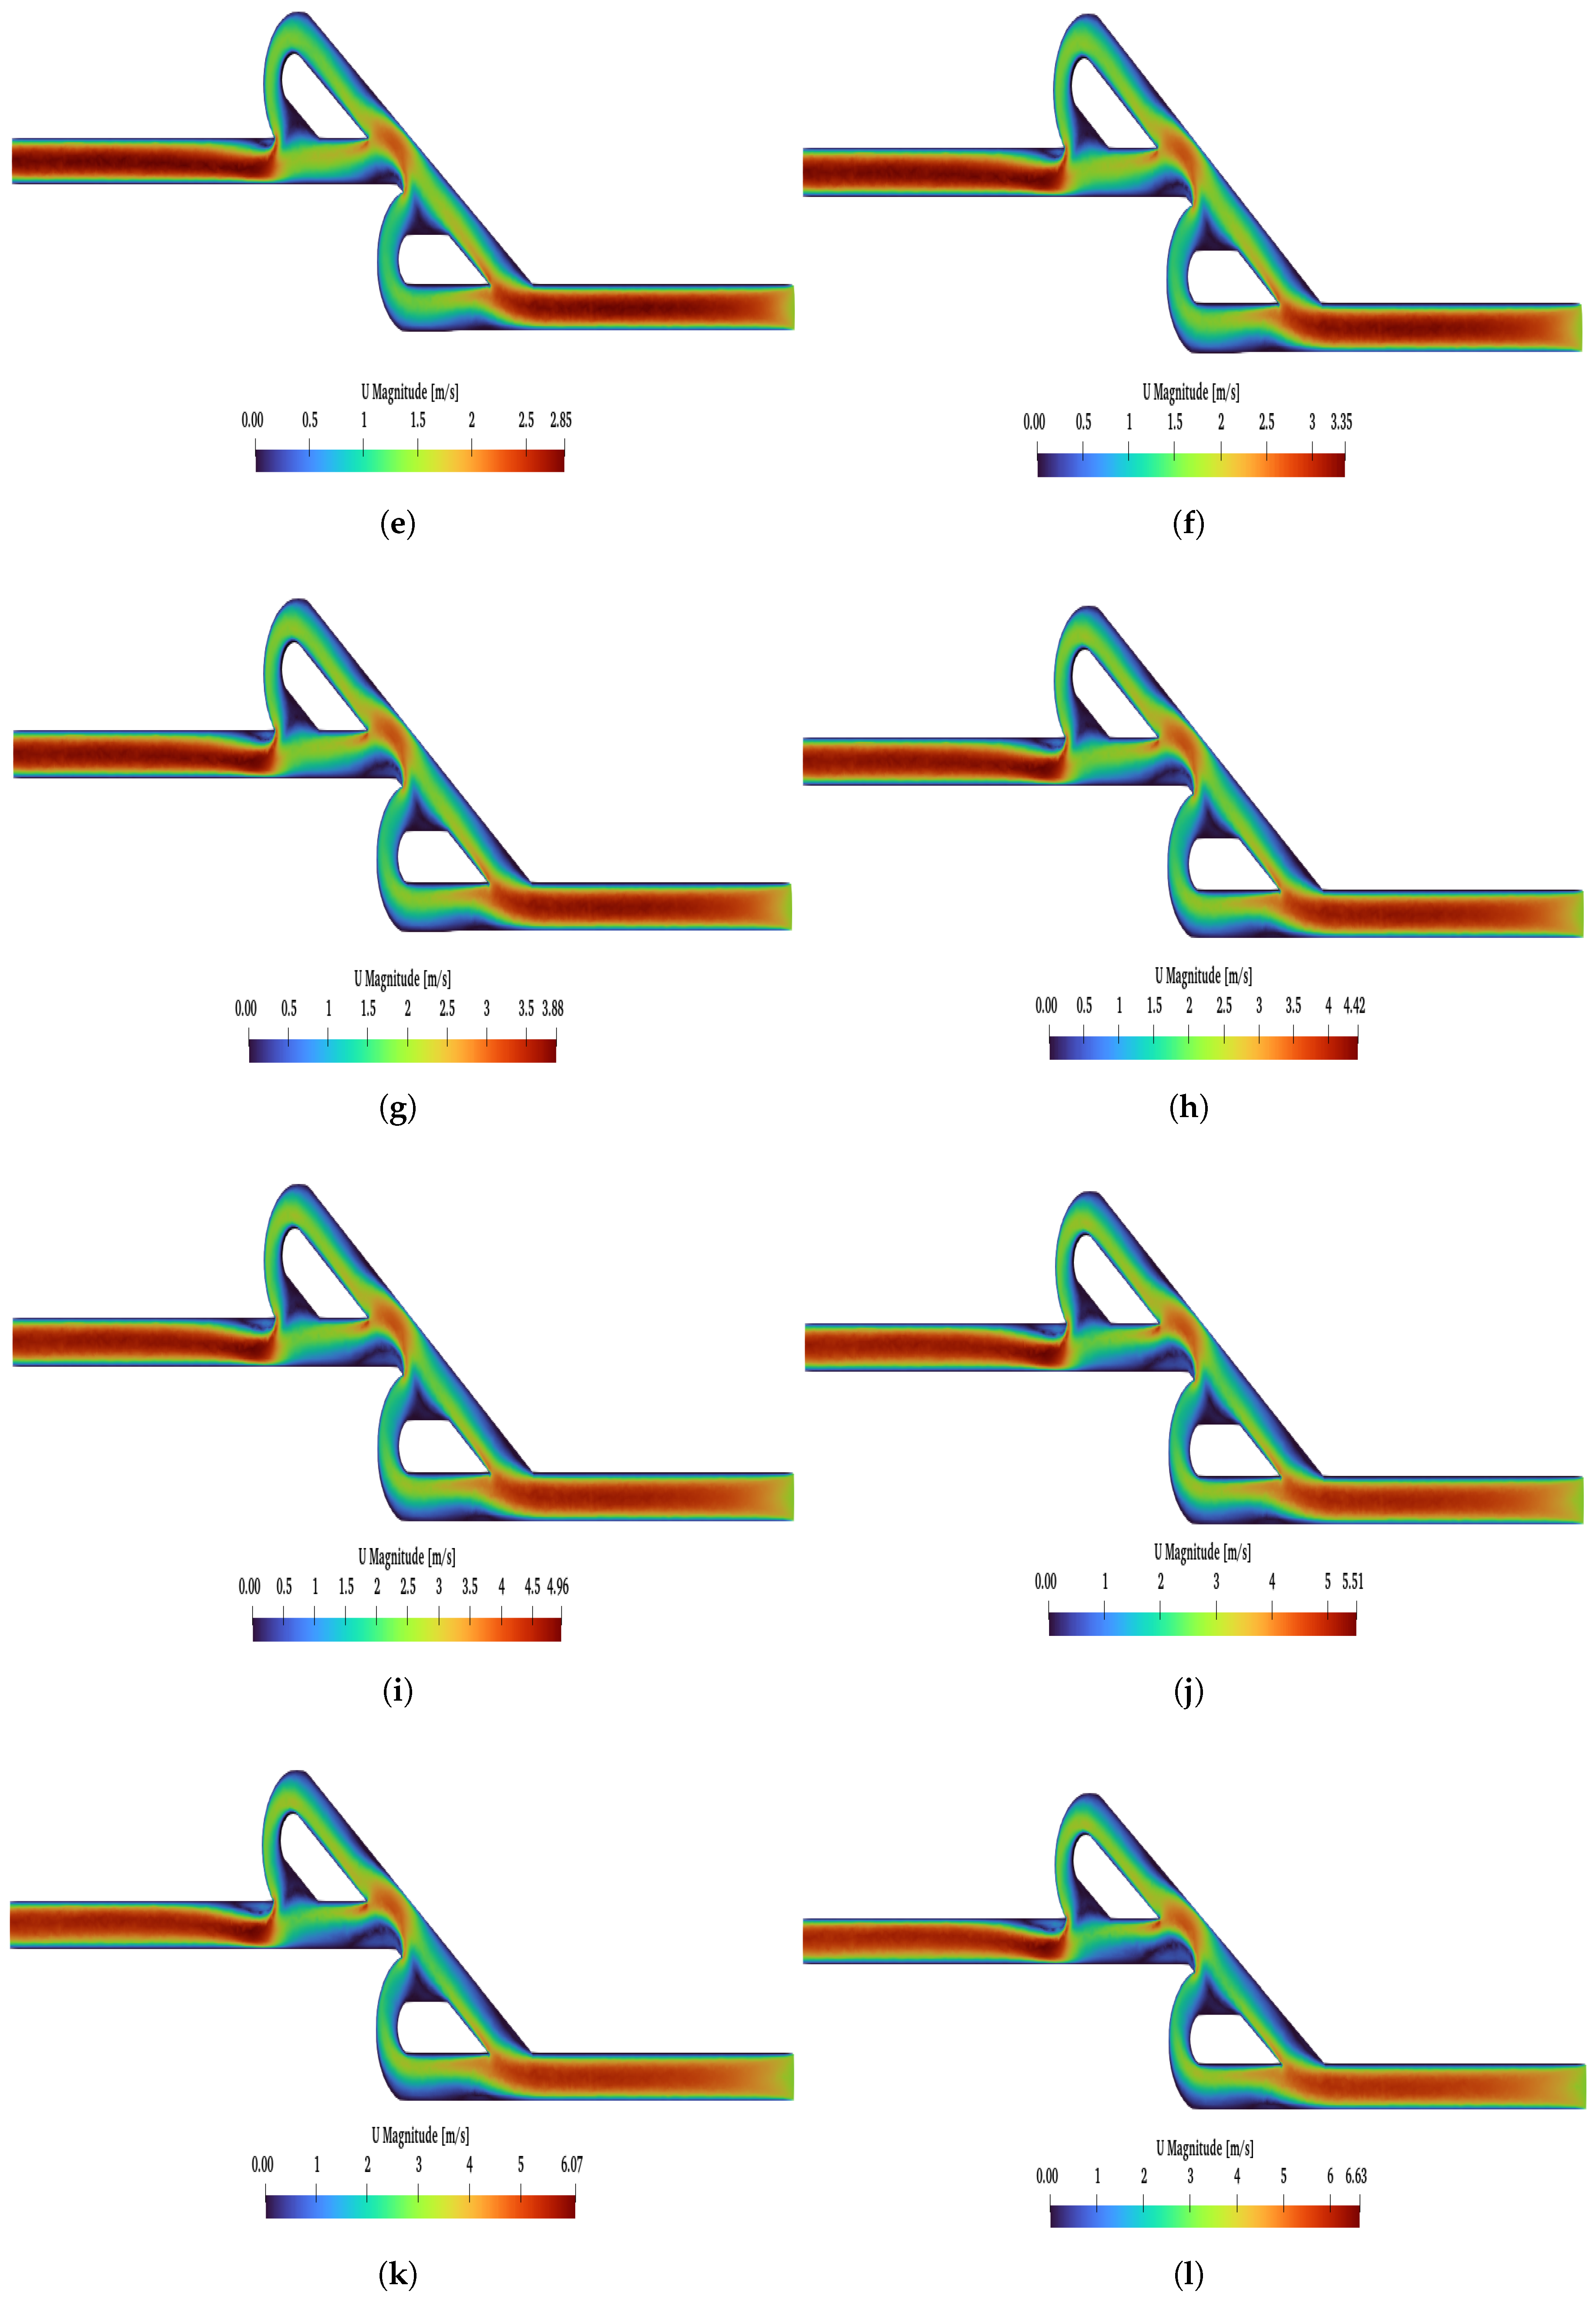
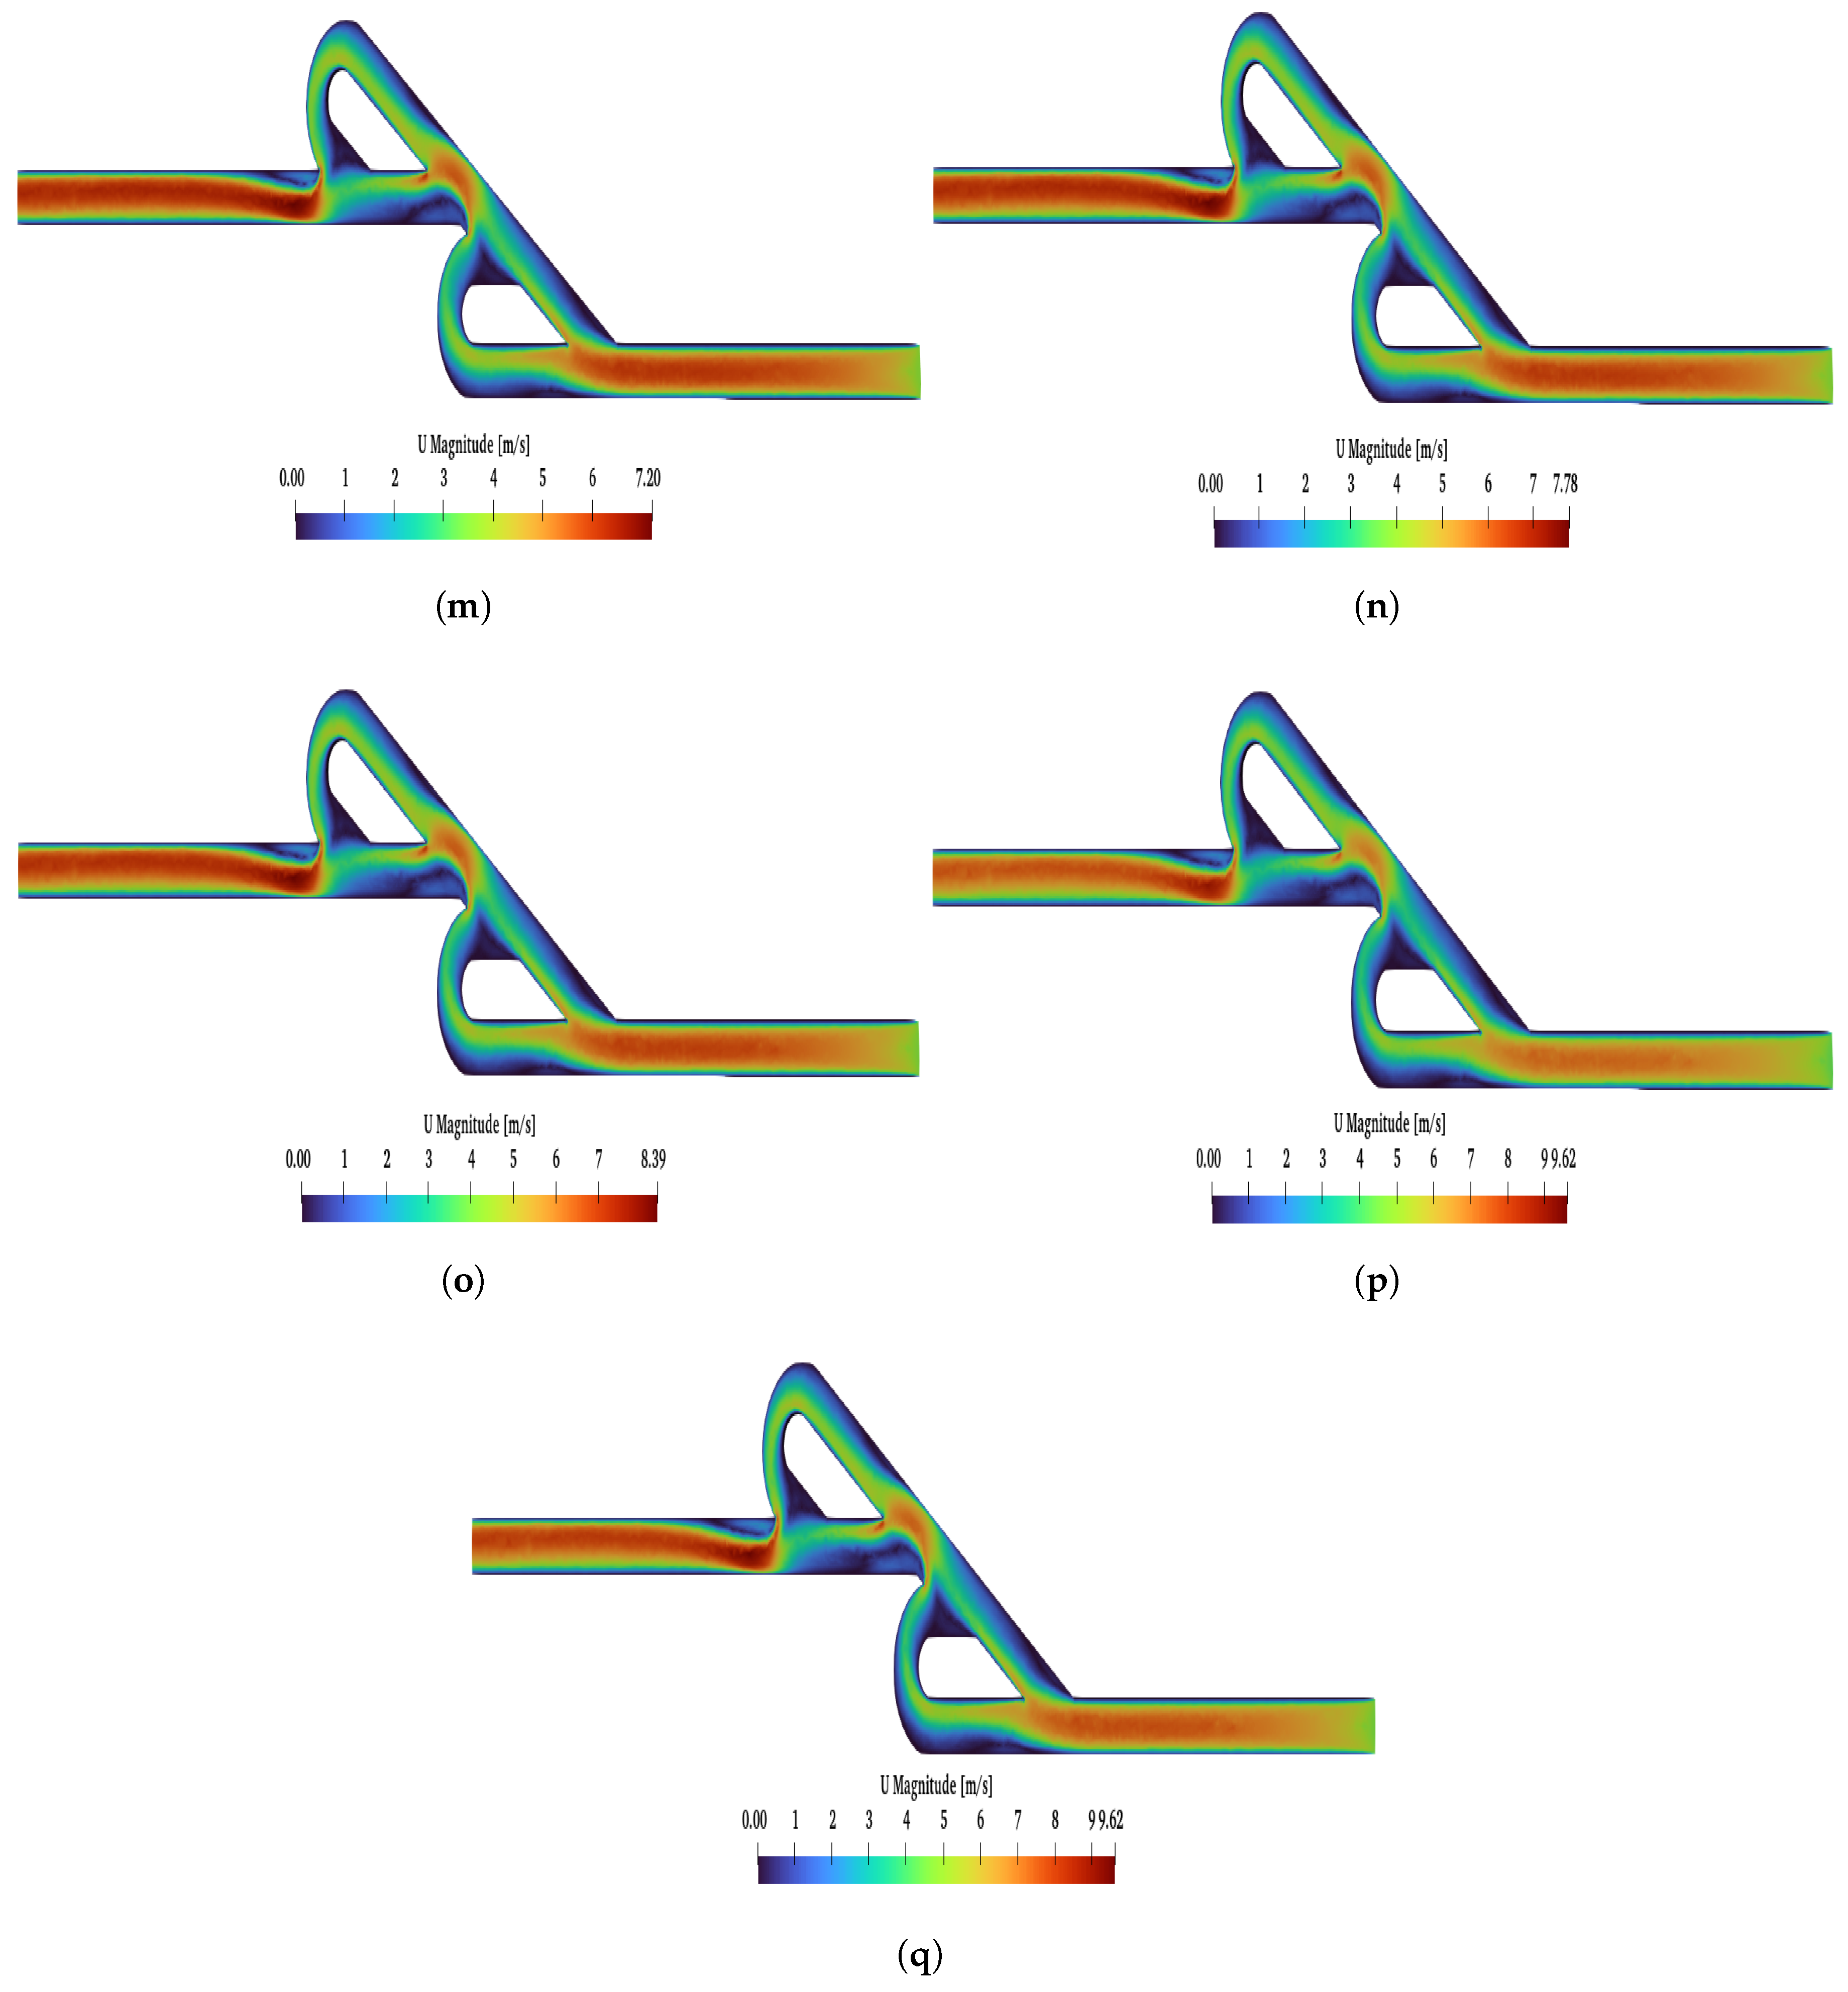
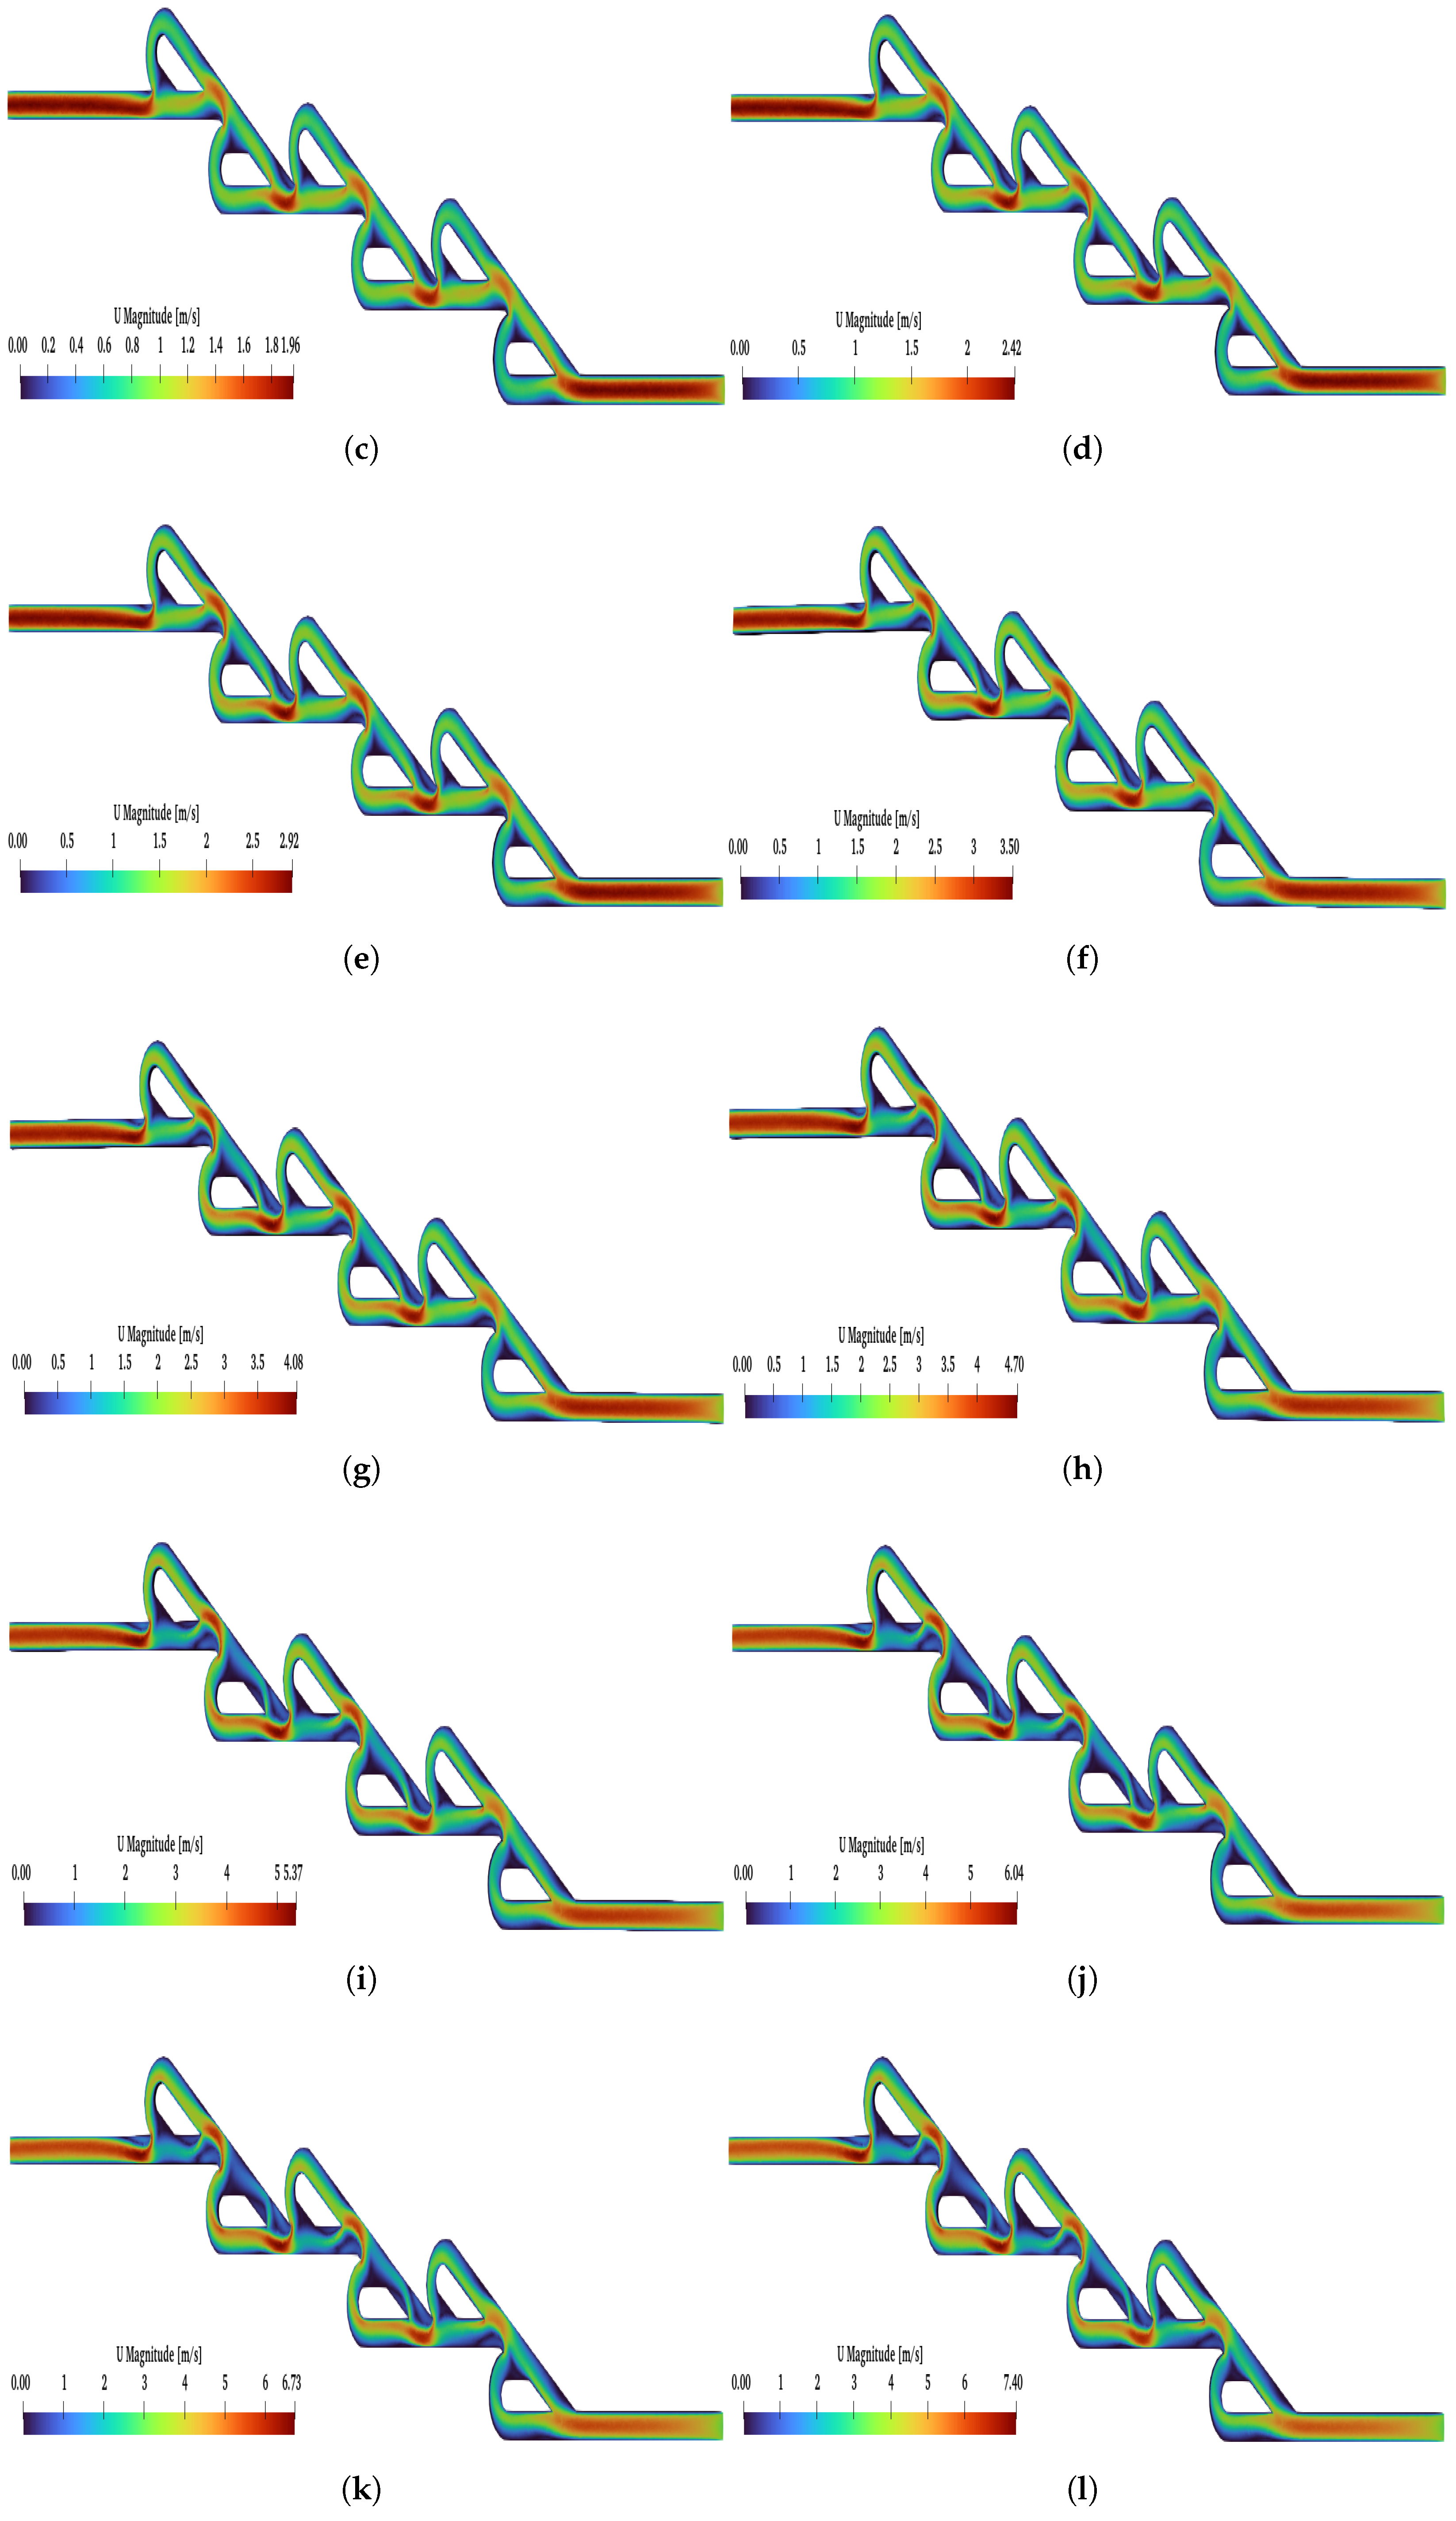
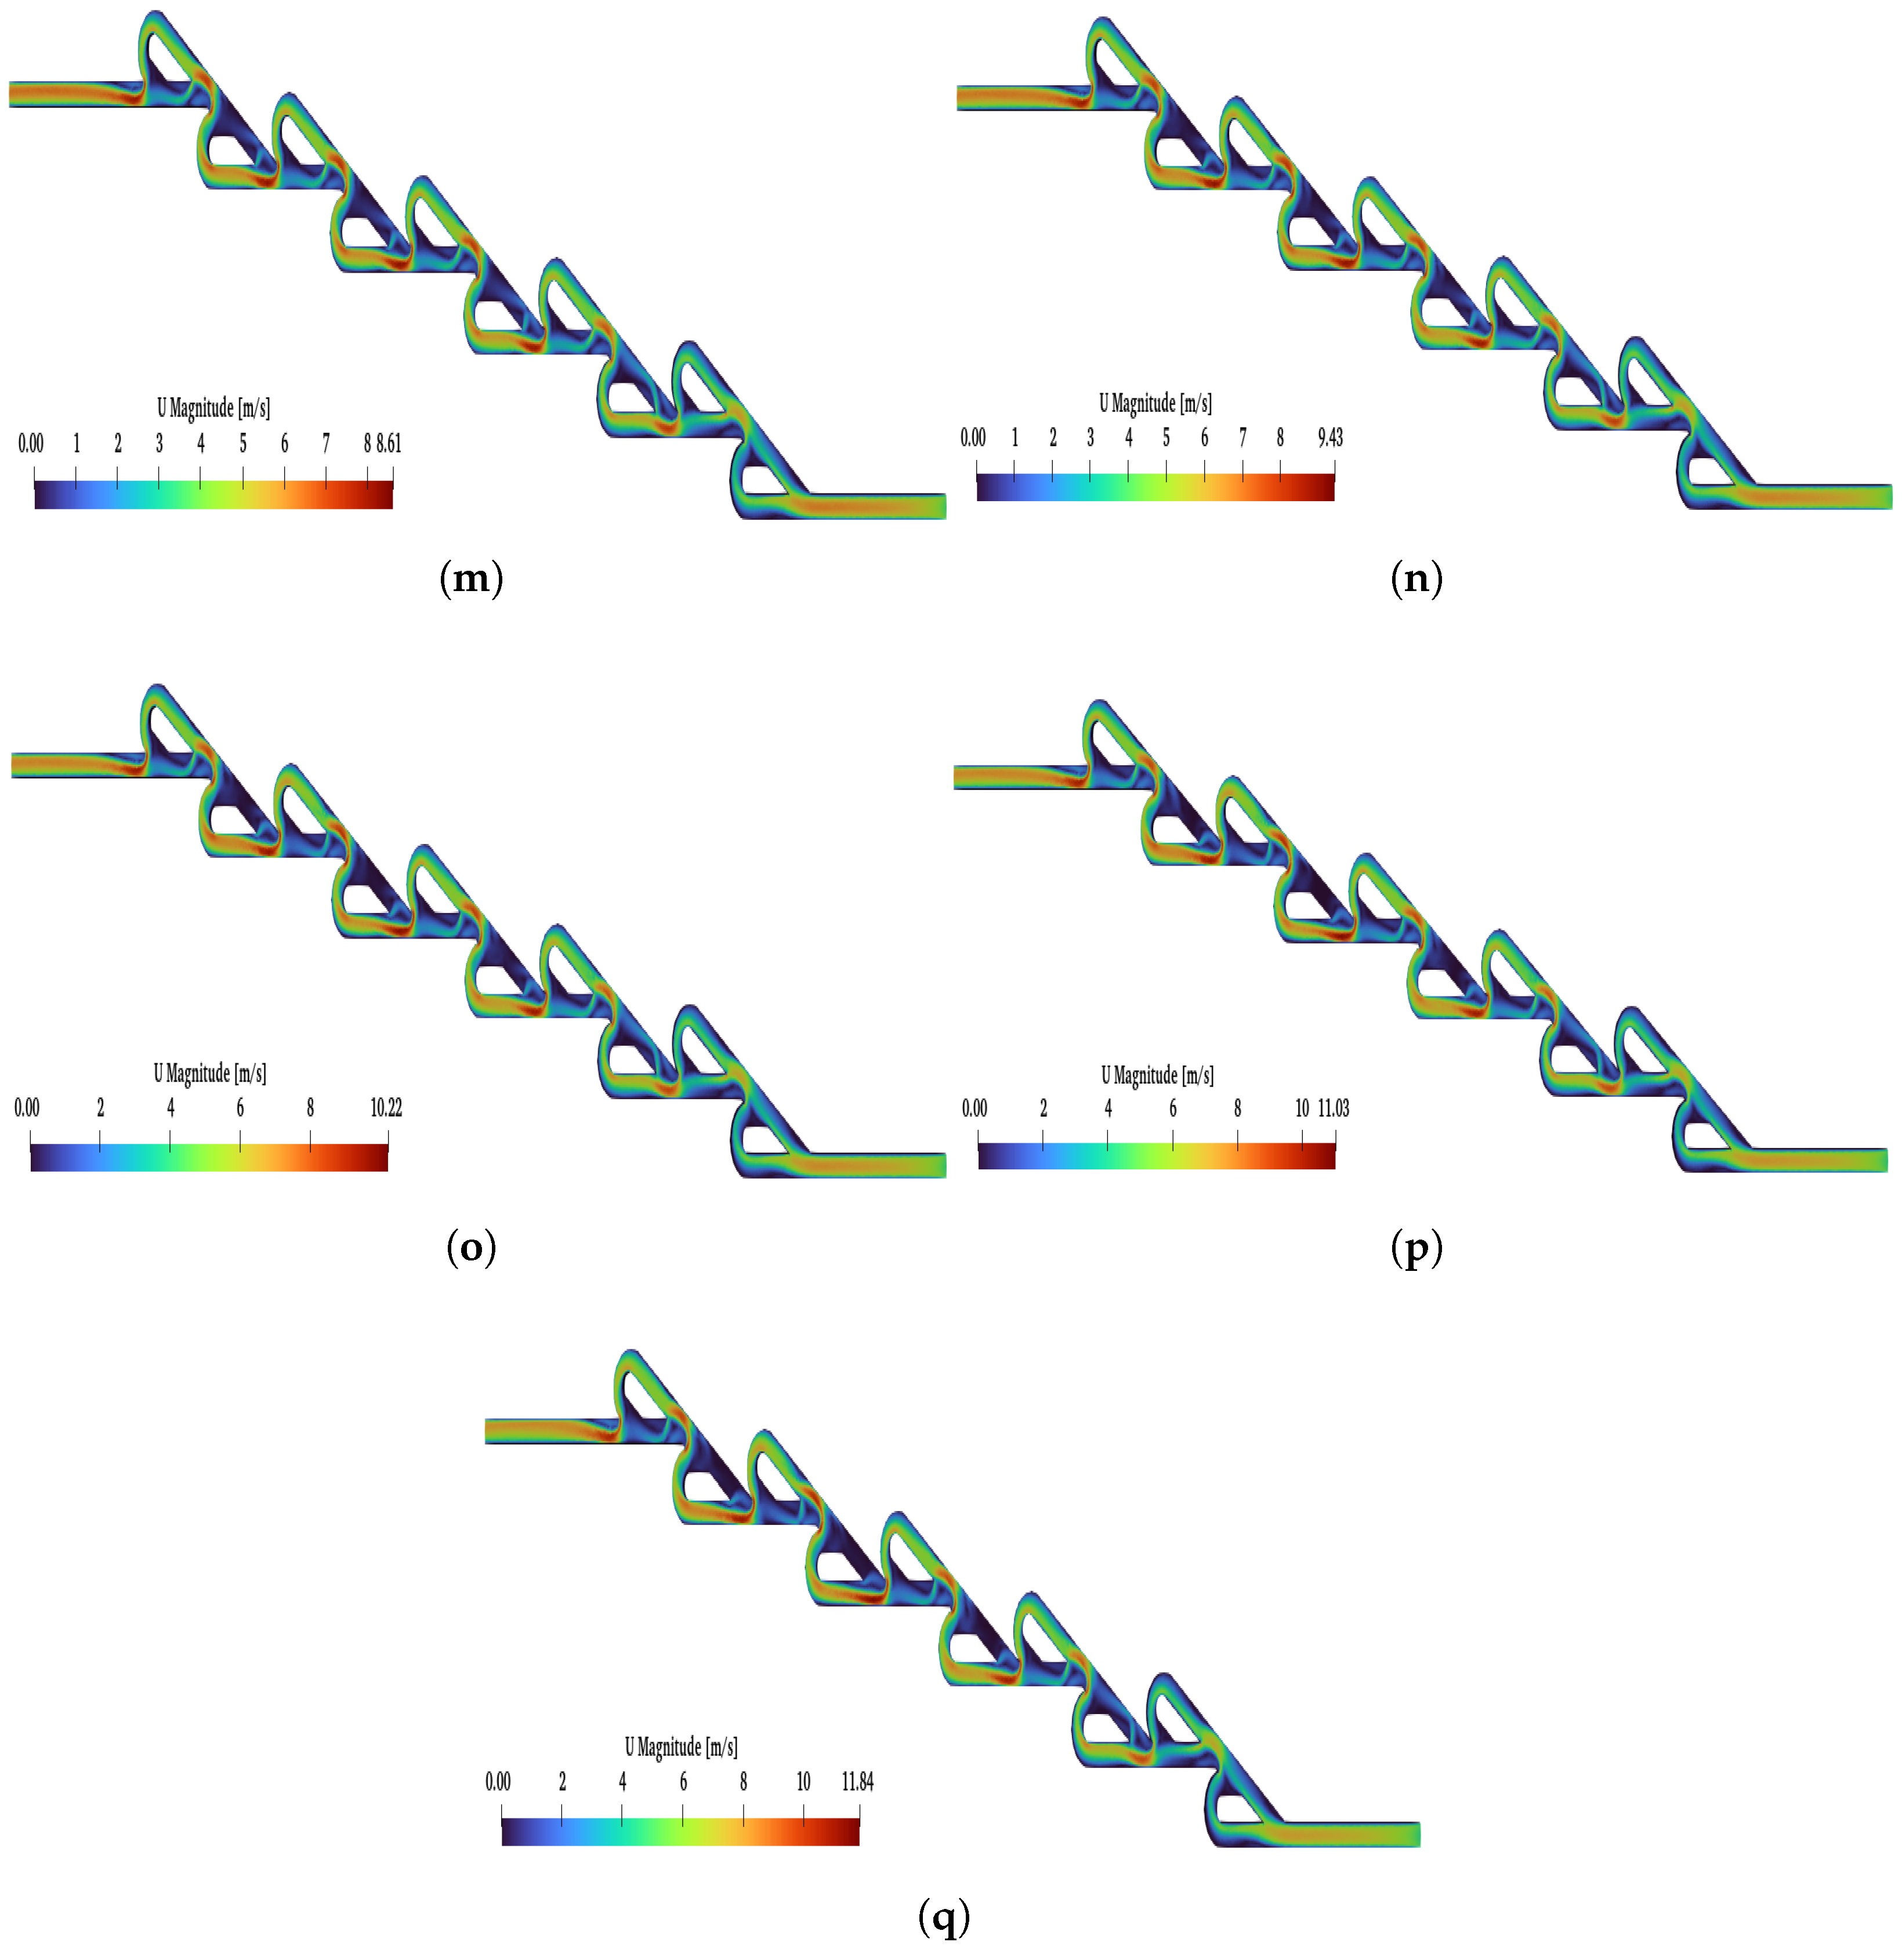
Additionally, for the ten- and six-staged valves, when a reverse flow is applied, a critical point is observed
. Above
, the magnitude of the velocity is higher at the loops than the main path. In
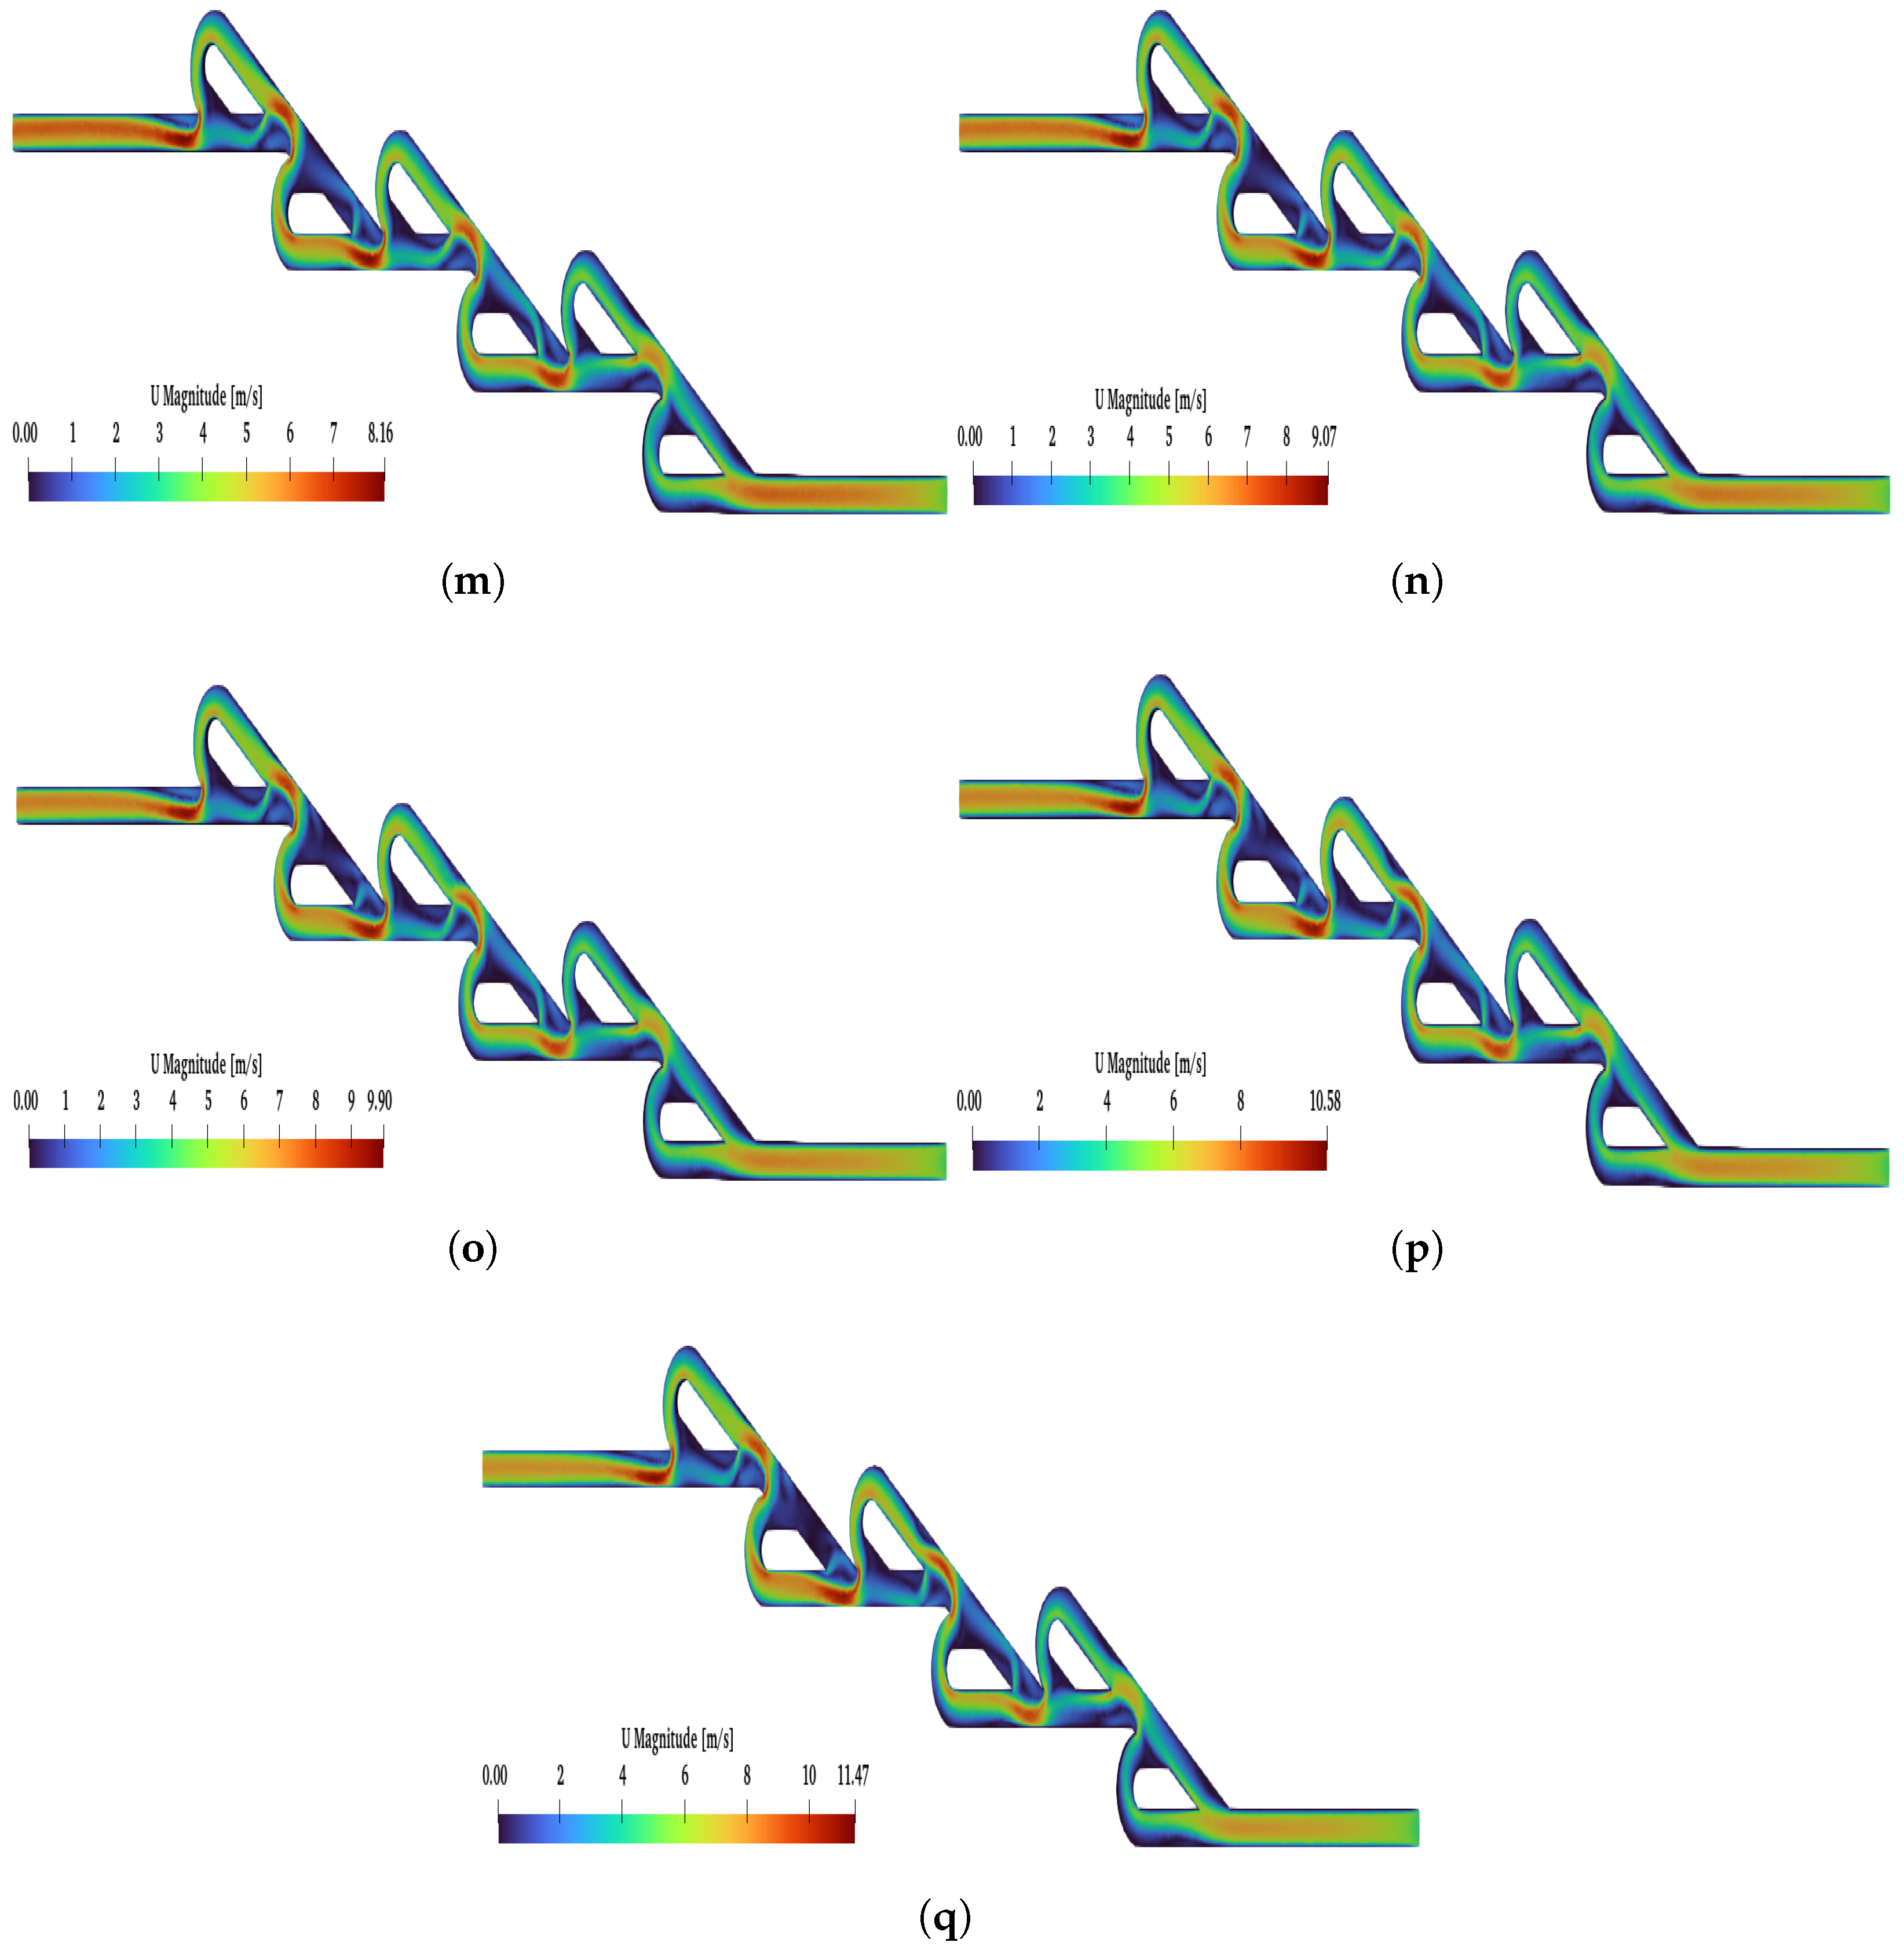
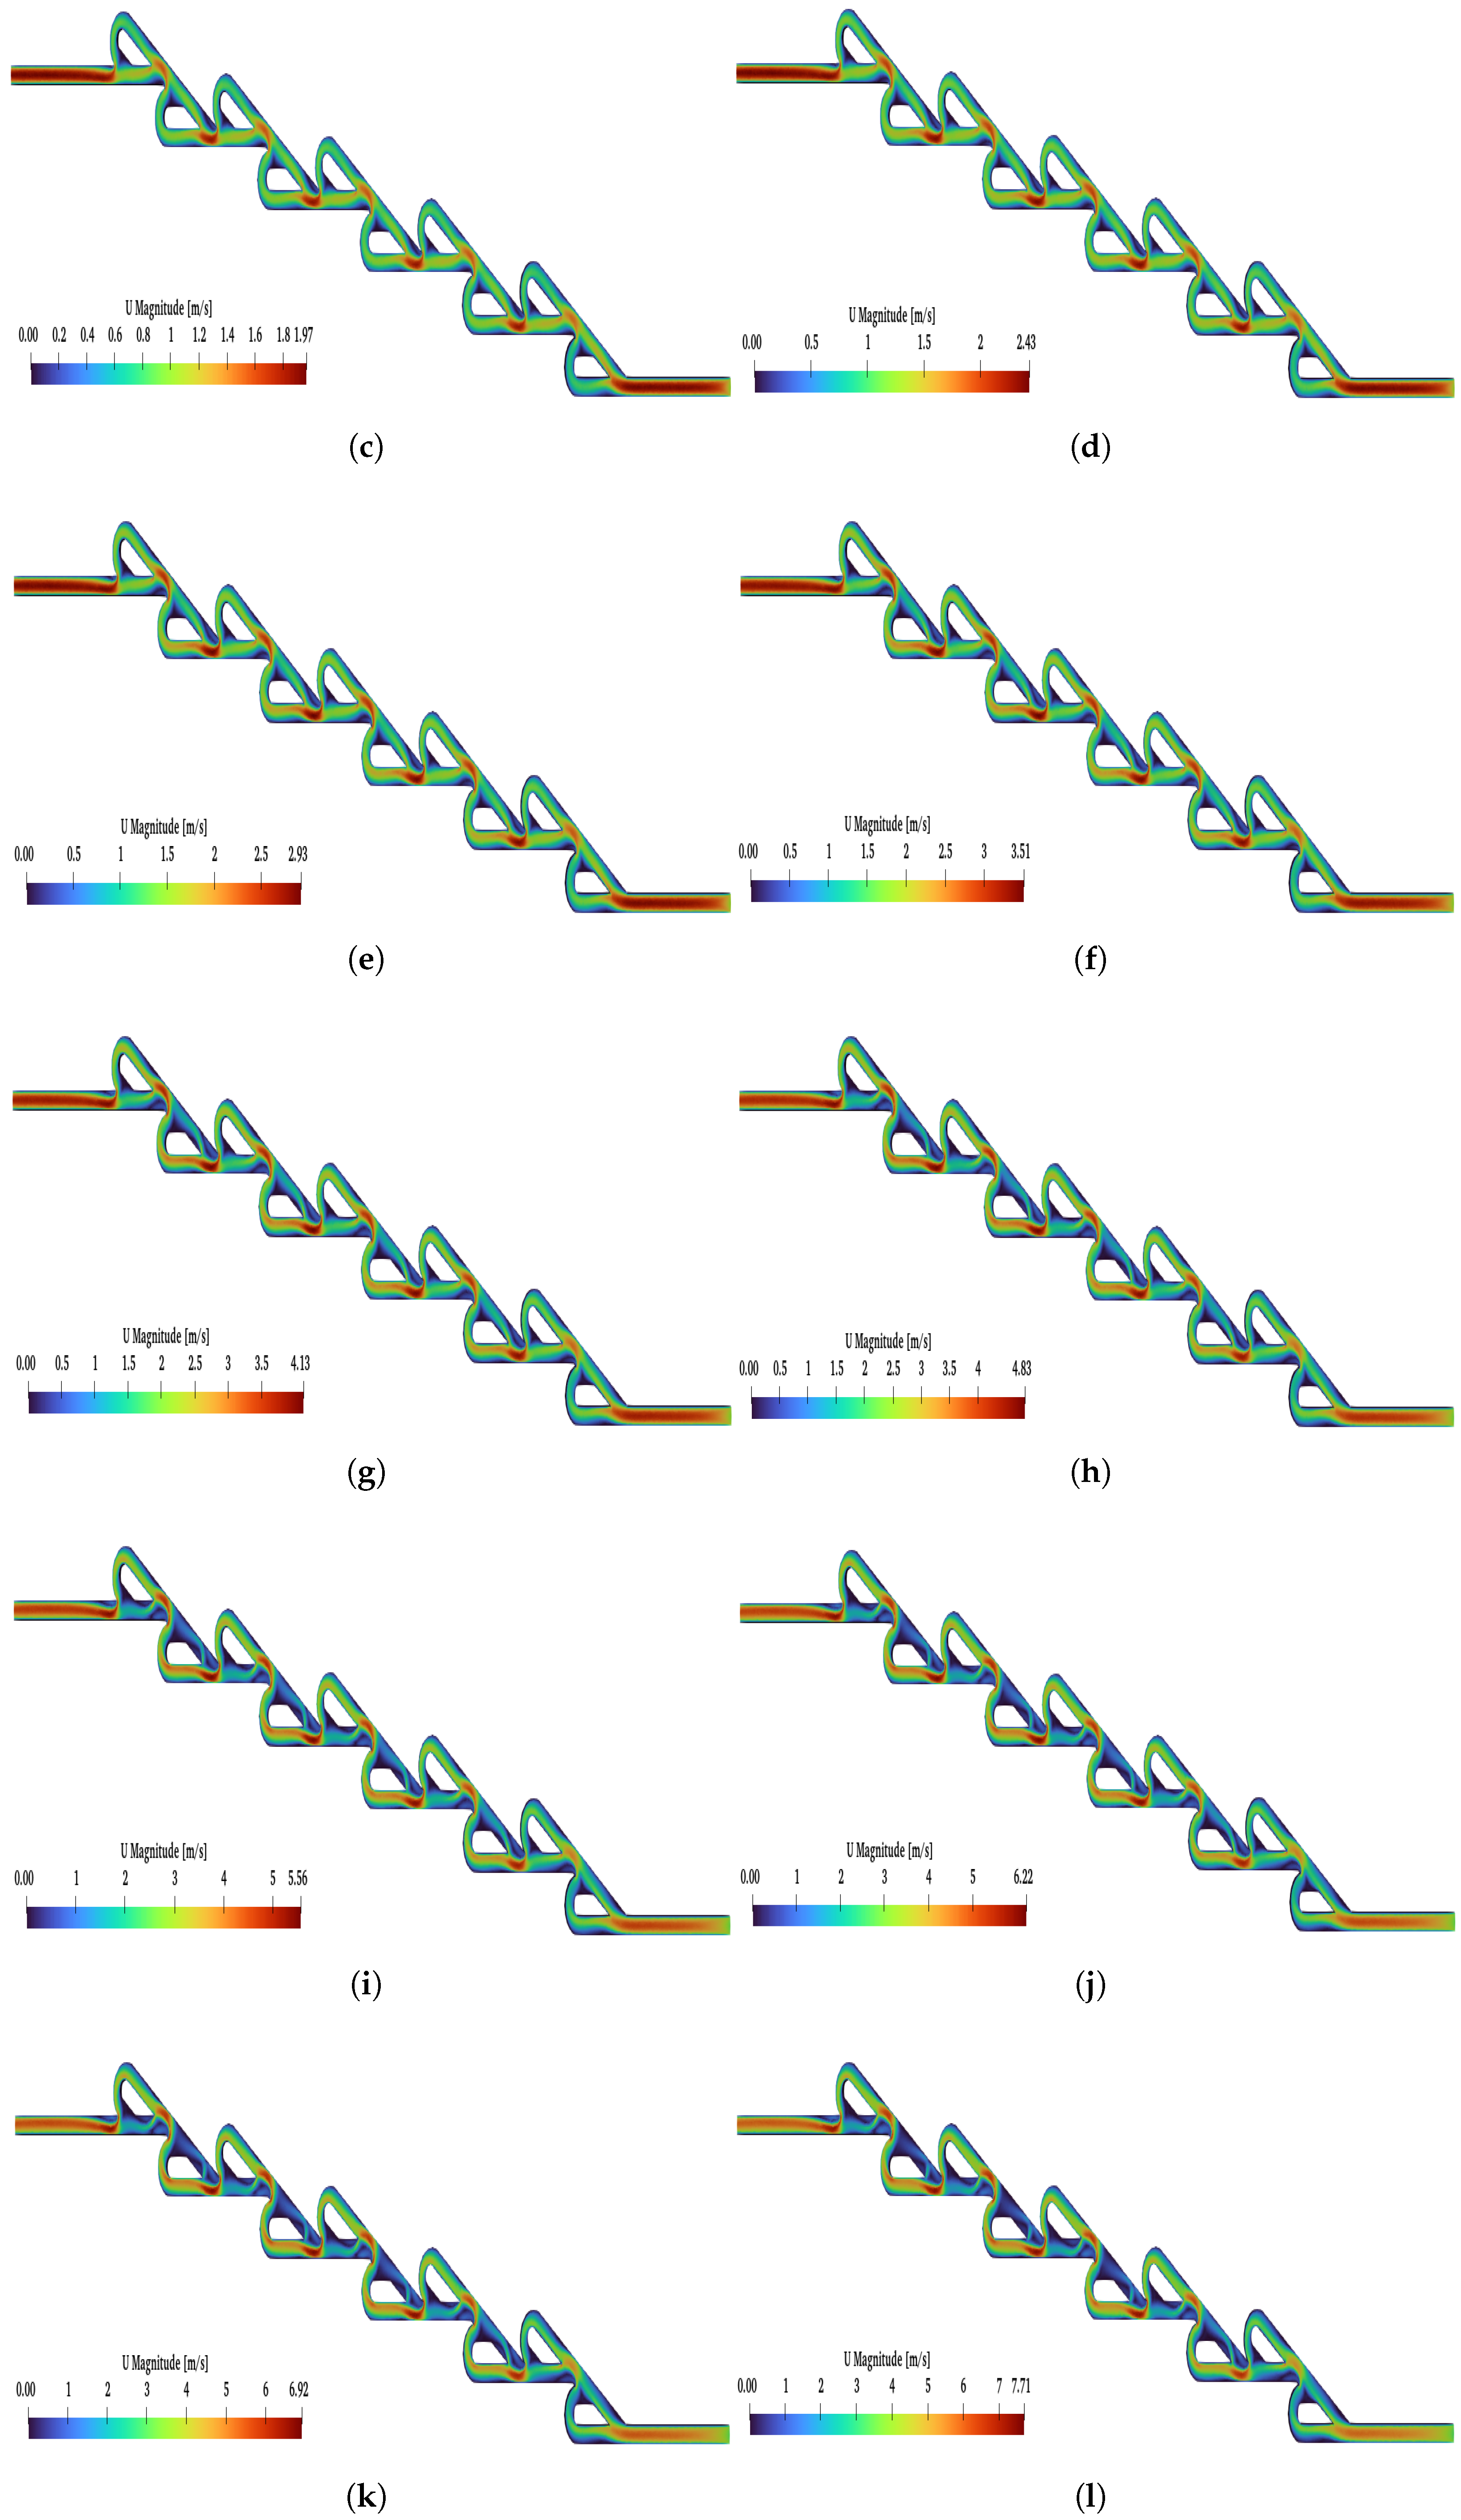
Figure A2 and
Figure A3, the reverse flow is presented under all selected Re numbers for the six- and ten-staged valves, respectively. For the six-staged valve, the critical point is observed for
, while, for the ten-staged valve, the critical point is observed for a lower Re (
). Moreover, for
and
and a reverse flow, as the Re increased, the magnitude of the velocity decreased at the main path, but, for
, this phenomenon was more intense.
The most crucial finding is that, when a reverse flow is applied, regardless of Re (for Re higher than ) and N, only after the second valve does the velocity become the maximum in the loops and minimum at the main path. This is an indicator that the minimum valve number that should be used is more than two.
A direct comparison with previous computational studies reveals important insights into the necessity of three-dimensional simulations for Tesla valve analysis. Mohammadzadeh et al. [
19] performed 2D simulations for Re ranging from 25 to 300 with N = 1, 3, 5, 7 and 10 stages, reporting the maximum diodicity of approximately 2.2 for N = 10 at Re = 300. In contrast, our 3D simulations yielded
for the same configuration (N = 10, Re = 300), representing approximately 13.6% higher diodicity. This discrepancy arises from three-dimensional flow phenomena that 2D simulations cannot capture: (i) secondary flow structures in the square cross-section, (ii) three-dimensional vortex formation and interaction within the loops and (iii) cross-sectional velocity gradients that significantly affect pressure drop calculations at higher Reynolds numbers.
According to relevant research [
18], the selection of Re is very important since, for
, transitional flows may occur. Thus, the simulations included Re from 50 to 200 and
,
,
,
,
and
. In all cases, the diodicity was higher than in the present study, since Thomson achieved
D up to
for
and
. Additionally, it is confirmed in the literature that the diodicity is not proportional to the number of valves, and, as Re increases, the
between
,
and
also increases [
18]. Moreover, as in the present study, the number of valves does not significantly affect
D for low Re [
18].
Other relevant studies [
16] have investigated Re up to 1000. This study achieved maximum diodicity close to three (3) at
. For
, the maximum diodicity dropped to close to 1.8, which is significantly lower compared to the ten-staged valve (
), while it is comparable to the six-staged case (
) under the same Re. Meanwhile, under
,
D was less than 2.4, which is less than in the present study under
.
Another relevant study that performed simulations but also experiments for N = 2, N = 4 and N = 6 and for Re within the range 50–300 achieved slightly higher diodicity compared to the current results [
27]. Additionally, for almost all cases, the experiments achieved higher performance than the simulations.
Finally, it is very difficult to directly compare the values of D with the results obtained in relevant research, since the number of valves and also Re may differ. Although the performance achieved in this study is encouraging, the geometry has not yet been optimized.
5. Conclusions
The purpose of this work was to study the performance of double-, six- and ten-staged micro Tesla valves at various Re. Several findings arise, such as the identification of and the fact that D is not proportional to N. Under higher than , the magnitude of velocity is higher at the loops and lower at the main path after the second Tesla (for the reverse flow) and varies with the number of valves. More specifically, for six-staged valves, it is , while, for ten-staged valves, it is (under the simulated Re increments of this study). This discovery provides designers with specific Re thresholds for optimal performance and explains why diodicity enhancement accelerates beyond certain Re values. Notably, this 3D flow redistribution phenomenon in the reverse flow direction was not observed for the two-stage valve at any Reynolds number, indicating that such a simple geometry cannot generate sufficient inertial deflection to reorganize the backward flow momentum. This phenomenon was not reported in previous 2D studies because it requires capturing three-dimensional vortex structures and their evolution through multiple stages.
Also crucial is the understanding of the dependency of the diodicity on Re. For a low Re (≤75), the stage number has a minimal impact on the diodicity, with all configurations near . At a higher Re (≥300), N has a greater impact on D than before. This insight could be useful in optimizing the flow in various applications where flow control is demanded. These findings also provide microfluidic device designers with quantitative relationships between the Reynolds number, stage configuration and diodicity performance.
Future work will be divided into two main directions: the microscale and the macroscale. At the microscale, further investigation of intermediate Reynolds numbers (transition regime), additional staging configurations and systematic geometry optimization will be pursued. At the macroscale, efforts will focus on scale-up analysis and experimental validation to benchmark numerical predictions. Moreover, incorporating non-Newtonian fluids or pulsatile inflow conditions could further broaden the applicability of the micro Tesla valve, particularly in domains such as naval architecture (e.g., cavitation control, flow rectification in low-Re channels) and bio-microfluidic systems, where unsteady or rheologically complex flows are prevalent. Finally, coupling the micro Tesla valve design with microfabrication constraints and exploring manufacturability guidelines will help to bridge the gap between simulation outcomes and real-world implementation.
