1. Introduction
Adhesive bonding is widely used in microelectronic device assembly and has proven to be a robust and reliable method for integrating semiconductors with encapsulating layers, particularly under mild operating conditions. However, its performance degrades significantly in extreme environments such as space. A notable example is found in space solar cell manufacturing, where this technique bonds materials with substantially mismatched thermomechanical properties. For instance, the commonly used encapsulant ethylene-vinyl acetate copolymer (EVA) exhibits a coefficient of thermal expansion about 35 times greater than that of silicon, while its Young’s modulus is roughly four orders of magnitude lower. When subjected to the extreme temperature variations characteristic of the space environment (approximately −190 °C to 160 °C), this severe property mismatch induces significant stress concentrations at the adhesive interfaces.
This phenomenon has drawn considerable interest from both scientists and engineers. A study by Marlene Knausz et al. [
1] on nine encapsulating materials revealed that three exhibited significant shrinkage prior to expansion during heating. As solar modules endure diurnal and seasonal thermal cycles, the differential thermal expansion among their components generates internal stress [
2,
3], which can lead to various failures such as ruptured cells, delamination of the encapsulant, and cracks at interfaces. Selecting an encapsulation material with the appropriate thermo-mechanical properties is thus an effective strategy for suppressing these failure modes [
2].
To uncover this fracture mechanism, the distribution of thermal stresses within solar panels composed of different materials is our primary concern. Kislyuk developed an analytical method based on tensile testing and validated its correlation with material aging prediction [
4]. Amina Ennemri [
5] systematically examines the impact of microcracks on the electrical performance of silicon solar cells and summarizes the most commonly used techniques for crack detection. Zafar Ullah Khan [
6] critically assesses the performance reliability and degradation of solar PV systems, highlighting the pivotal role of data-driven deep learning and machine learning techniques in analyzing failure mechanisms and advancing predictive maintenance for more accurate financial and technical planning. Khangamlung Kamei [
7] demonstrates that thermo-mechanical loads significantly affect fatigue crack propagation and modal parameters, with heating rate and temperature distribution playing critical roles while revealing fundamental differences between pre-seeded and natural crack behaviors. Felix Haase [
8] study reveals that the orientation of cell interconnect ribbons relative to the bending axis critically influences crack initiation in solar modules, with parallel ribbons reducing bending tolerance by four times compared to perpendicular ones, while the presence of a backsheet reduces crack width by 30%.
A significant body of research has been devoted to interfacial crack problems in composite materials since the 1960s, aimed at understanding their fundamental mechanics [
9]. Herrmann et al. [
10] employs the finite element method and a crack propagation criterion based on energy release rate to systematically analyze the nucleation and propagation behavior of thermally induced cracks in dual-phase composite materials. Several researchers, including Tsamasphyros and Theocaris [
11], Chen [
12], Suo [
13], and Linkov [
14], have investigated crack problems in perfectly bonded bi-materials under mechanical loading. In the work of Petrova and Herrmann [
15], based on the expression of complex potential, a solution to the internal crack system and interface crack problem is constructed. However, the dissimilar properties is seldom considered in the previous analytical works and the derivations are unfriendly to engineers.
To analyze thermal stress in laminated solar cells under thermal loads, this paper proposes a simplified analytical model capable of predicting stress distributions, with validation based on the Hilbert–Riemann theoretical solution for interfacial cracks. This study is also an extension of the previous article of our group [
16]. Some discussions of thermal stress and interfacial failure in solar laminates are presented. The study is structured as follows: Following a brief introduction in
Section 1, a simplified model of a representative bi-layer structure with highly dissimilar thermal properties is developed in
Section 2. This analytical model is then validated in
Section 3 through finite element analysis (FEA). Furthermore, the influence of various material parameters is examined in
Section 4. Finally, conclusions and remarks are provided in
Section 5.
3. Simulation Analyses
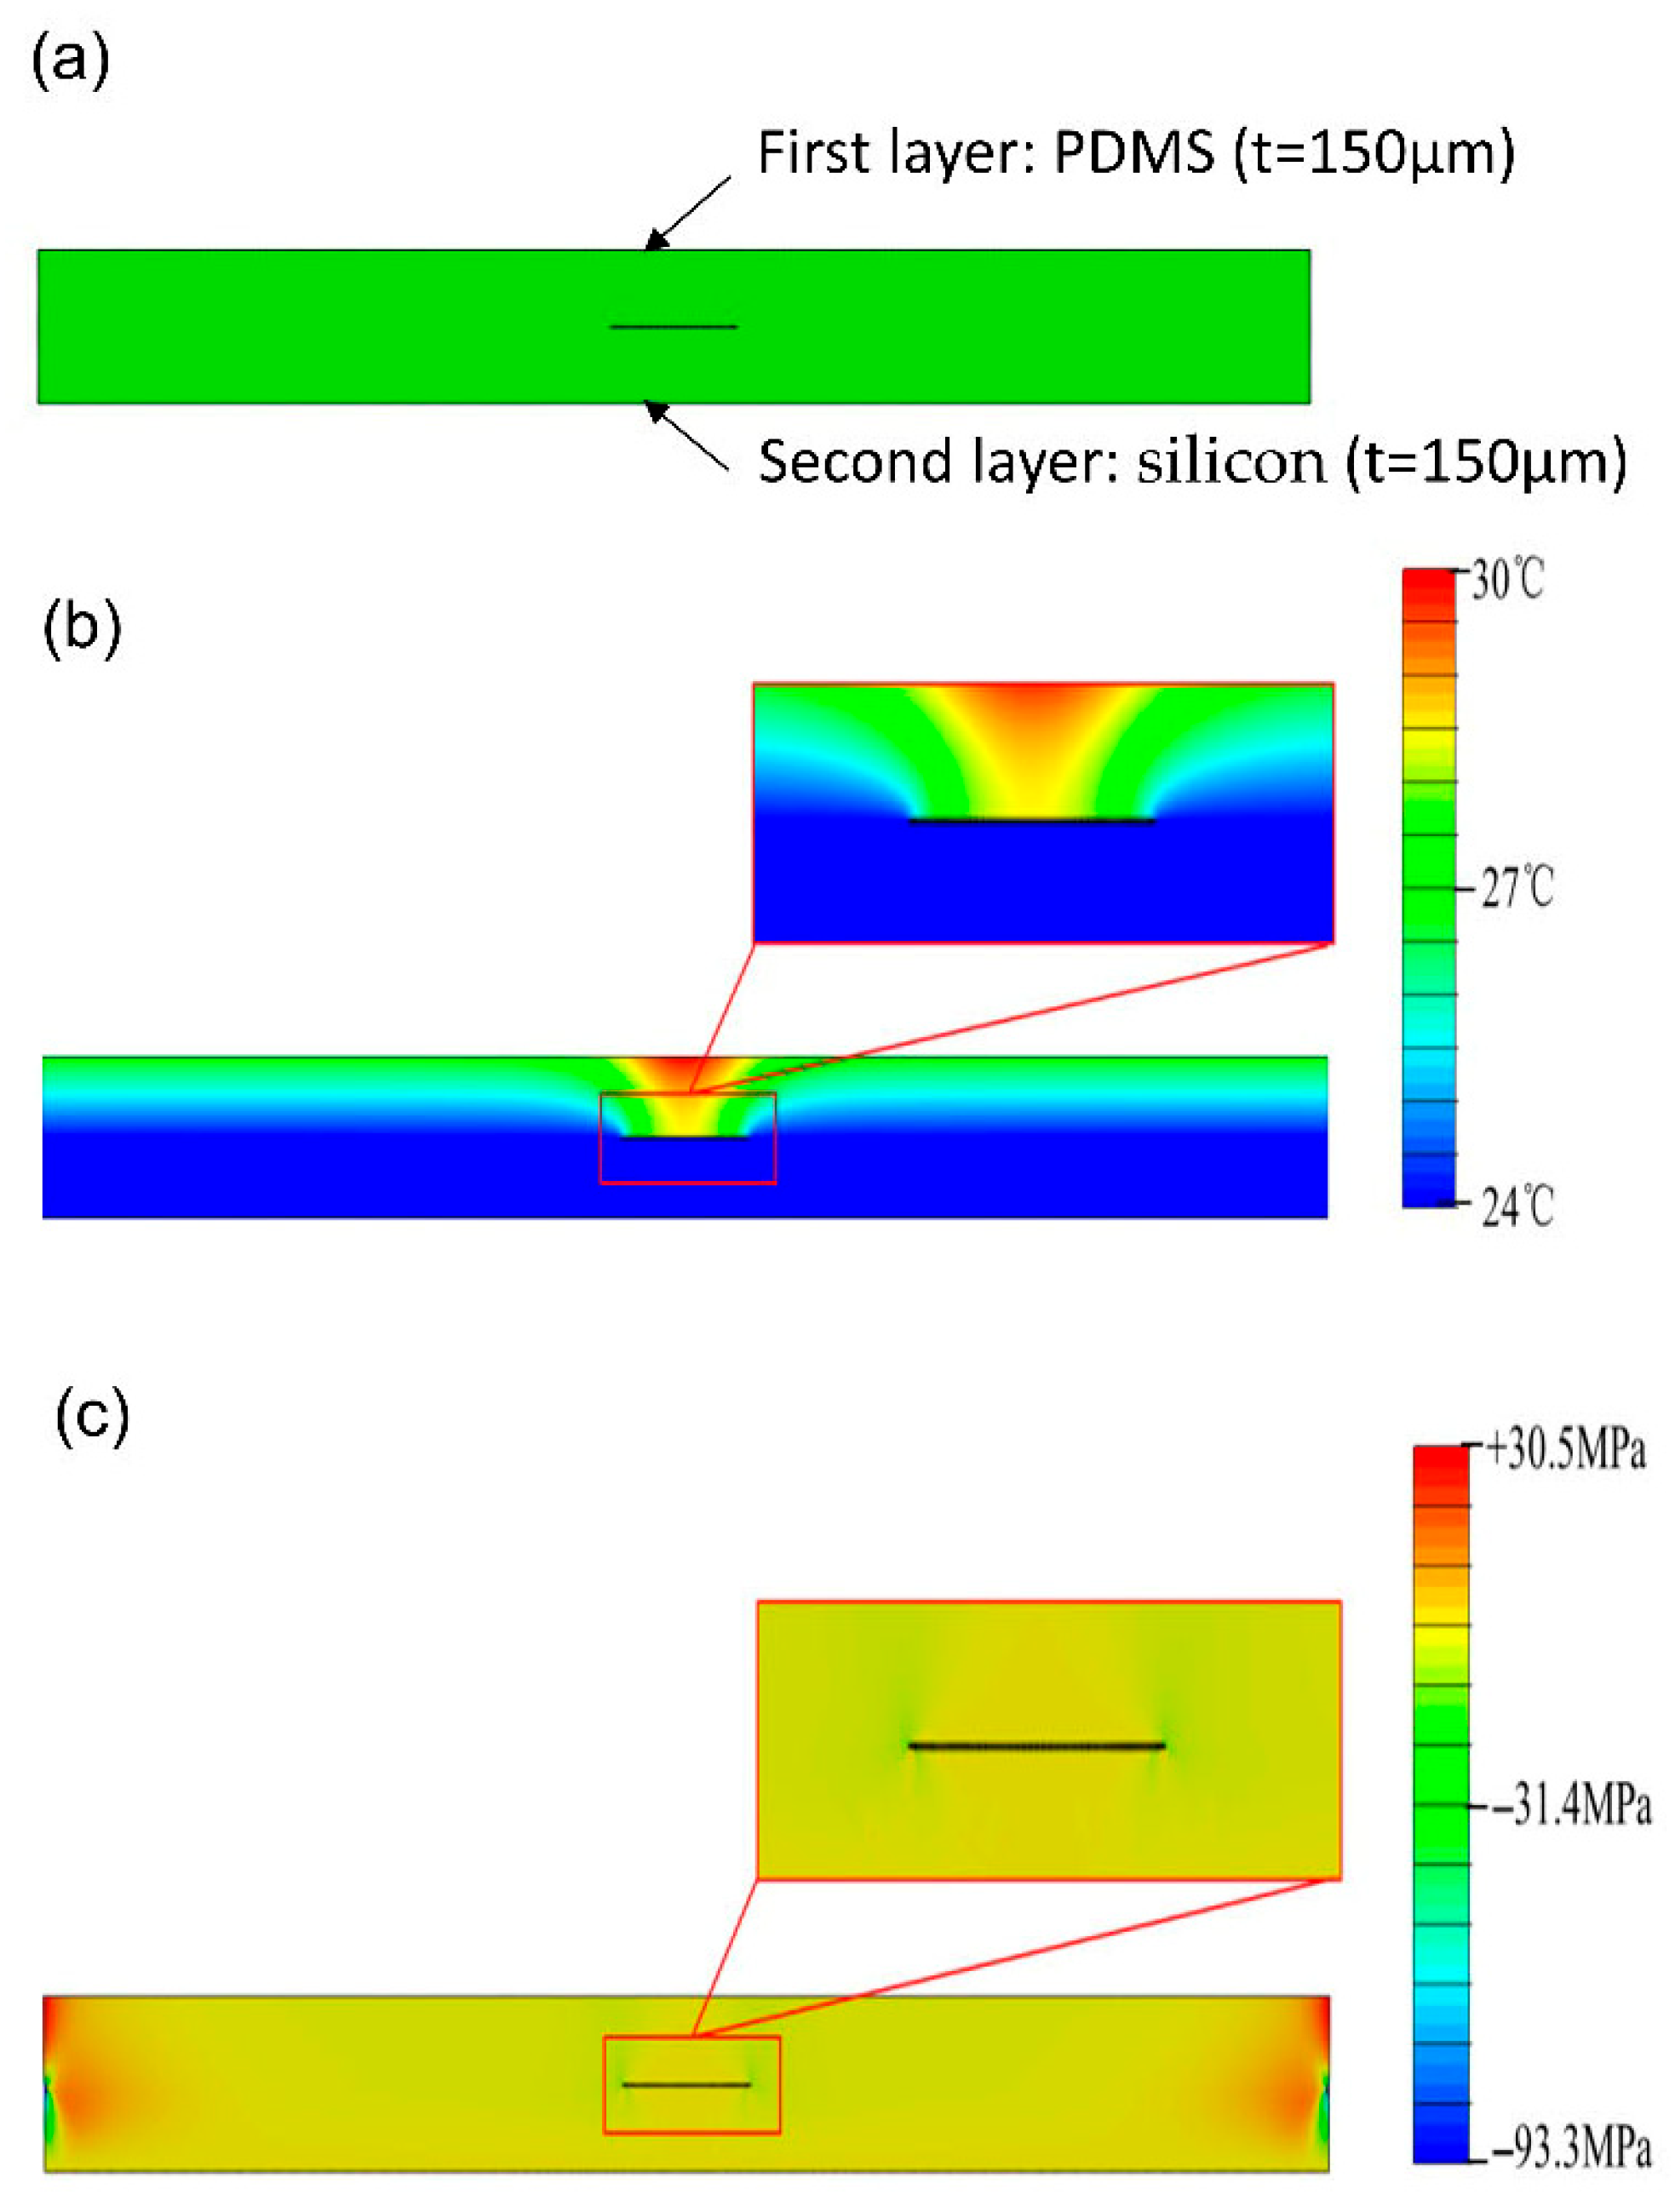
A representative FE model was established in ABAQUS using two-dimensional four-node linear quadrilateral elements. The model represents a bi-layer structure of uniform dimensions, featuring a 300 μm interfacial crack—substantially smaller than the 3 mm plate length—with a thickness-to-crack ratio exceeding 10. The steady-state heat transfer and ensuing thermal stresses were computed using dedicated analysis procedures. Furthermore, mesh sensitivity was rigorously assessed to confirm the result accuracy.
The validity of the finite element model presented in
Figure 2a was verified against the theoretical solution using a PDMS/silicon bi-layer structure as an example. In this model, the upper layer is PDMS with a thermal expansion coefficient of 2.15 × 10
−4/°C and a thermal conductivity of 0.21 W/(m·°C) while the lower layer is silicon with corresponding values of 6 × 10
−6/°C and 148 W/(m·°C), respectively. The thickness of both layers is 150 μm. A uniform heat flux of 0.05 W/m
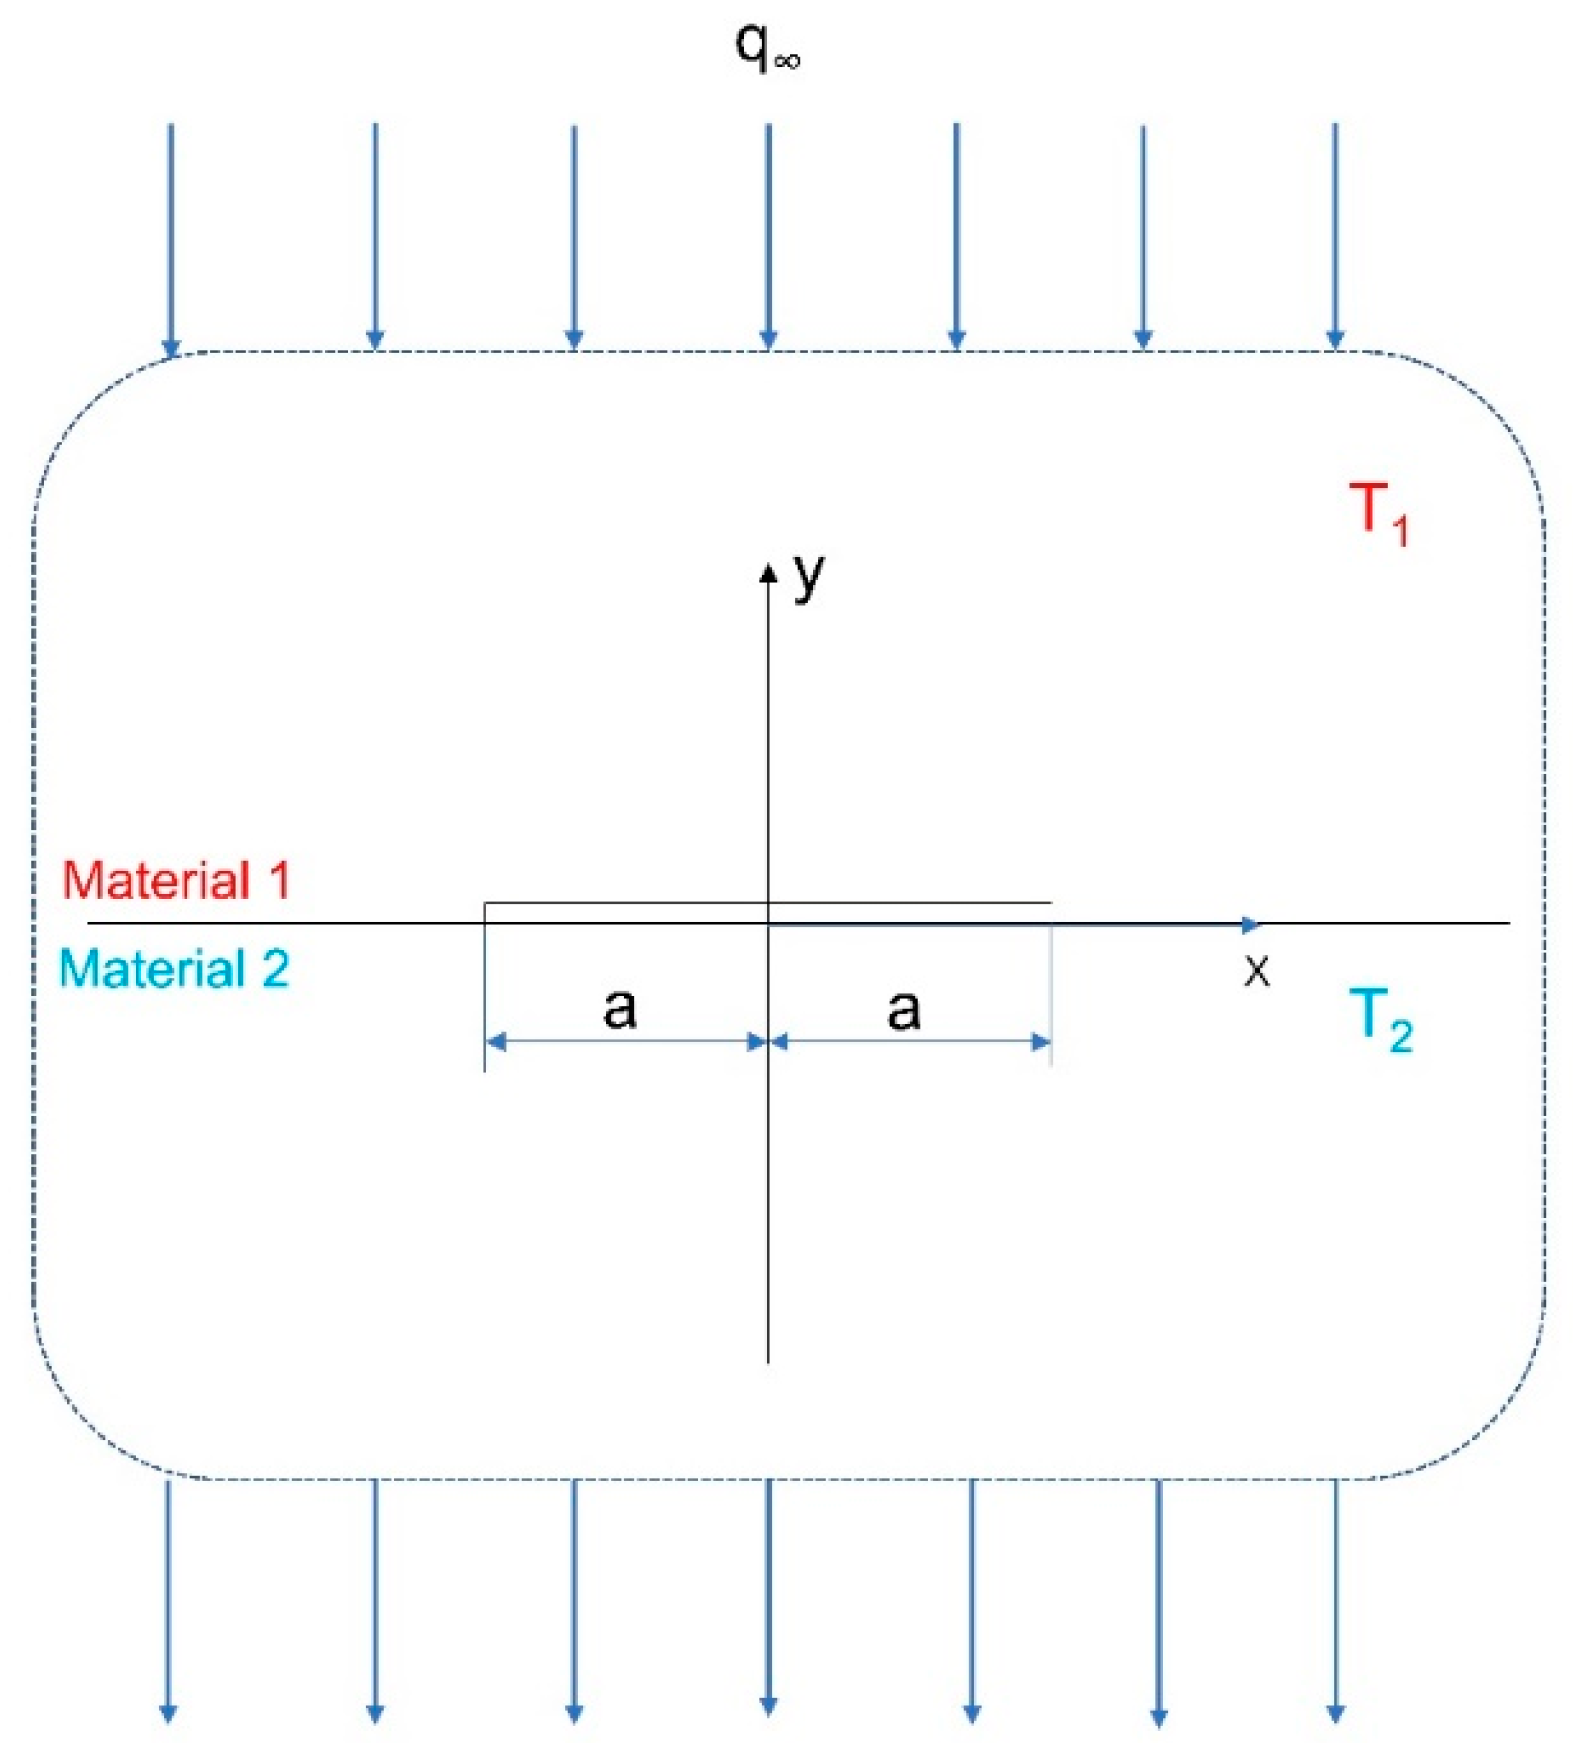
2 was applied to the top surface. An axisymmetric model was employed for simplicity, with the coordinate origin set at the crack center and the crack tips located at
x = ±
a0. The resulting temperature and normal stress fields are shown in
Figure 2b and
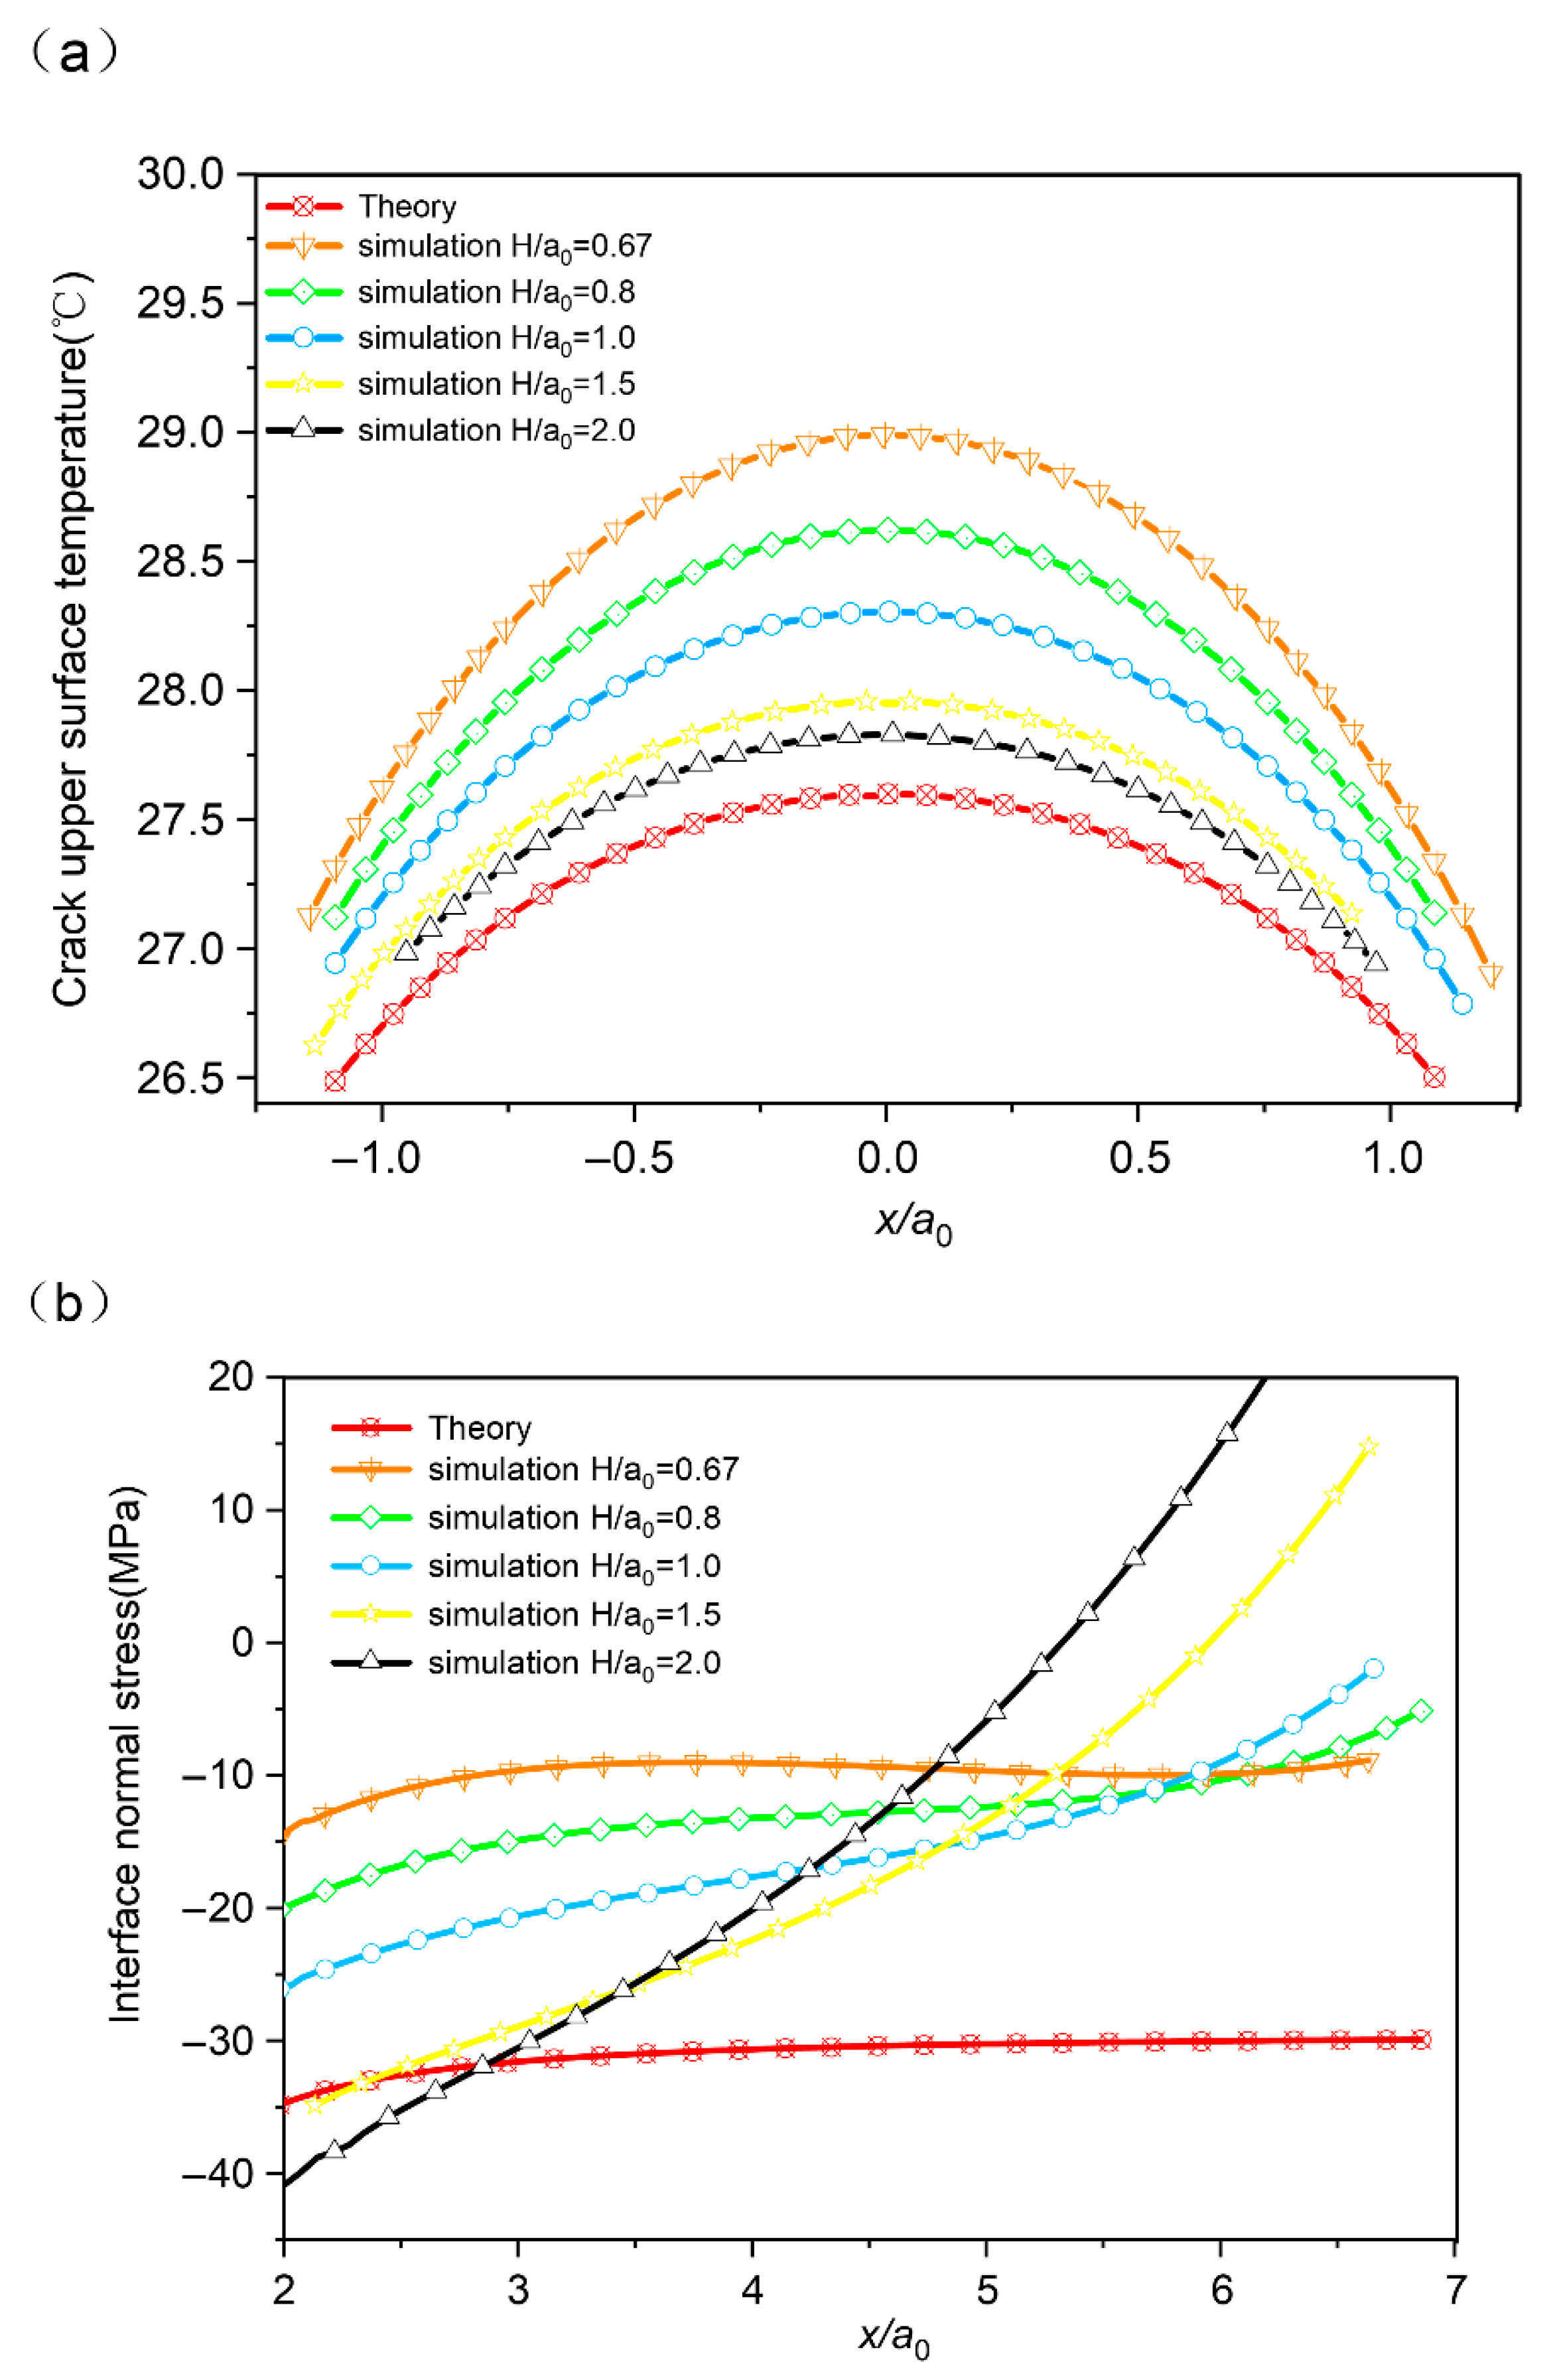
Figure 2c, respectively. A direct comparison between the theoretical and FEA results is provided in
Figure 3, demonstrating good agreement.
Leveraging the theoretical results of
Section 2, we analyze the temperature fields for different dimensionless ratios of crack width to length (
H/
a0) and distance from the crack tip as
x/
a0, respectively.
Figure 3a reveals a monotonic convergence of the upper-crack-surface temperature profiles toward the theoretical curve with an increasing value of
H/
a0, indicating that the thermal field evolves toward the semi-infinite plane solution. It can be foreseen that when the thickness–length ratio is big enough, the temperature distribution along the upper surface of the crack will be completely consistent with the theoretical curve. For
H/
a0 bigger than 0.8, the simulation results closely match the predictions of the theoretical model. Furthermore, the model’s validity is supported by its consistency with realistic operational conditions.
The interfacial stress field is analyzed to further validate the analytical model. Due to the stress singularity at the crack tip and the influence of far-field boundaries, the analysis is confined to the normalized distance interval
x/
a0 ∈ [
2,
7].
Figure 3b shows that within this range, the theoretical interfacial normal stress remains largely stable overall but displays a slight upward trend as
x/
a0 increases. In simulations, the variation in such curves is complicated. When
H/
a0 is 0.67, as the
x/
a0 increases, the interfacial normal stress undergoes an initial dip, a gradual recovery, and a subsequent decline. But once the value of
H/
a0 is greater than 0.67, the absolute value of the normal stress decreases as
x/
a0 increases. When the
H/
a0 ratio exceeds 1.5, the absolute value of the normal stress first decreases and then increases as
x/
a0 increases. In addition, the larger the value of
H/
a0 is, the steeper these curves are. Compared with the FEA model, for the range of 0.8 to 1.0 (the neighbor of the crack tip), the analytical model can predict the change trend of interface normal stress with acceptable accuracy. To our surprise, the simulation results are always inconsistent with the theory under the condition that the value of
x/
a0 is large than 1.0 (i.e., the point close to infinity). Reexamining the boundary condition in the theoretical model, we identified that the stress boundaries at the infinity point on the interface are ignored (assuming to be zero). However, the huge difference in thermal expansion of bi-material leads to the inevitable stress at the terminal point on the interface. However, within the appropriate scope, this does not affect the overall trend.
4. Material Parameter Analyses
To evaluate interfacial failures caused by large CTE mismatches in solar cell modules, we examined the thermal properties of common encapsulants and solar cells. The analysis employs a bi-layer model with both the upper encapsulant film and the lower solar cell set to a uniform thickness of 150 μm. The model is subjected to a uniform heat flux of 0.05 W/m
2 on its top surface, and the relevant material properties are provided in
Table 1 (the parameters in
Table 1 are referenced from [
1,
2,
3,
4]).
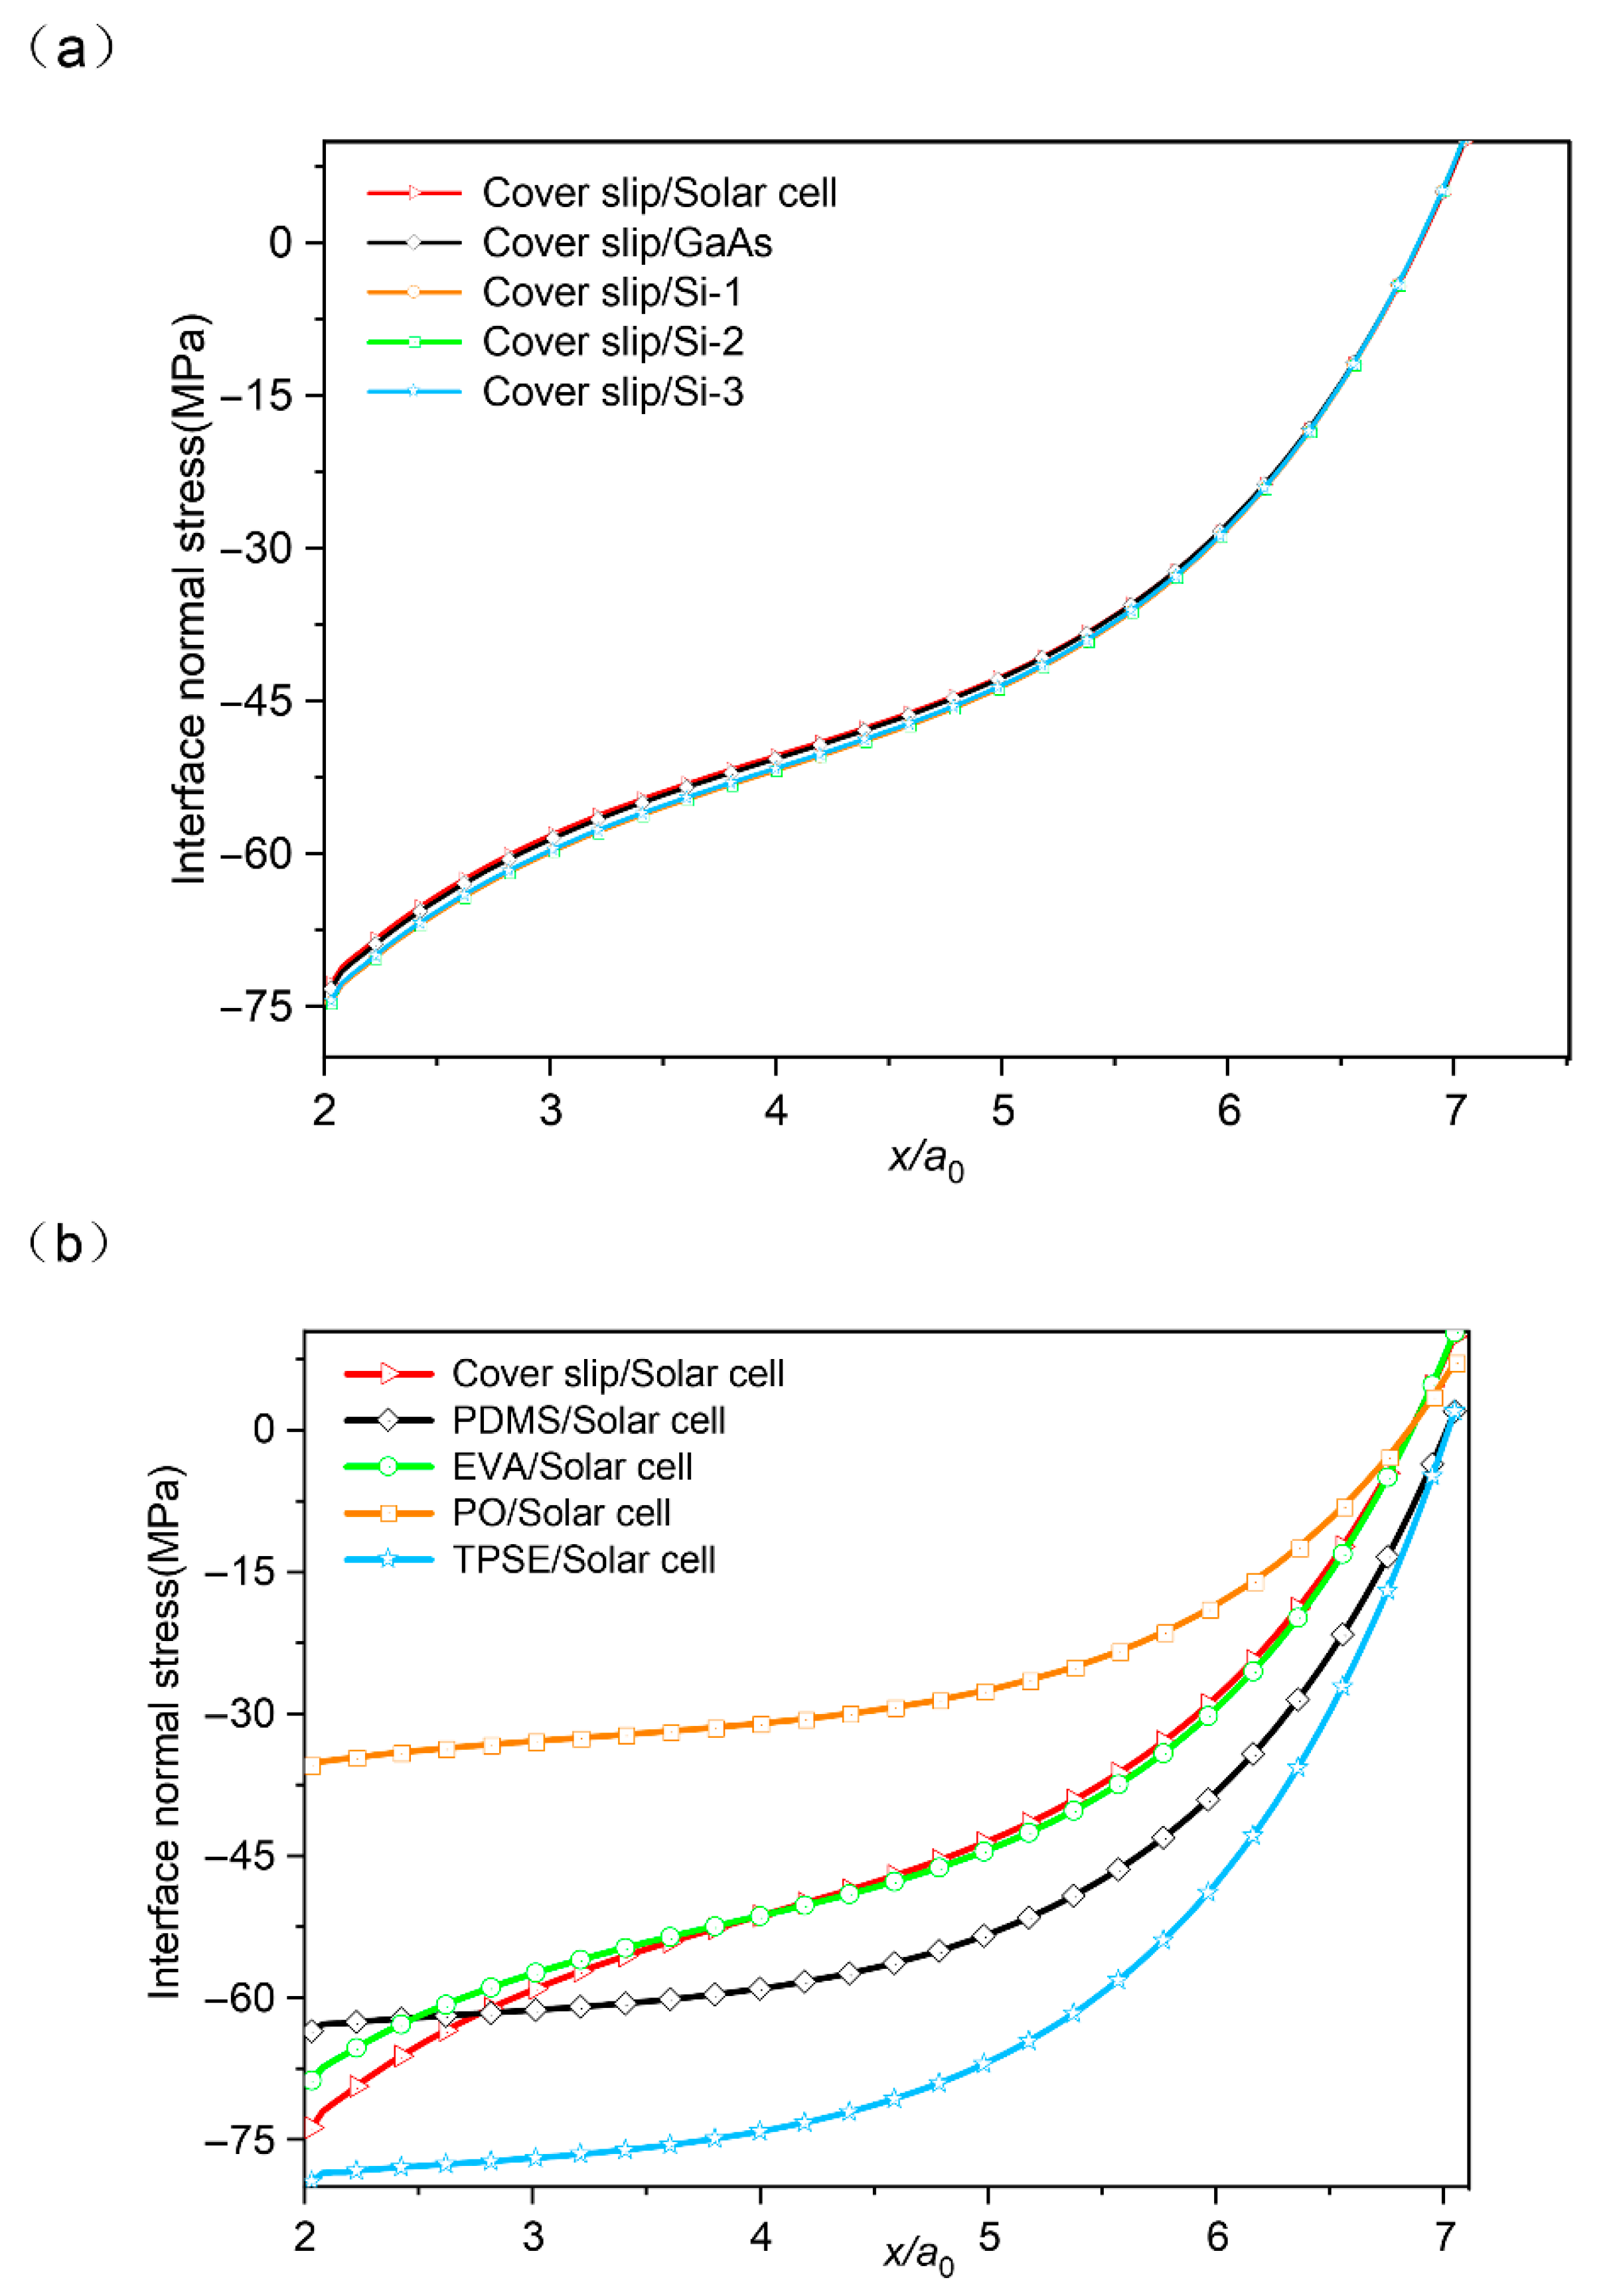
Figure 4a presents the distribution of interfacial normal stress as a function of the normalized distance
x/
a0. A stress concentration trend similar to that observed in the previous section is evident. The results indicate that the interfacial normal stresses remain largely unaffected by the type of solar cell, suggesting that minor variations in the thermal expansion coefficient of the stiff layer exert negligible influence compared to the overall material mismatch.
As illustrated in
Figure 4b, while the stress concentration follows a consistent trend, the influence of different encapsulant materials on the interfacial normal stress varies significantly. Among the five commonly used encapsulant films paired with solar cells, the Thermoplastic Elastomer (TPSE)/solar cell combination exhibits the highest maximum interfacial normal stress, whereas the Polyolefins (PO)/solar cell pair shows the lowest, with values of −79.44 MPa and −35.37 MPa, respectively. Among these five material sets, the EVA/solar cell combination behaves very similarly to the Cover slip/solar cell pair, which is widely used in practical manufacturing. The remaining three groups display a distinct pattern. Given that the primary differentiating parameter among these encapsulants is their coefficient of thermal expansion (CTE), it can be inferred that the CTE is a key factor governing the severity of interfacial stress concentration.
Analysis of the five sets of curves reveals that the relationship between interfacial normal stress and the thermal expansion coefficient is more complex than a simple positive or negative correlation. For instance, among PO, EVA, and Cover slip, a smaller thermal expansion coefficient corresponds to a larger maximum interfacial normal stress. However, PDMS has a smaller thermal expansion coefficient than EVA, yet its maximum interfacial normal stress remains lower than that of PO. A similar inconsistency is observed for TPSE. These results suggest the presence of additional influencing factors. The materials considered in this study are constrained by practical engineering requirements, which preclude a strictly controlled-variable experimental design. Therefore, while the focus has been placed on thermal expansion properties, the role of elastic modulus may have been overlooked.
To better decouple the individual and combined effects of these two parameters, the following analysis focuses on the location along
x/
a0 where the interfacial normal stress reaches zero, referred to here as the “stress critical point”. For this purpose, we assume an ideal encapsulating material whose properties can be independently adjusted.
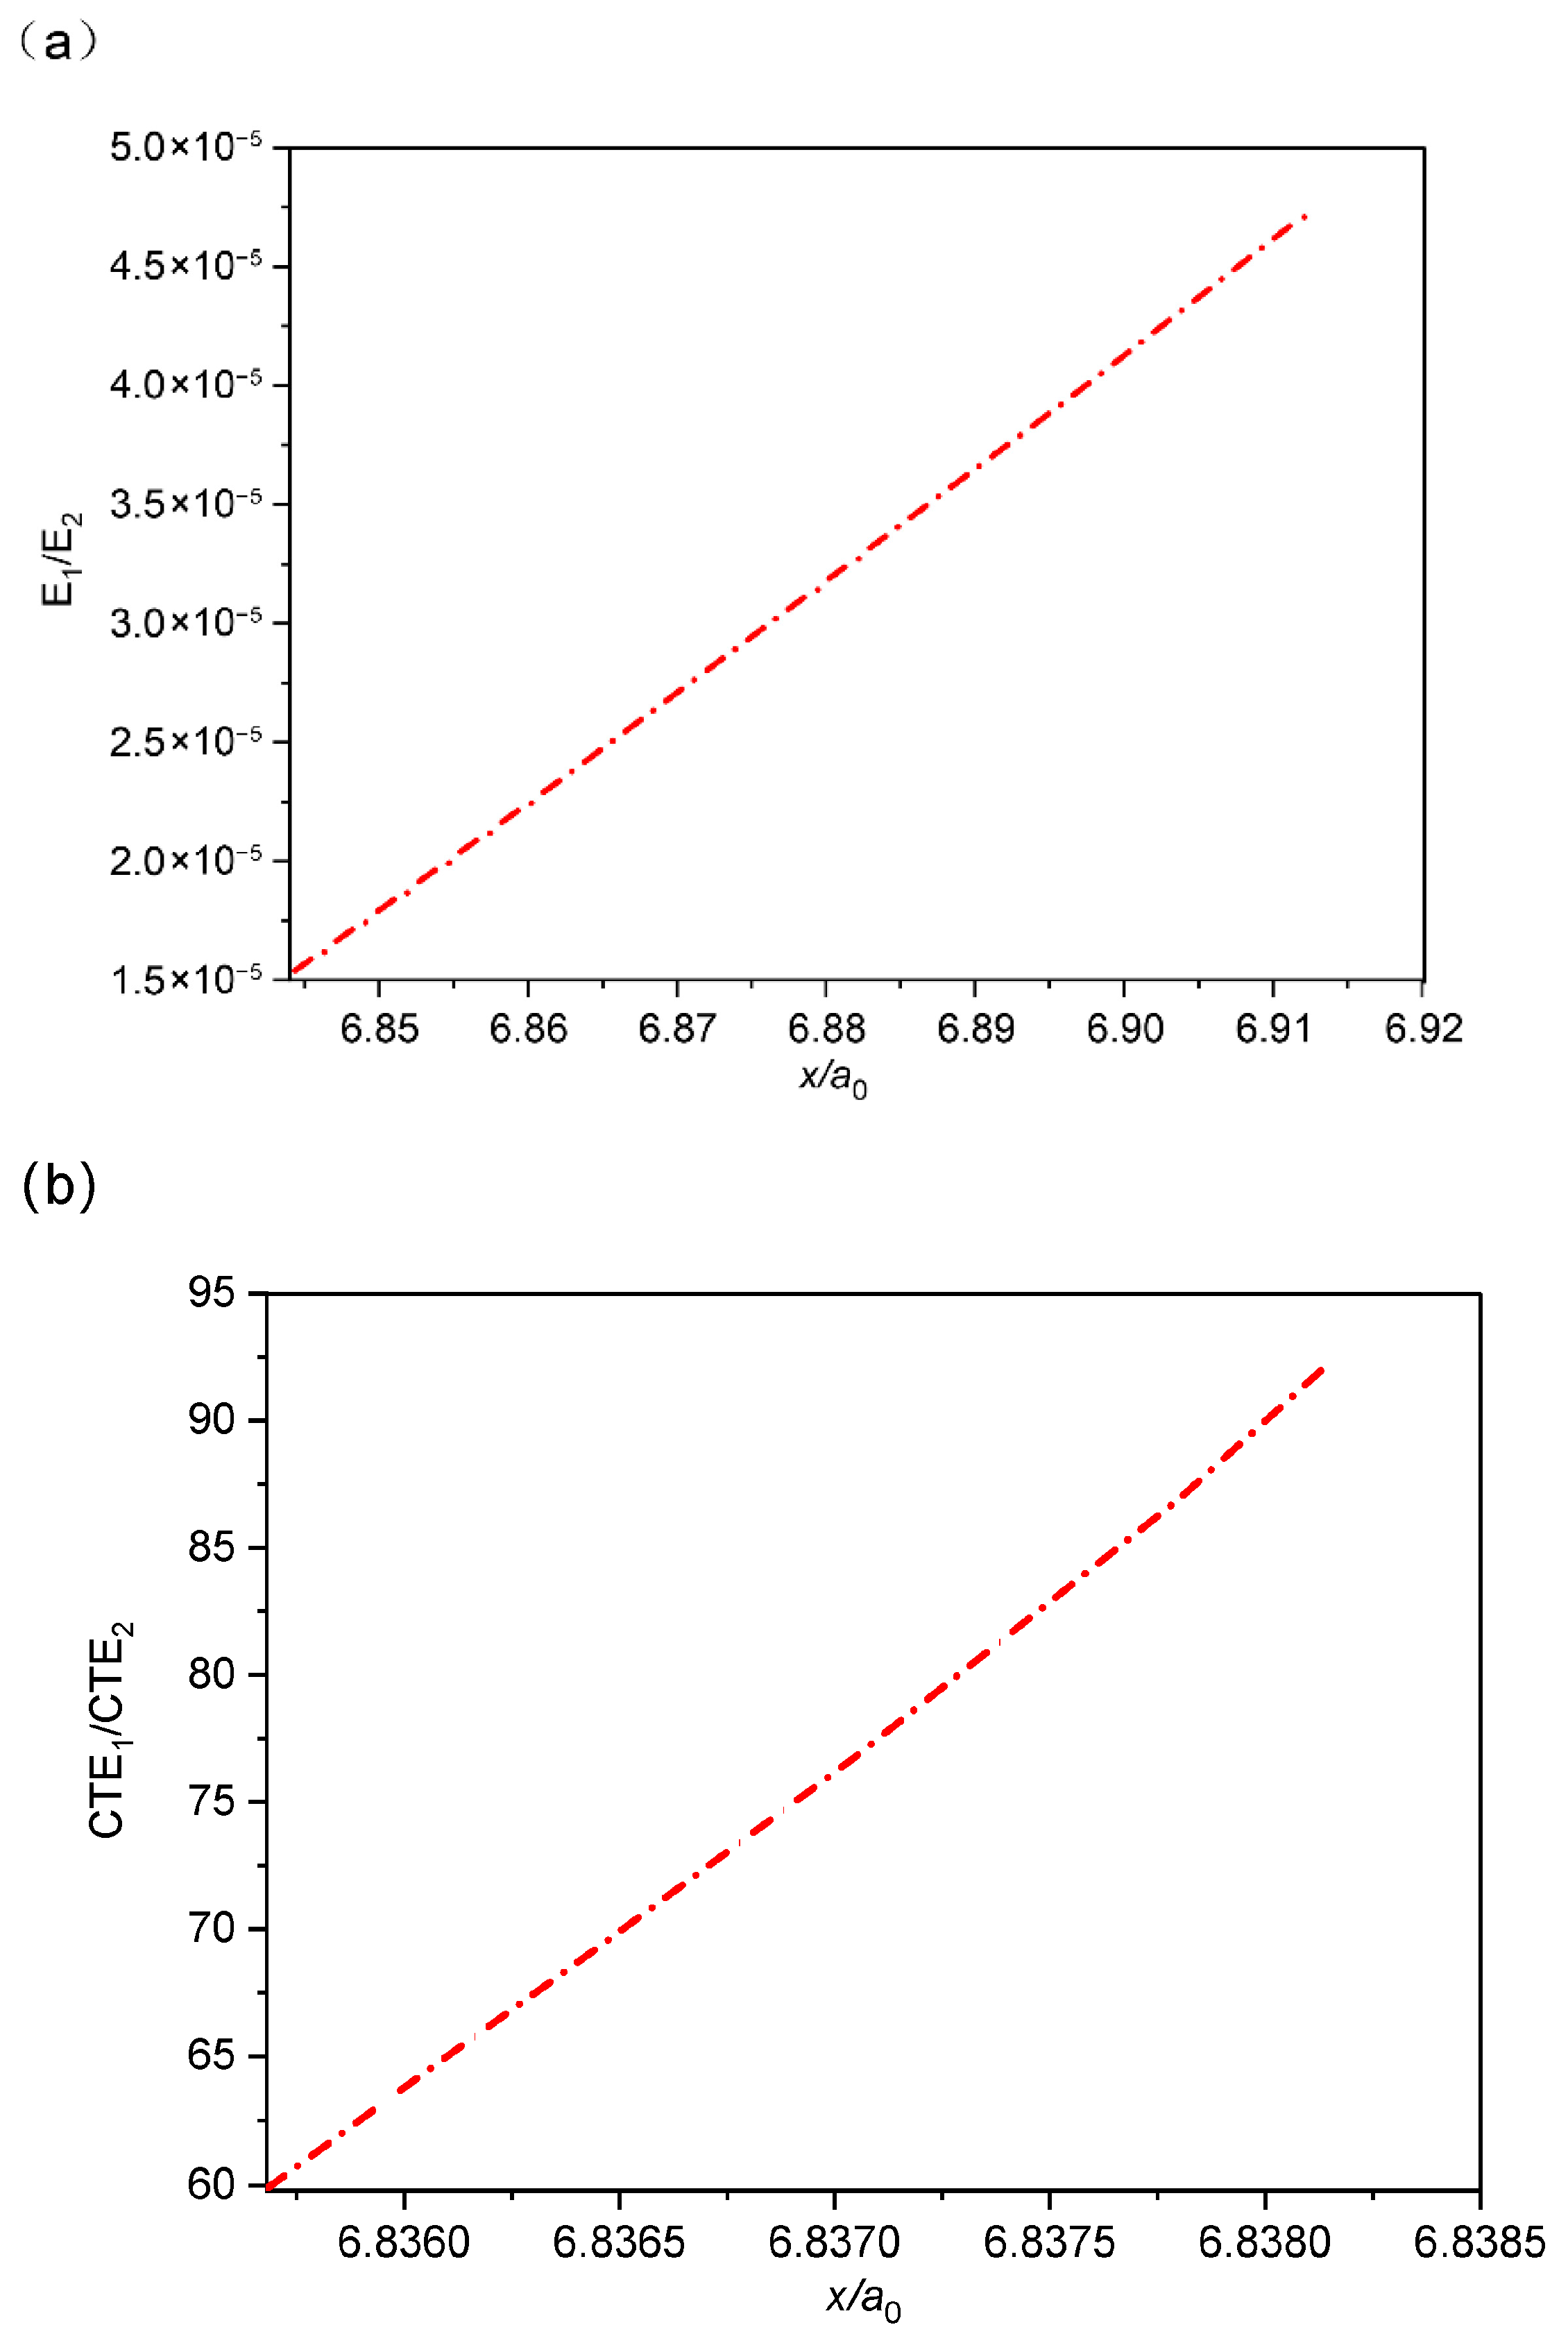
Figure 5 illustrates the relationship between the maximum stress and the ratio of thermal expansion coefficients (or elastic moduli). The results indicate that when
E1/
E2 is held constant, the stress critical point increases linearly with
CTE1/
CTE2. Similarly, when
CTE1/
CTE2 is fixed,
E1/
E2 also shows a linear positive correlation with the critical stress point.
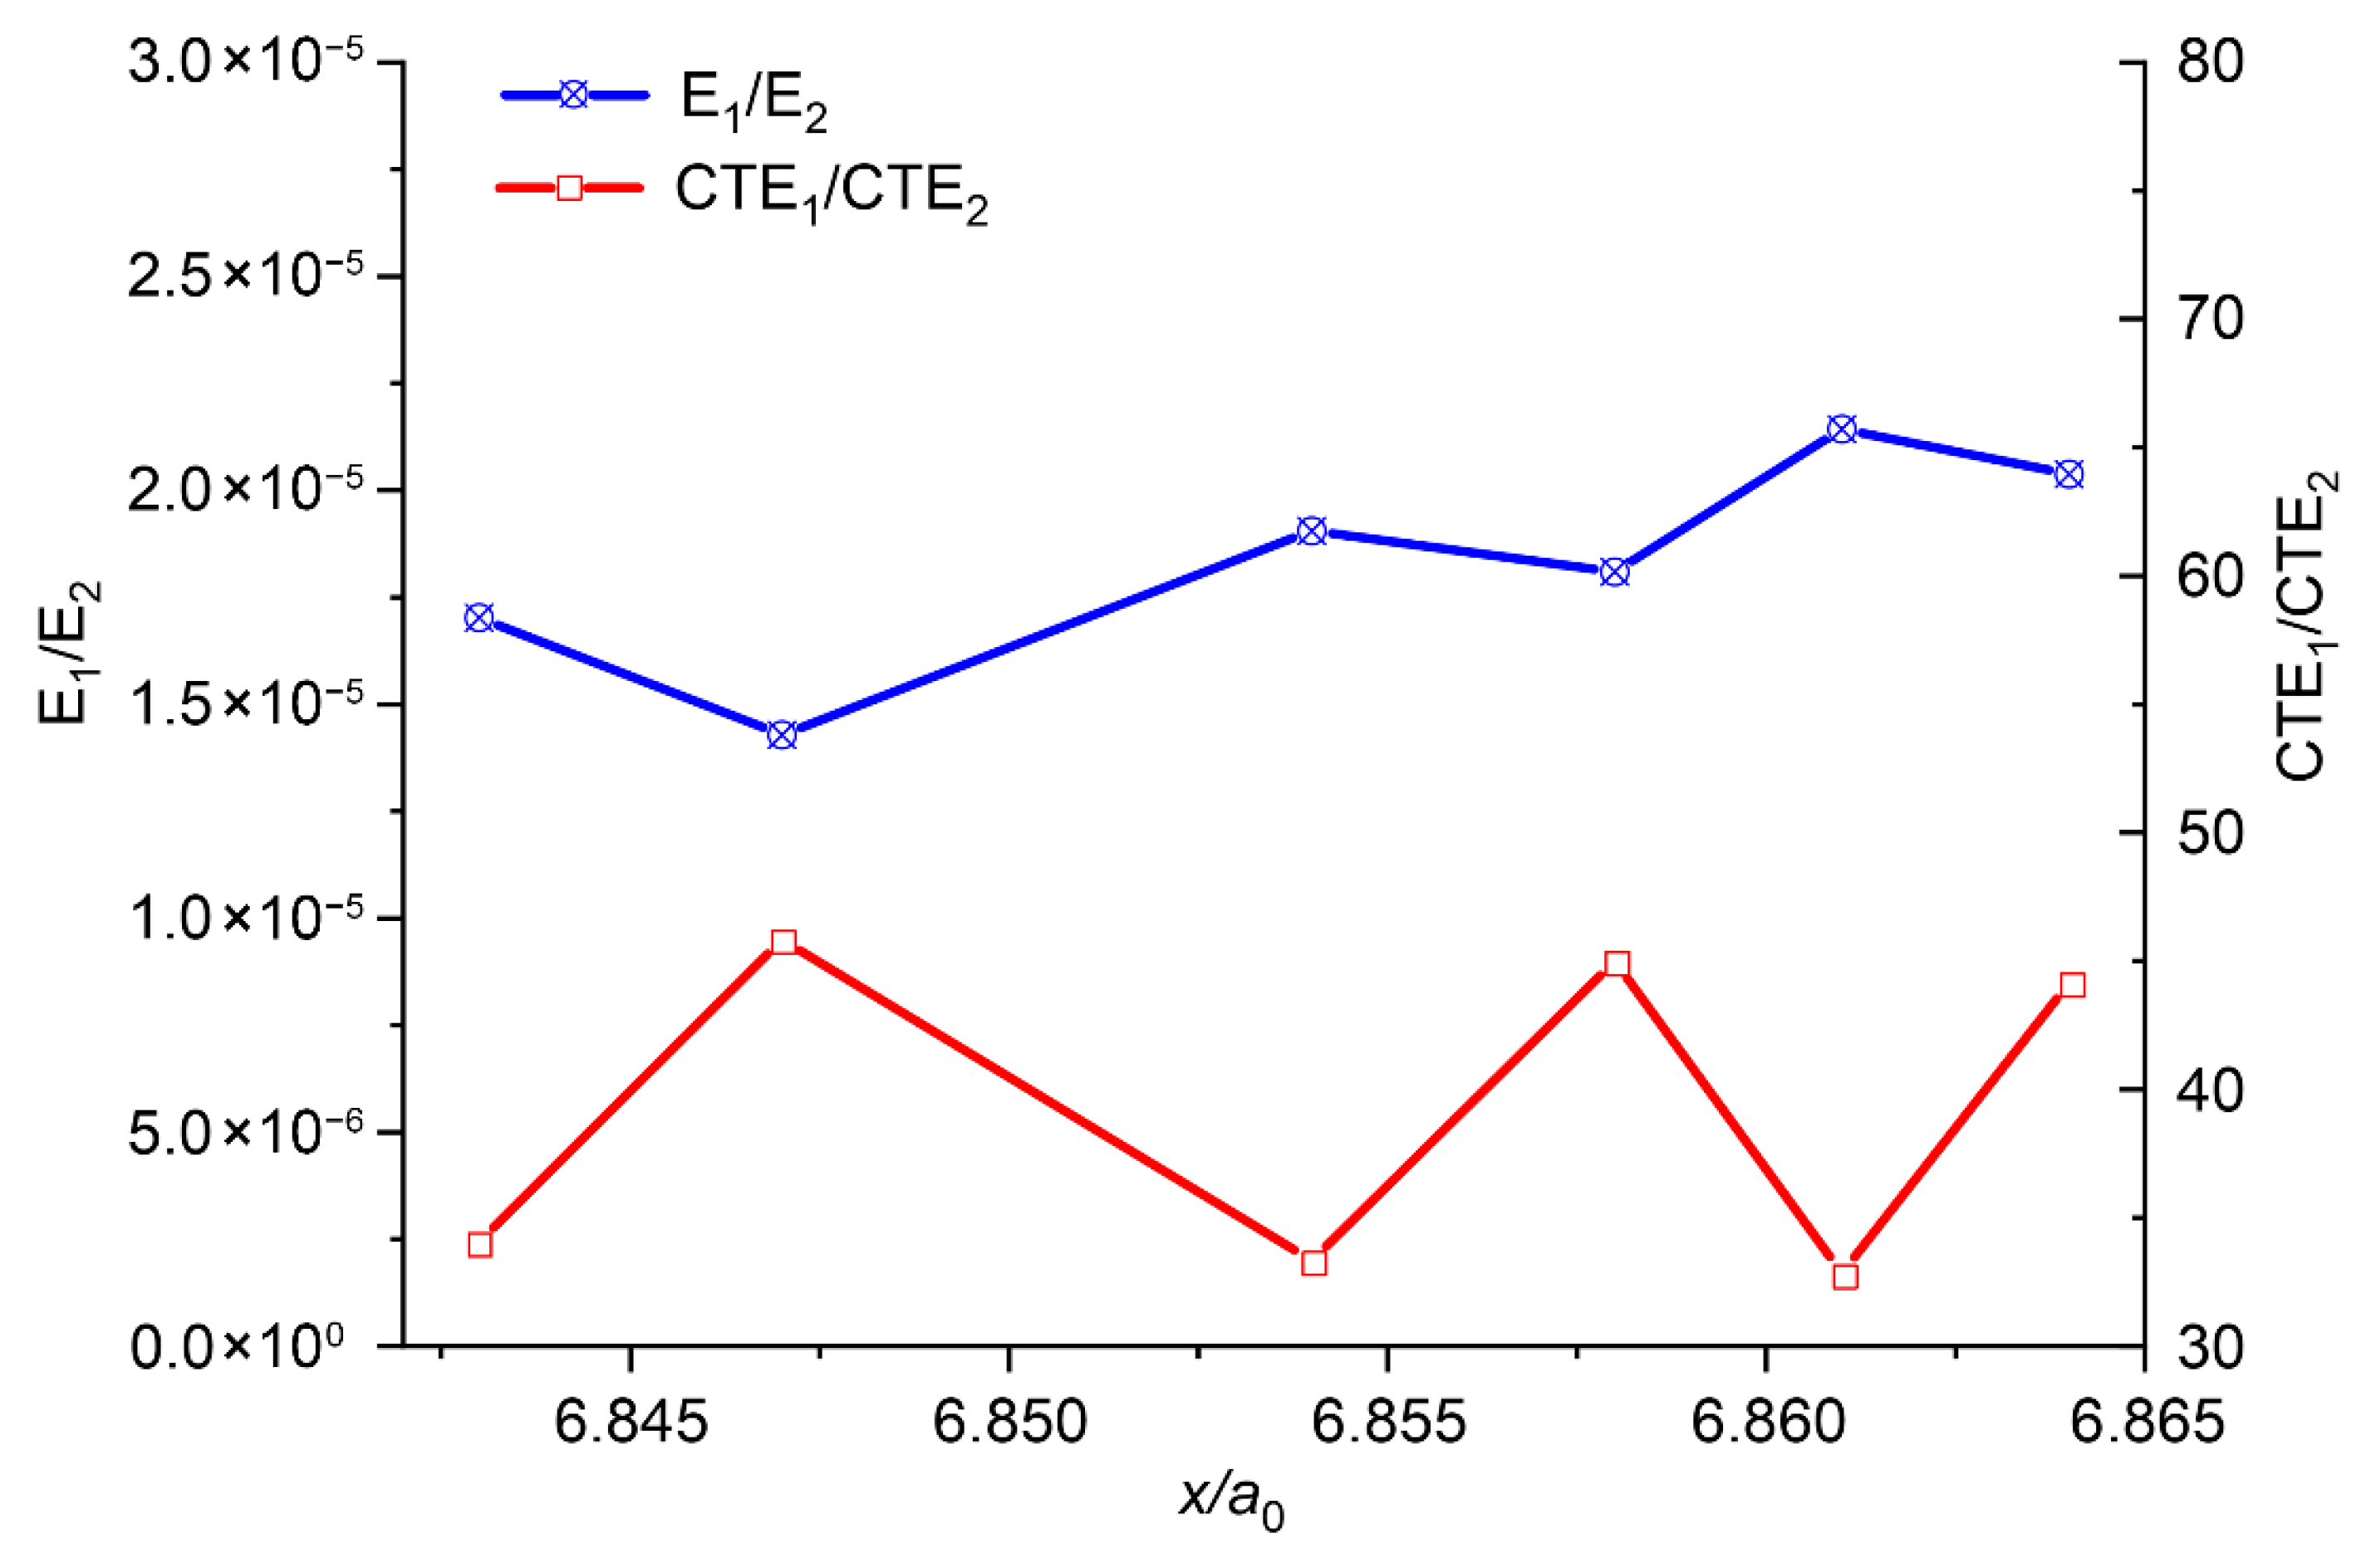
Based on practical engineering considerations, several realistic combinations of semiconductor and encapsulation layers were selected. Their elastic modulus and CTE ratios are presented in dimensionless form in
Figure 6. Overall, the critical stress point exhibits a positive correlation with the elastic modulus ratio and a negative correlation with the CTE ratio. According to this trend, the critical stress point at
x/
a0 = 6.858 should be smaller than that at
x/
a0 = 6.843. However, the observed result contradicts this expectation. This discrepancy can be attributed to the fact that in real material combinations, the variation in
CTE1/
CTE2 typically remains within one order of magnitude, whereas the modulus ratio (
E1/
E2) can span several orders of magnitude. Consequently, the influence of the elastic modulus ratio tends to dominate in practical engineering scenarios.
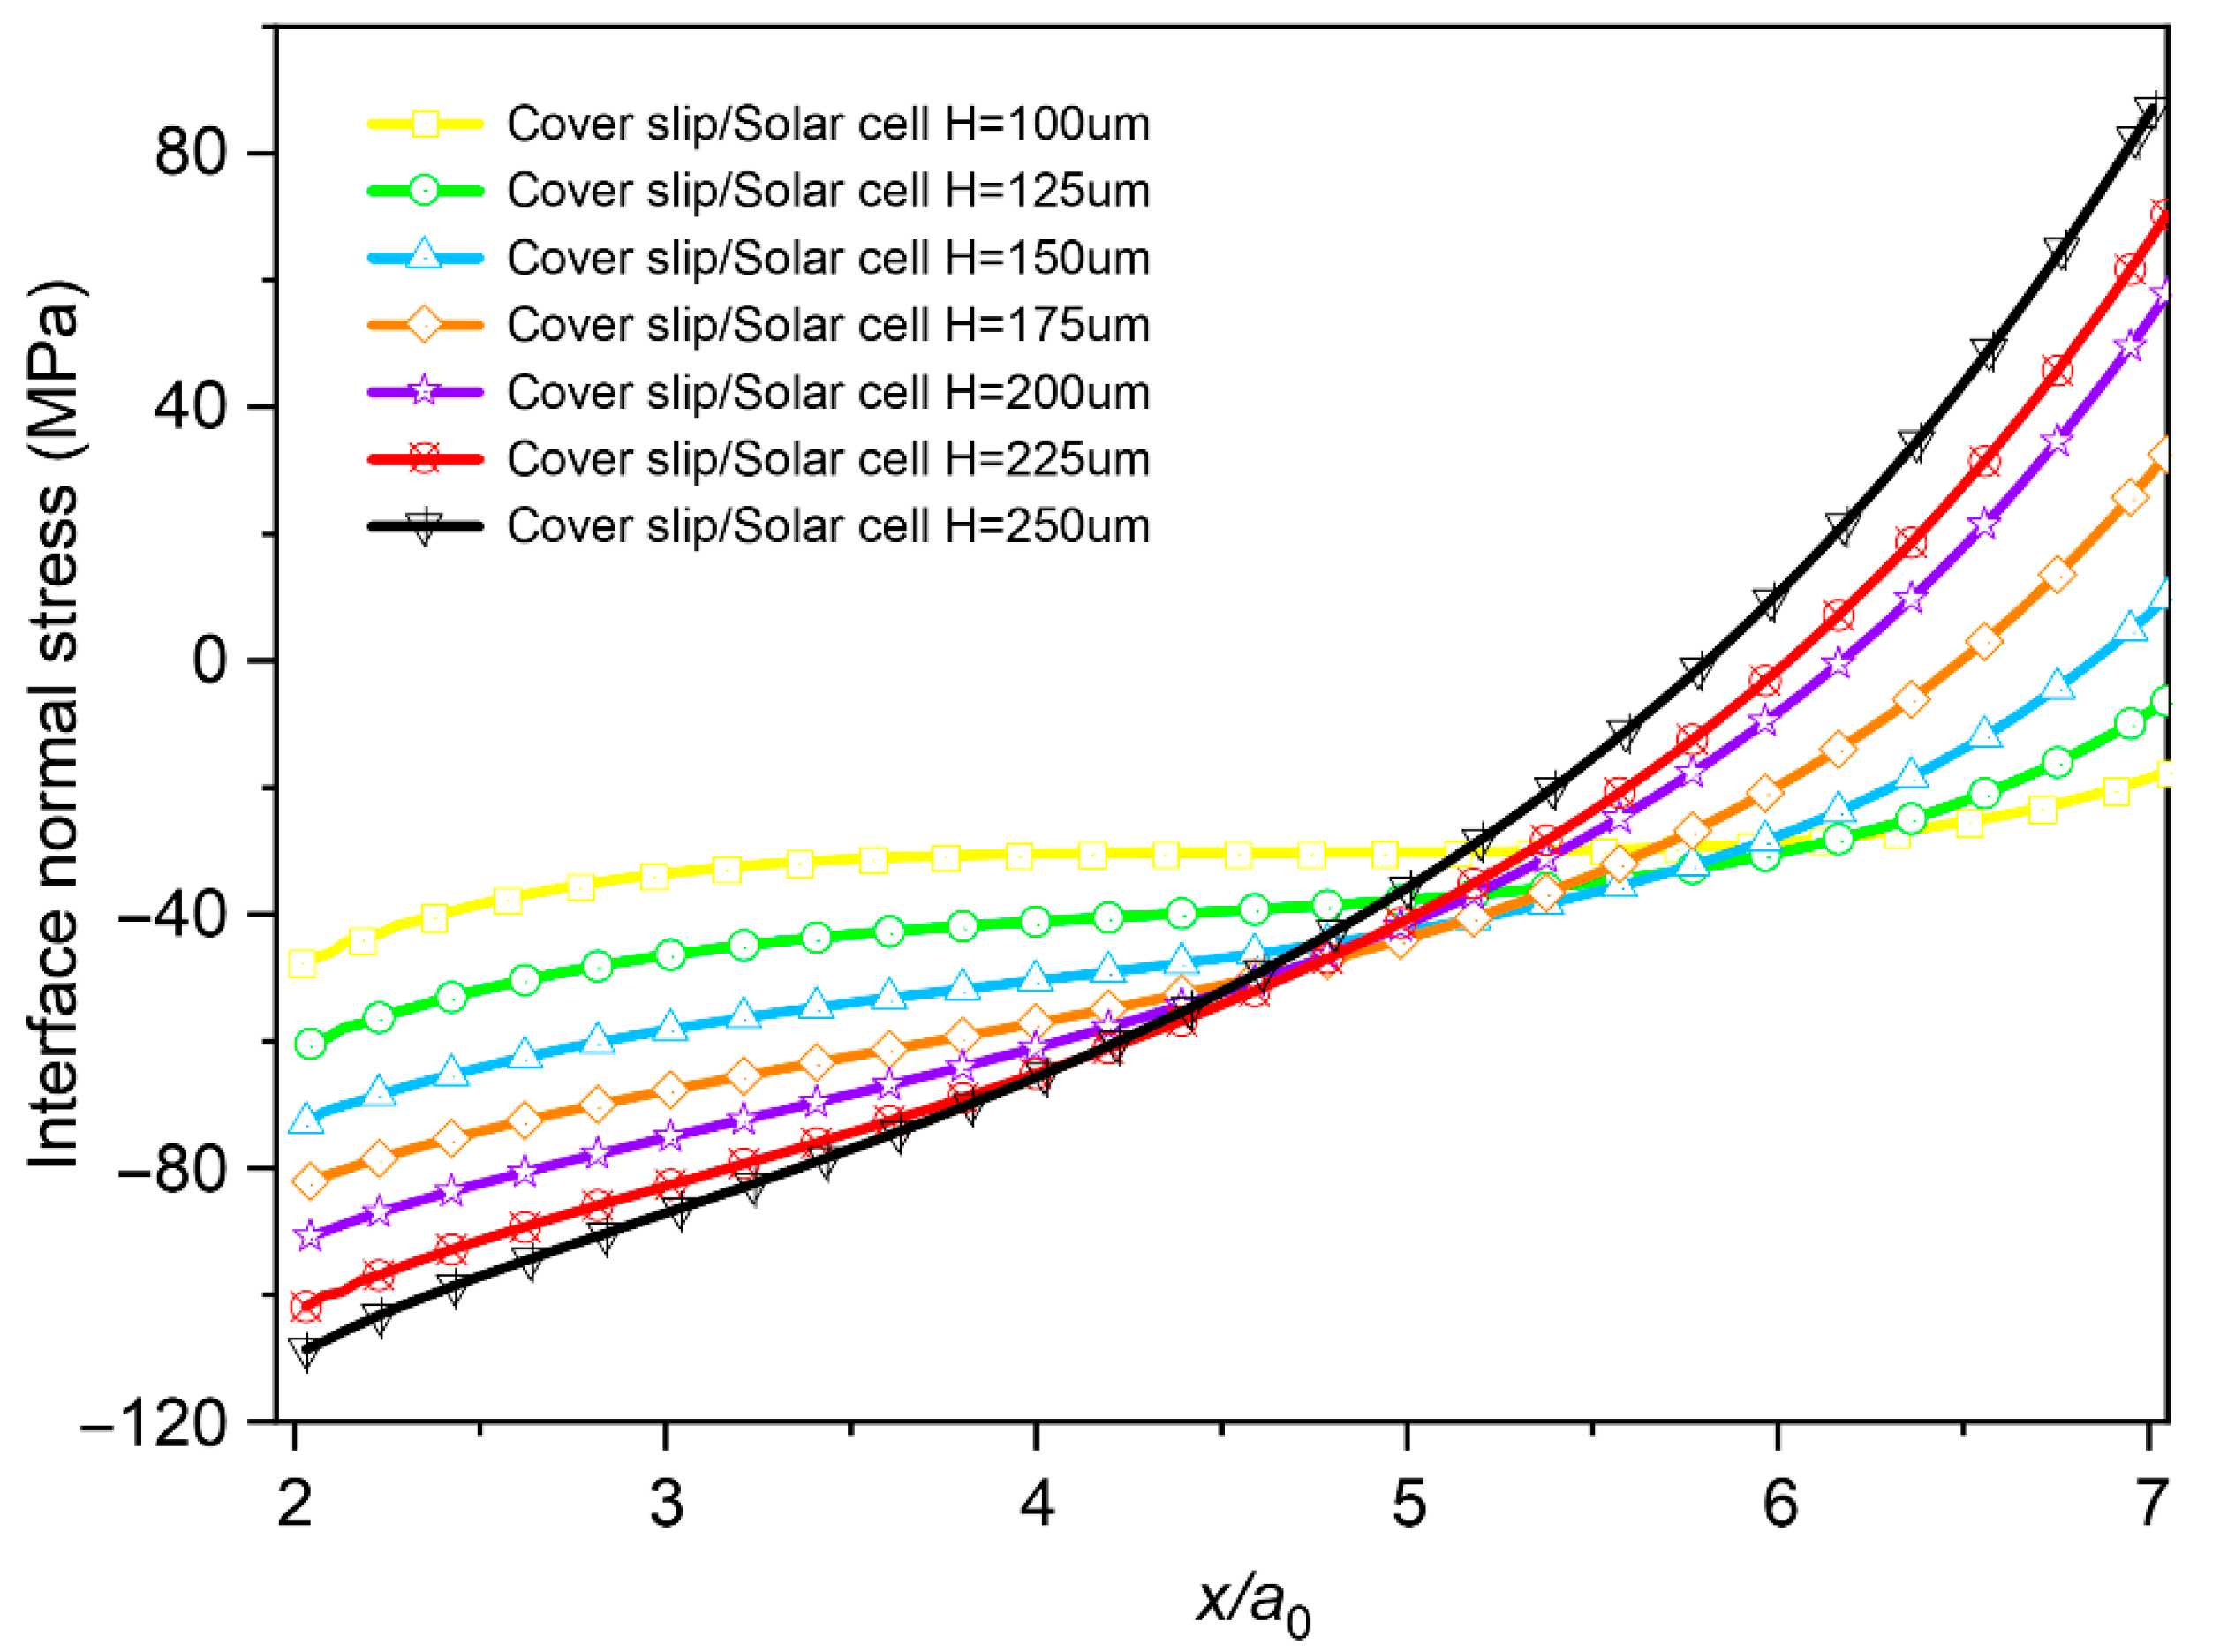
Finally, the influence of layer thickness is examined. In actual production, the thickness of the cover slip or solar cell typically ranges from 100 μm to 300 μm. In the model shown in
Figure 7, the solar cell thickness is fixed at 150 μm, while that of the cover slip varies between 100 μm and 250 μm. The results indicate that the interfacial normal stress initially decreases and then increases with the normalized distance
x/
a0. Moreover, the maximum interfacial normal stress shows a positive correlation with the thickness of the cover layer.
