4.2. Improved Angelov Capacitance Model
Based on the derivation process of the Angelov empirical model, we assume that the gate-source capacitance mainly consists of two components. To simplify the process, we assume that the
gate-source capacitance is a function of both
and
[
17], and the following expression can be obtained:
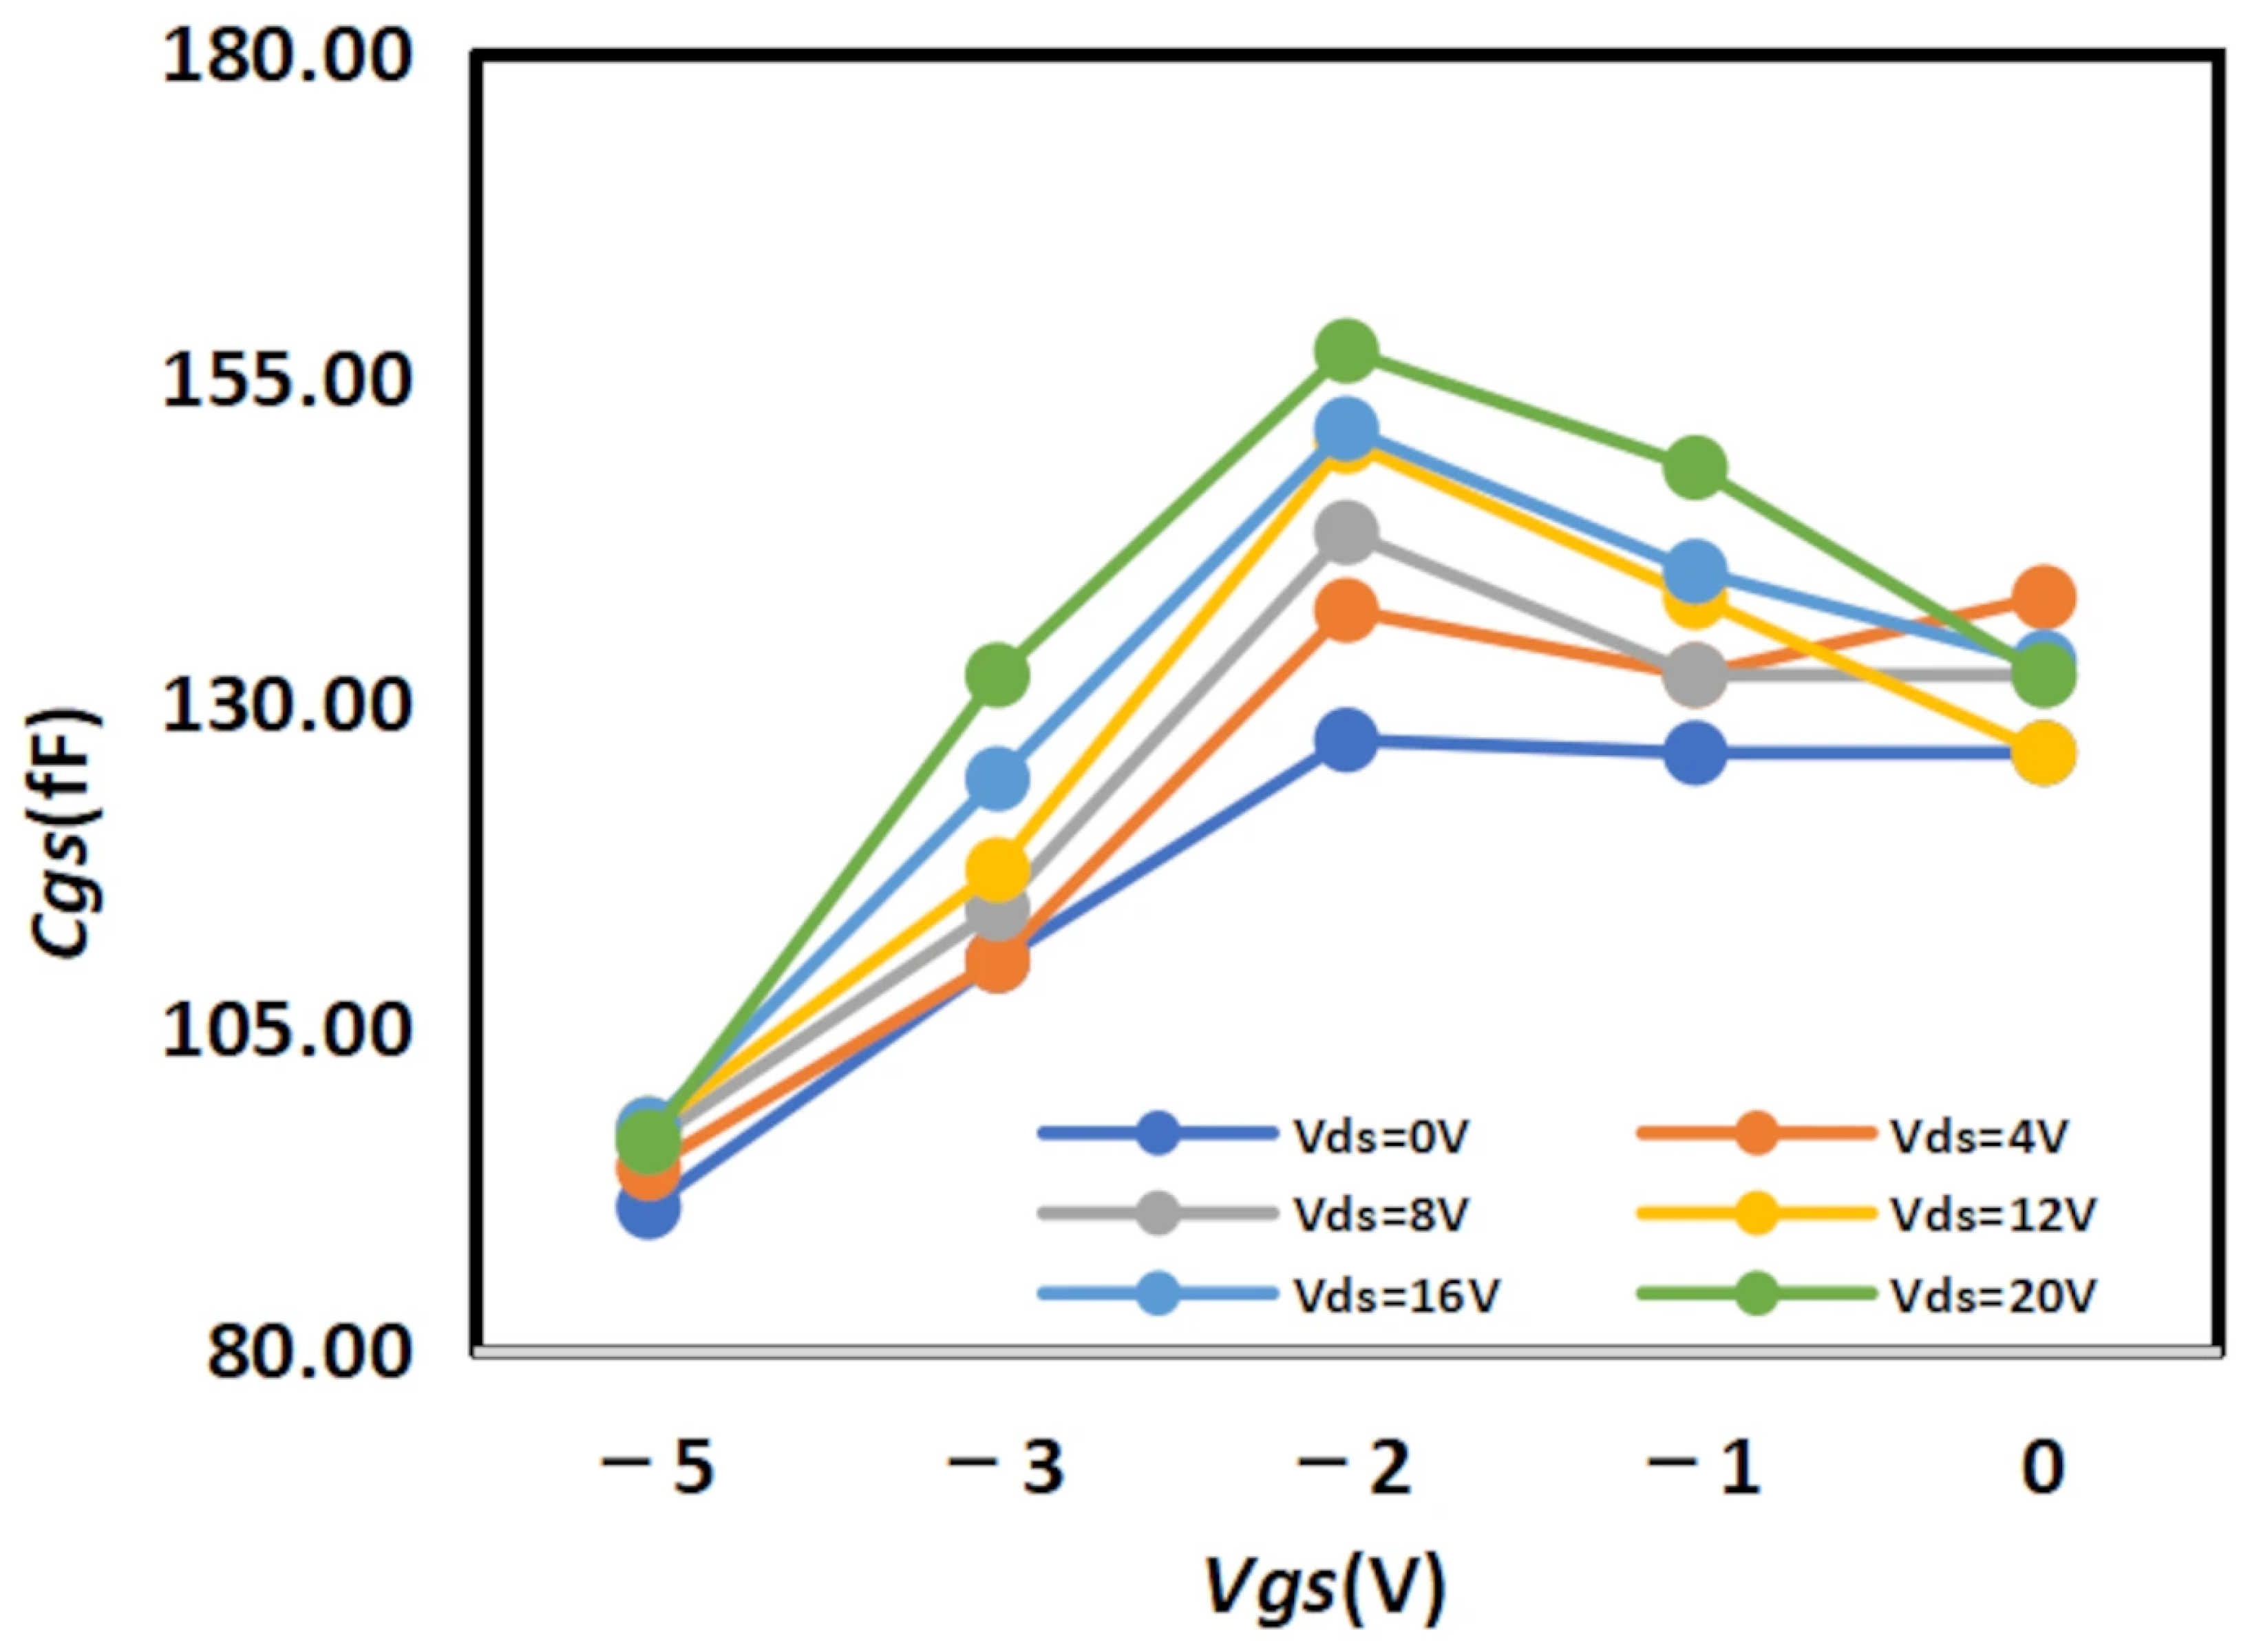
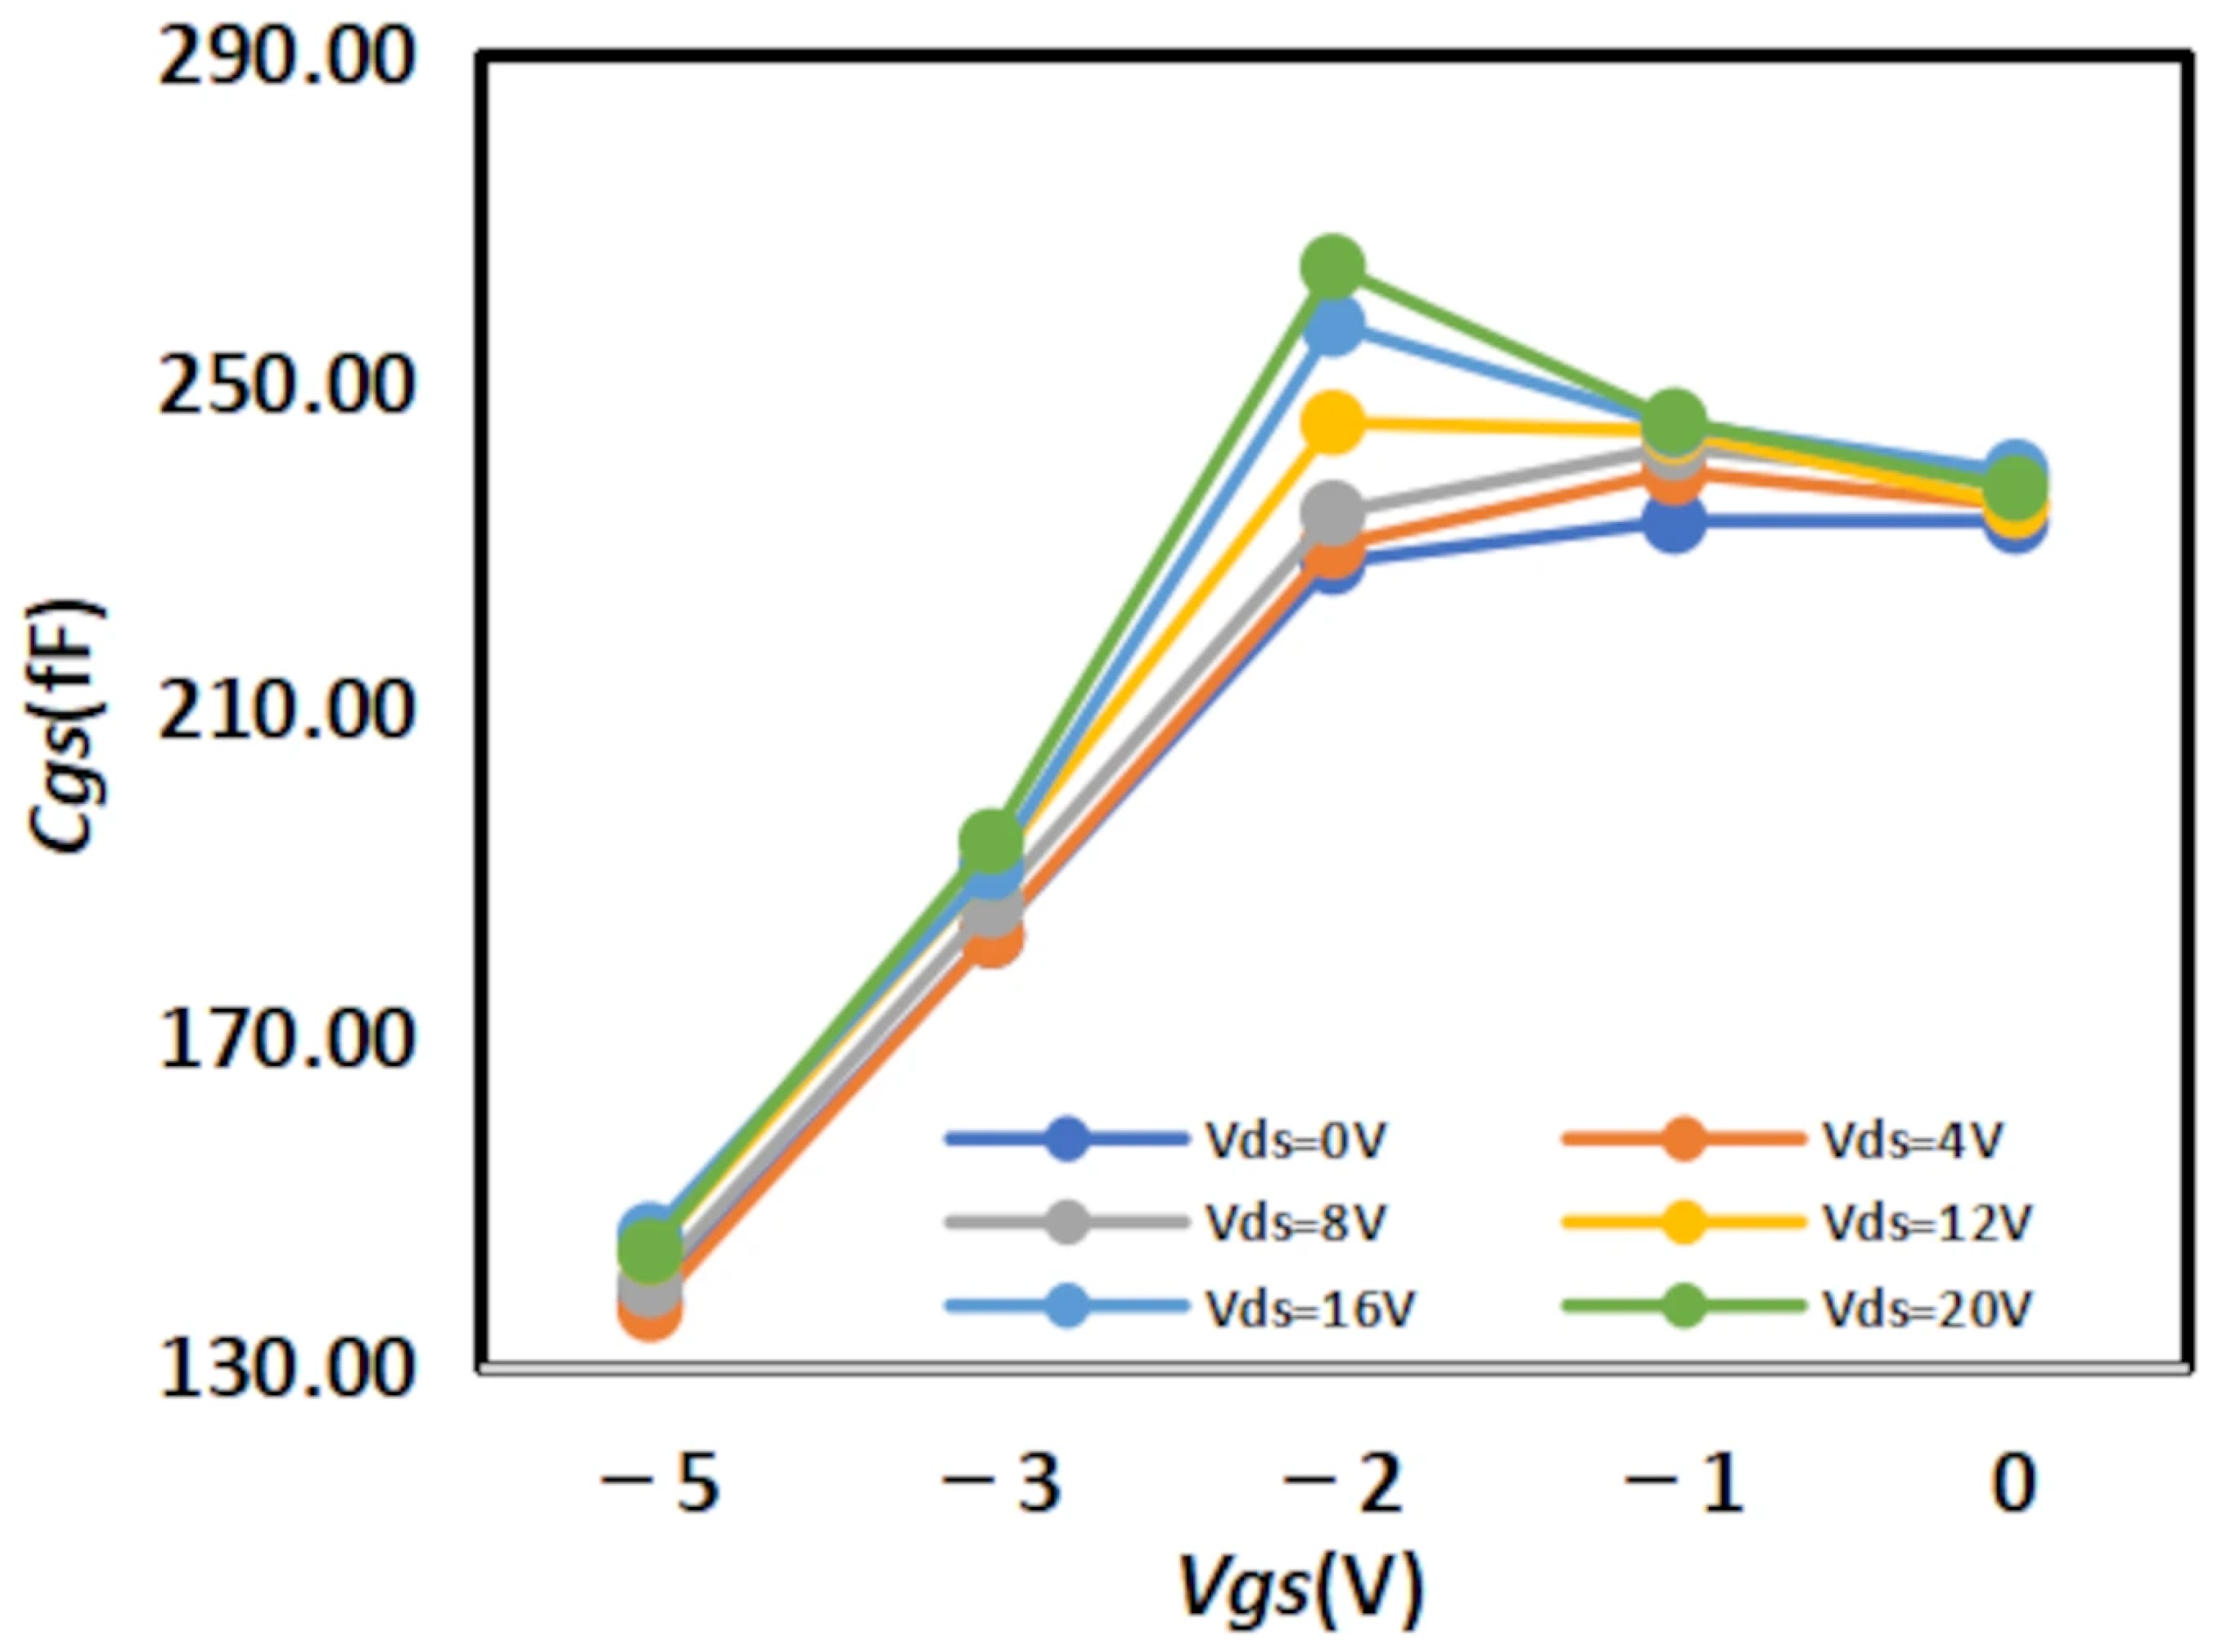
By analyzing the extracted curve of
versus
, it can be observed that
does not increase monotonically with
. Instead, after increasing to a certain extent,
begins to decrease. This phenomenon is primarily attributed to the intrinsic nature of GaN HEMTs: as AlGaN/GaN heterojunction transistors, their core physical foundation lies in the spontaneous formation of a two-dimensional electron gas (2DEG) layer with high concentration and high mobility at the AlGaN-GaN interface [
18]. This 2DEG layer is not only a key characteristic distinguishing GaN HEMTs from traditional Si MOSFETs and GaAs HEMTs but also the root cause of their “high electron mobility” property. The magnitude of
is determined by the concentration and spatial distribution of 2DEG, while the state of 2DEG exhibits a quantum confinement process of “filling-saturation-overflow” as
changes [
19]. In contrast, the hyperbolic tangent function (tanh) used in traditional models possesses a mathematical property of “monotonic increase/decrease,” which can only describe the “monotonic saturation process from low capacitance to high capacitance” but fails to capture the
decrease caused by 2DEG overflow. Notably, this limitation is not a result of insufficient mathematical precision, but rather a mismatch between the function form and the underlying physical mechanism. In comparison, the “S-shaped curve” of the exponential function inherently exhibits non-monotonic characteristics of “increase-plateau-decrease,” which directly corresponds to the quantum behavior of 2DEG. Therefore, the exponential function is selected to replace the hyperbolic tangent function in the original formula.
are fitting parameters.
For the second term regarding the influence of
on
, we made modifications based on the original Angelov model by adding the dependence of
on
.
are fitting parameters.
In the formula of the original Angelov model, the two-voltage effect is merely a simple product superposition, which only considers the influences of and independently. However, in the actual operation of GaN HEMTs,
and
mutually modulate each other through the “channel electric field” [
20]. Thus, the independent superposition approach adopted in traditional models fails to reproduce the “capacitance coupling effect induced by channel electric field modulation”. Therefore, on the basis of the improved model, we further introduce a cross-coupling term related to
and
. It specifically reproduces the synergistic modulation effect induced by
and
through the channel electric field and polarization charge distribution [
21]. After introducing the cross-coupling term, as
increases, the value of the product term rises and the hyperbolic tangent (tanh) function value approaches 1, offsetting the inhibitory effect of
on
. When
decreases, the product term value reduces and the tanh function value approaches 0, enhancing the inhibitory effect of
on
. This is fully consistent with the physical reality that “gate control capability dominates channel electric field modulation”.
The improved capacitance model for
is as follows:
are fitting parameters.
Substituting the measured data of 2 × 10 μm, the fitting results are shown in
Table 3 below:
The experimental relative errors and root mean square errors are shown in
Table 4 below:
According to
Table 4 above, we can observe that after introducing the cross-coupling term, the improved model achieves a better fitting effect with the original data, and both R
2 (relative error) and RMSE (root mean square error) show significant improvements.
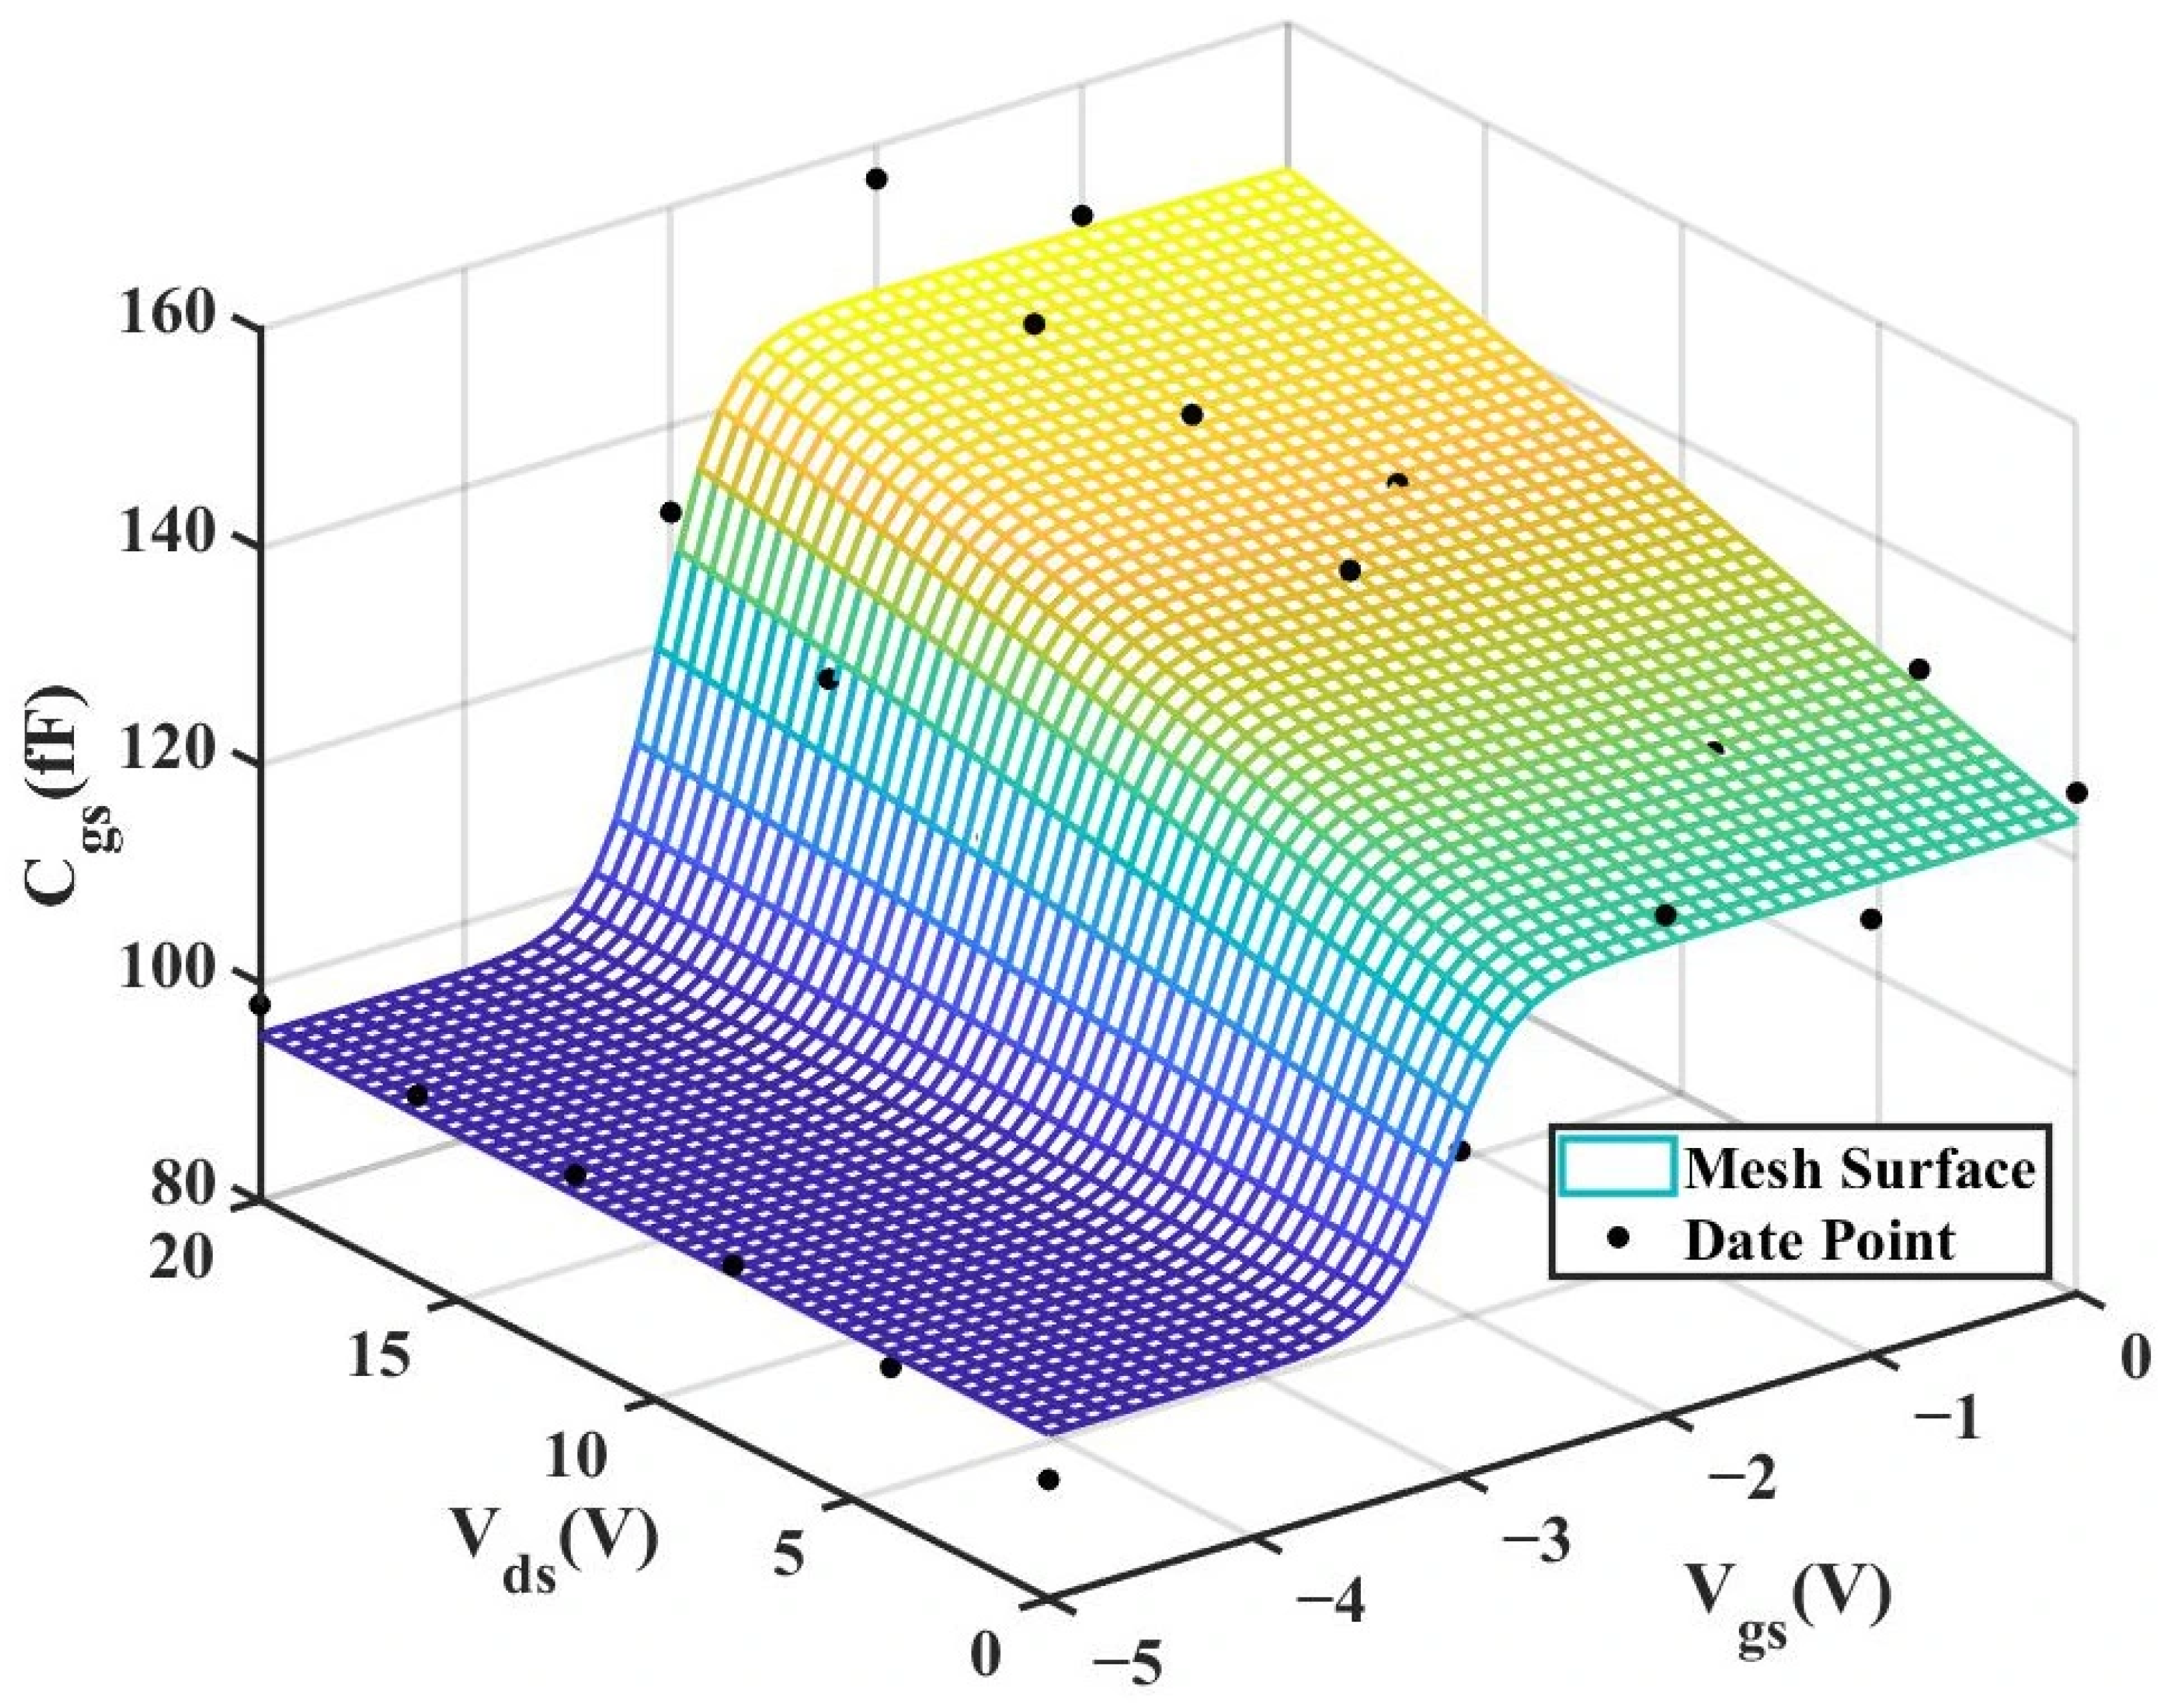
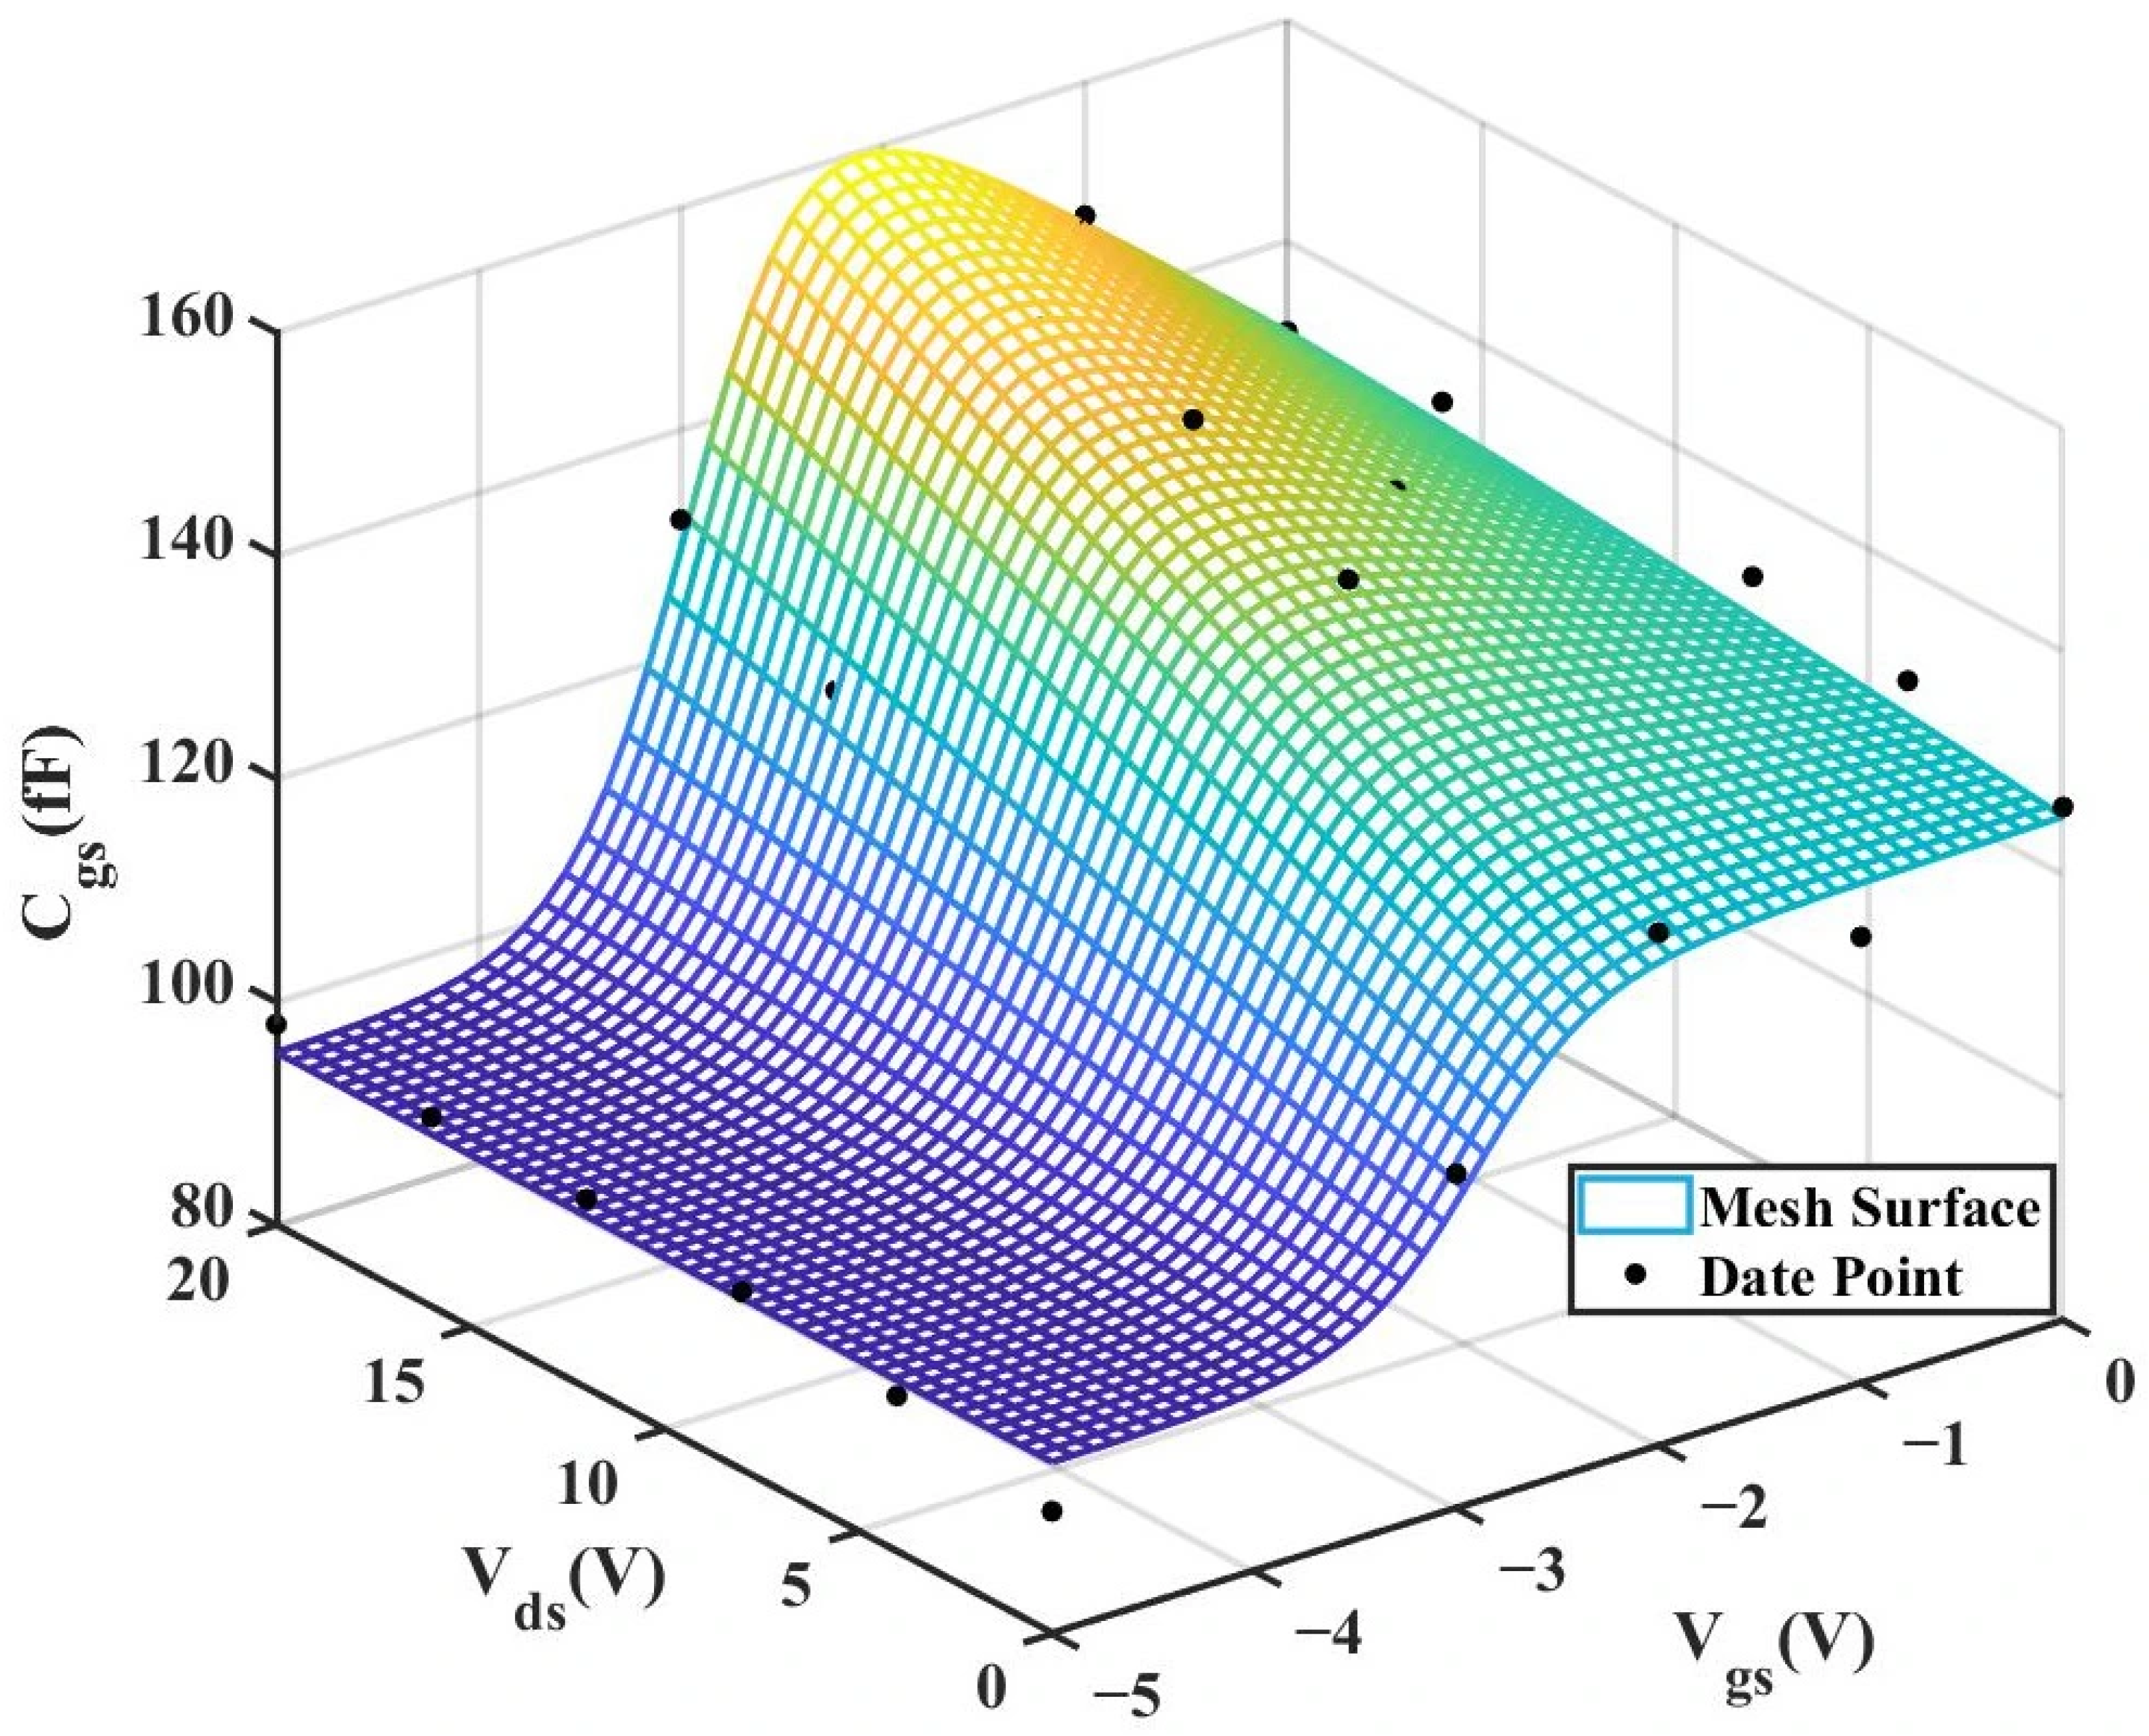
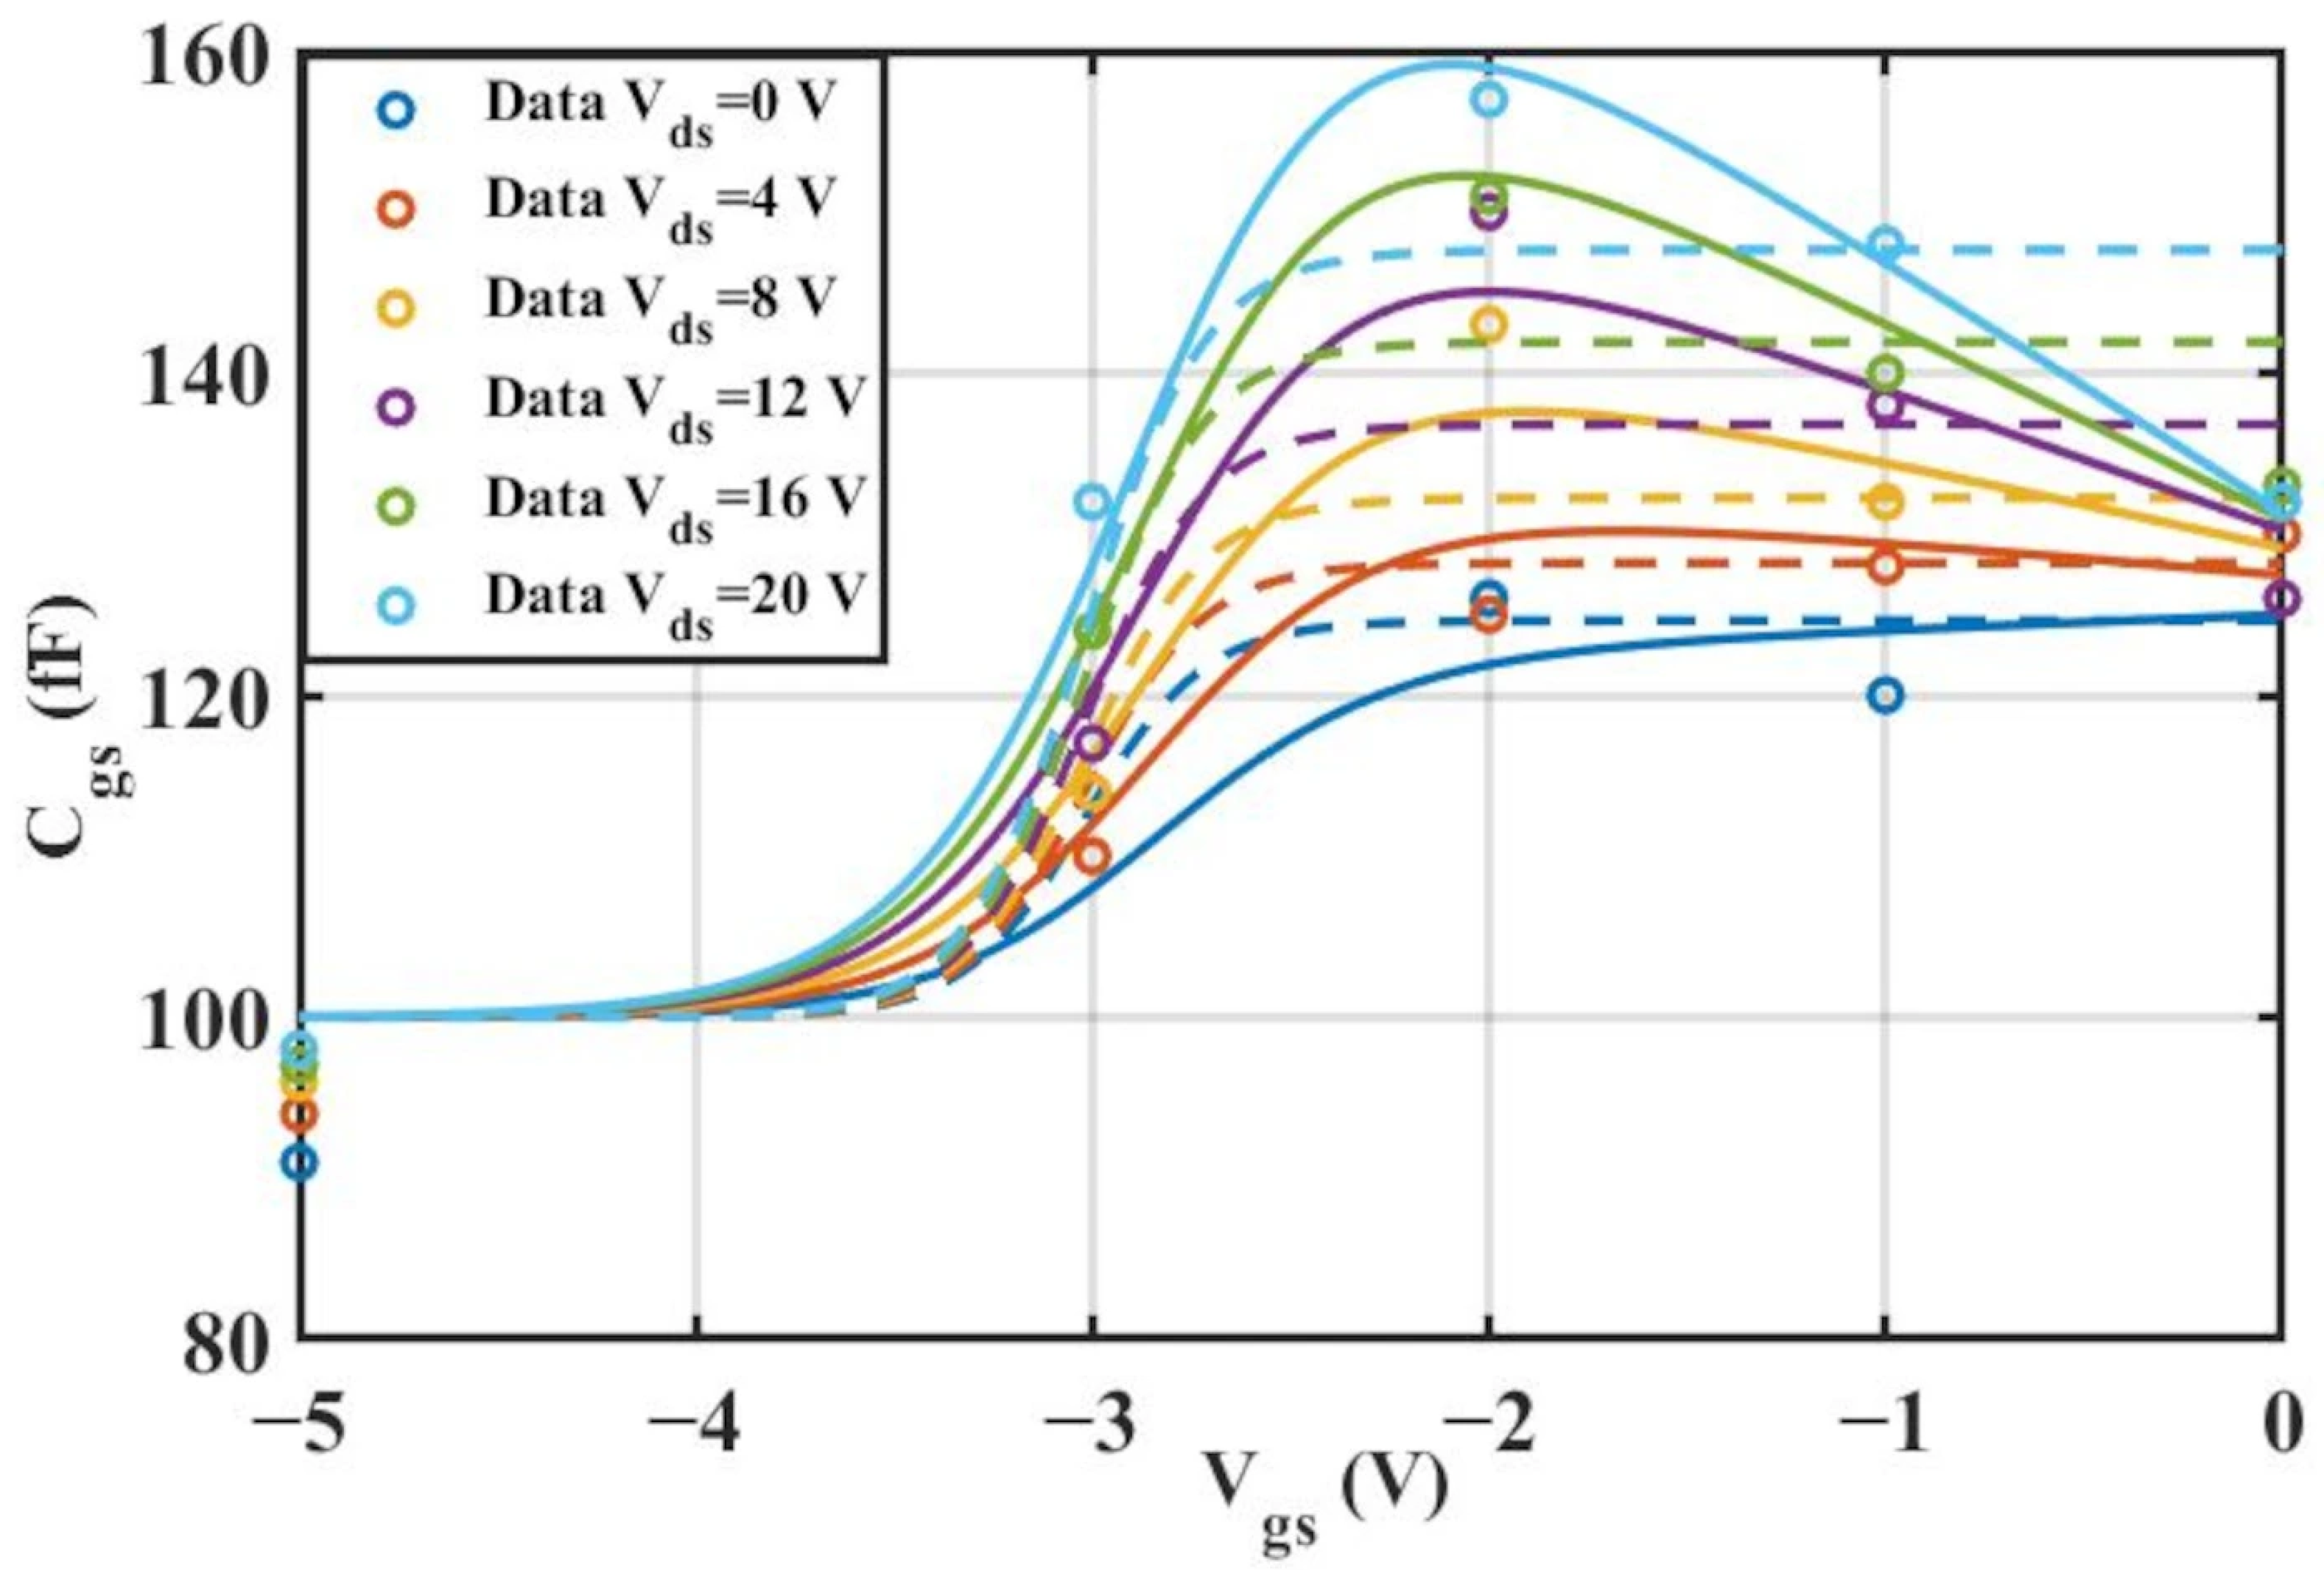
Figure 12 and
Figure 13 below present the 3D plot of
for improved model and the comparison chart of cross-sections of
versus
for the original model and the improved model.
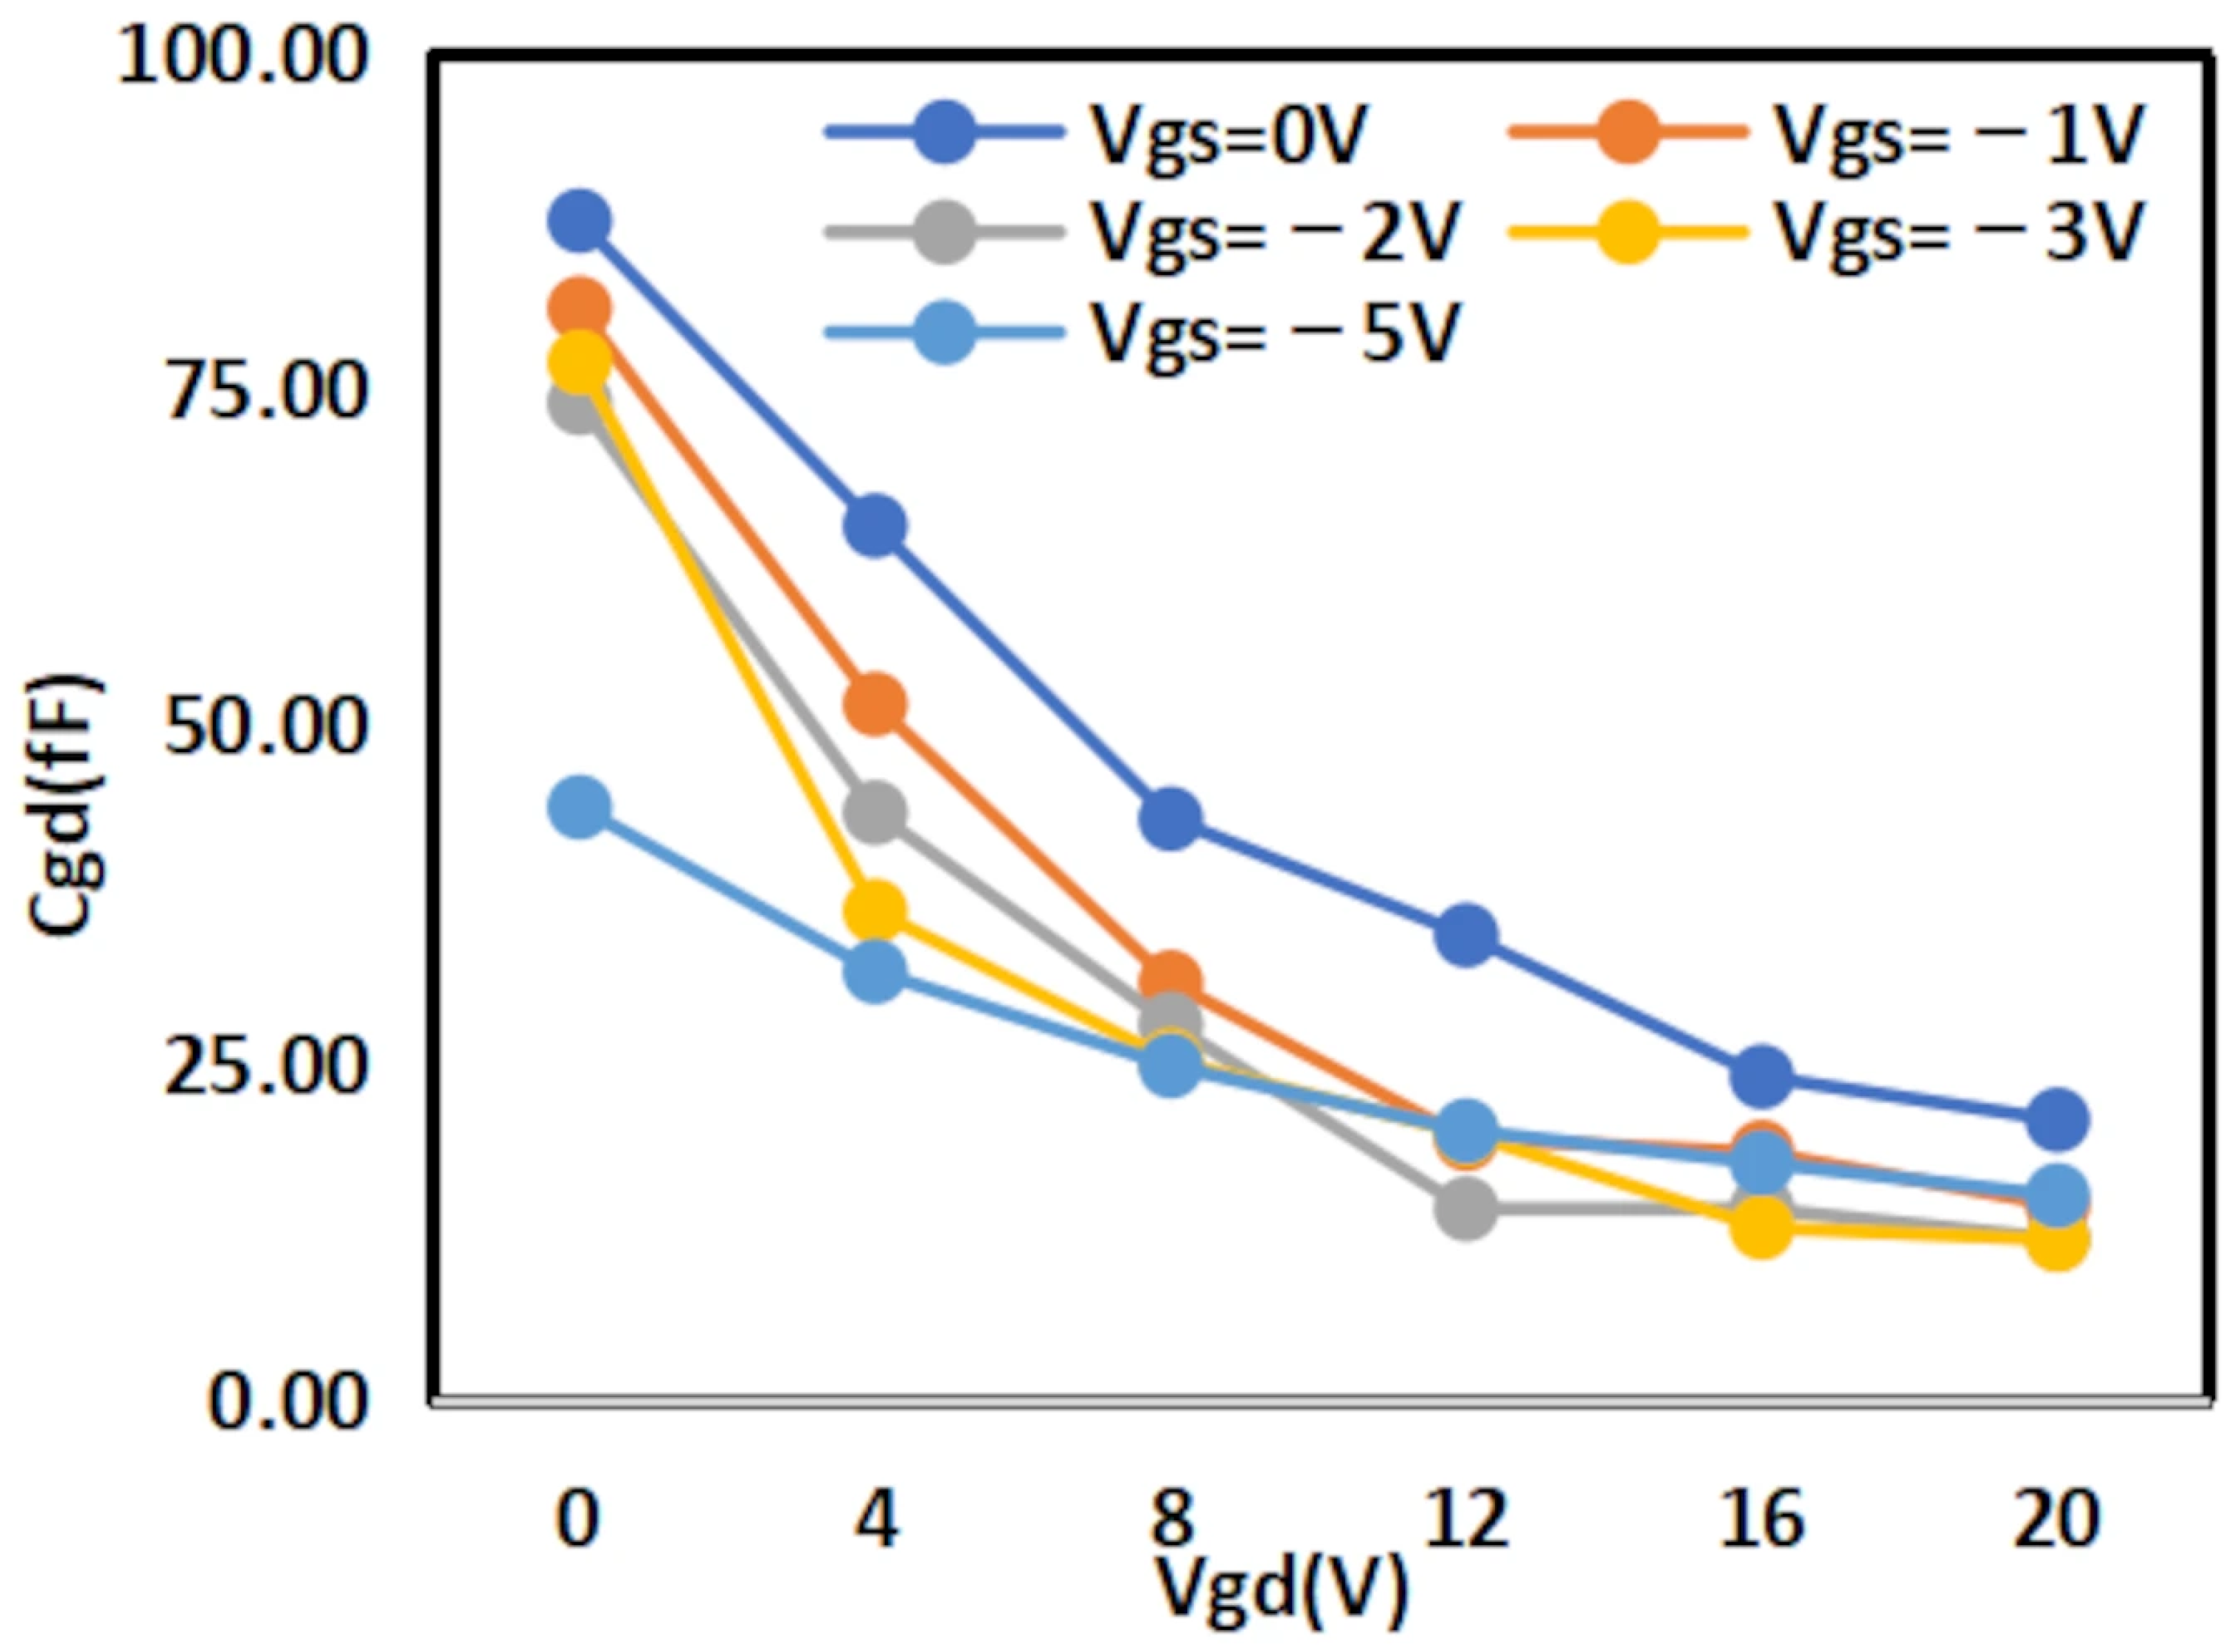
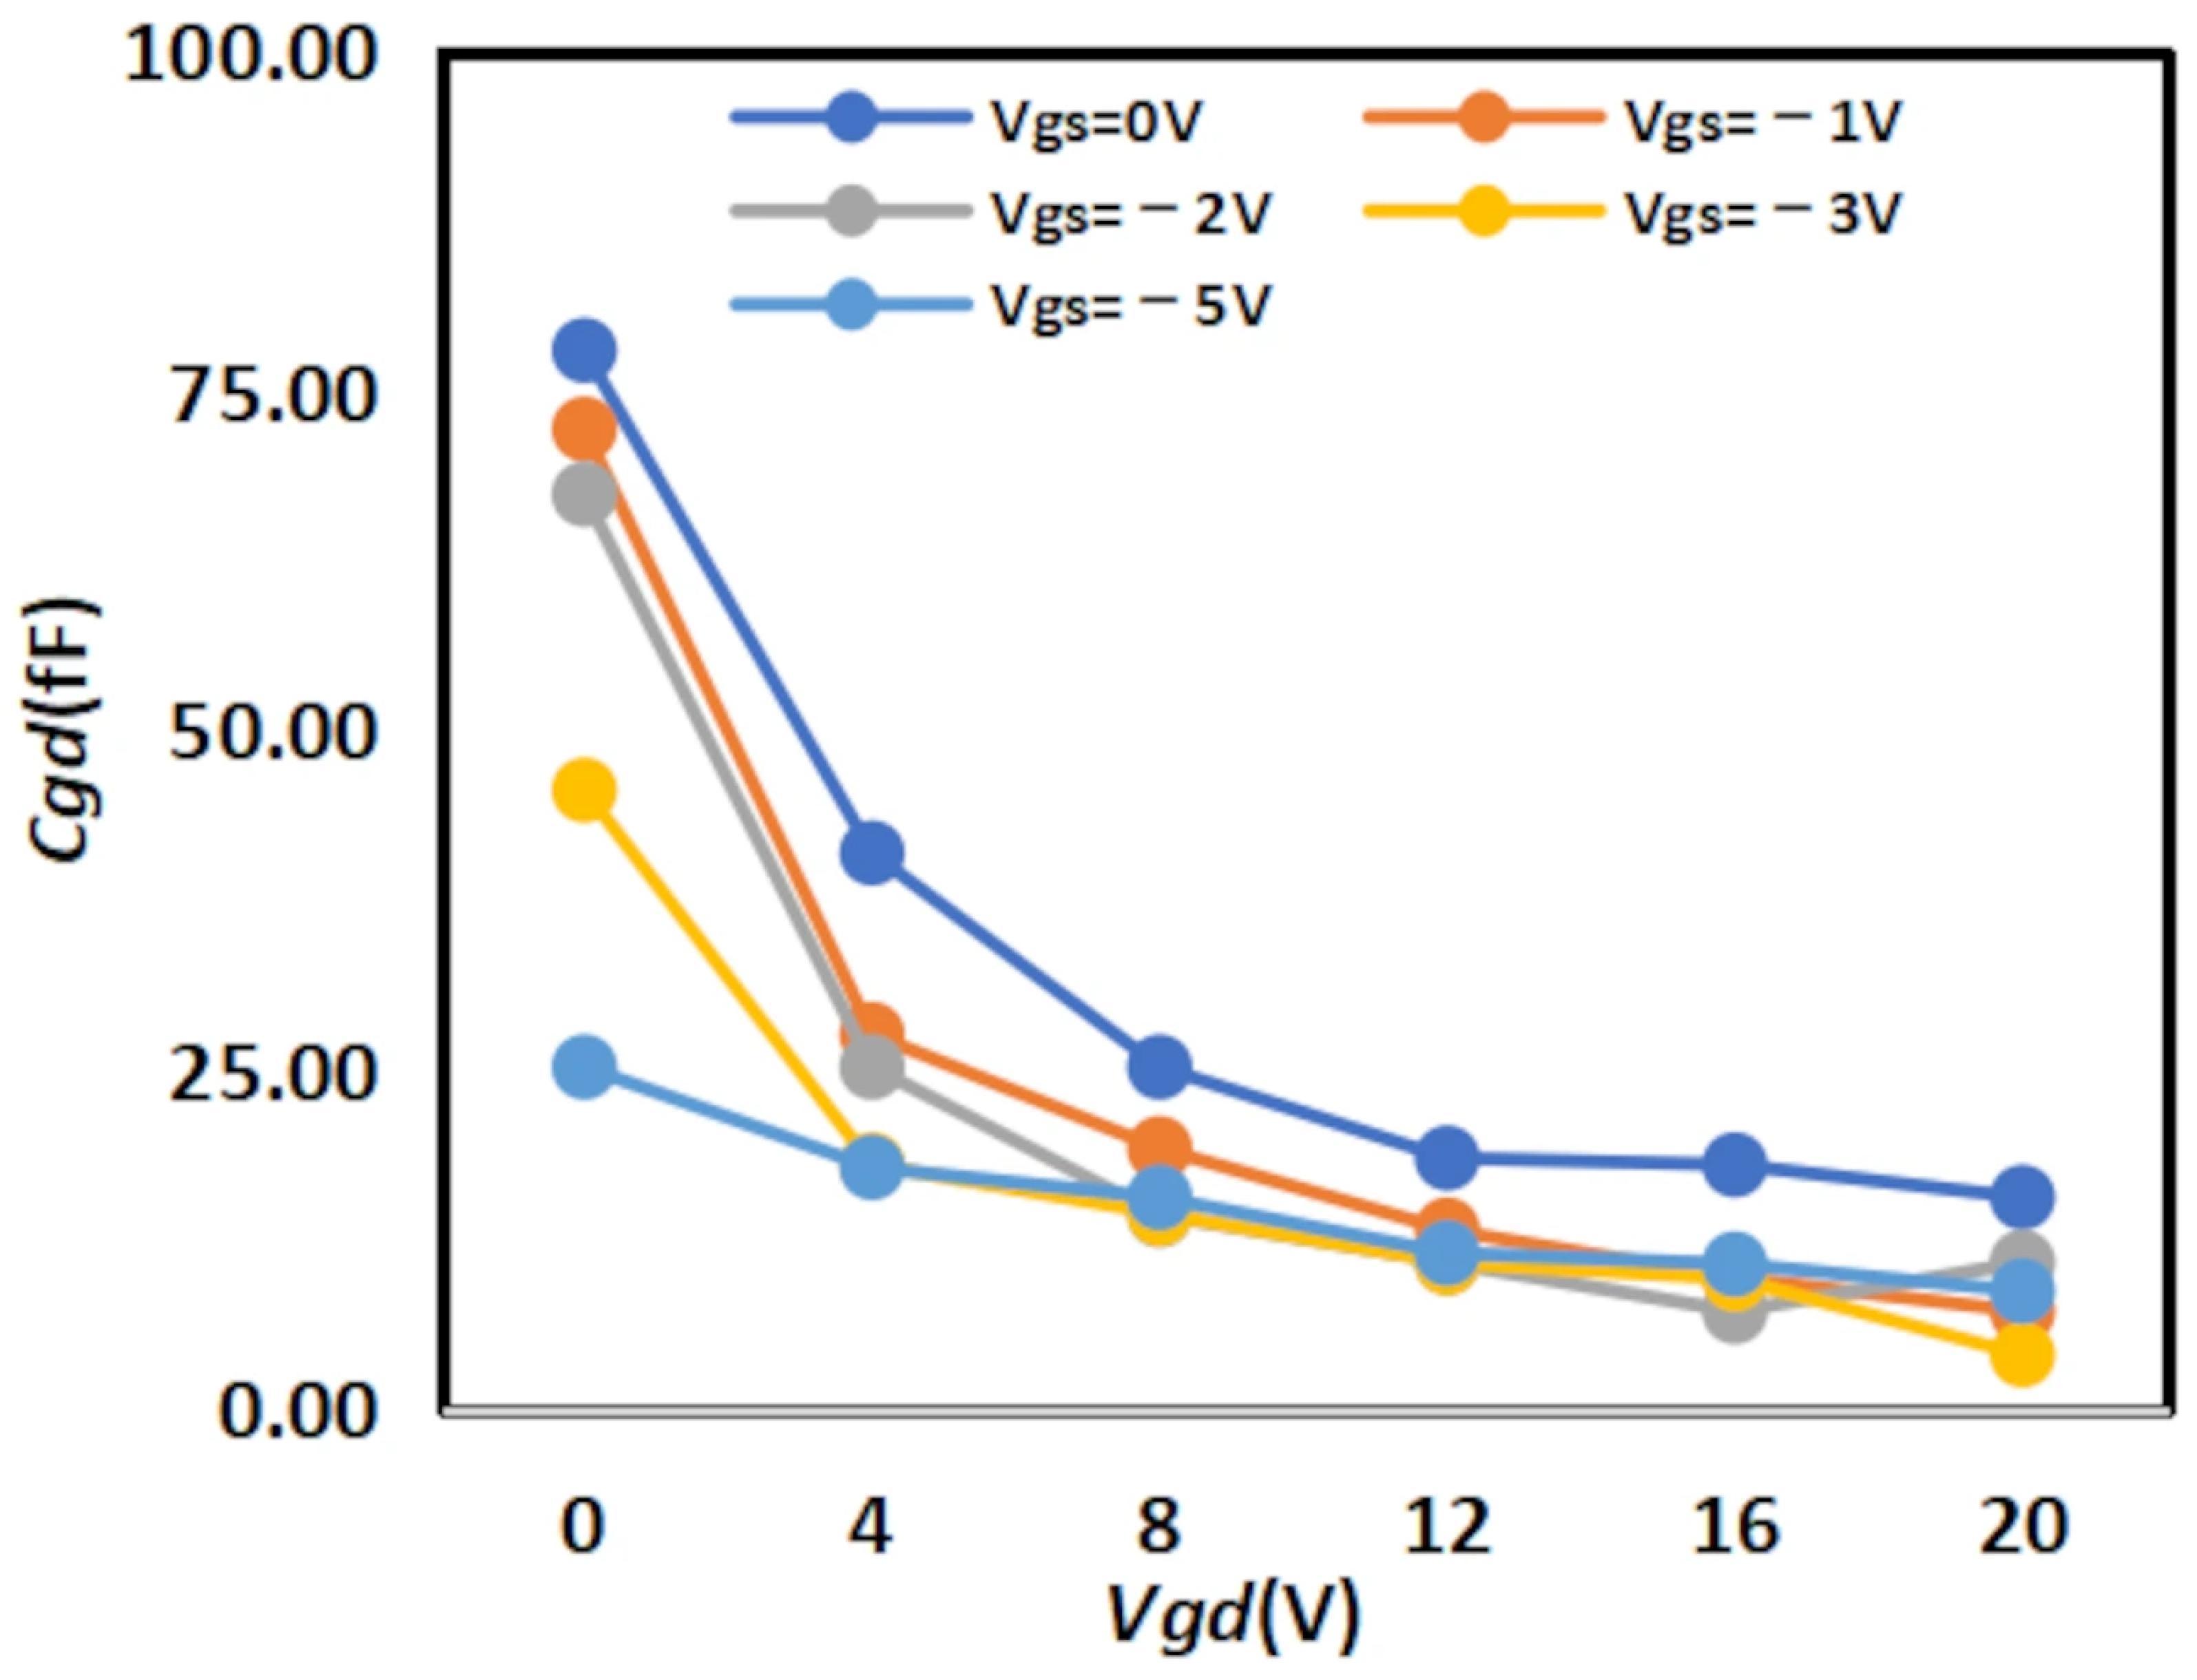
Figure 14 shows a comparison of the
cross-sections between the two models (The solid and dashed lines of different colors in the figure represent different values of
).
To ensure charge conservation, the formula for the
capacitance model is as follows:
are fitting parameters.
By substituting the experimental data of 2 × 10 μm, the fitting results are shown in
Table 5 and the RMSE and R
2 values of the two models are shown in
Table 6 below:
Experimental comparisons show that the new model has a significantly better fitting effect on the
capacitor than the traditional model. The 3D surface plot of the improved
model is shown in
Figure 15.
It can be observed from the above experiments that the new model has a significantly better fitting effect on the intrinsic capacitor than the traditional model, and its advantage is even more prominent when fitting the nonlinear characteristics of the intrinsic capacitor
. It is much closer to the measured data values and achieves a far better fitting effect. Both R2 (Coefficient of Determination) and RMSE (Root Mean Square Error) have shown significant improvements.
4.3. Further Validation of the Model
To more intuitively demonstrate the accuracy of the improved empirical model, we selected the experimental data of 4 × 20 μm to further verify the feasibility and accuracy of the mode. The fitting results of the parameters and the experimental comparison results are shown in
Table 7 and
Table 8 below.
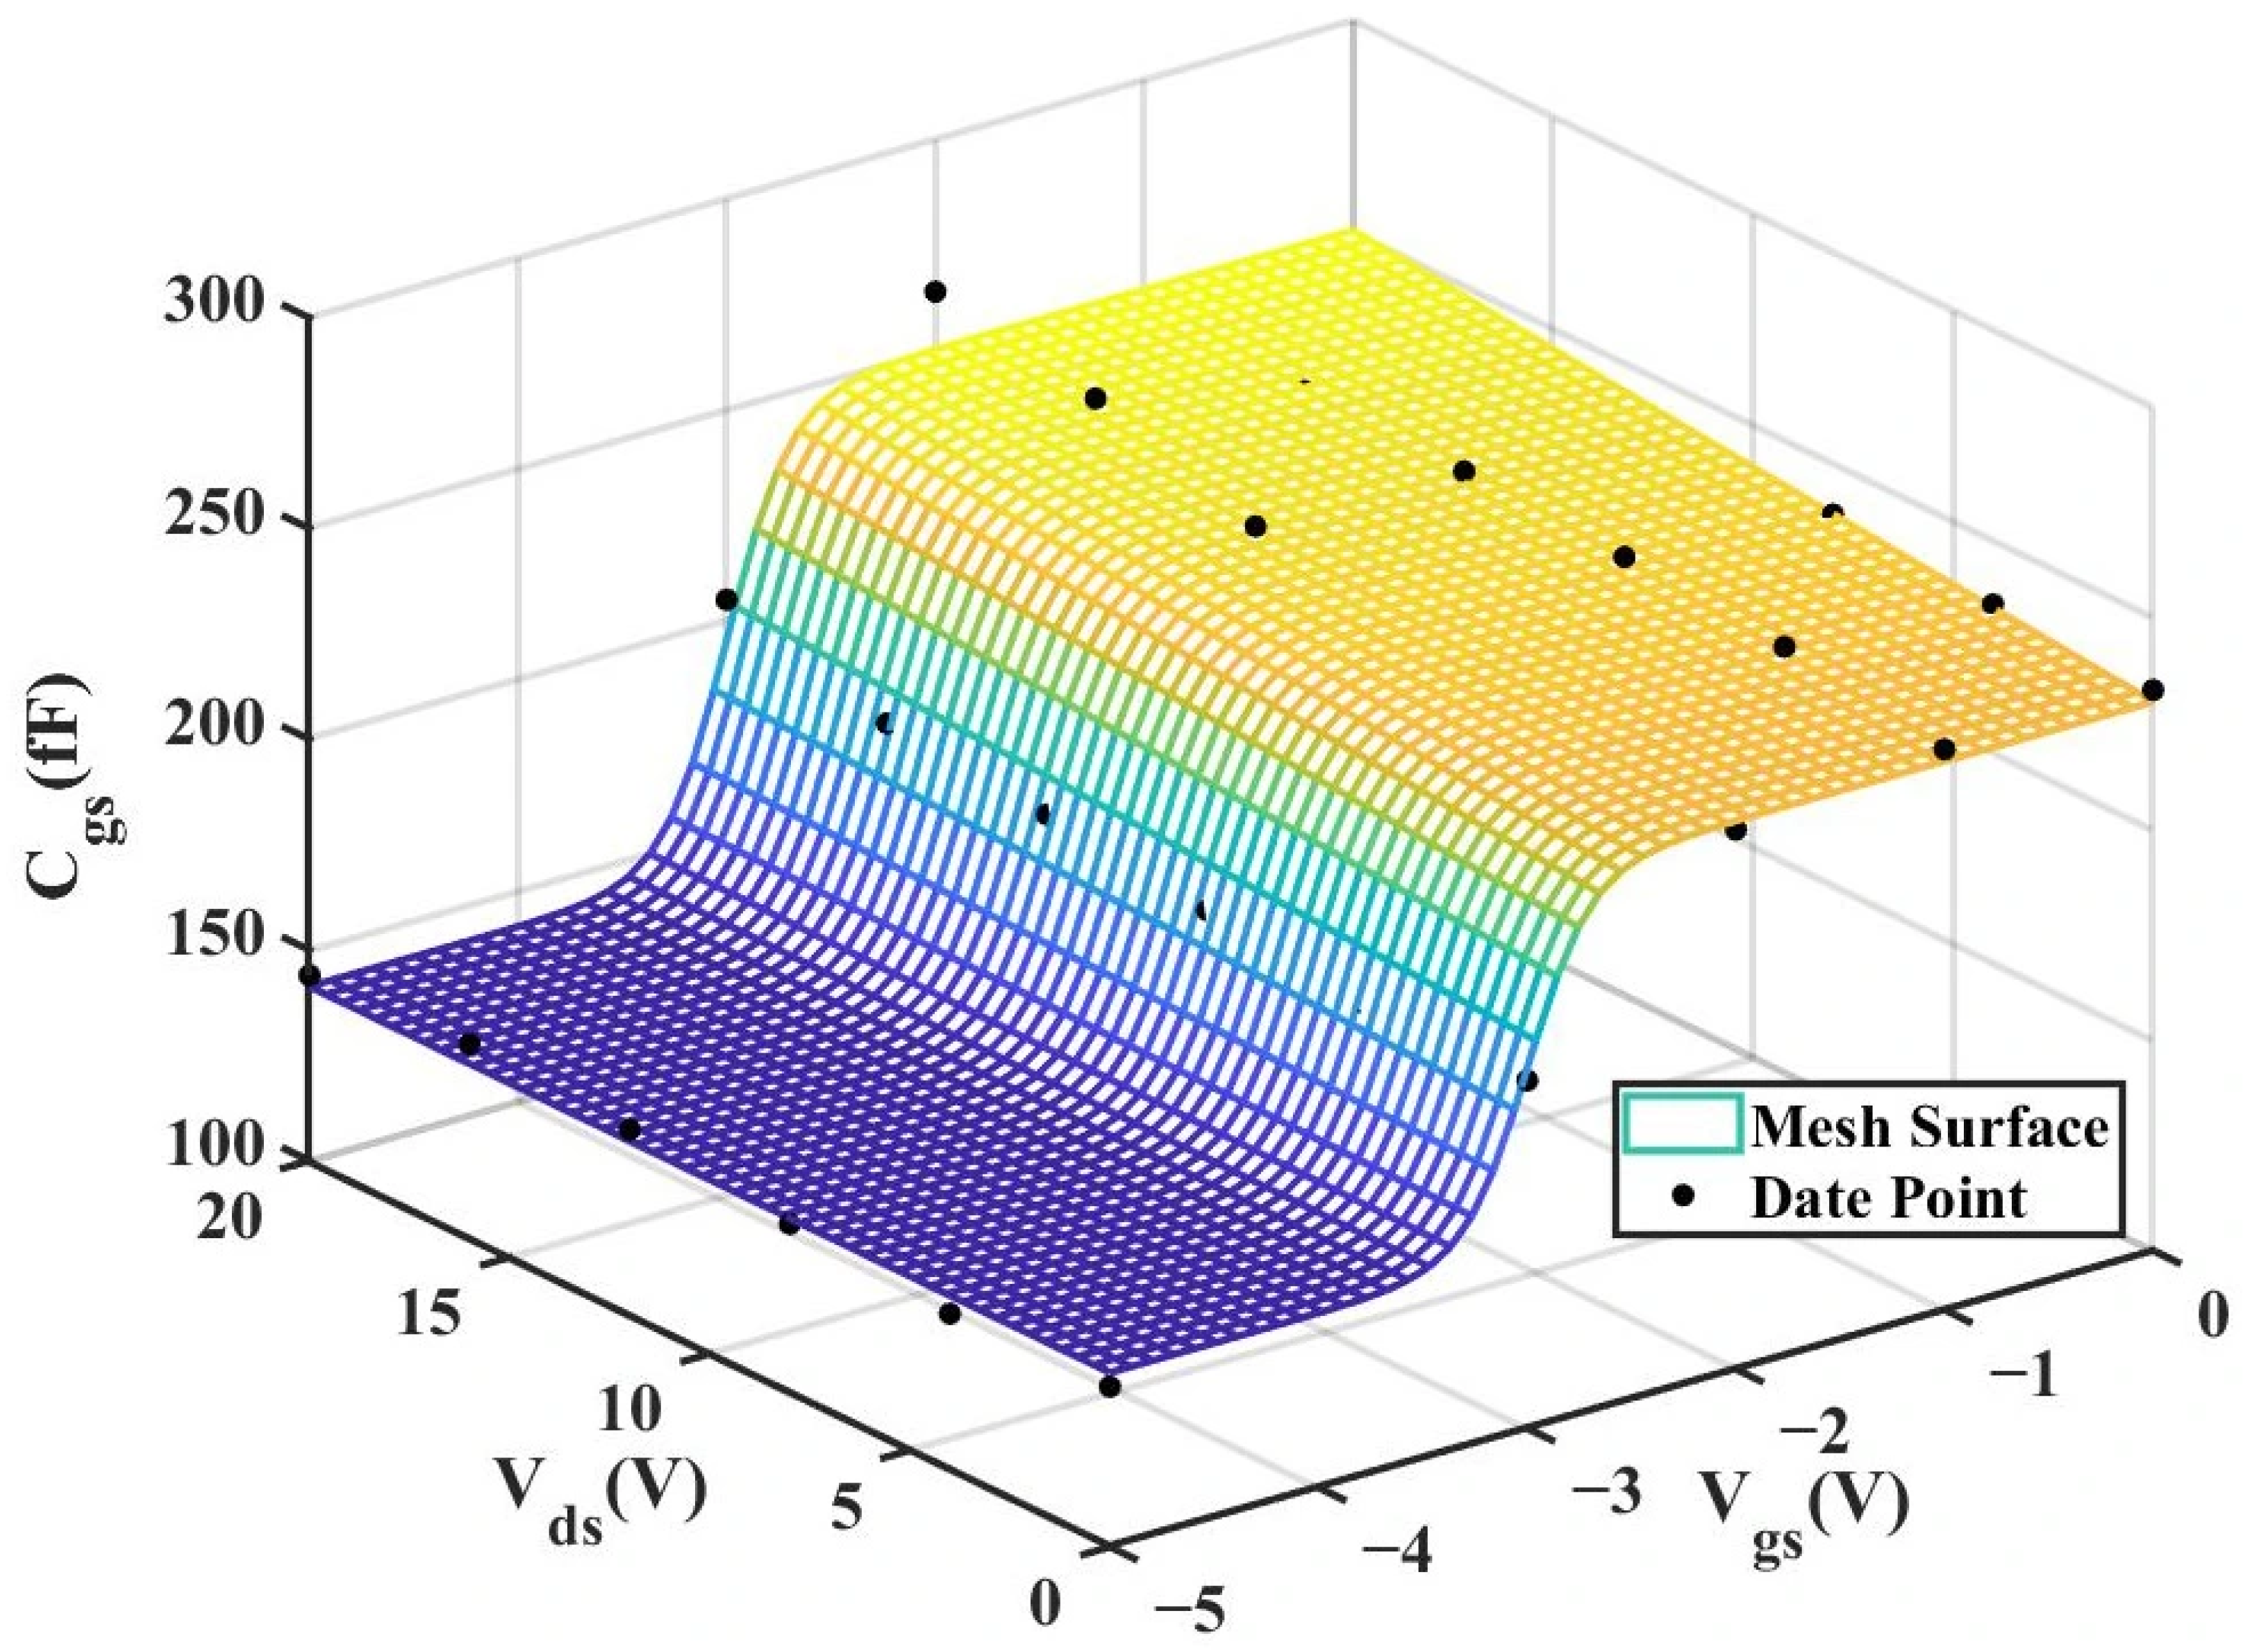
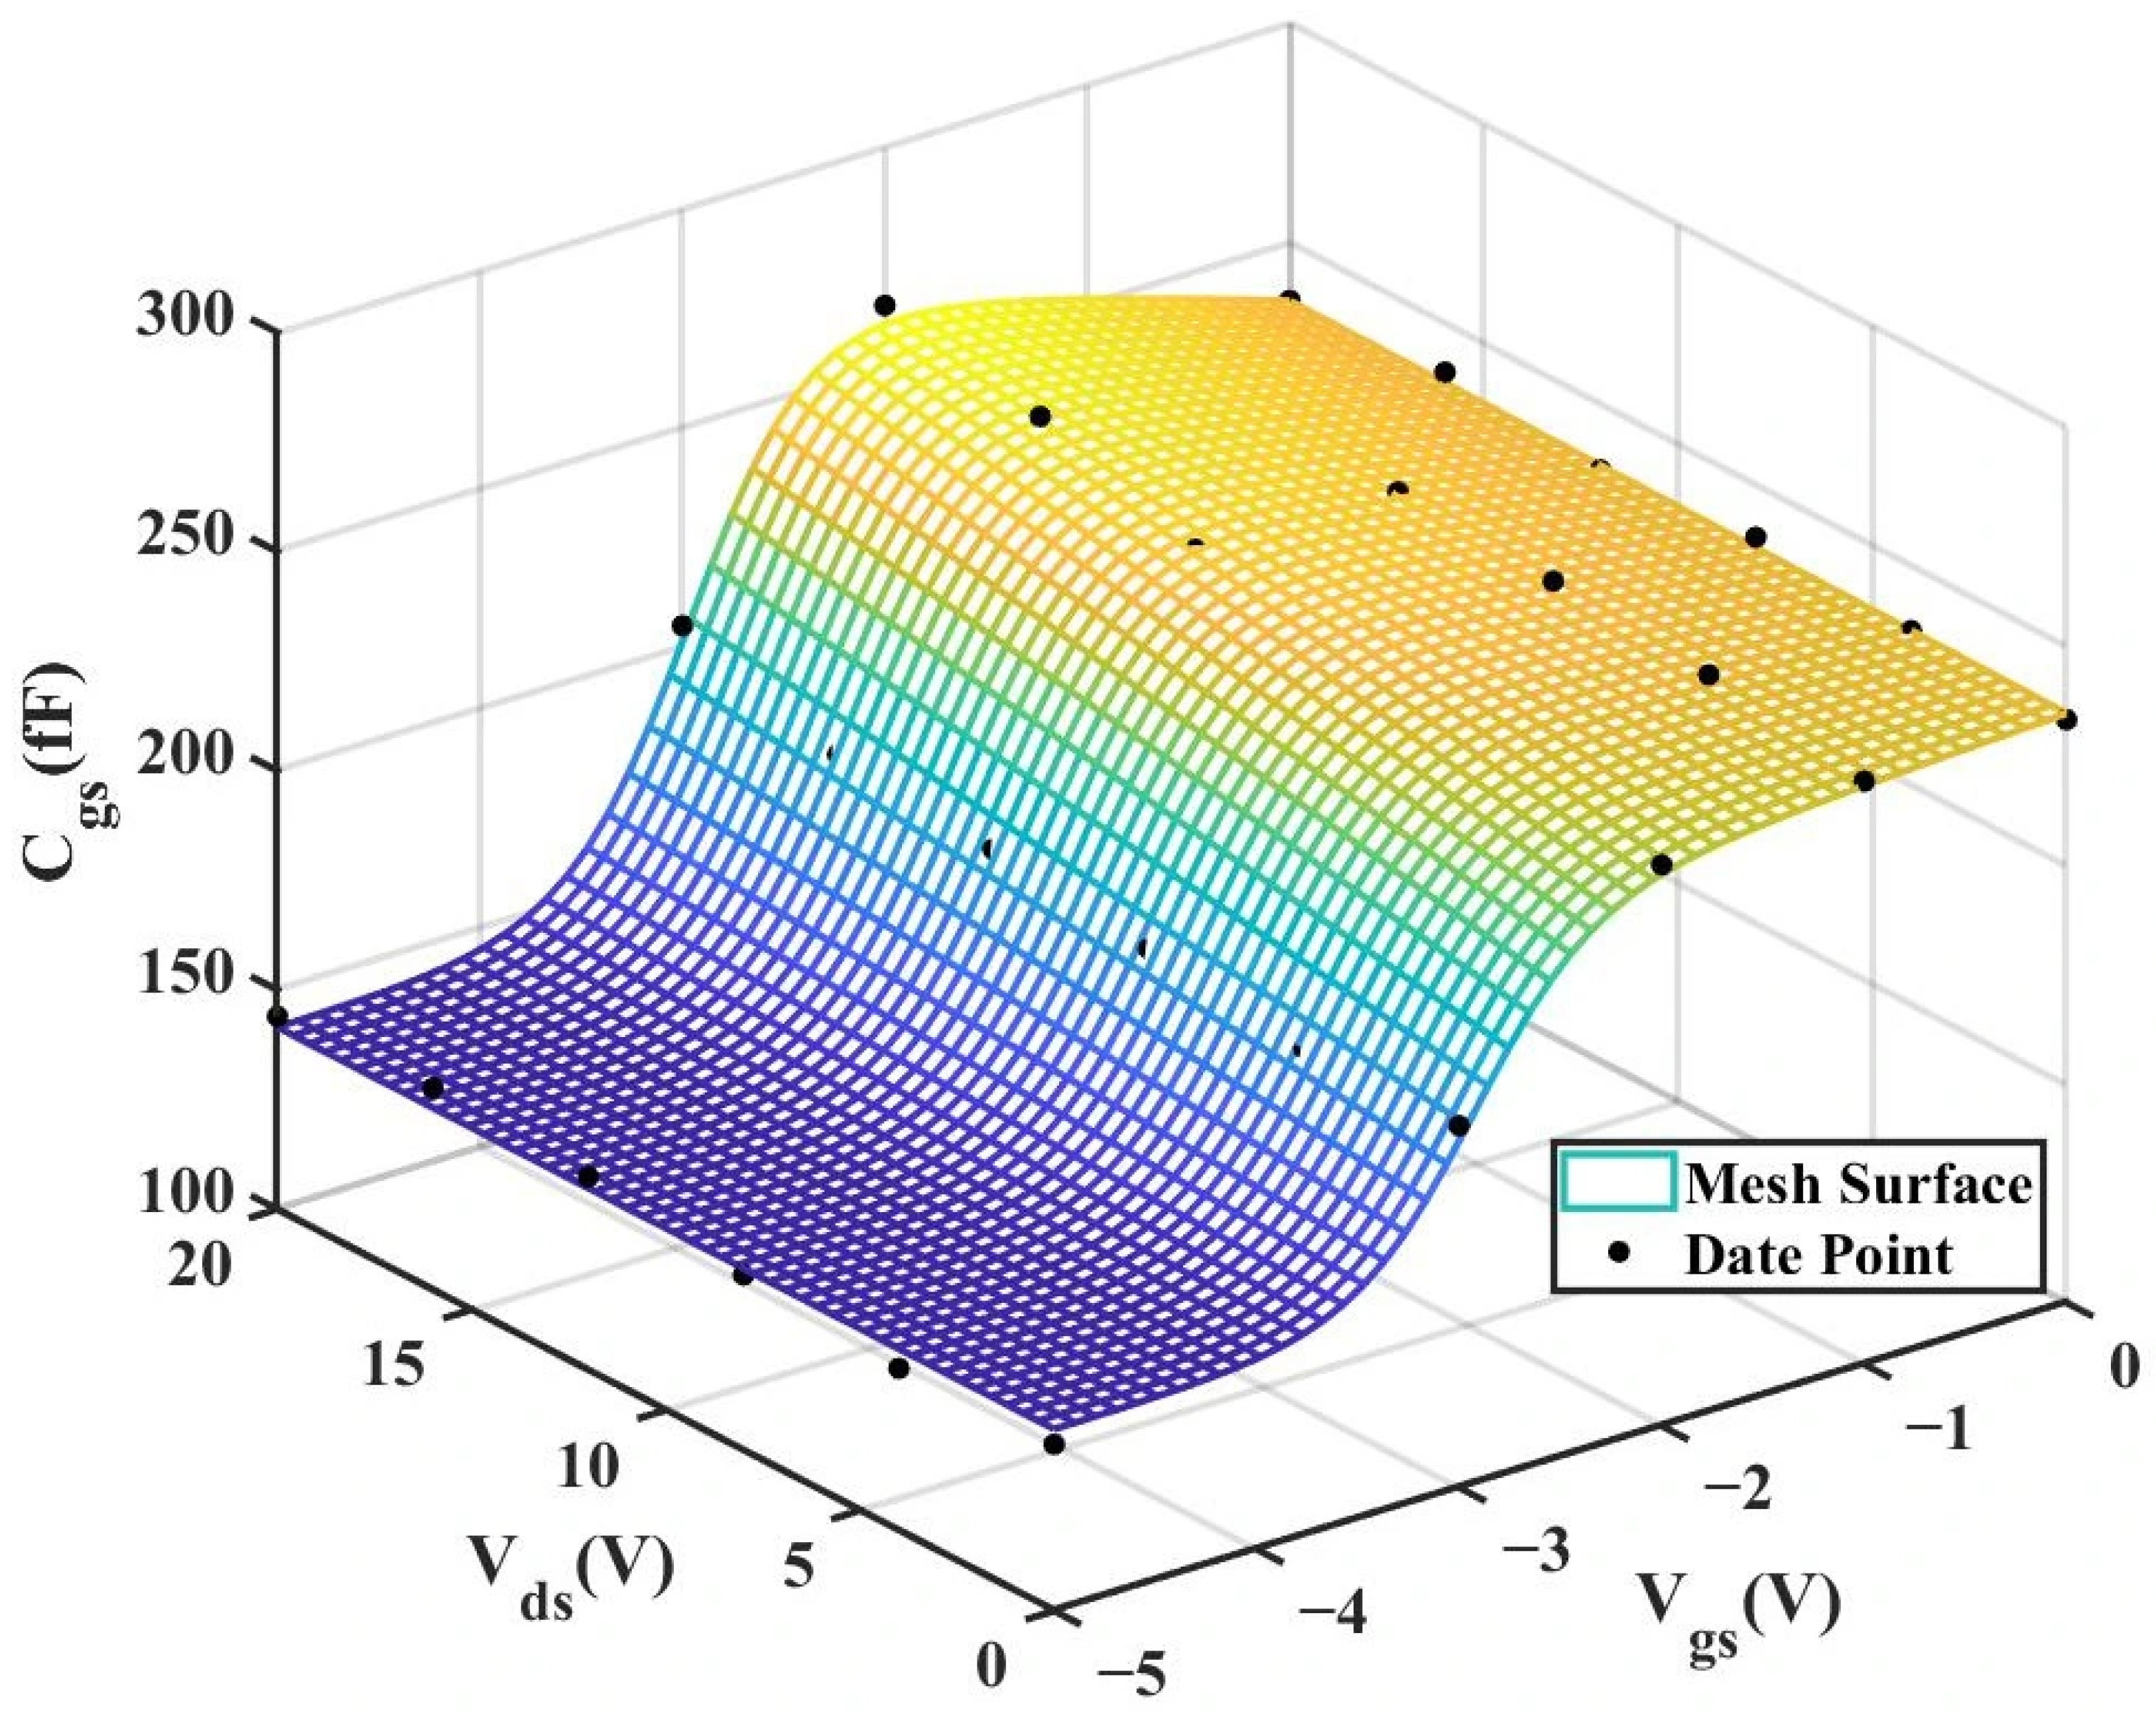
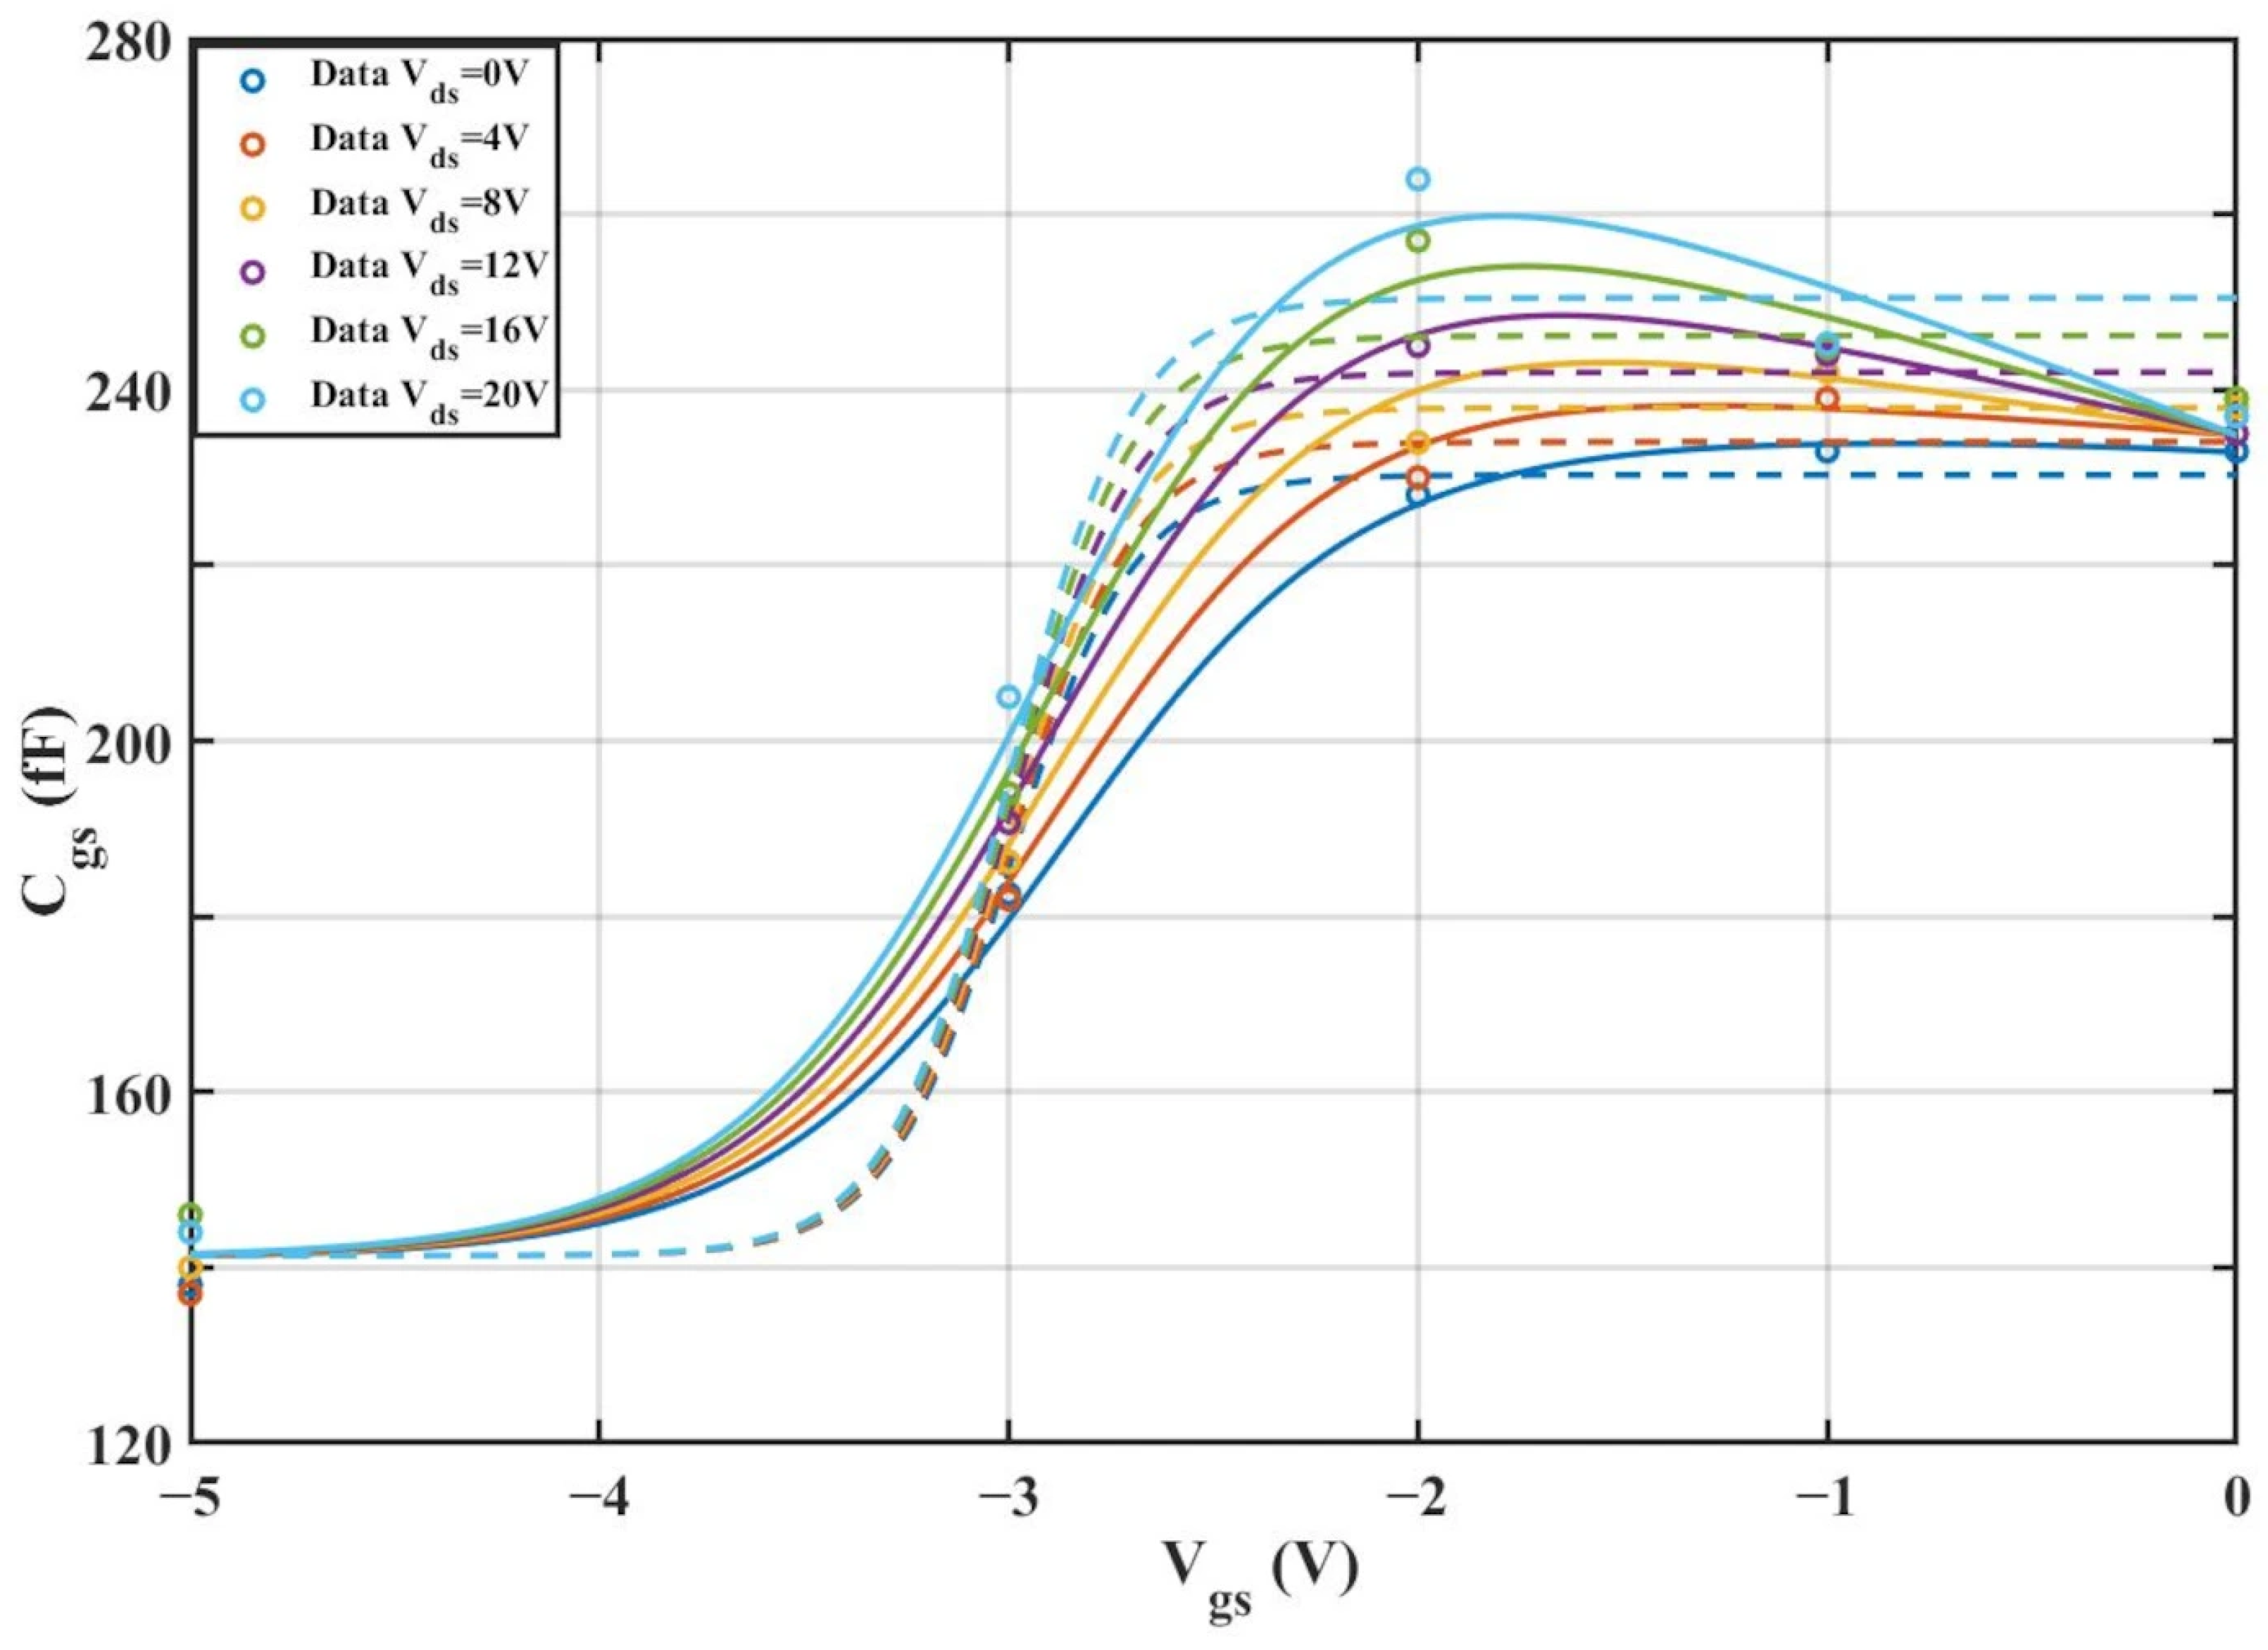
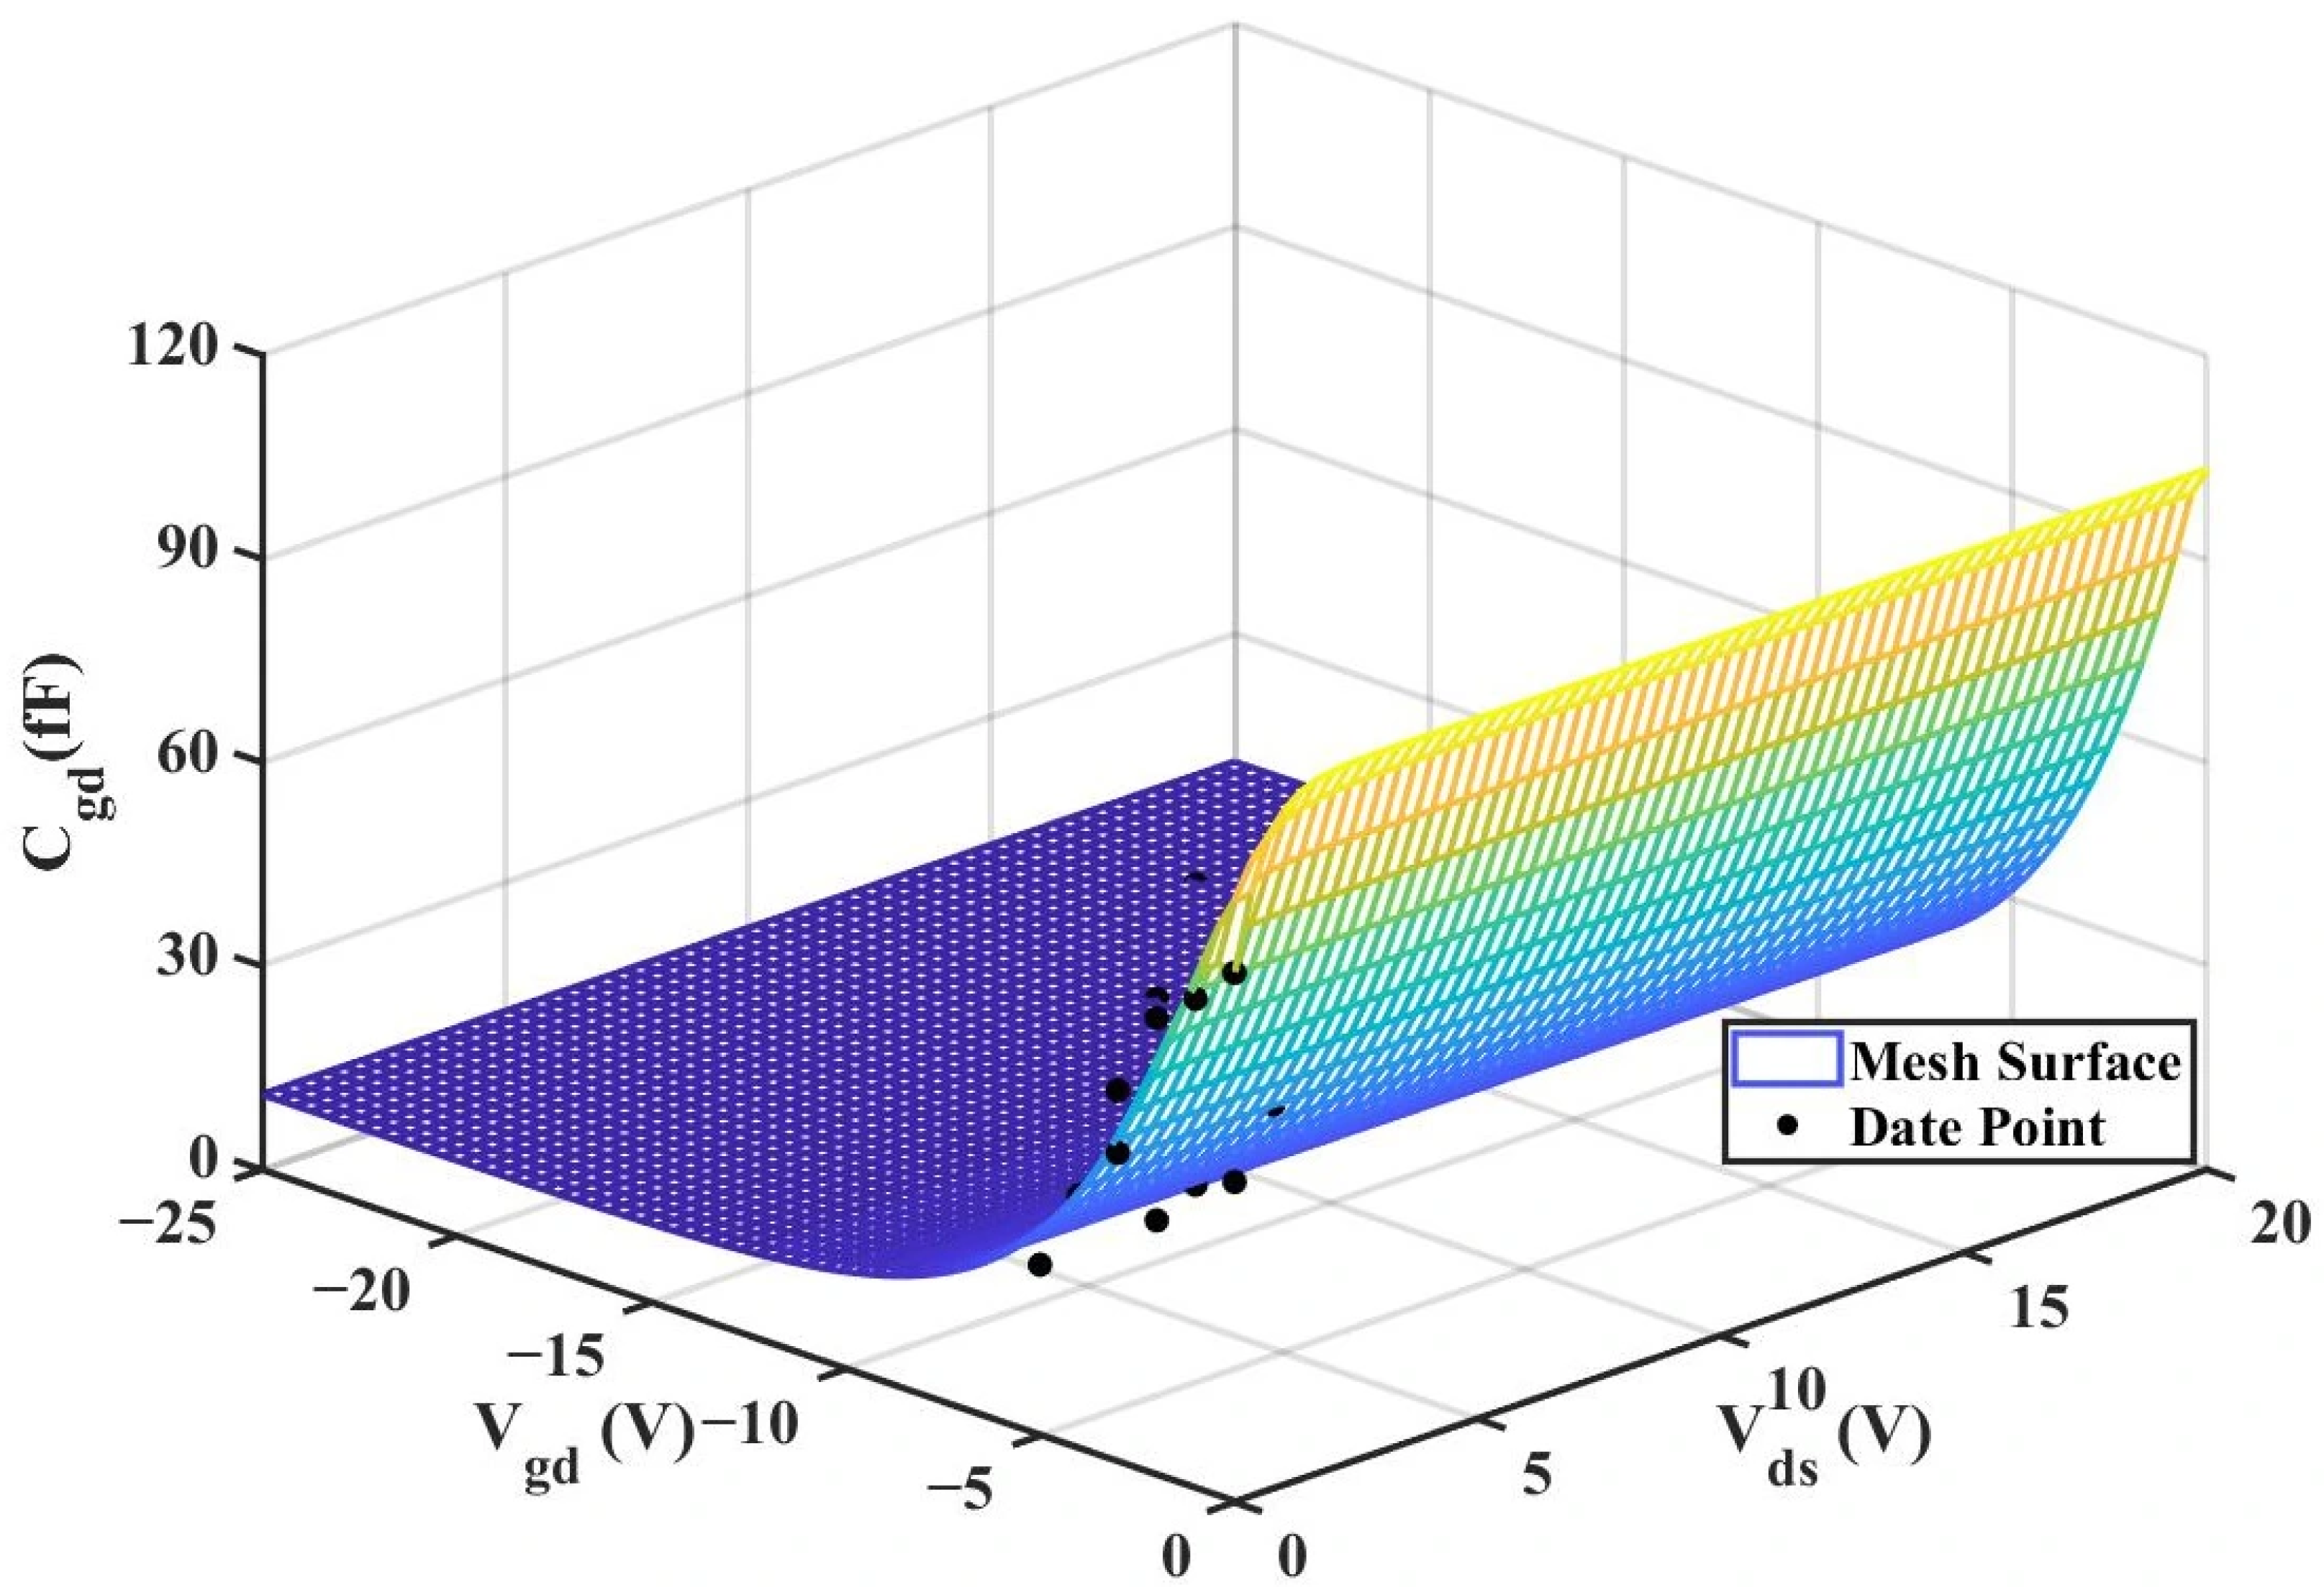
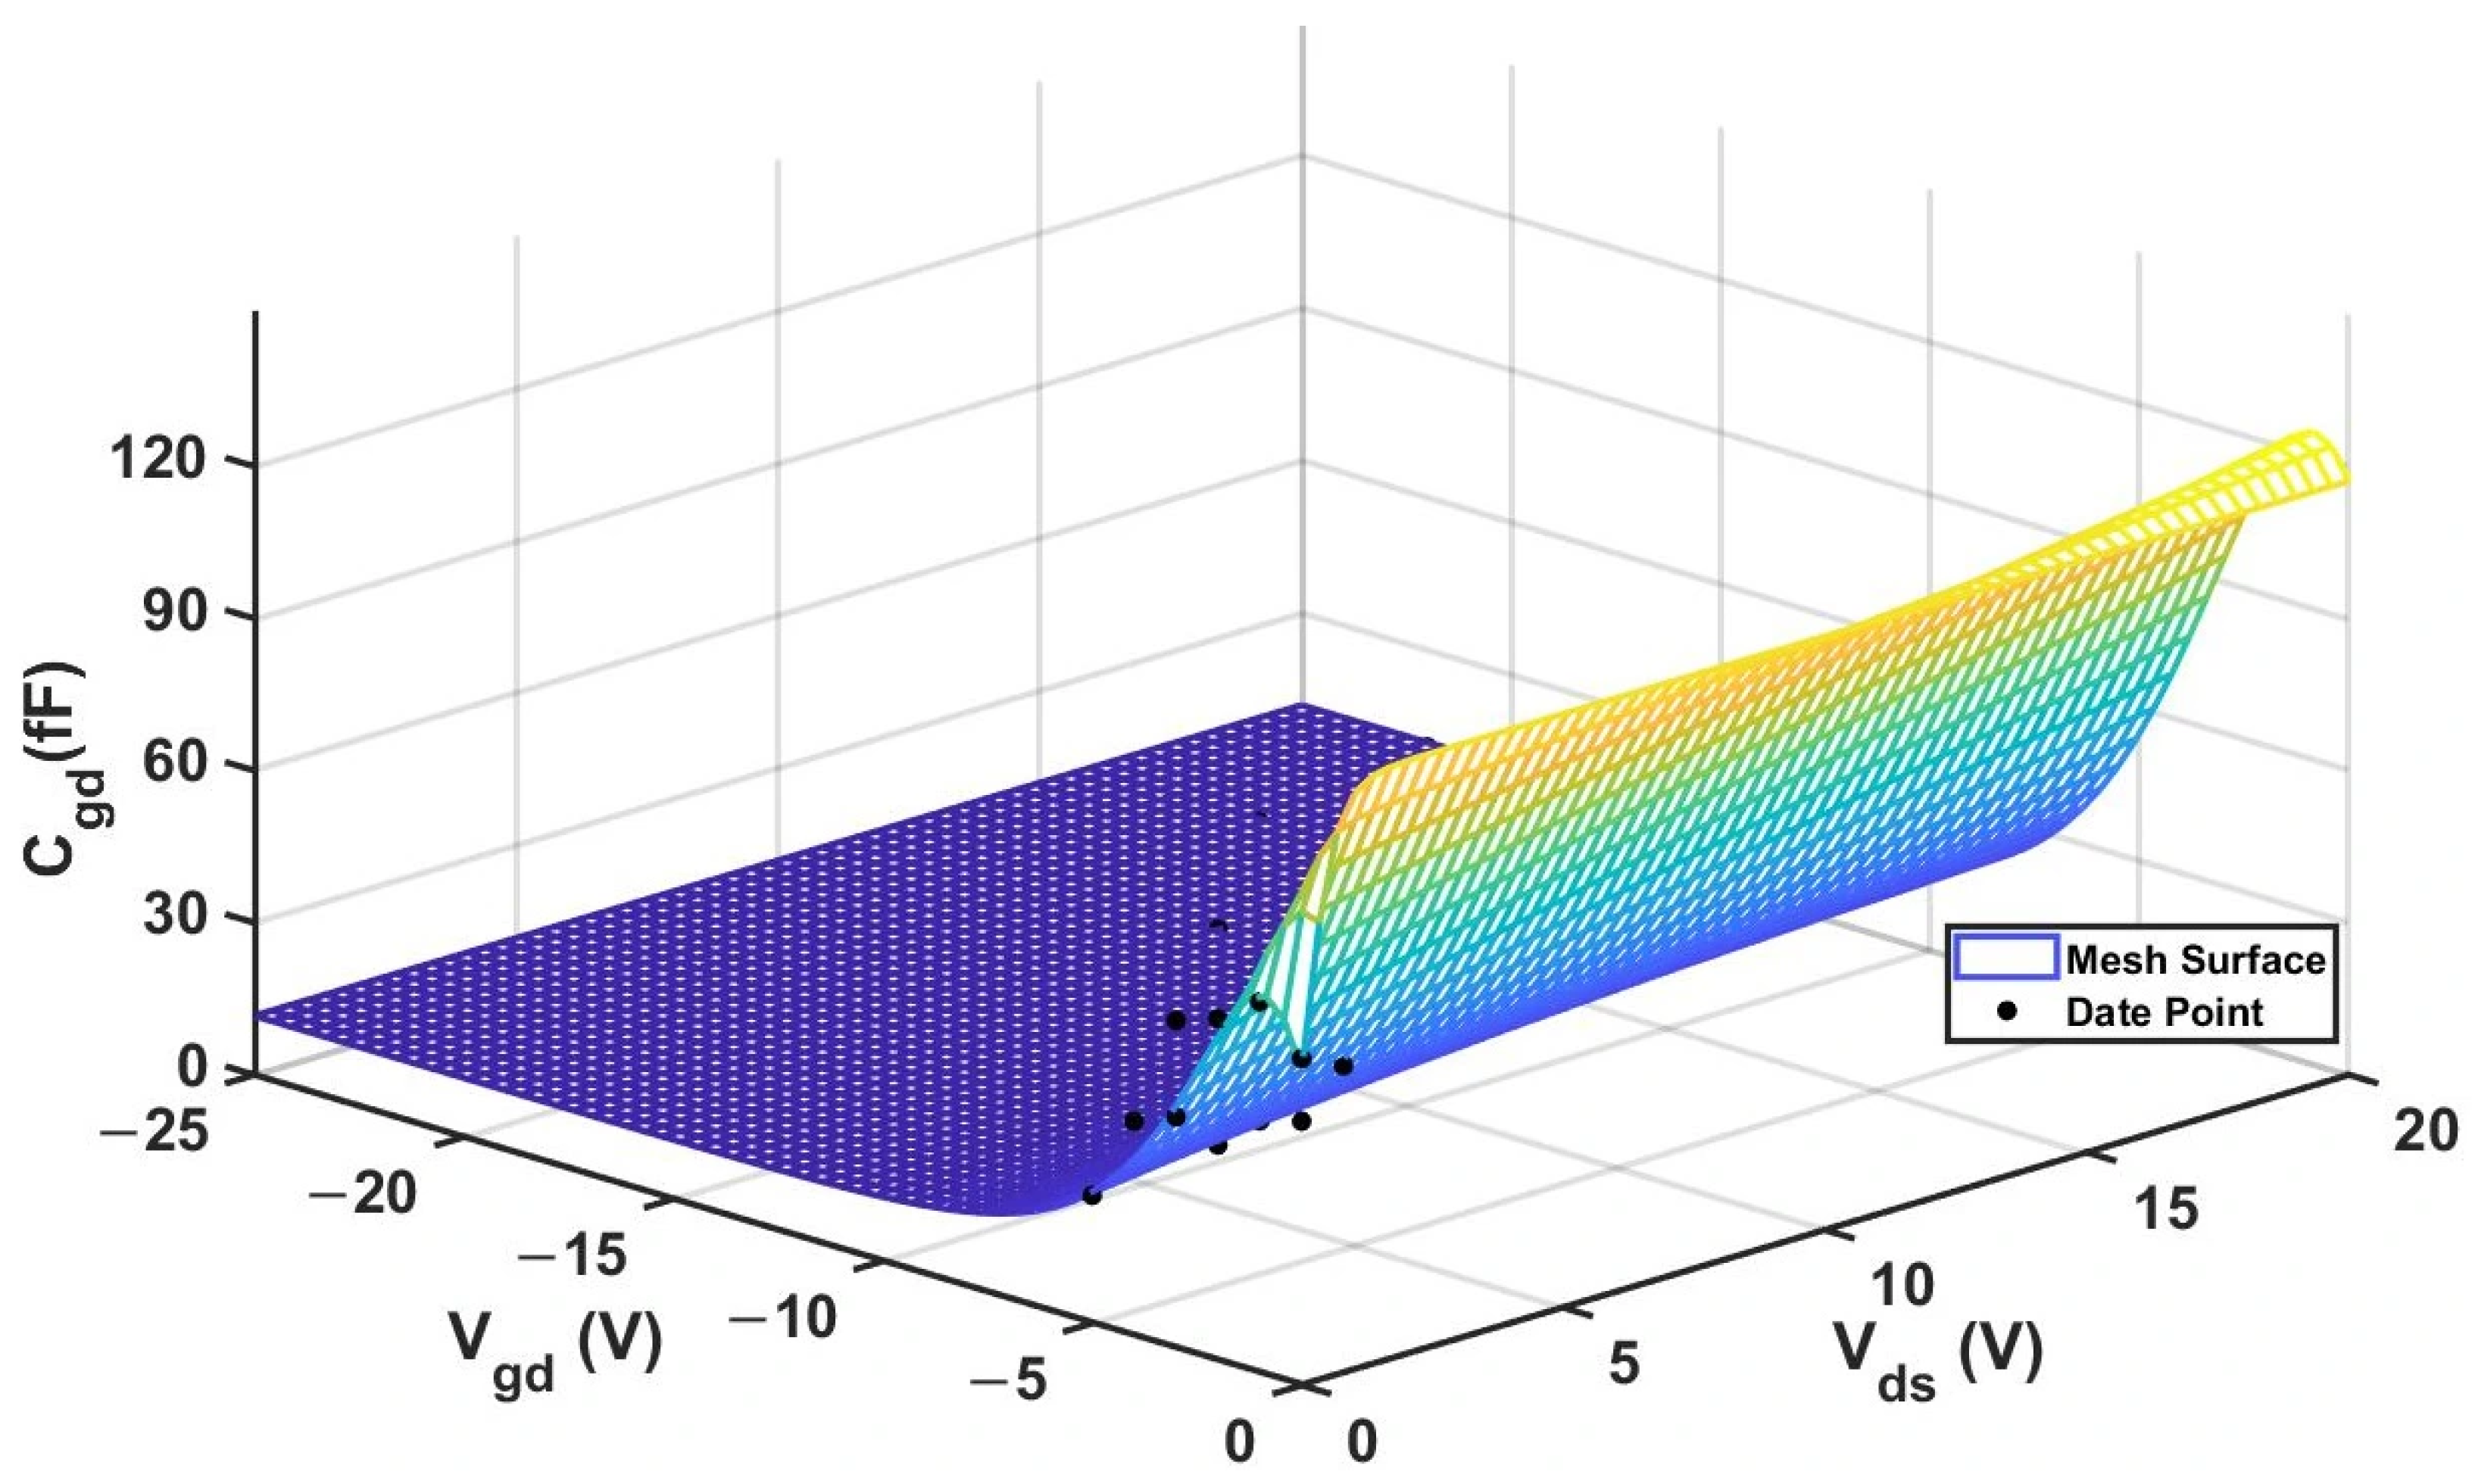
To validate the improved model, the 3D capacitance surfaces of the 4 × 20 μm device for both the original and improved Angelov models are illustrated in
Figure 16 and
Figure 17, respectively. A comparative analysis of their 2D cross-sections (
vs.
) is further provided in
Figure 18.
Figure 16.
3D
(Original 4 × 20 μm Model).
Figure 16.
3D
(Original 4 × 20 μm Model).
Figure 17.
3D
(Improved 4 × 20 μm Model).
Figure 17.
3D
(Improved 4 × 20 μm Model).
Figure 18.
Comparison of Original and Improved Models for
vs.
(4 × 20 μm).
Figure 18.
Comparison of Original and Improved Models for
vs.
(4 × 20 μm).
From the above experiments, it can be observed that the improved model still exhibits excellent performance under the dimension of 4 × 20 μm. Compared with the traditional Angelov model, the improved model features higher precision and a better fitting effect with the actual values, enabling it to more accurately depict the nonlinear capacitance characteristics of GaN HEMTs.
We then input the experimental data of
(with a size of 4 × 20 μm) into the new model. The optimized parameter values are shown in
Table 9 below, and the experimental comparison results are presented in
Table 10 below.
By comparing the results of the
comparison, we can also find that the improved model exhibits a much better fitting effect than the traditional Angelov model, and the fitting results are closer to the actual values.
Figure 19 below shows the 3D surface plot of
.
