Figure 1.
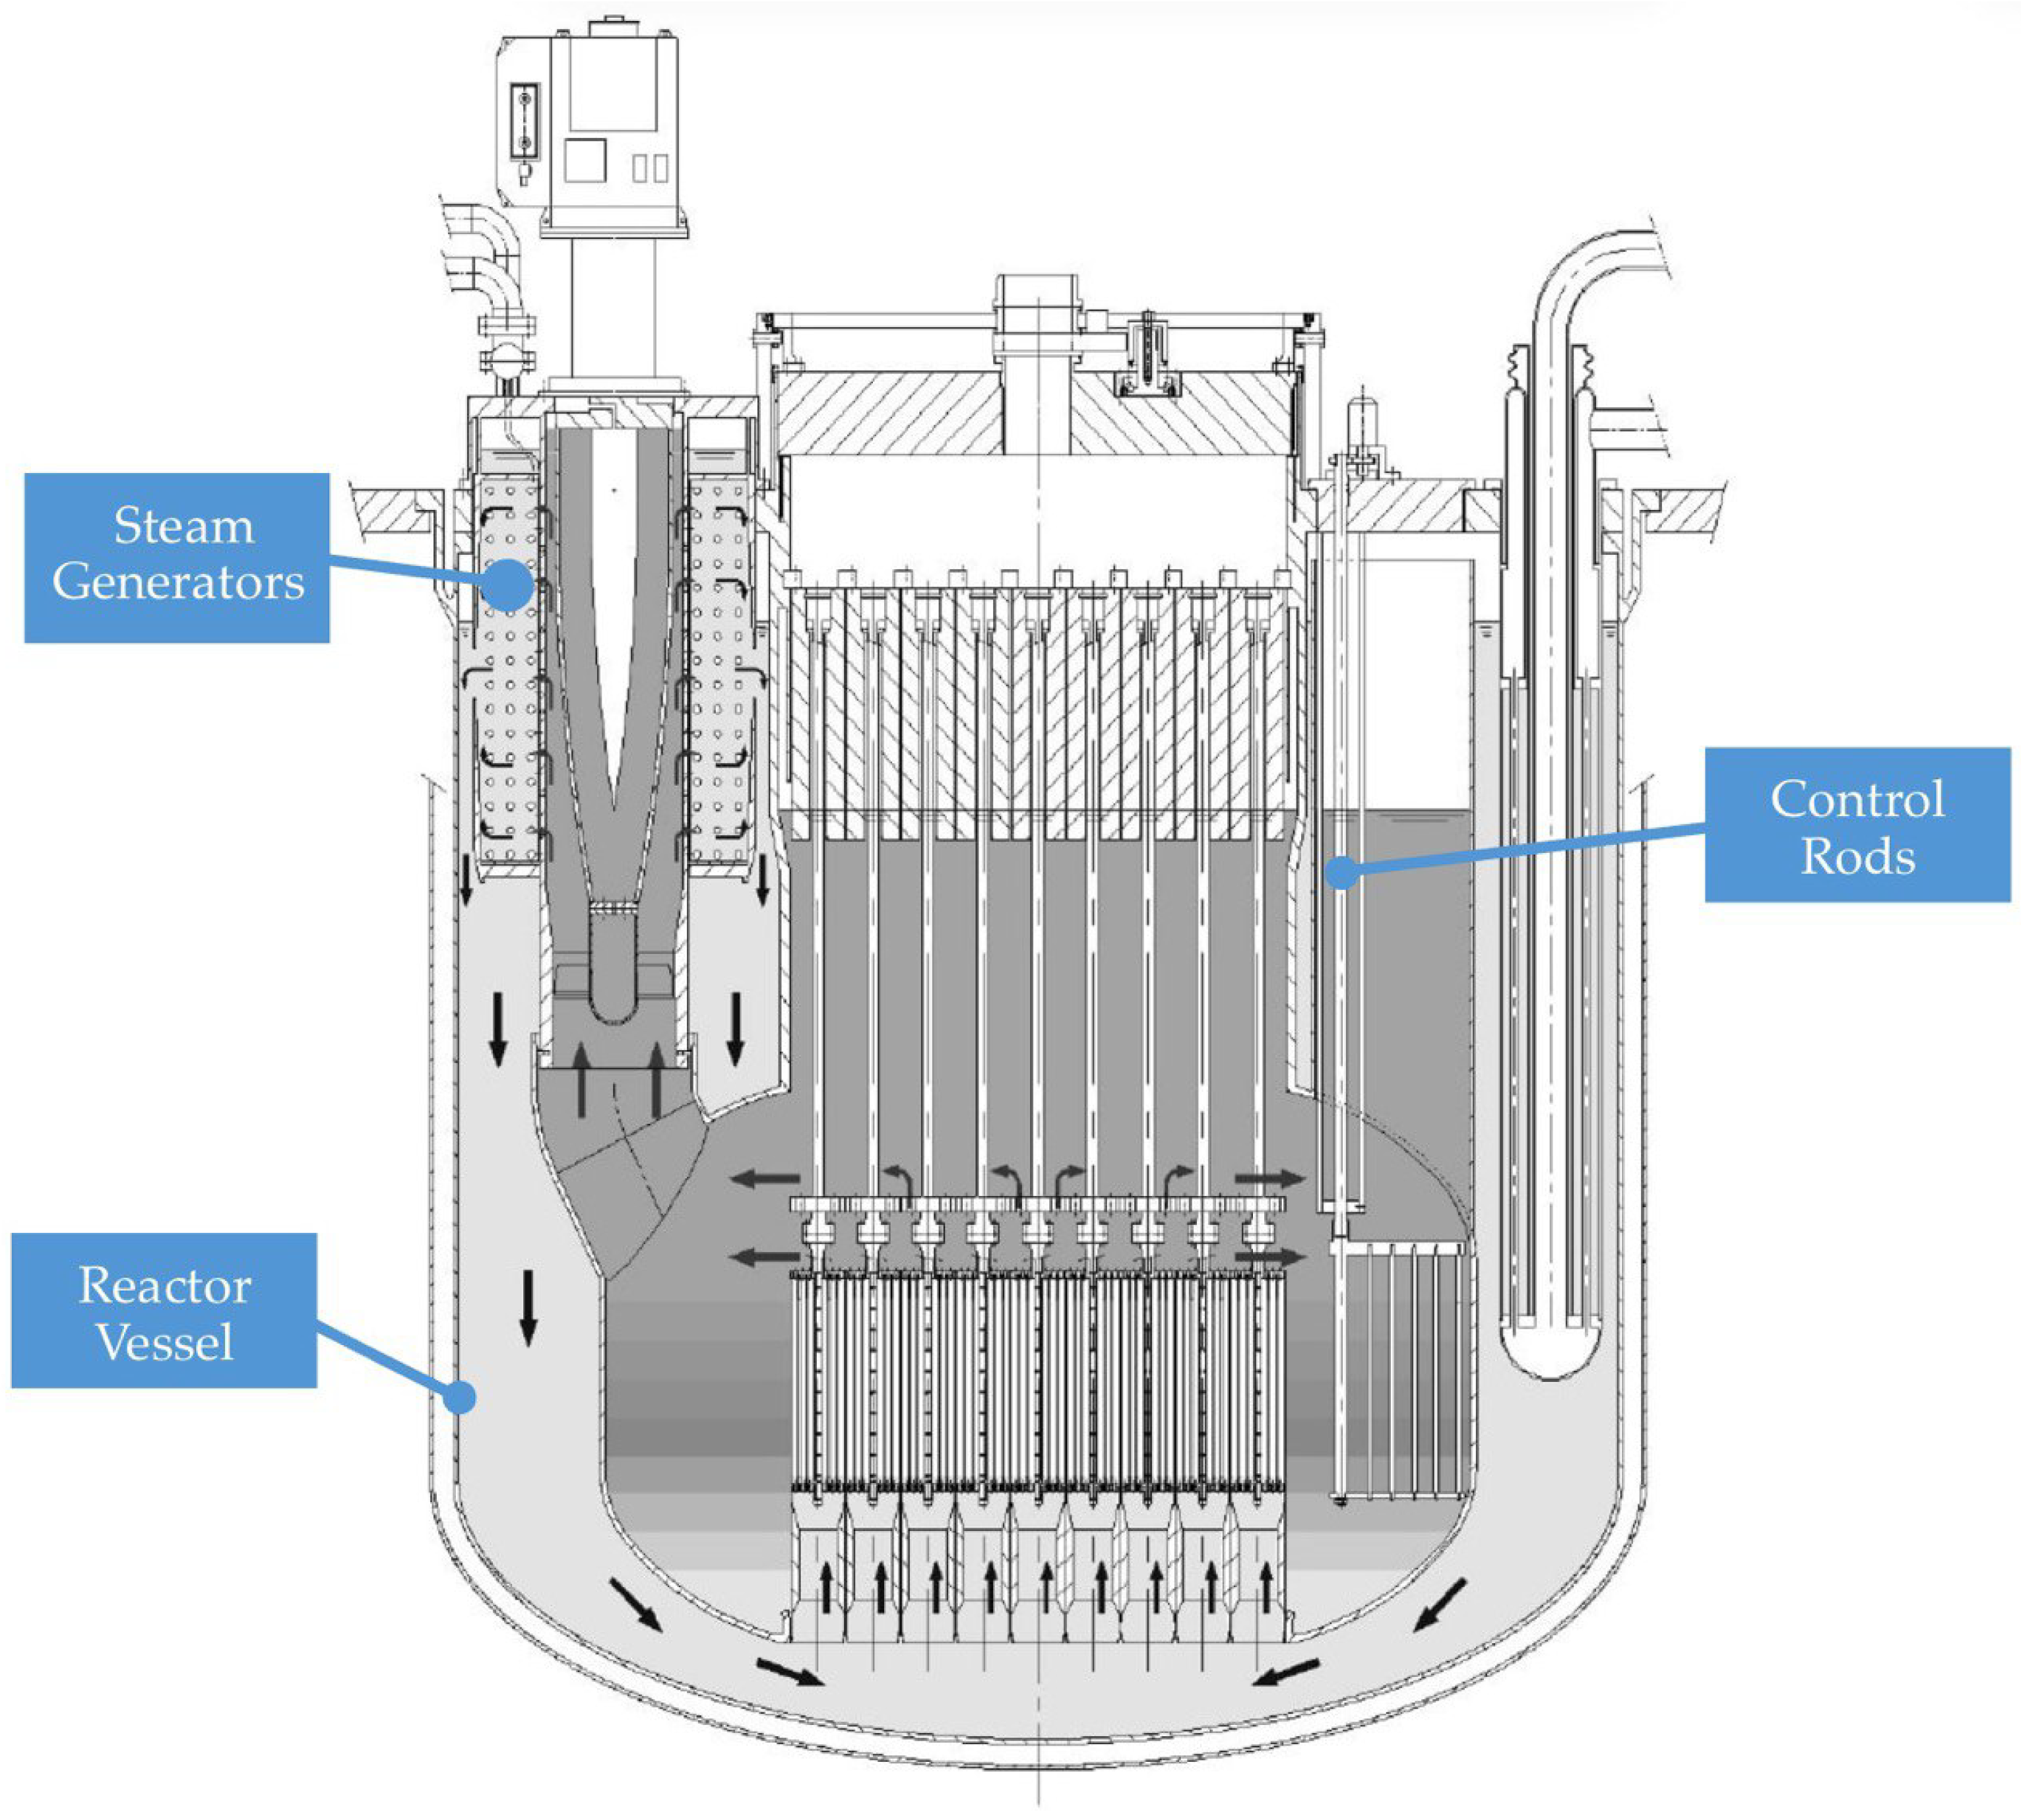
Design schematic of newcleo’s LFR-AS-200, highlighting the three key components analyzed in this study: the reactor vessel, control rods, and steam generator.
Figure 1.
Design schematic of newcleo’s LFR-AS-200, highlighting the three key components analyzed in this study: the reactor vessel, control rods, and steam generator.
Figure 2.
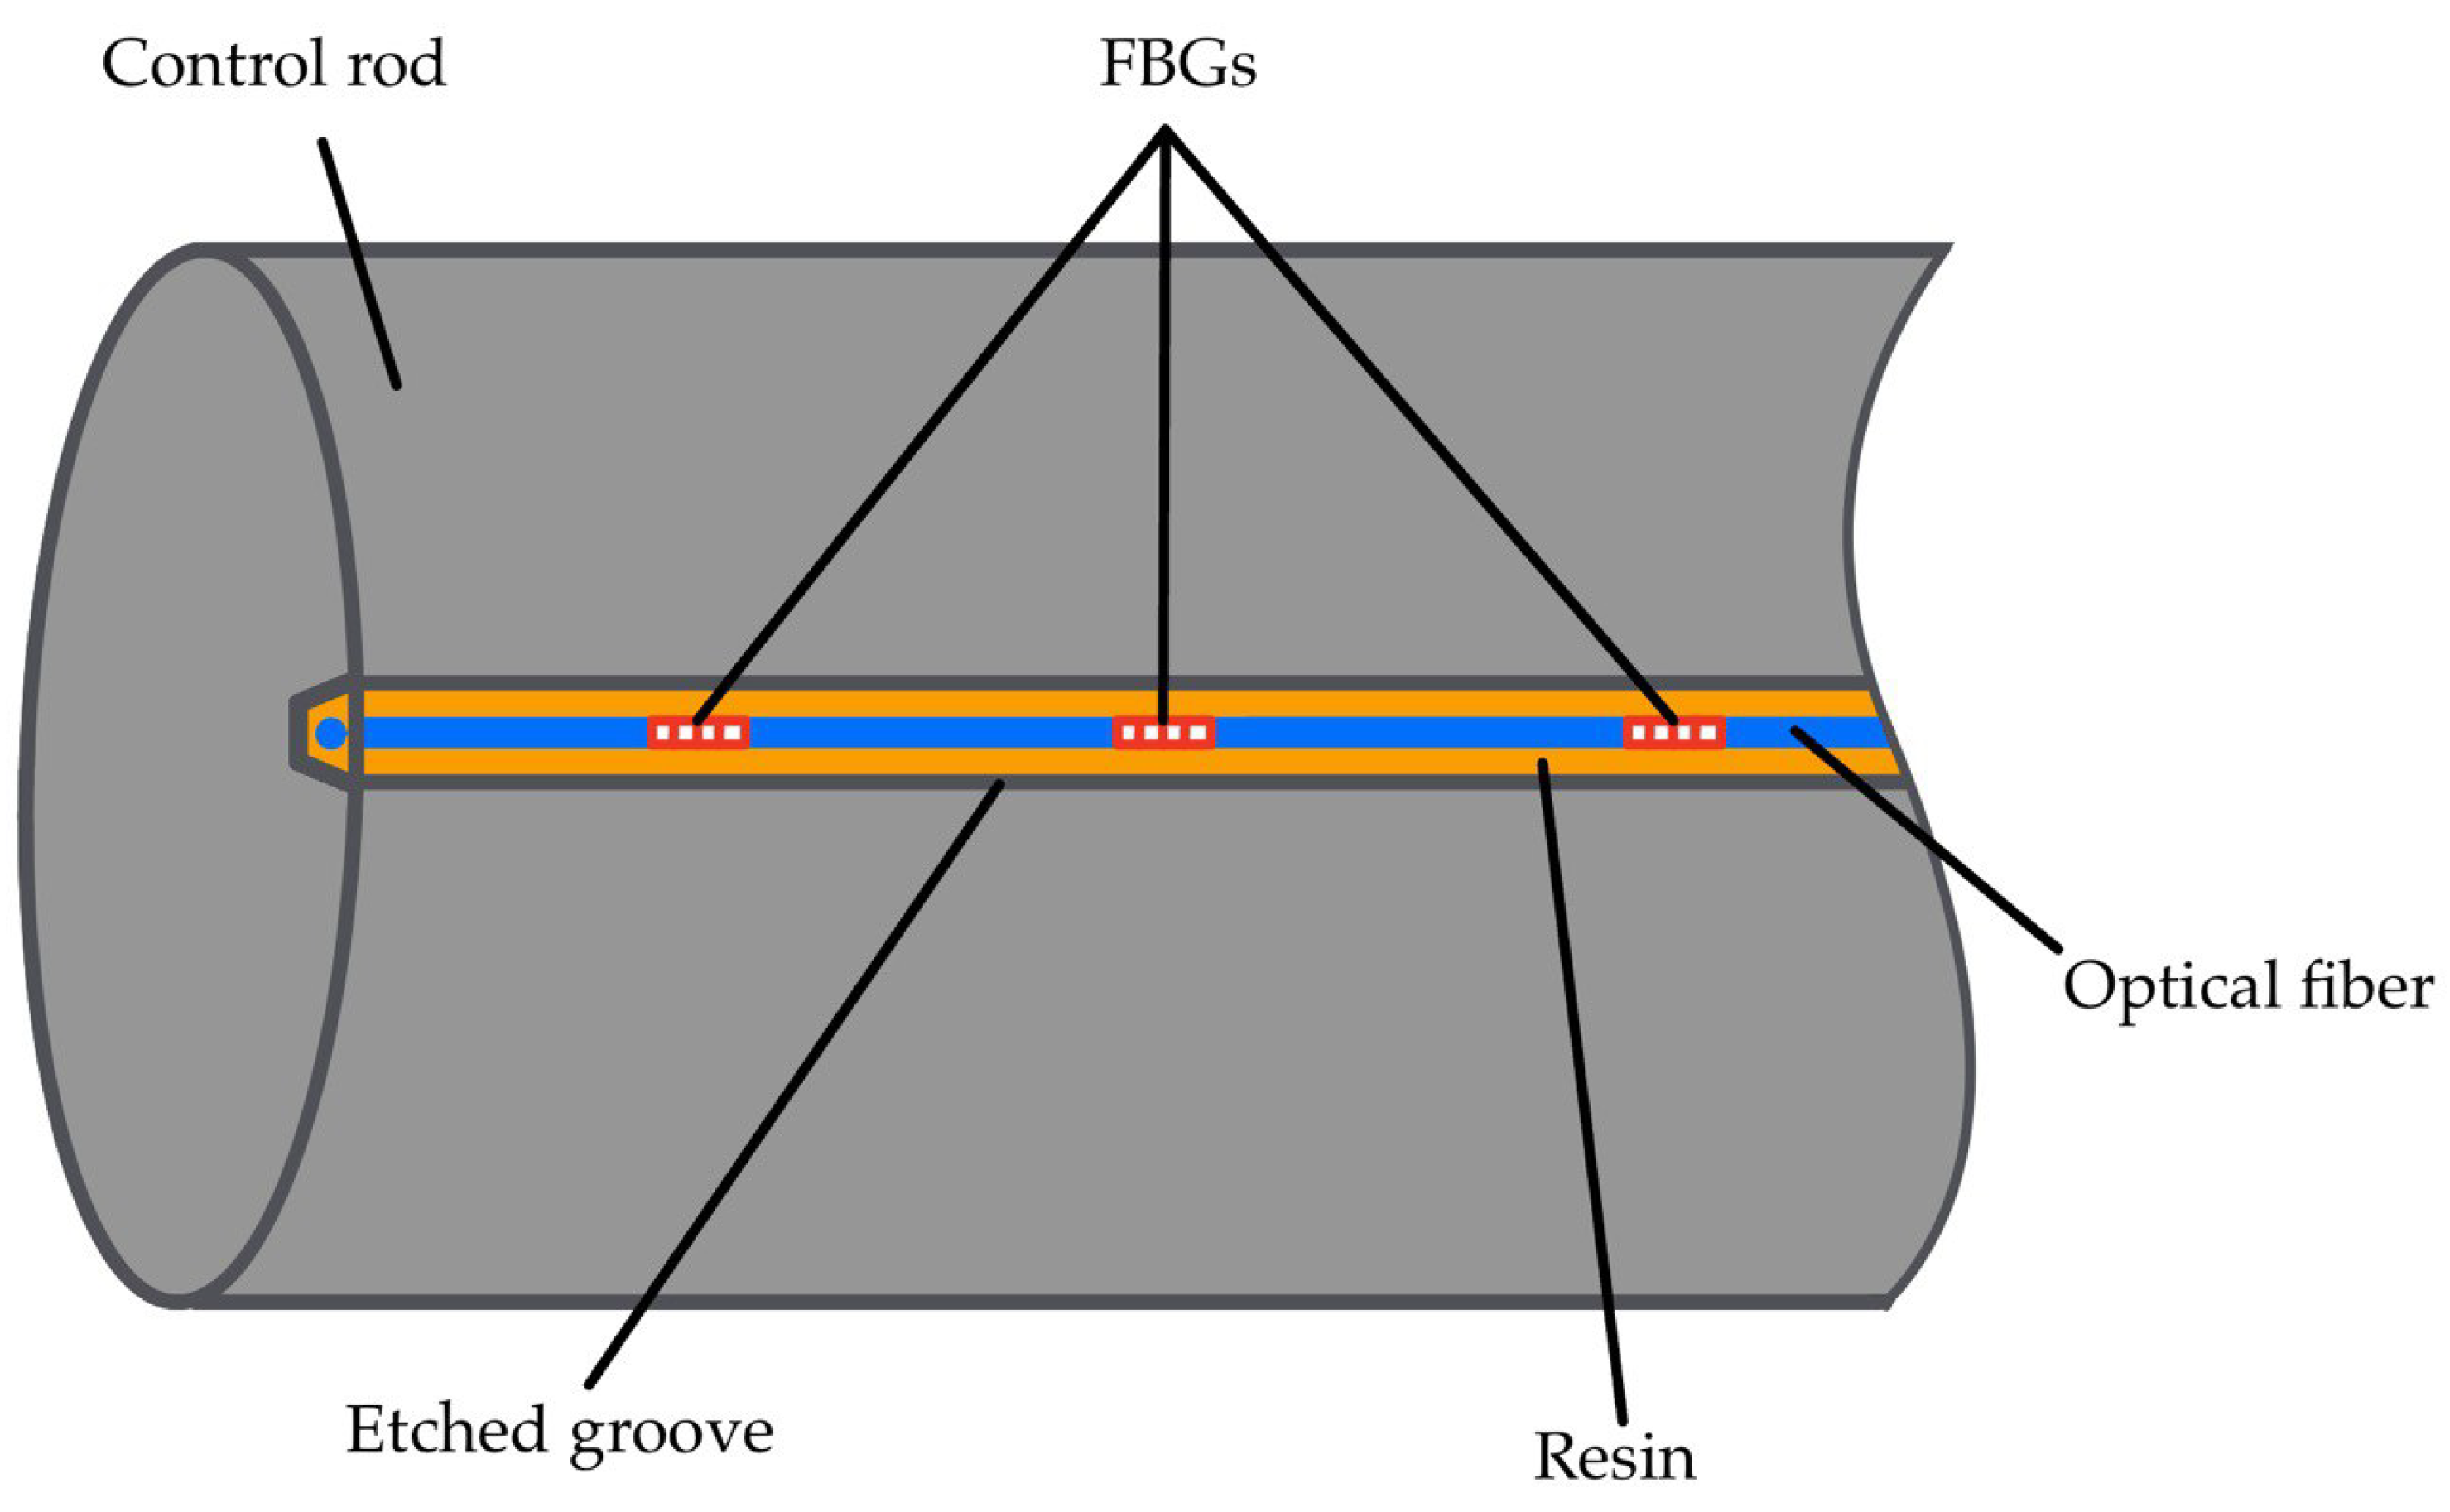
Schematic of a possible optical fiber integration onto a control rod. Optical fiber (blue) is embedded within a machined groove (gray borders), filled with high-temperature, radiation-resistant resin (orange), and possibly encased in a stainless steel tube. The fiber incorporates multiple FBGs (red) for distributed temperature monitoring along the control rod (gray). This multi-layered arrangement ensures protection from molten lead, mechanical stresses, thermal expansion mismatch, and radiation while enabling reliable FBG-based sensing. A similar design, though developed for a different application, was reported by De Pauw et al. [
57].
Figure 3.
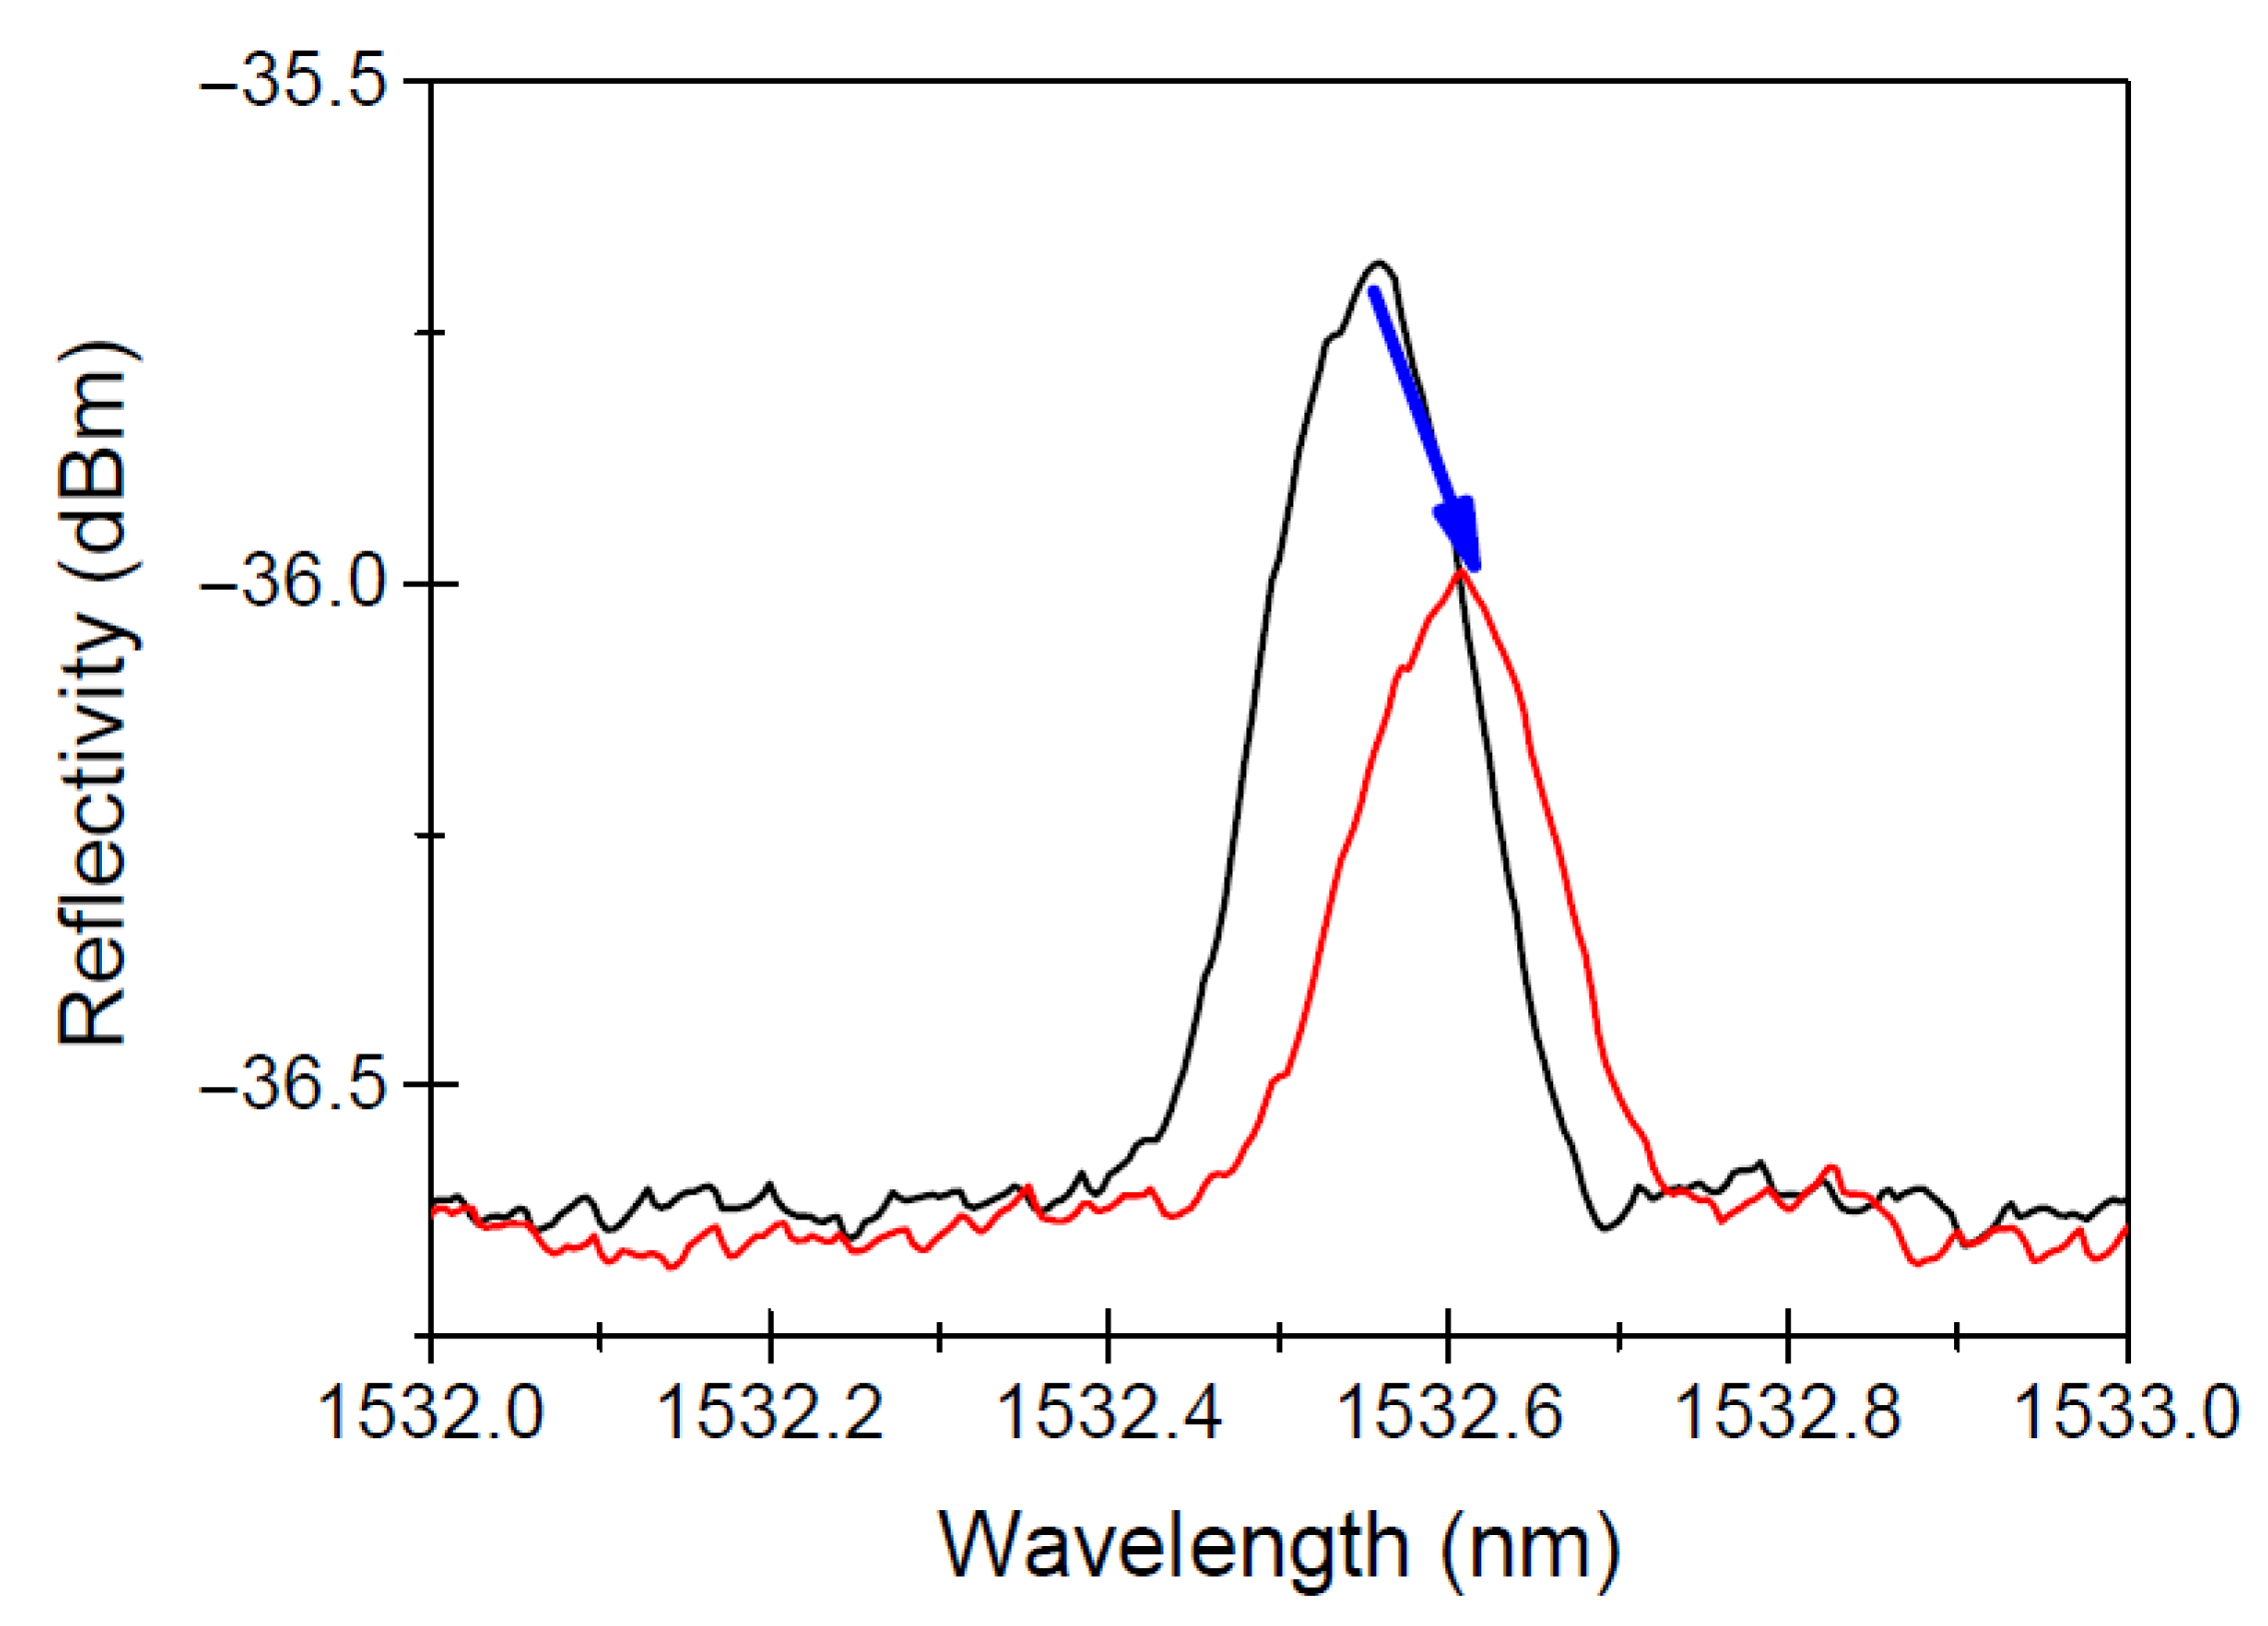
An example of the radiation-induced effects on a Bragg peak reflection spectrum, before (black line) and after (red line) X-ray irradiation at 1.5 MGy at room temperature. The figure highlights the radiation-induced Bragg wavelength shift (RI-BWS) and the reduction of the signal-to-noise ratio, as indicated by the blue arrow. Image reproduced from Morana et al. [
70].
Figure 4.
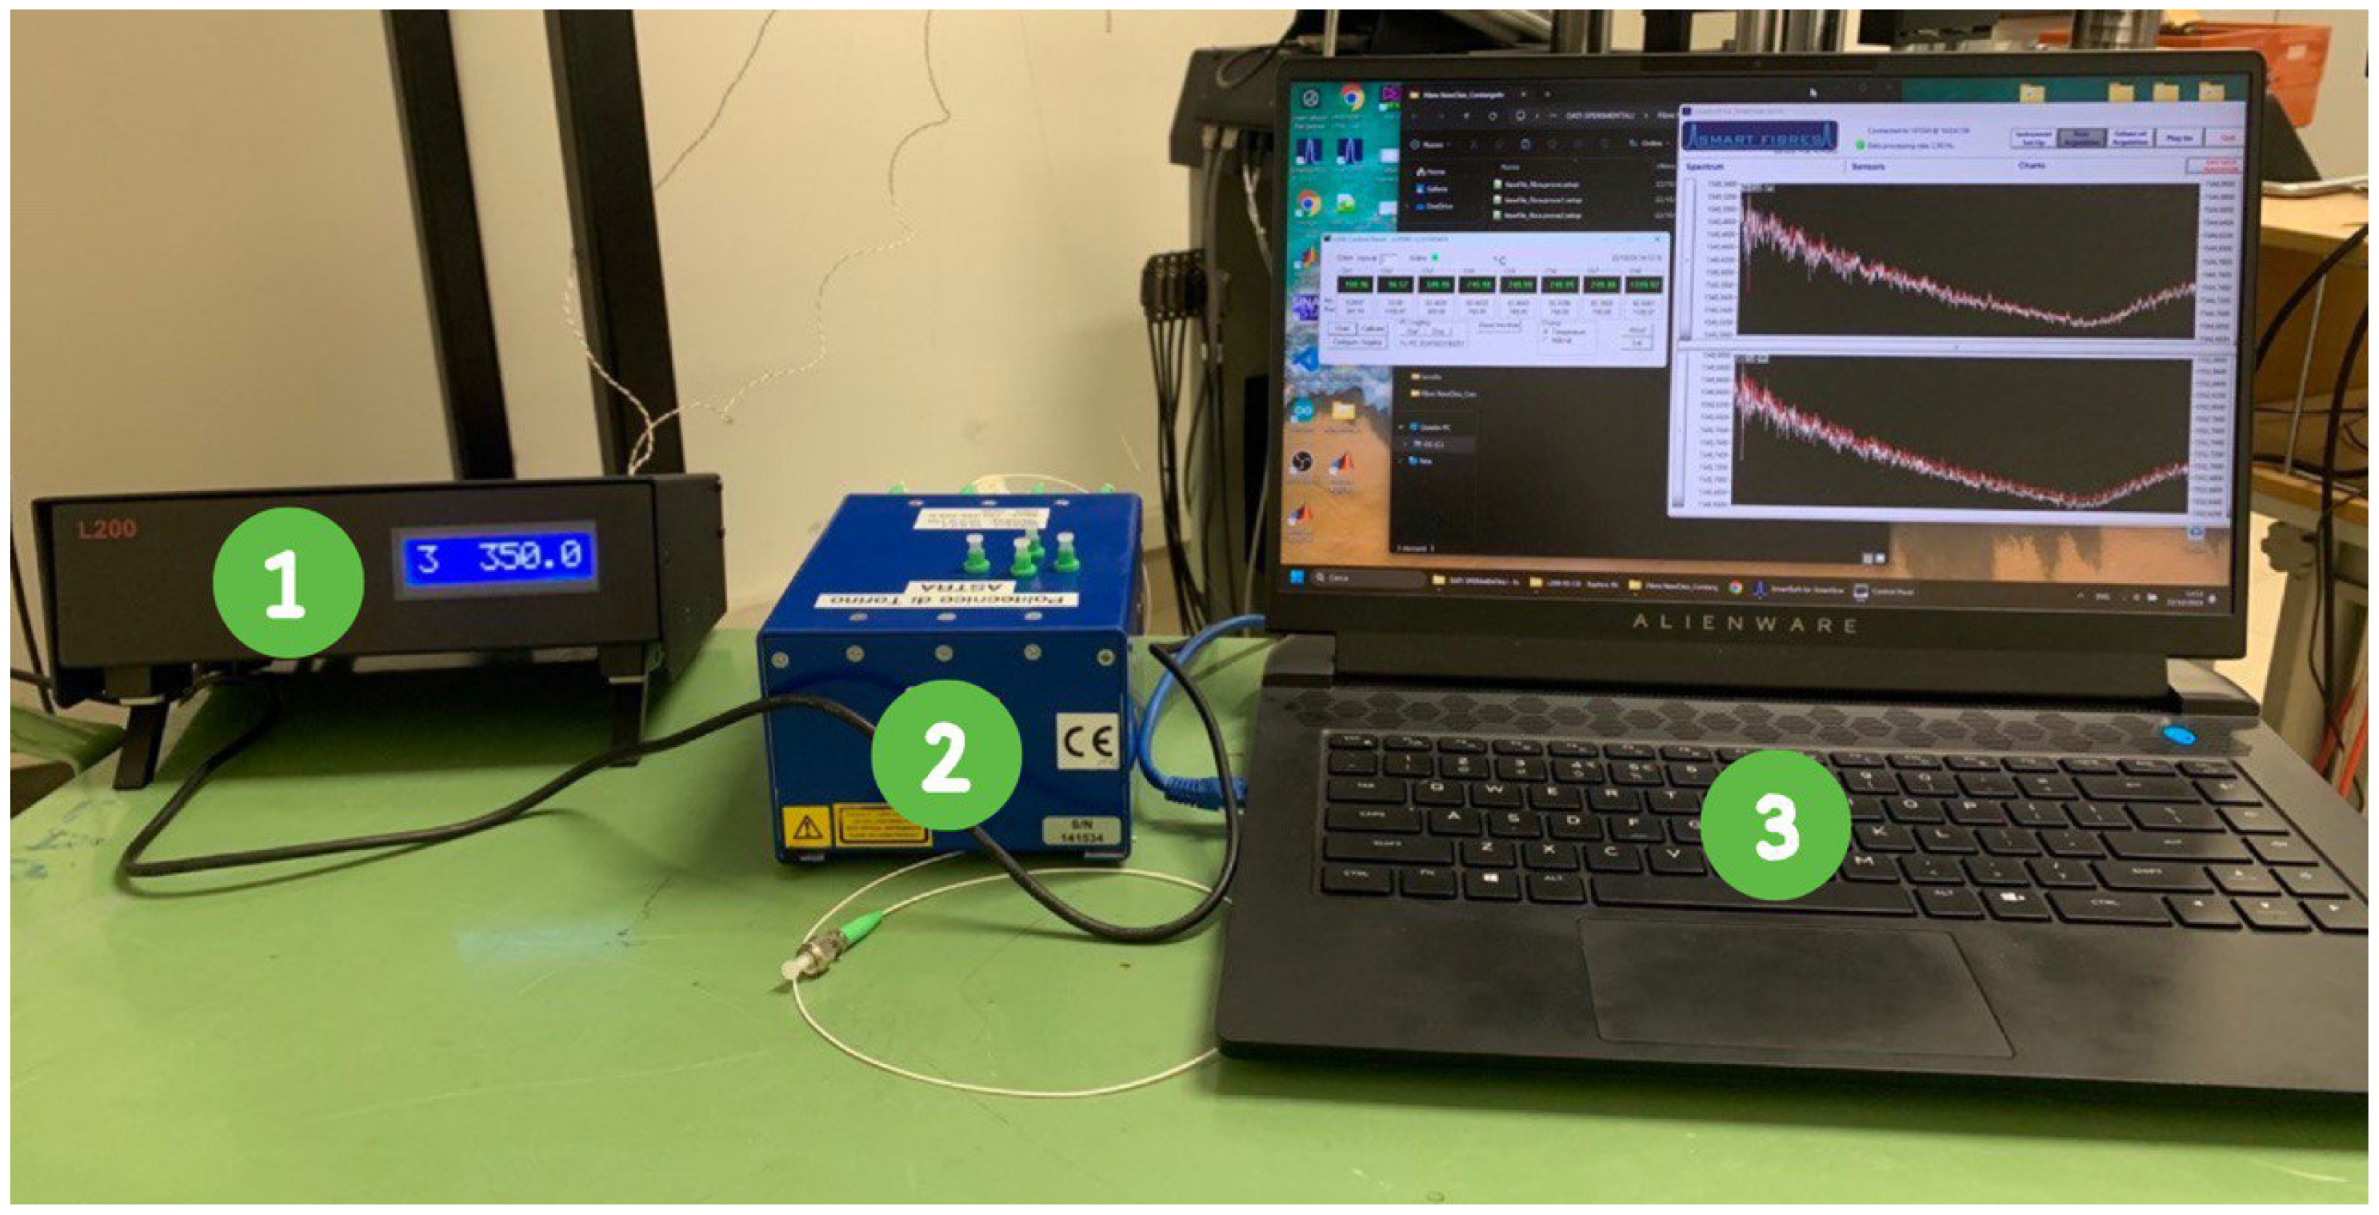
Laboratory setup: (1) thermocouple reader, (2) SmartScan SBI interrogator, (3) control PC.
Figure 4.
Laboratory setup: (1) thermocouple reader, (2) SmartScan SBI interrogator, (3) control PC.
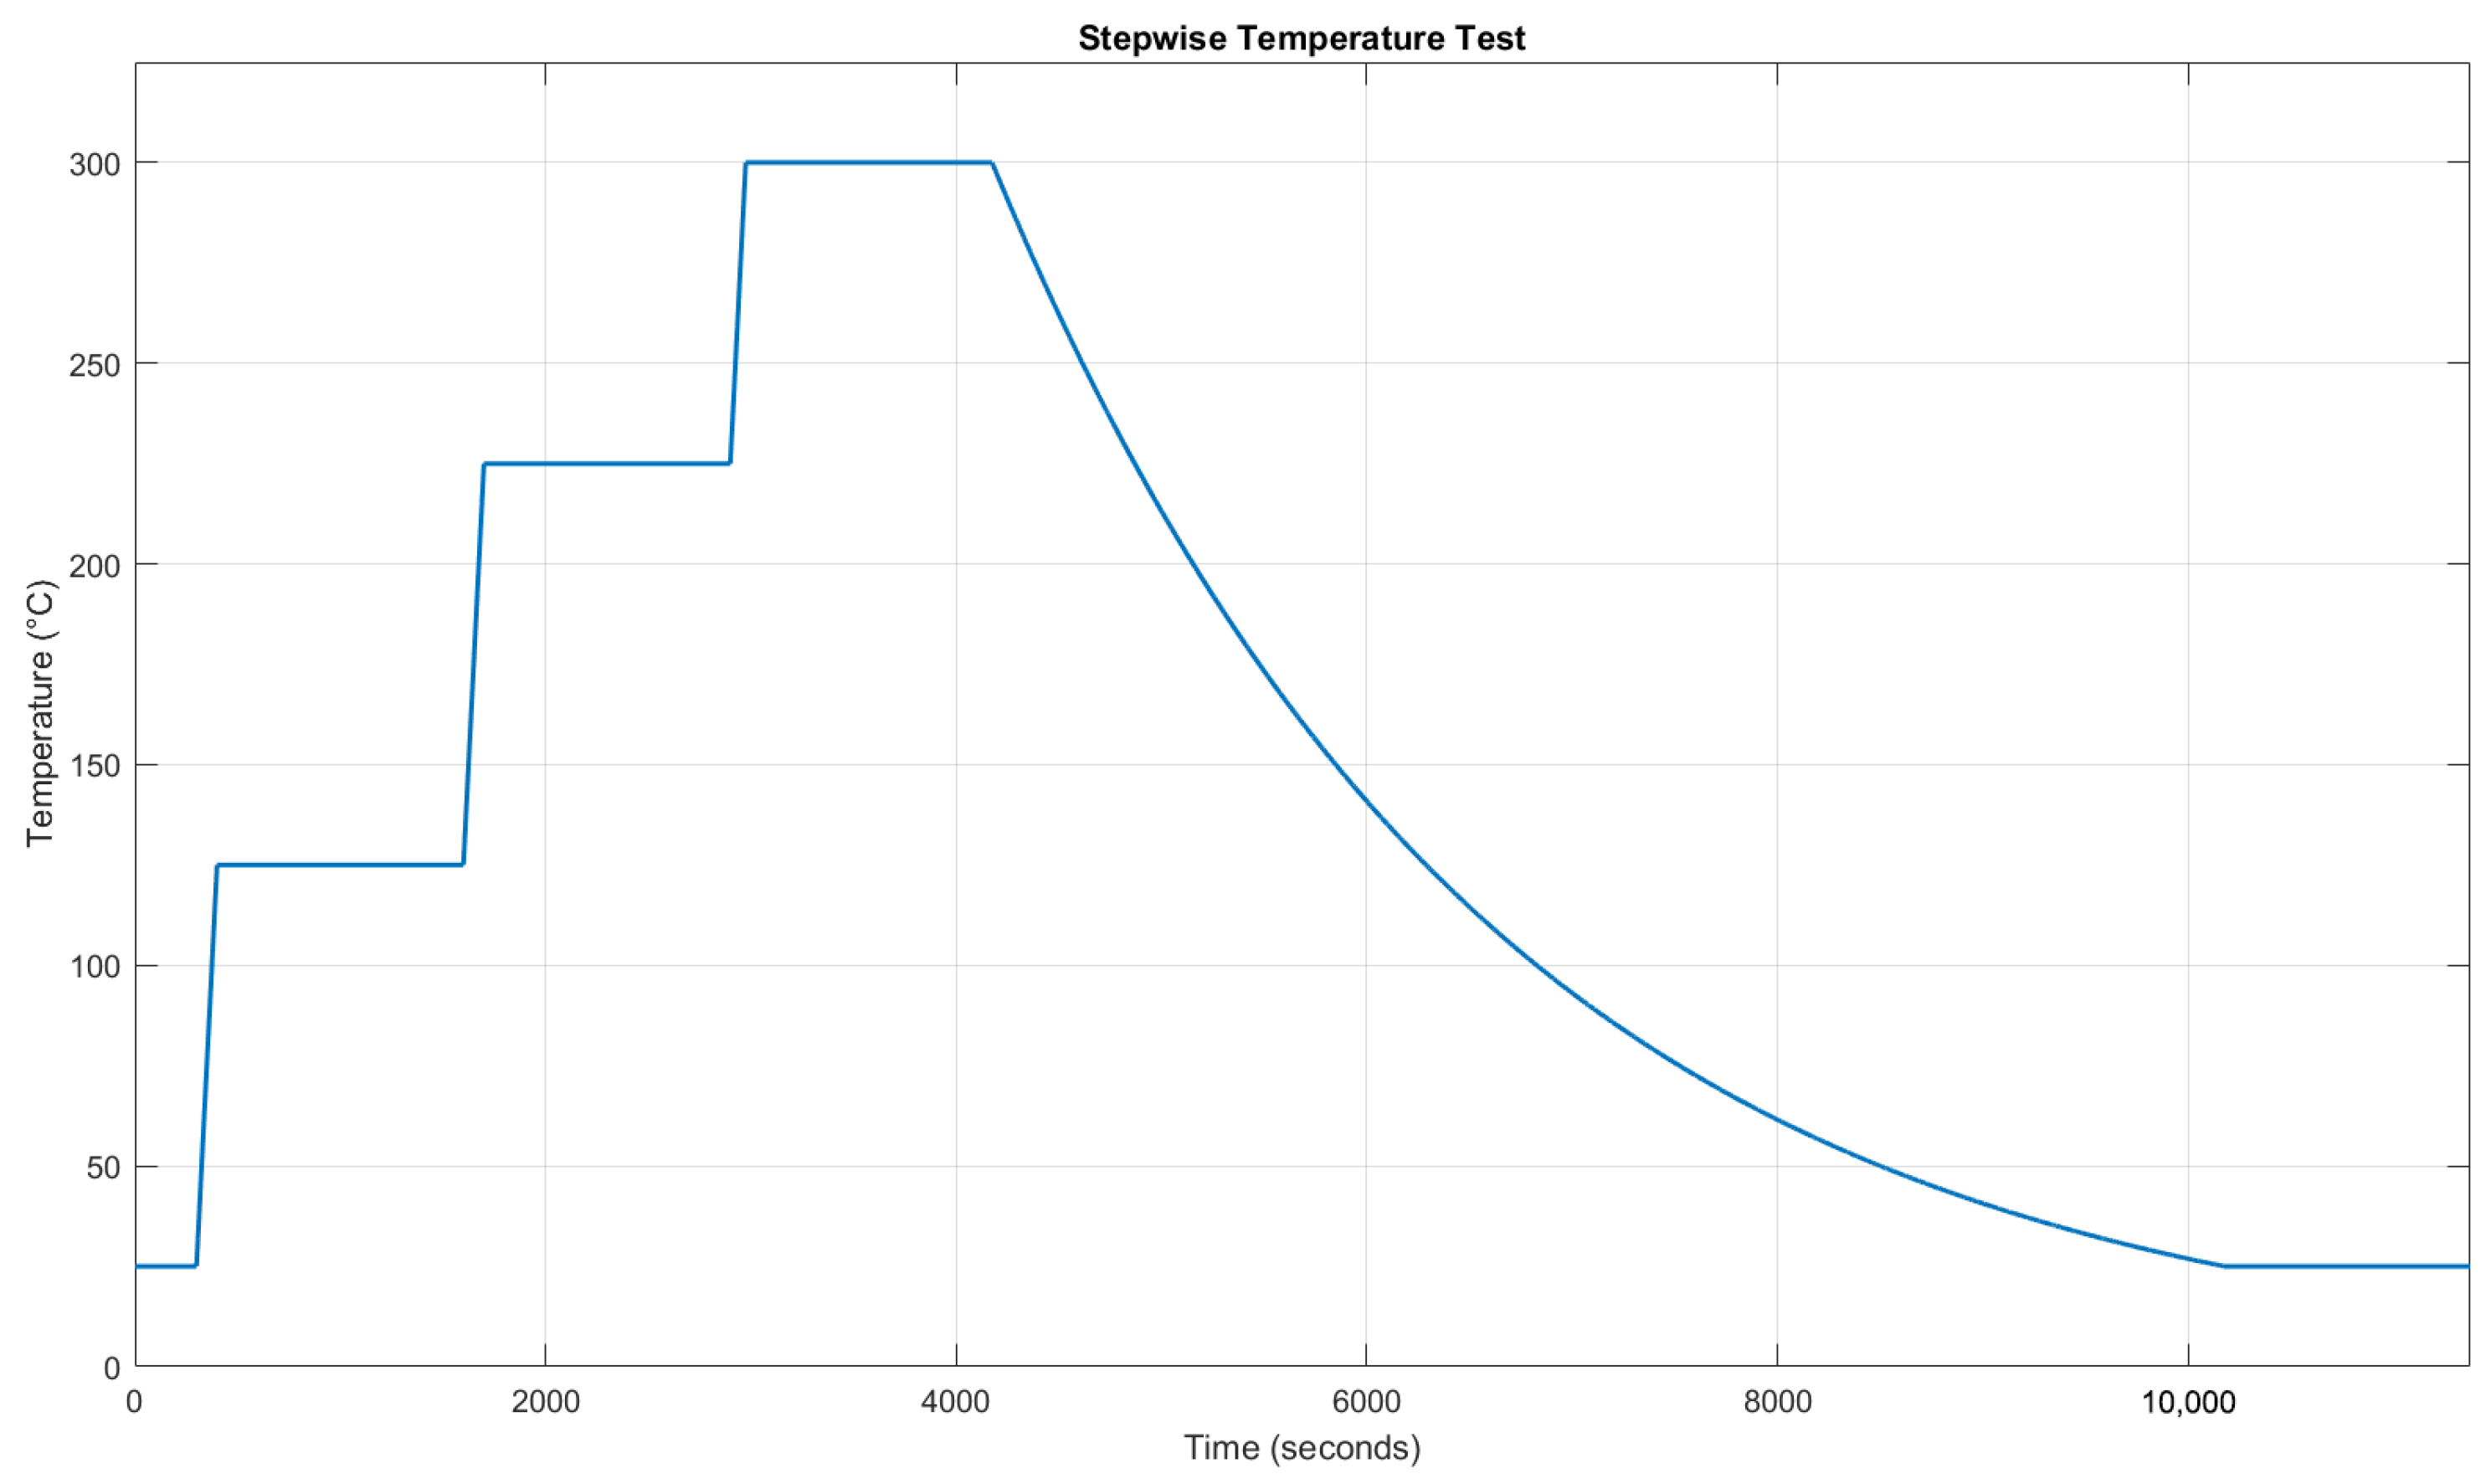
Figure 5.
Stepwise temperature cycle example. Here, proposed a thermal test with a heating rate of 60 °C/min is proposed, including a holding phase of 20 min every 100 °C. Once the maximum operating temperature is reached, the chamber is turned off to allow it to naturally cool down to room temperature (this is an estimate close to the required time for cooling).
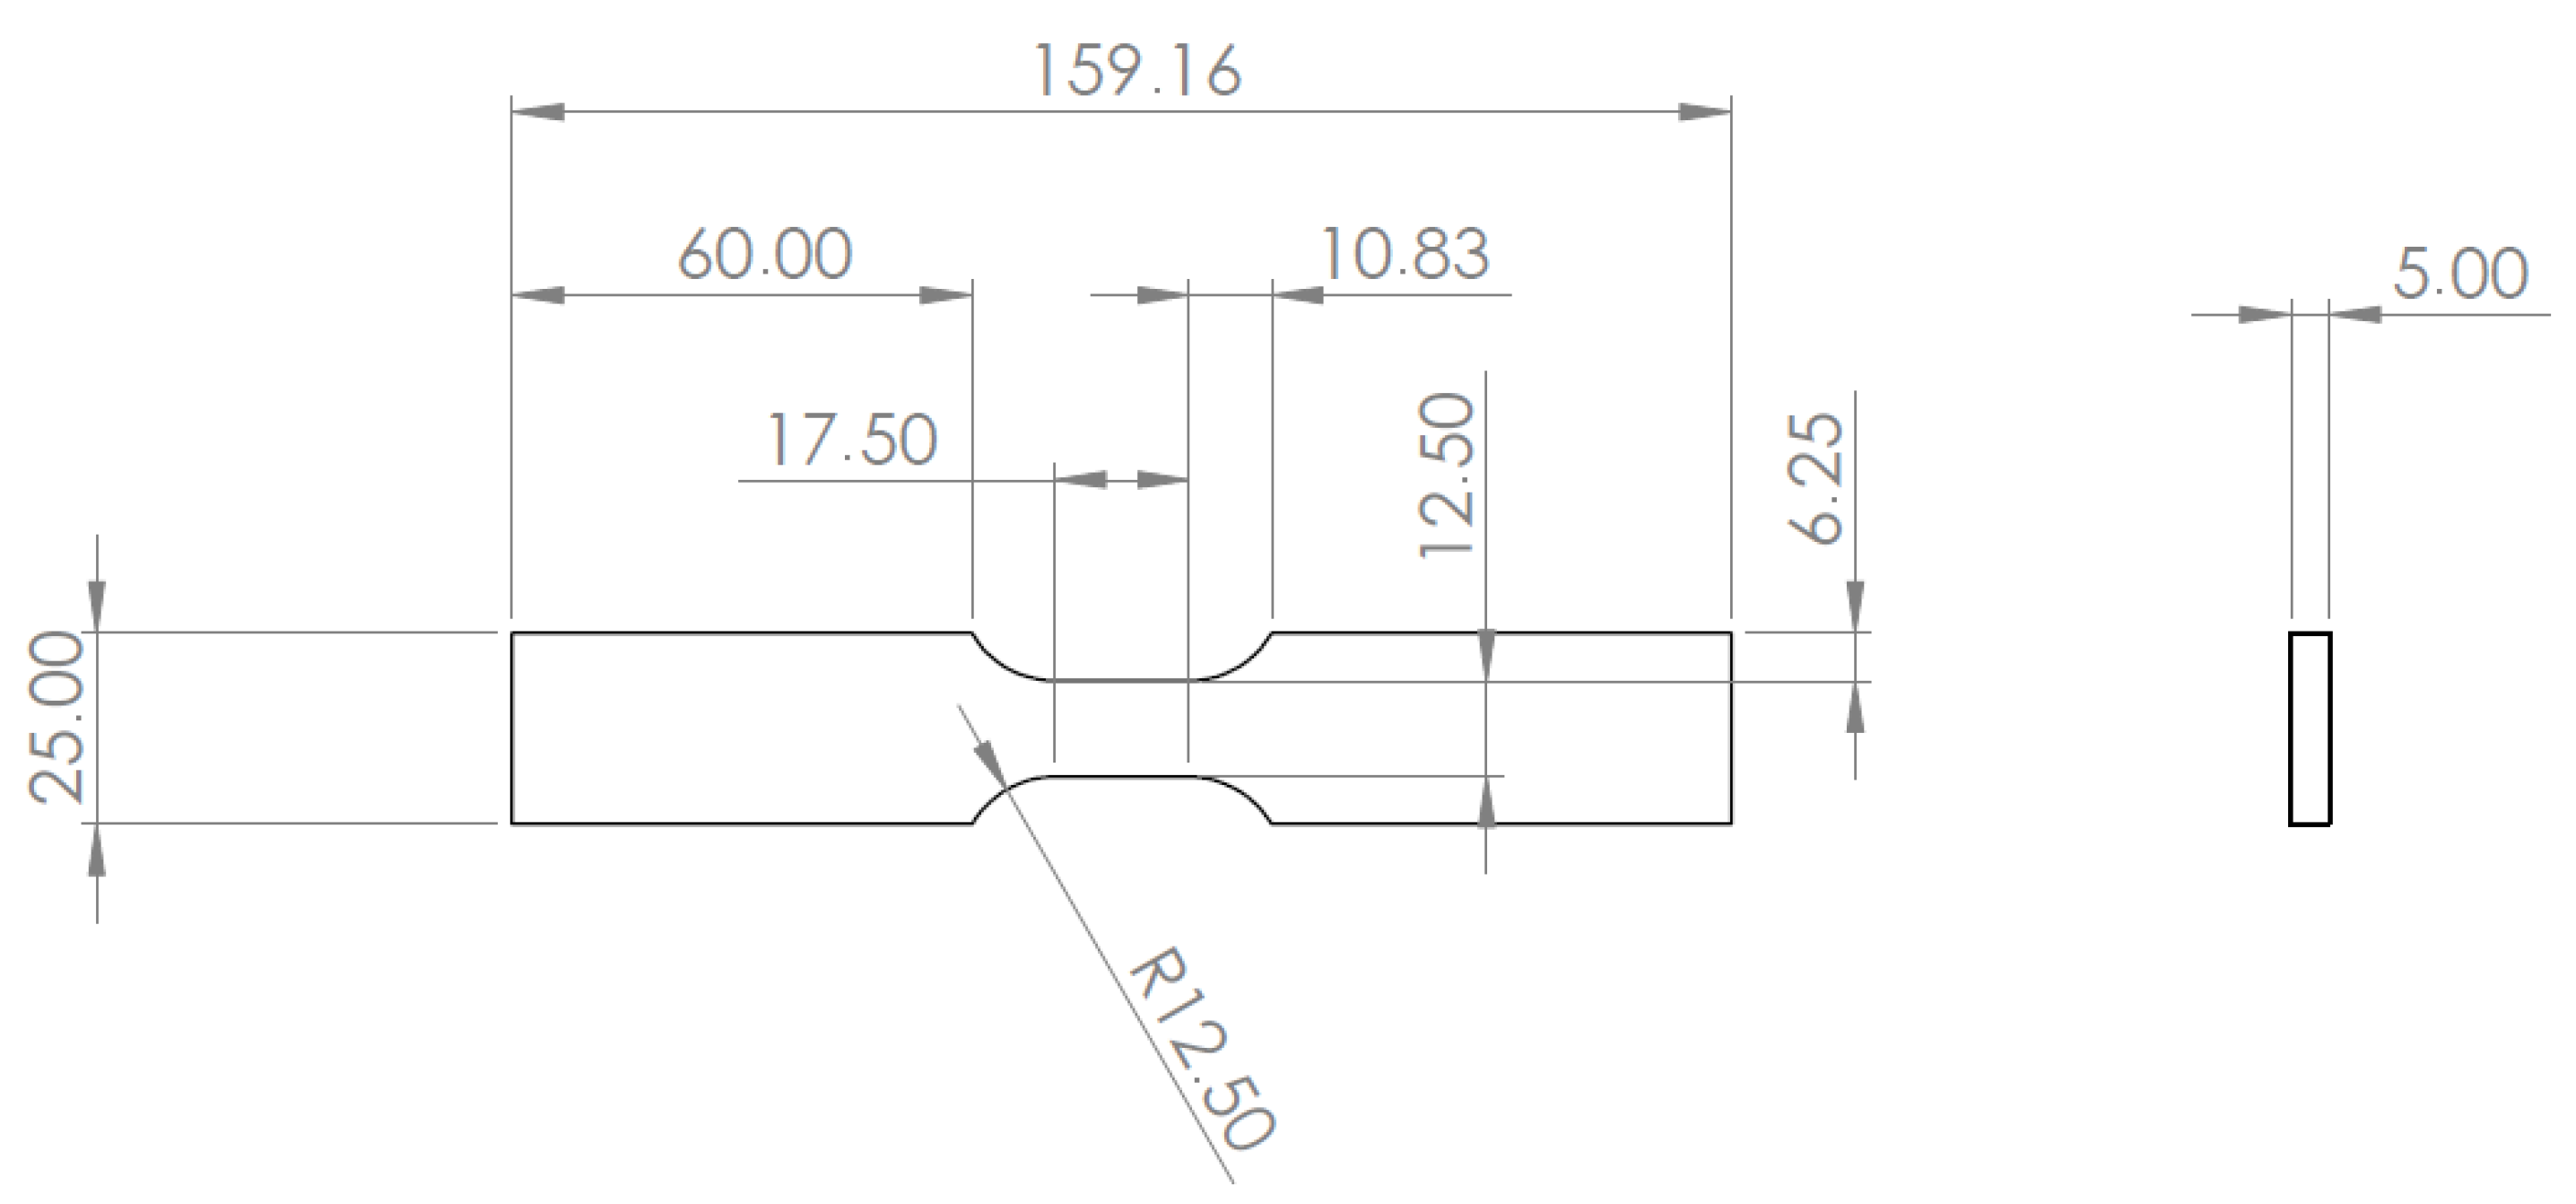
Figure 6.
Dog-bone tensile specimen draft, designed following ASTM E606 dimensions.
Figure 6.
Dog-bone tensile specimen draft, designed following ASTM E606 dimensions.
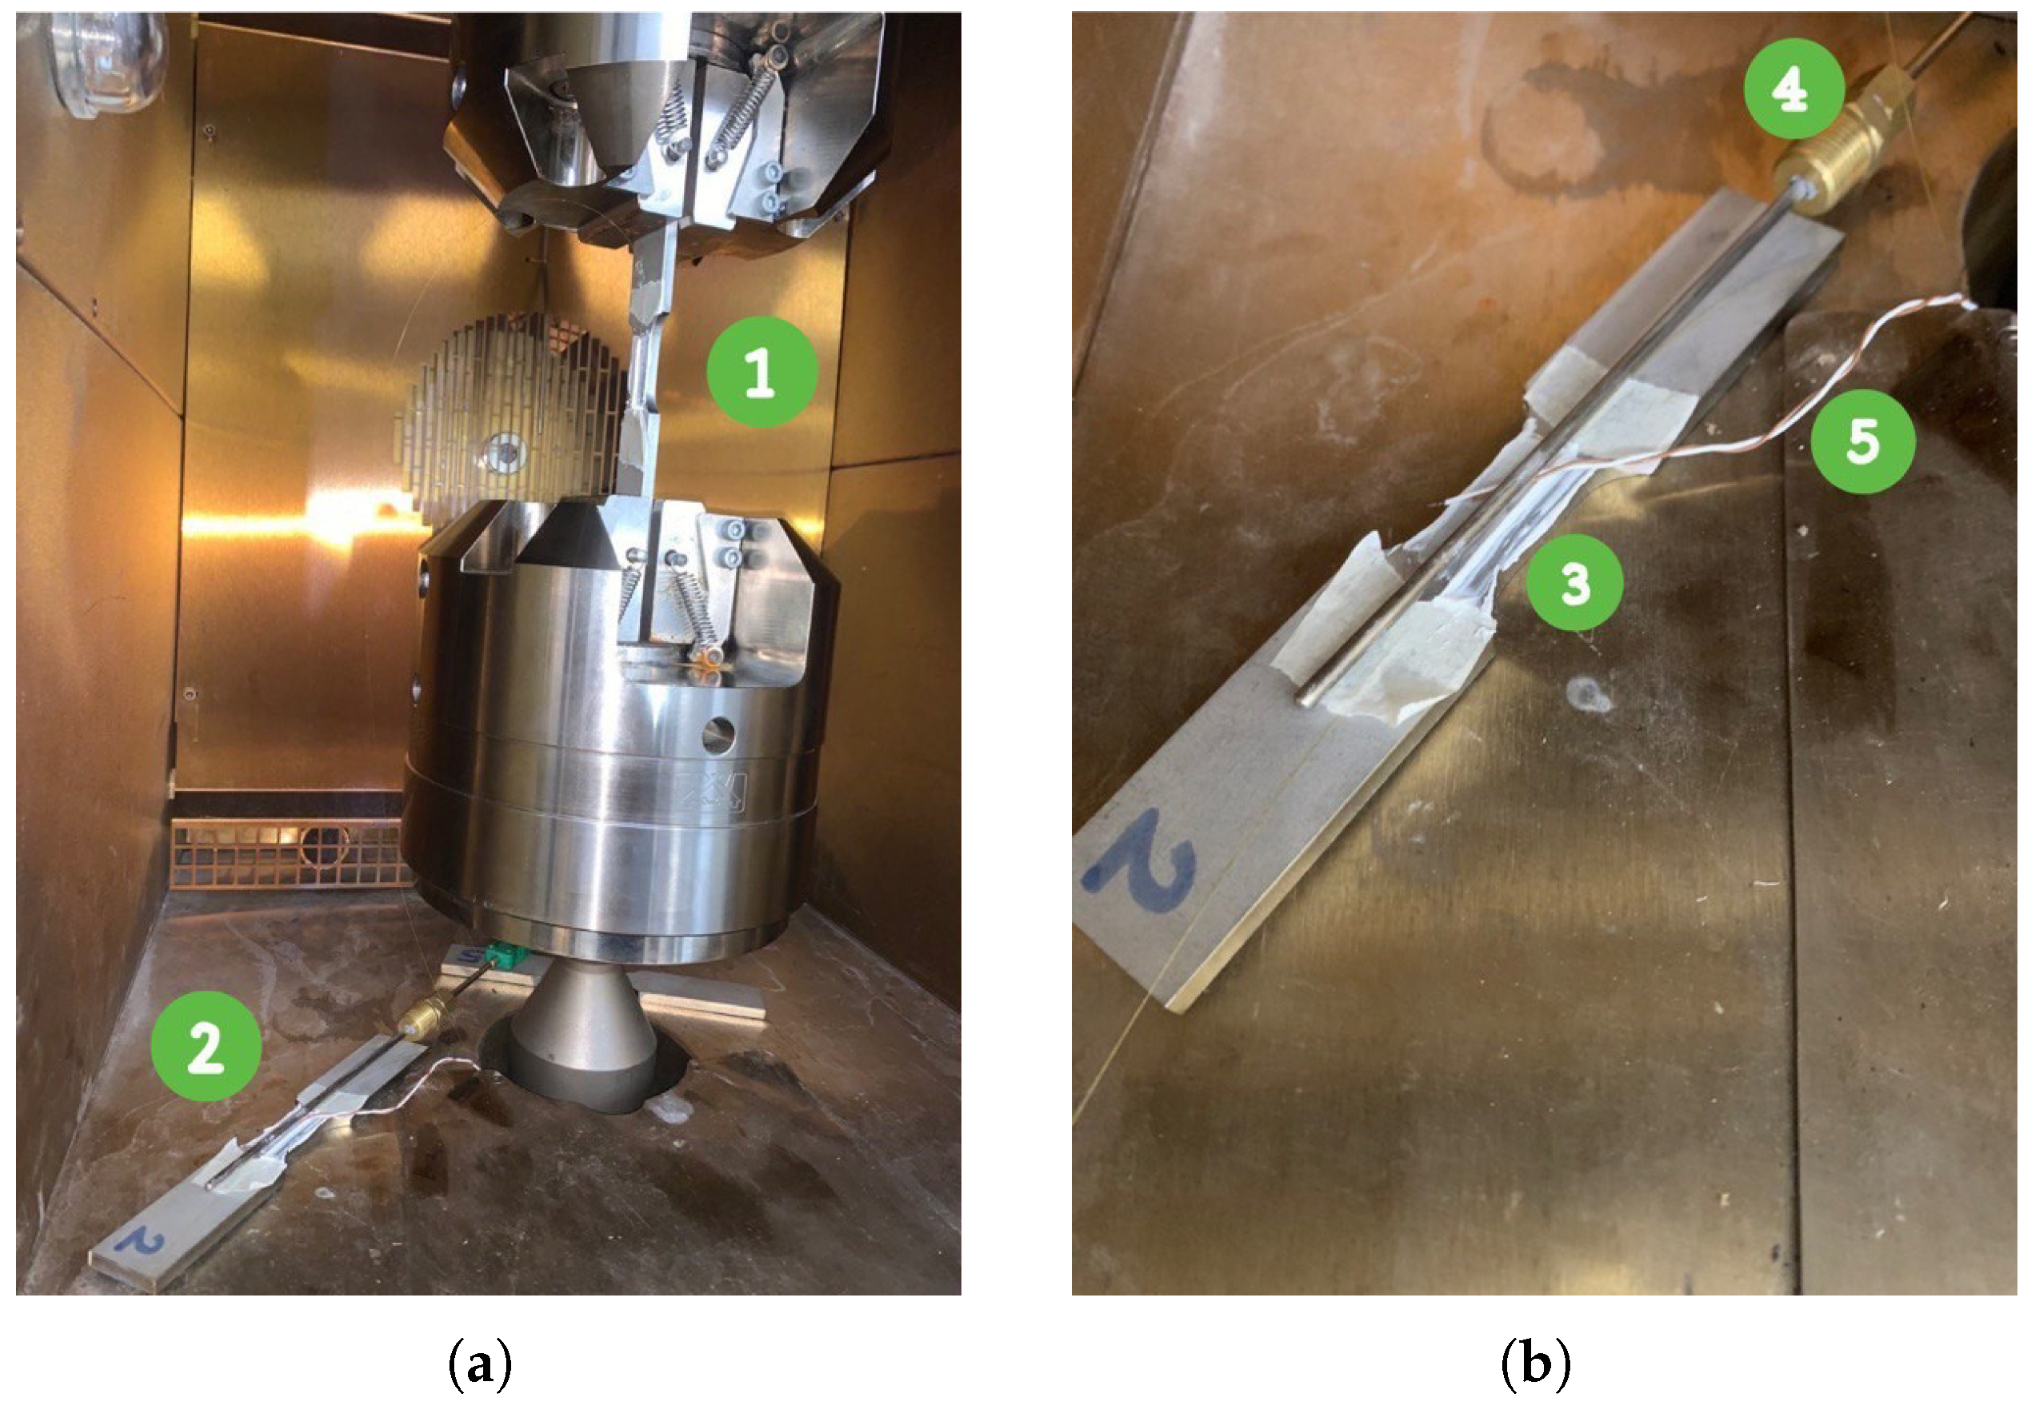
Figure 7.
Experimental setup for the thermo-mechanical tests: (a) General view inside the Instron chamber: (1) Specimen 1, subjected to combined tensile loading and thermal cycling, equipped with FBG4 for the first test and with FBG1 for the second; (2) Specimen 2, used as a reference to monitor temperature-only response and equipped with FBG2 throughout all tests. (b) Zoomed view of Specimen 2: (3) FBG2, (4) the K-type thermocouple, and (5) the T-type thermocouple.
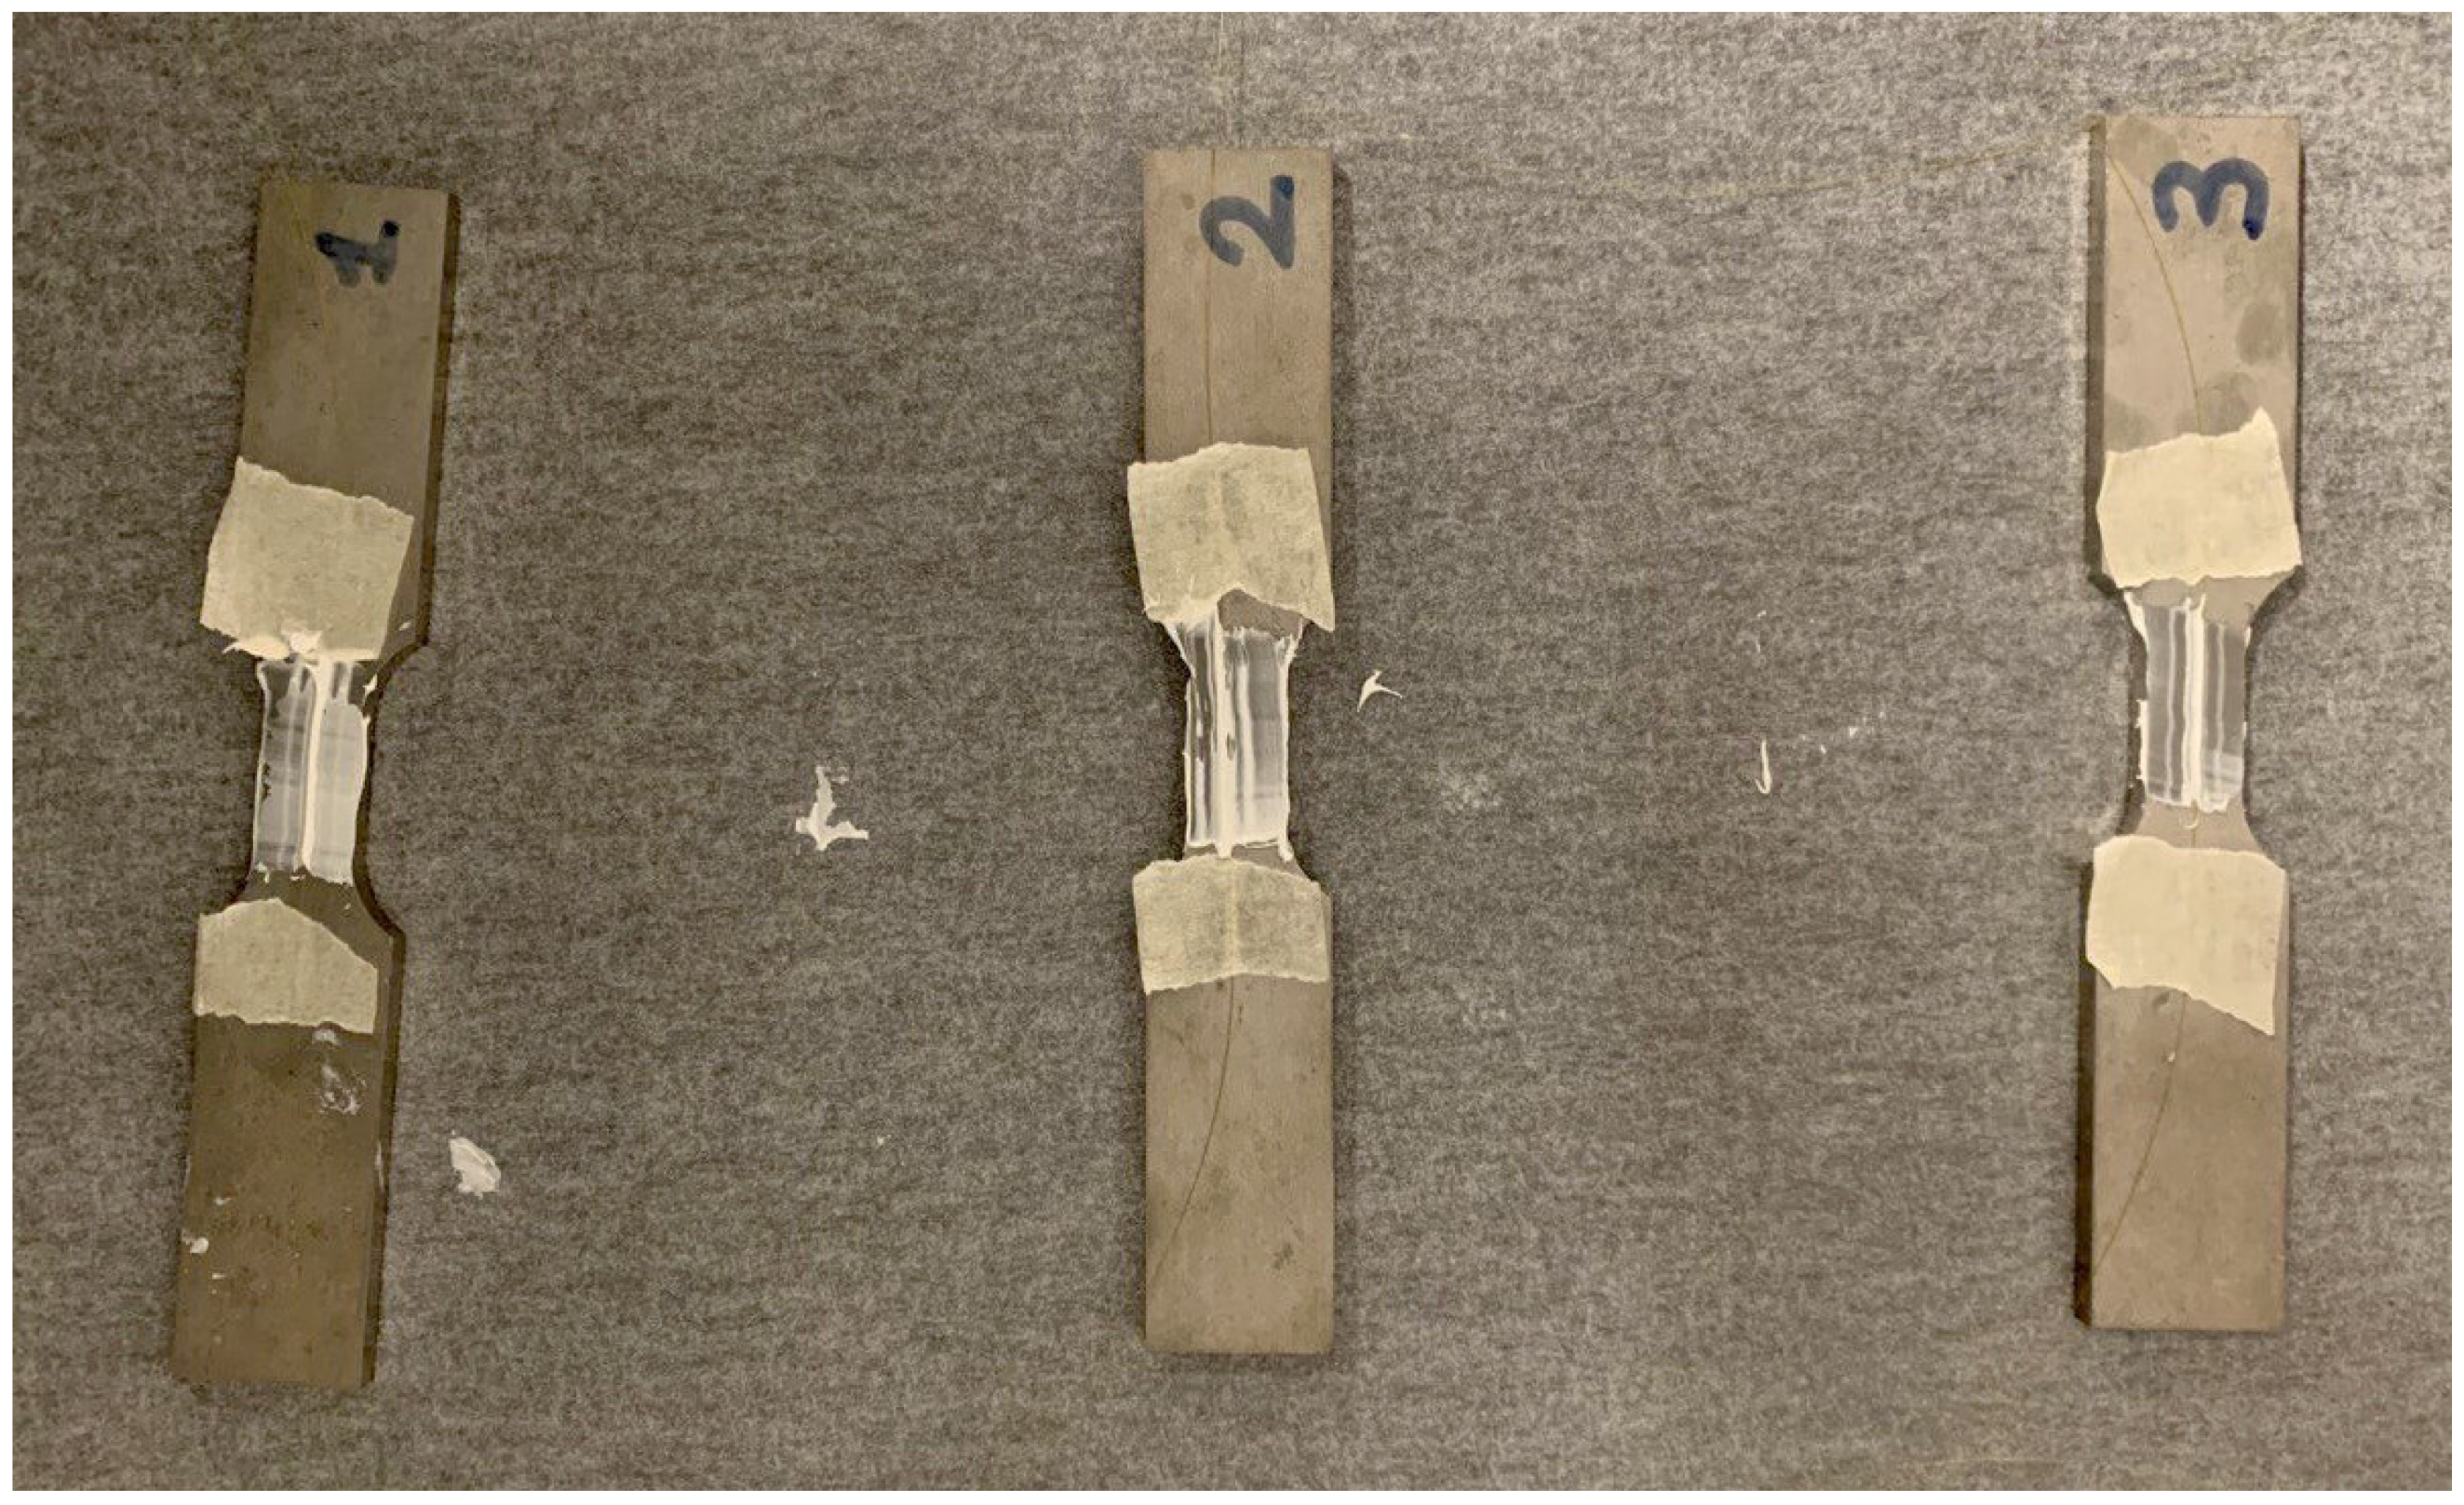
Figure 8.
Resin (WEICON Ceramico W) application onto the tensile specimens, with the optical fibers fixed in position using paper tape. A fine applicator was used to deposit a uniform layer (0.1–0.2 mm) along the fiber, minimizing stress concentrations and avoiding damage. The resin was cured for 24 h before testing. The FBGs are positioned at the center of the resin-coated area for accurate wavelength measurements. From left to right, the bonded FBGs are FBG4, FBG2, and FBG1.
Figure 9.
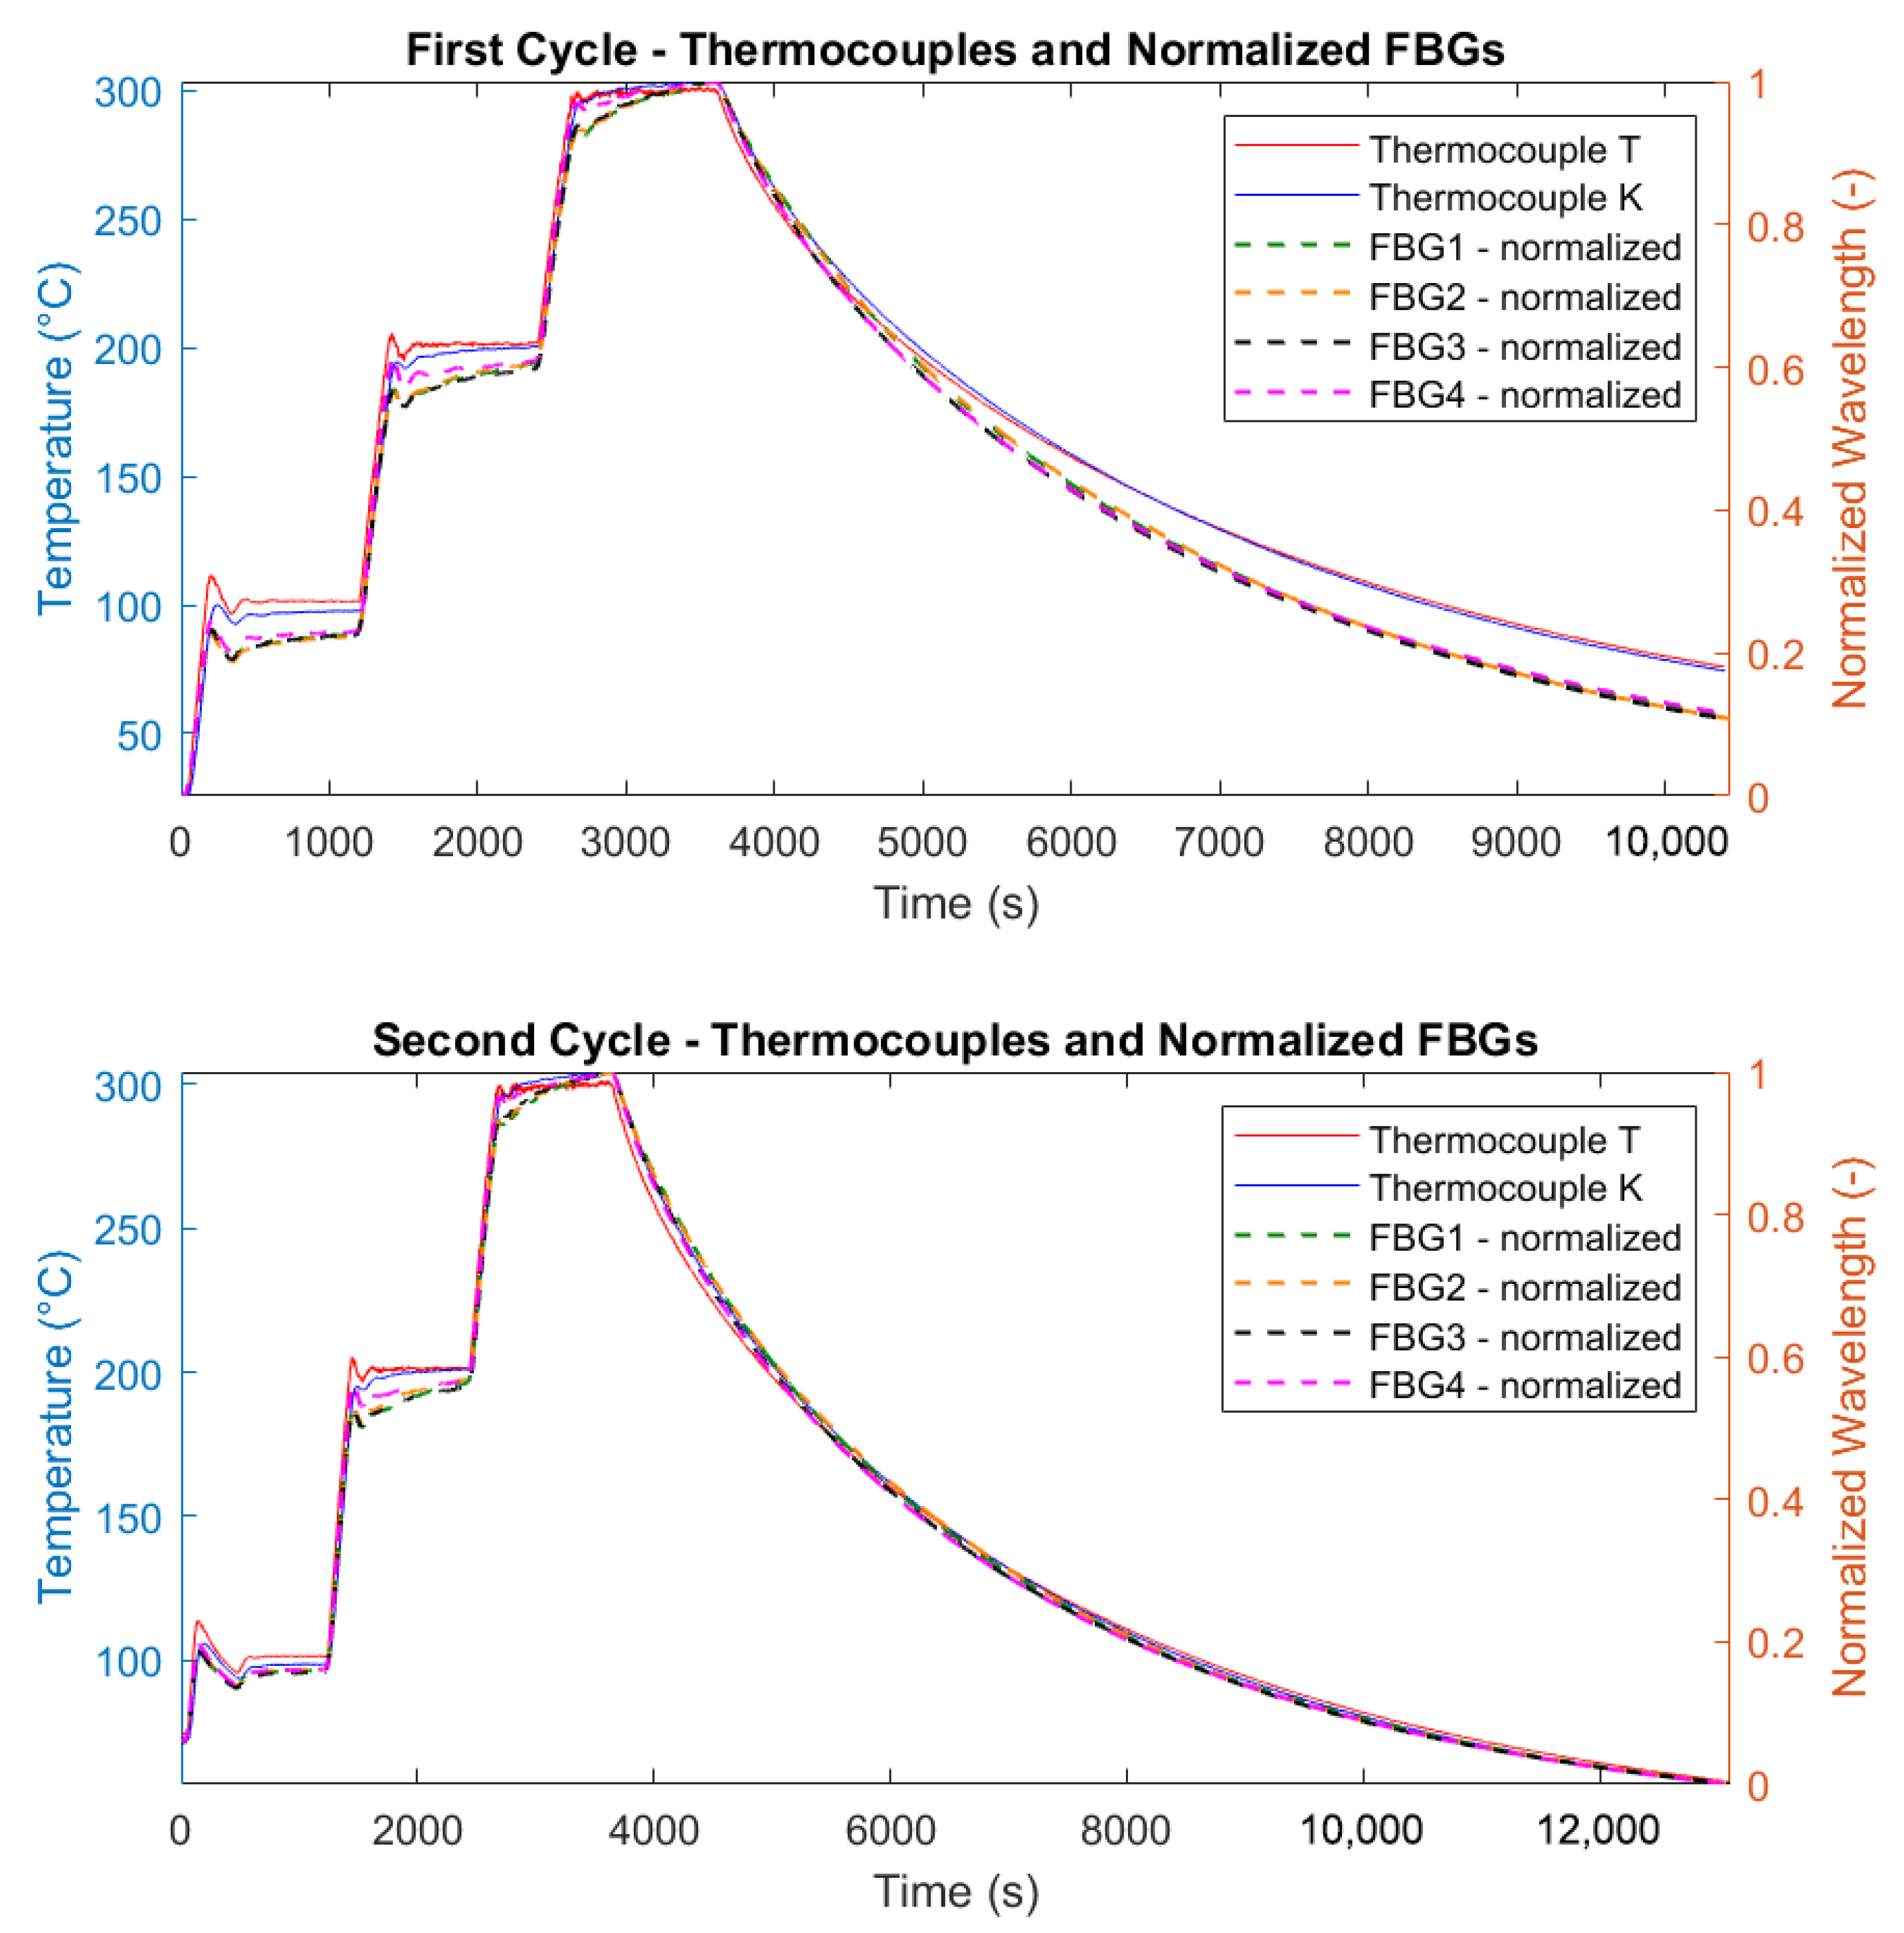
Normalized correlation between temperature changes (solid lines, left blue axis) and wavelength shifts (dashed lines, right orange axis) for the two thermal cycles: the upper plot corresponds to the first cycle and the lower plot to the second cycle. The left vertical axis reports the temperature evolution, and the right vertical axis reports the normalized wavelength displacement.
Figure 10.
Filtered response of FBG4 during thermal cycling. The left figure corresponds to the first heating–cooling cycle, while the right one corresponds to the second cycle. In both cases, the plots show the raw FBG data acquired from the interrogator (red) and the corresponding signal after applying a Moving Average Filter (blue), for noise reduction and improved signal clarity.
Figure 11.
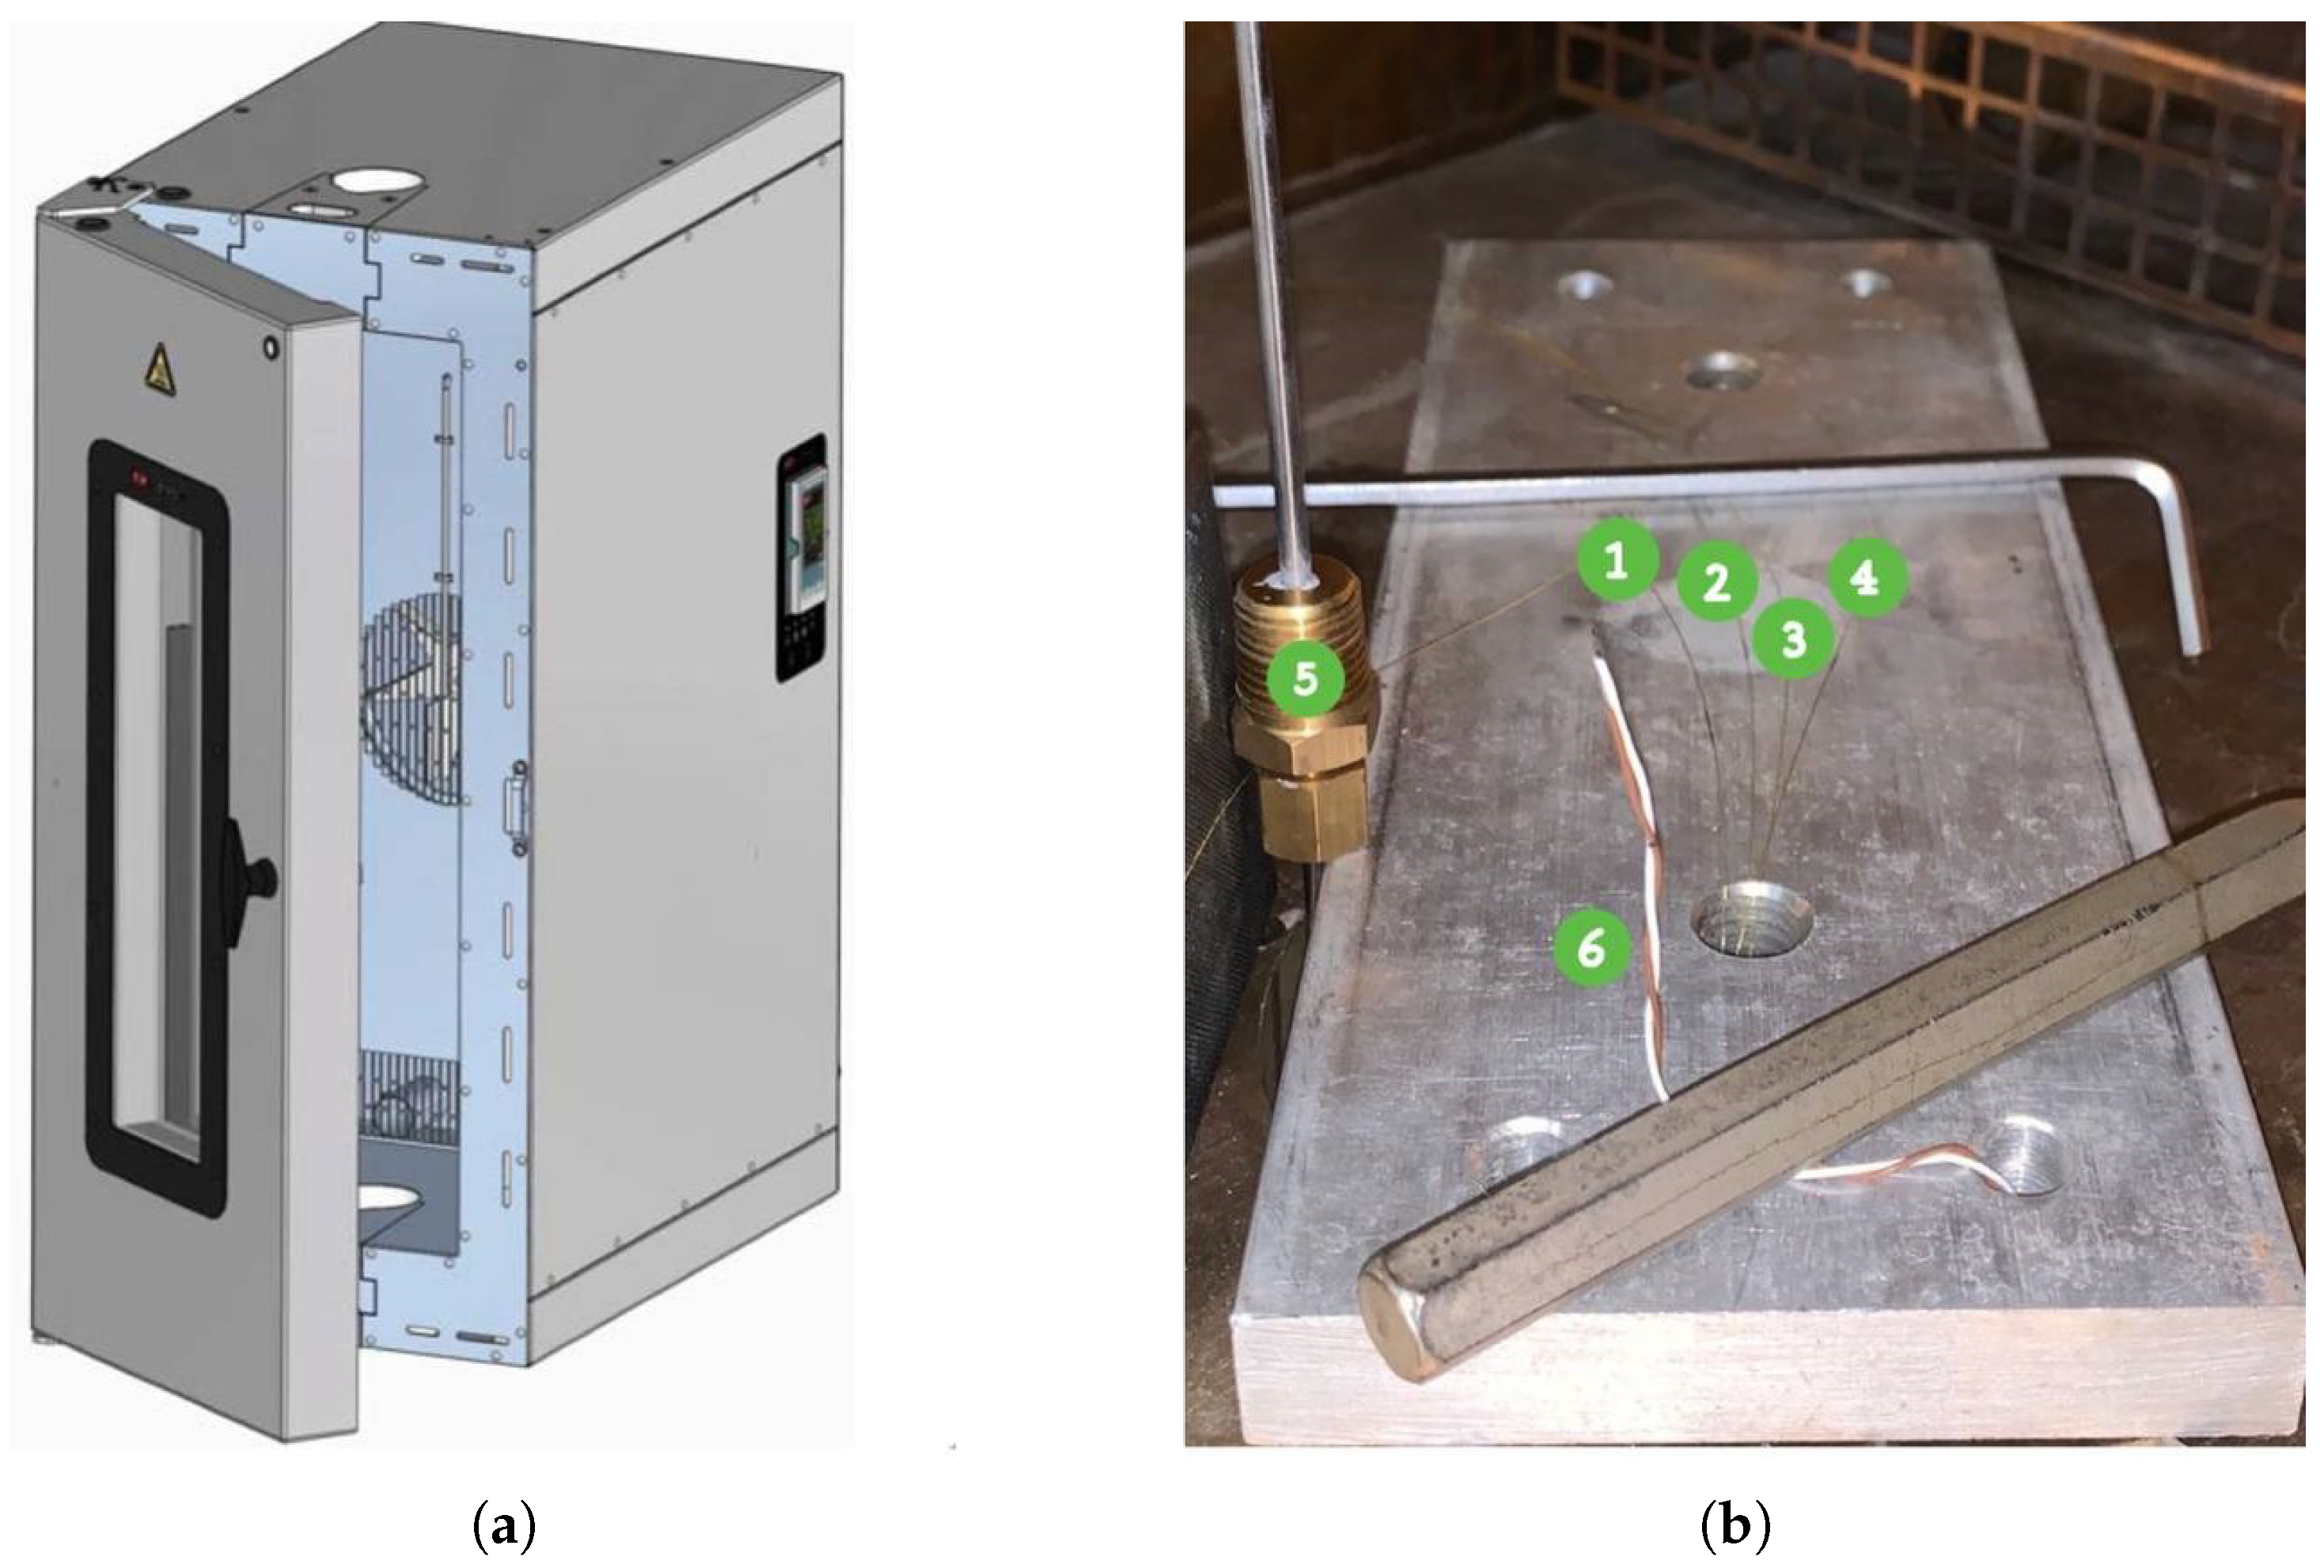
(a) 3119-607 Temperature-Controlled Instron Chamber. (b) Setup of the optical fibers displaced on a neutral platform, to be inserted inside the Instron chamber: (1) FBG1, (2) FBG2, (3) FBG3, (4) FBG4, (5) K-type thermocouple, (6) T-type thermocouple.
Figure 11.
(a) 3119-607 Temperature-Controlled Instron Chamber. (b) Setup of the optical fibers displaced on a neutral platform, to be inserted inside the Instron chamber: (1) FBG1, (2) FBG2, (3) FBG3, (4) FBG4, (5) K-type thermocouple, (6) T-type thermocouple.
Figure 12.
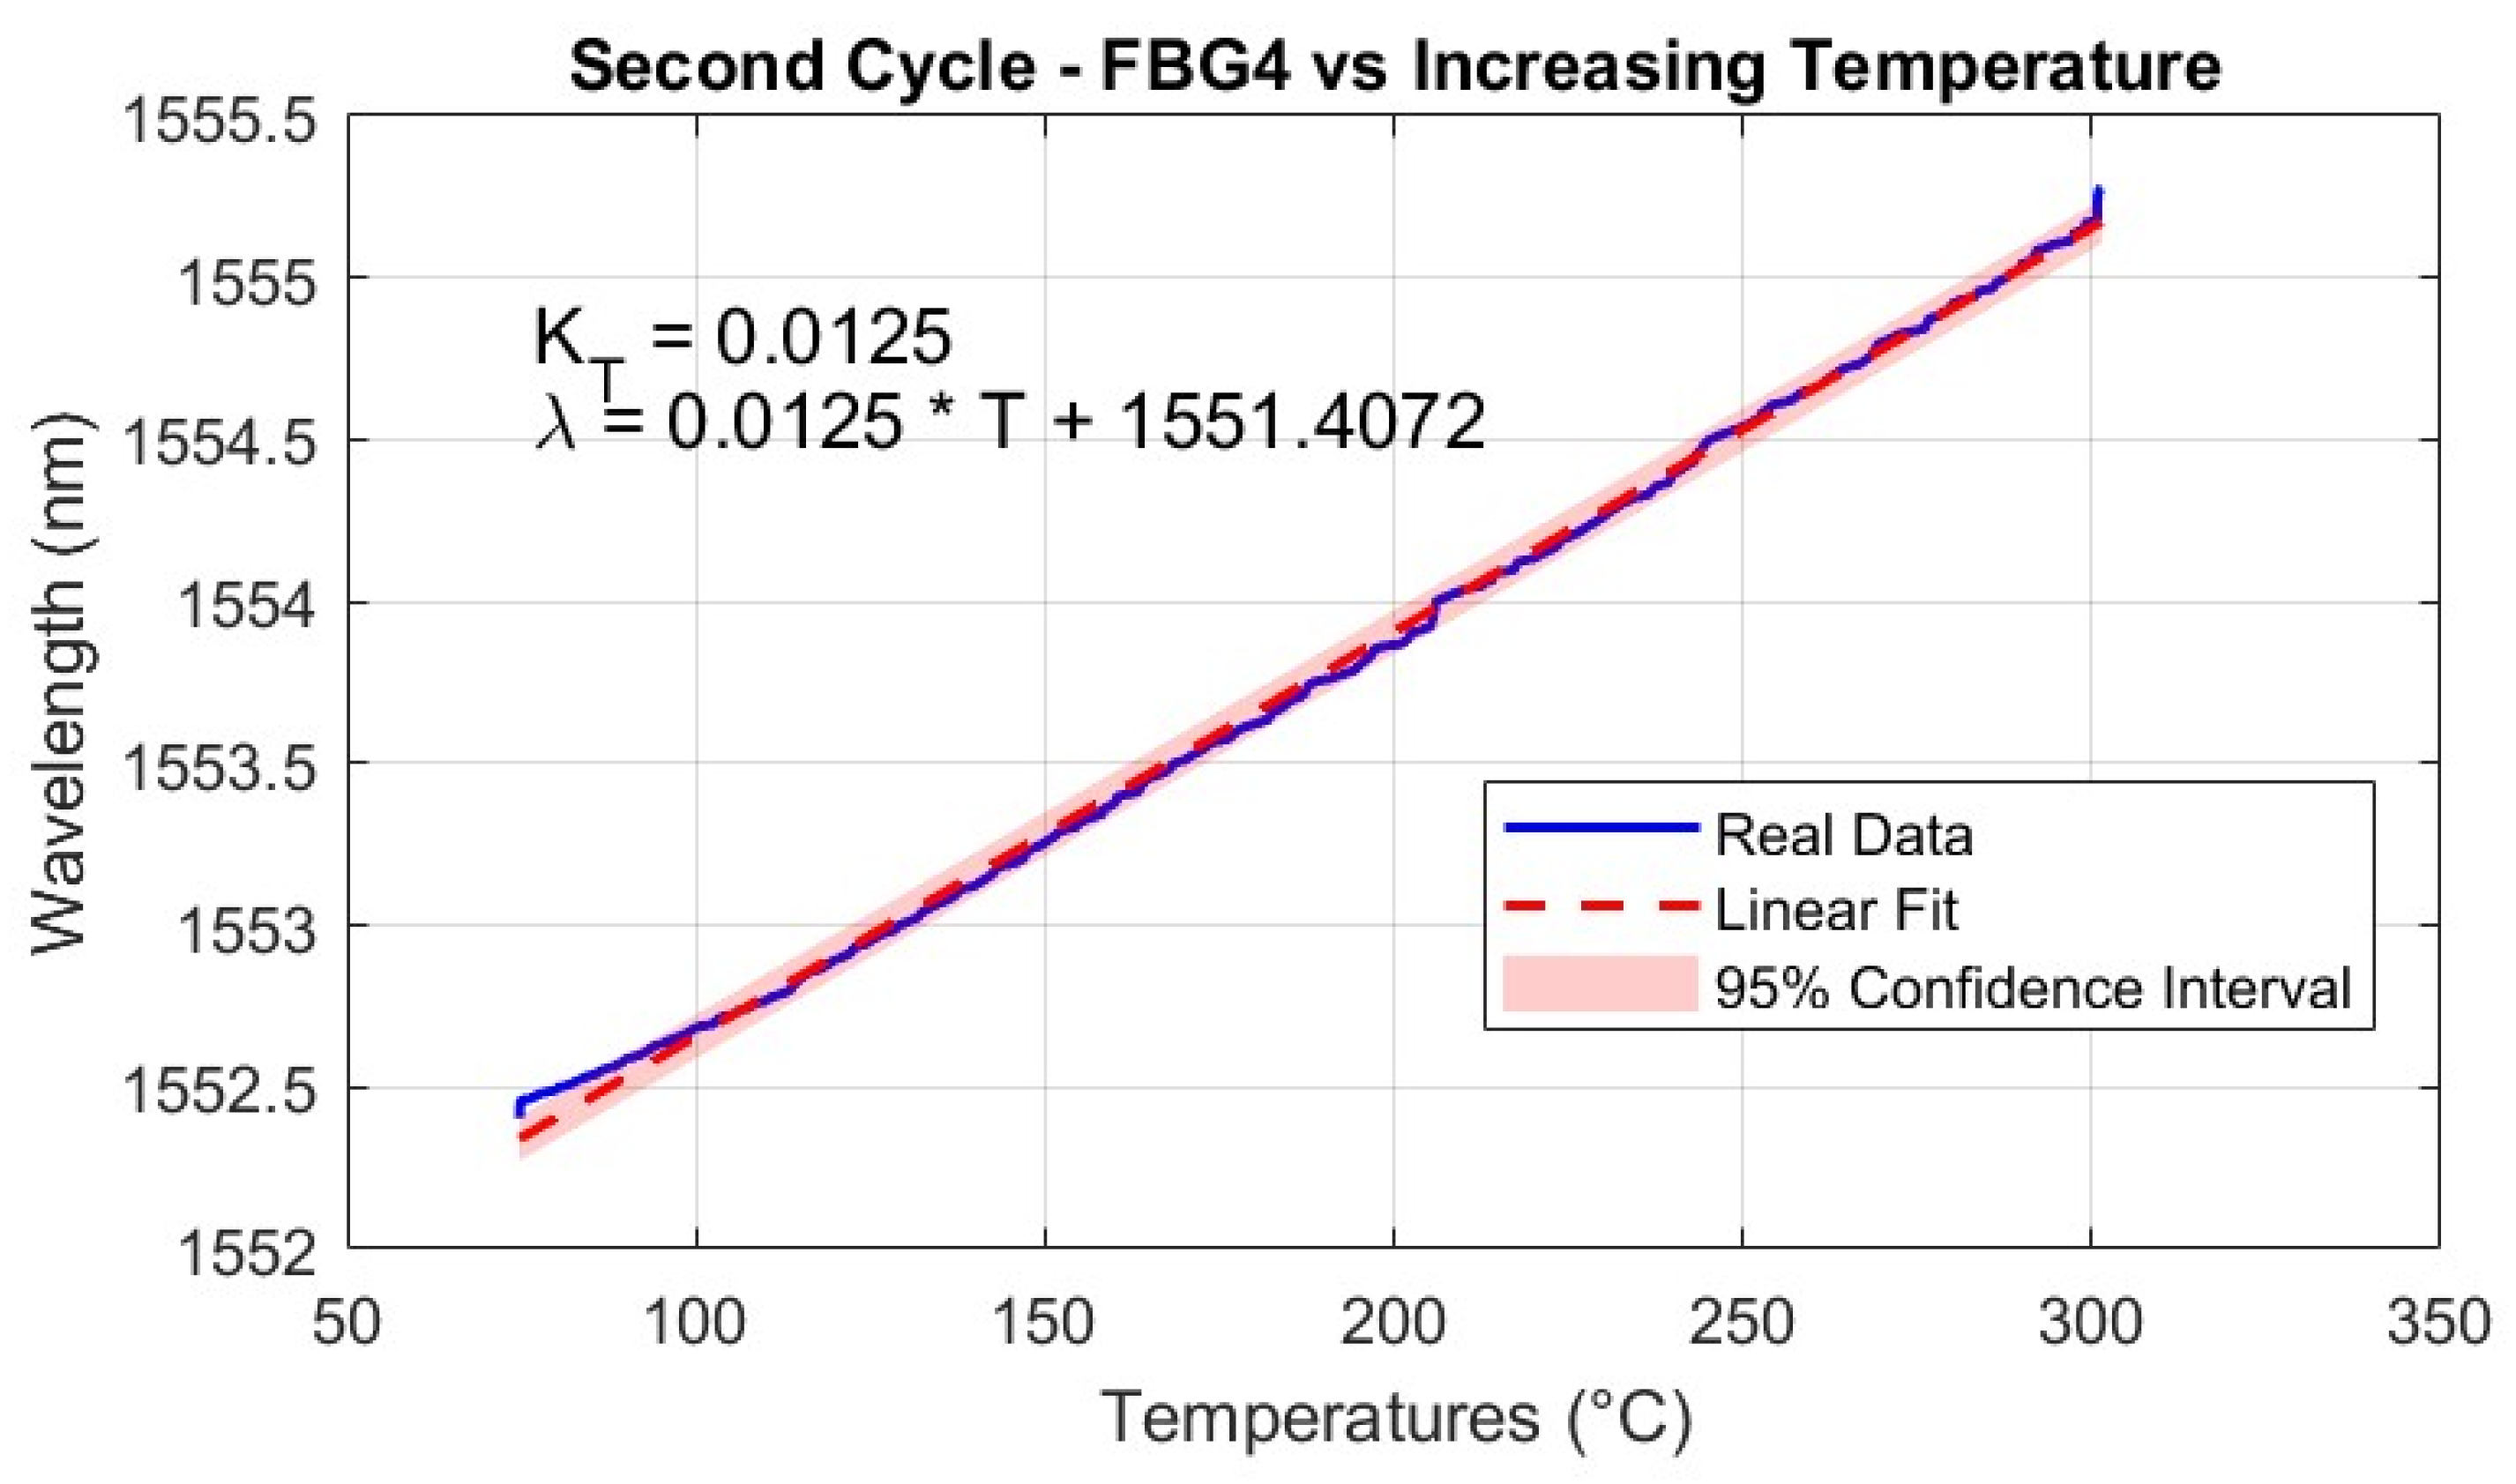
Linear regression of the wavelength shift of FBG4 as a function of temperature during the second heating cycle. The red dashed line represents the linear fit, while the blue line shows the measured wavelength shift data, with the shaded region indicating the 95% confidence interval. Small deviations in the data around 100, 200, and 300 °C correspond to stabilization steps, where the temperature was held constant to ensure thermal equilibrium before continuing the heating ramp.
Figure 13.
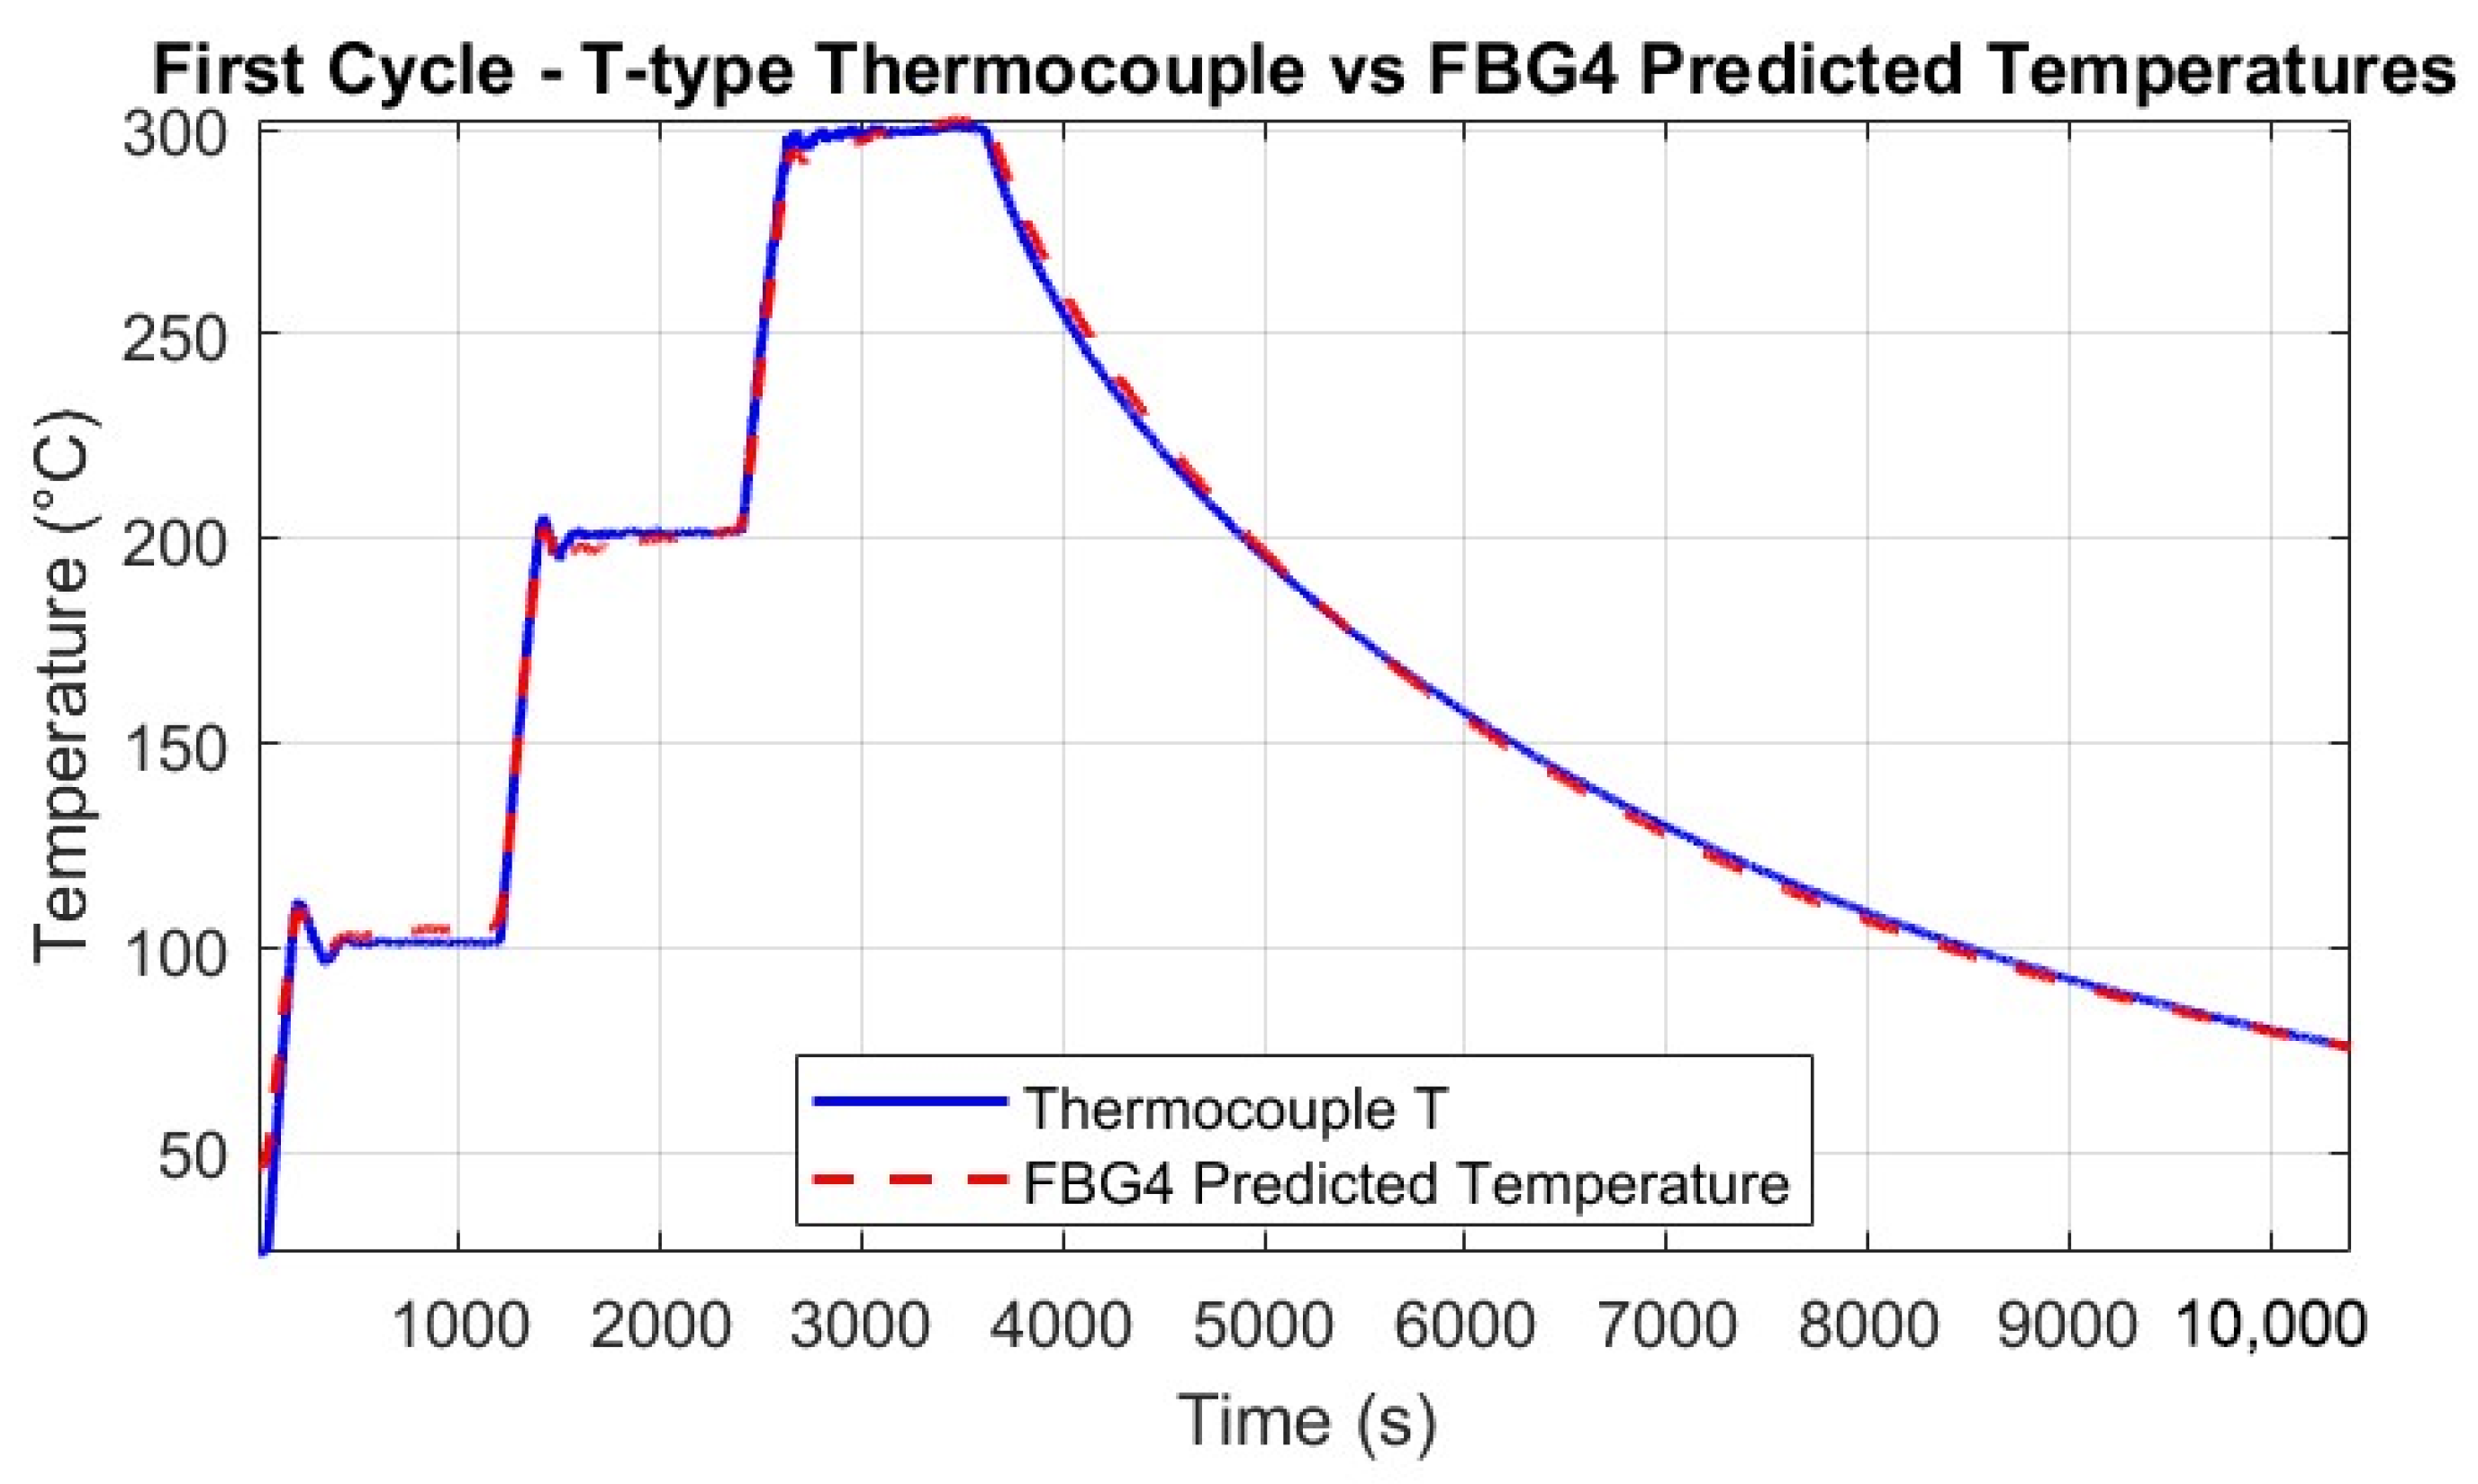
Predicted temperatures from FBG4 (red dashed line) compared to T-type thermocouple measurements (blue solid line) during the first thermal cycle. The figure illustrates the accuracy of the FBG calibration process in capturing temperature-induced wavelength shifts, with minor deviations due to fiber placement and small vibrations in the thermal chamber.
Figure 14.
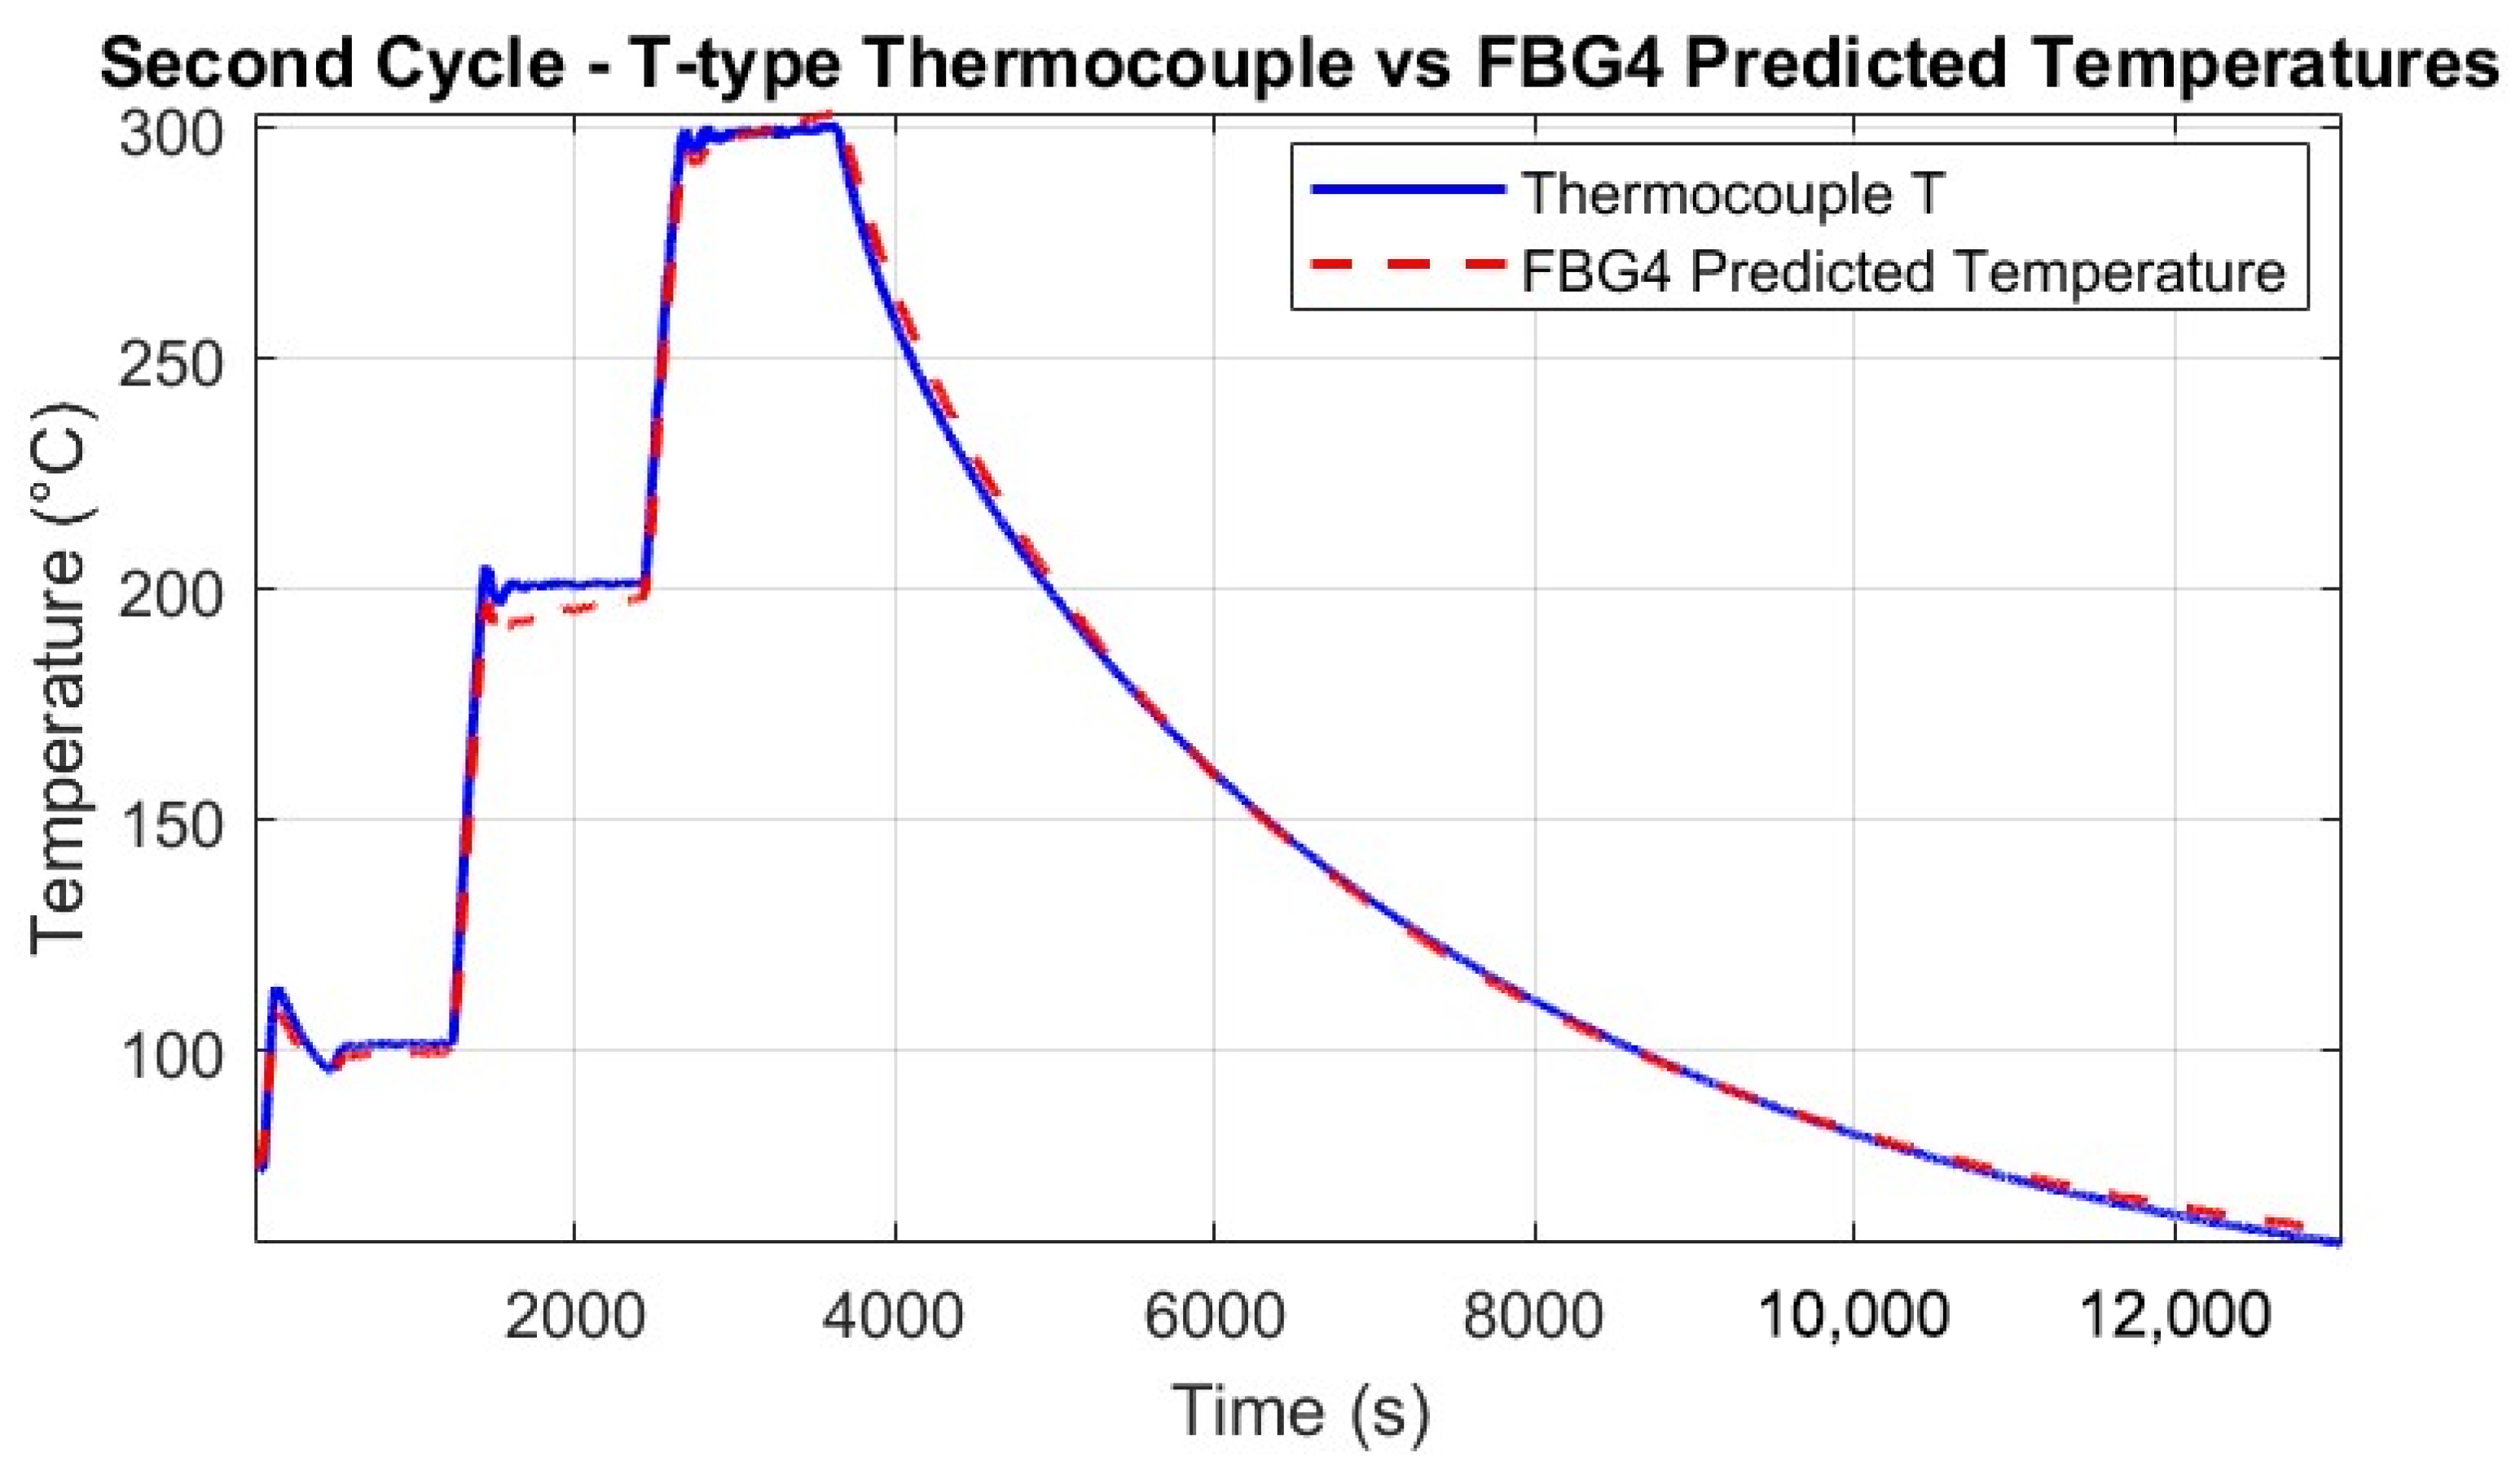
Predicted temperatures from FBG4 (red dashed line) compared to T-type thermocouple measurements (blue solid line) during the second thermal cycle. The figure confirms the repeatability of the FBG response and the reliability of the calibration procedure, with small discrepancies caused by slight differences in sensor positioning and thermal chamber disturbances.
Figure 15.
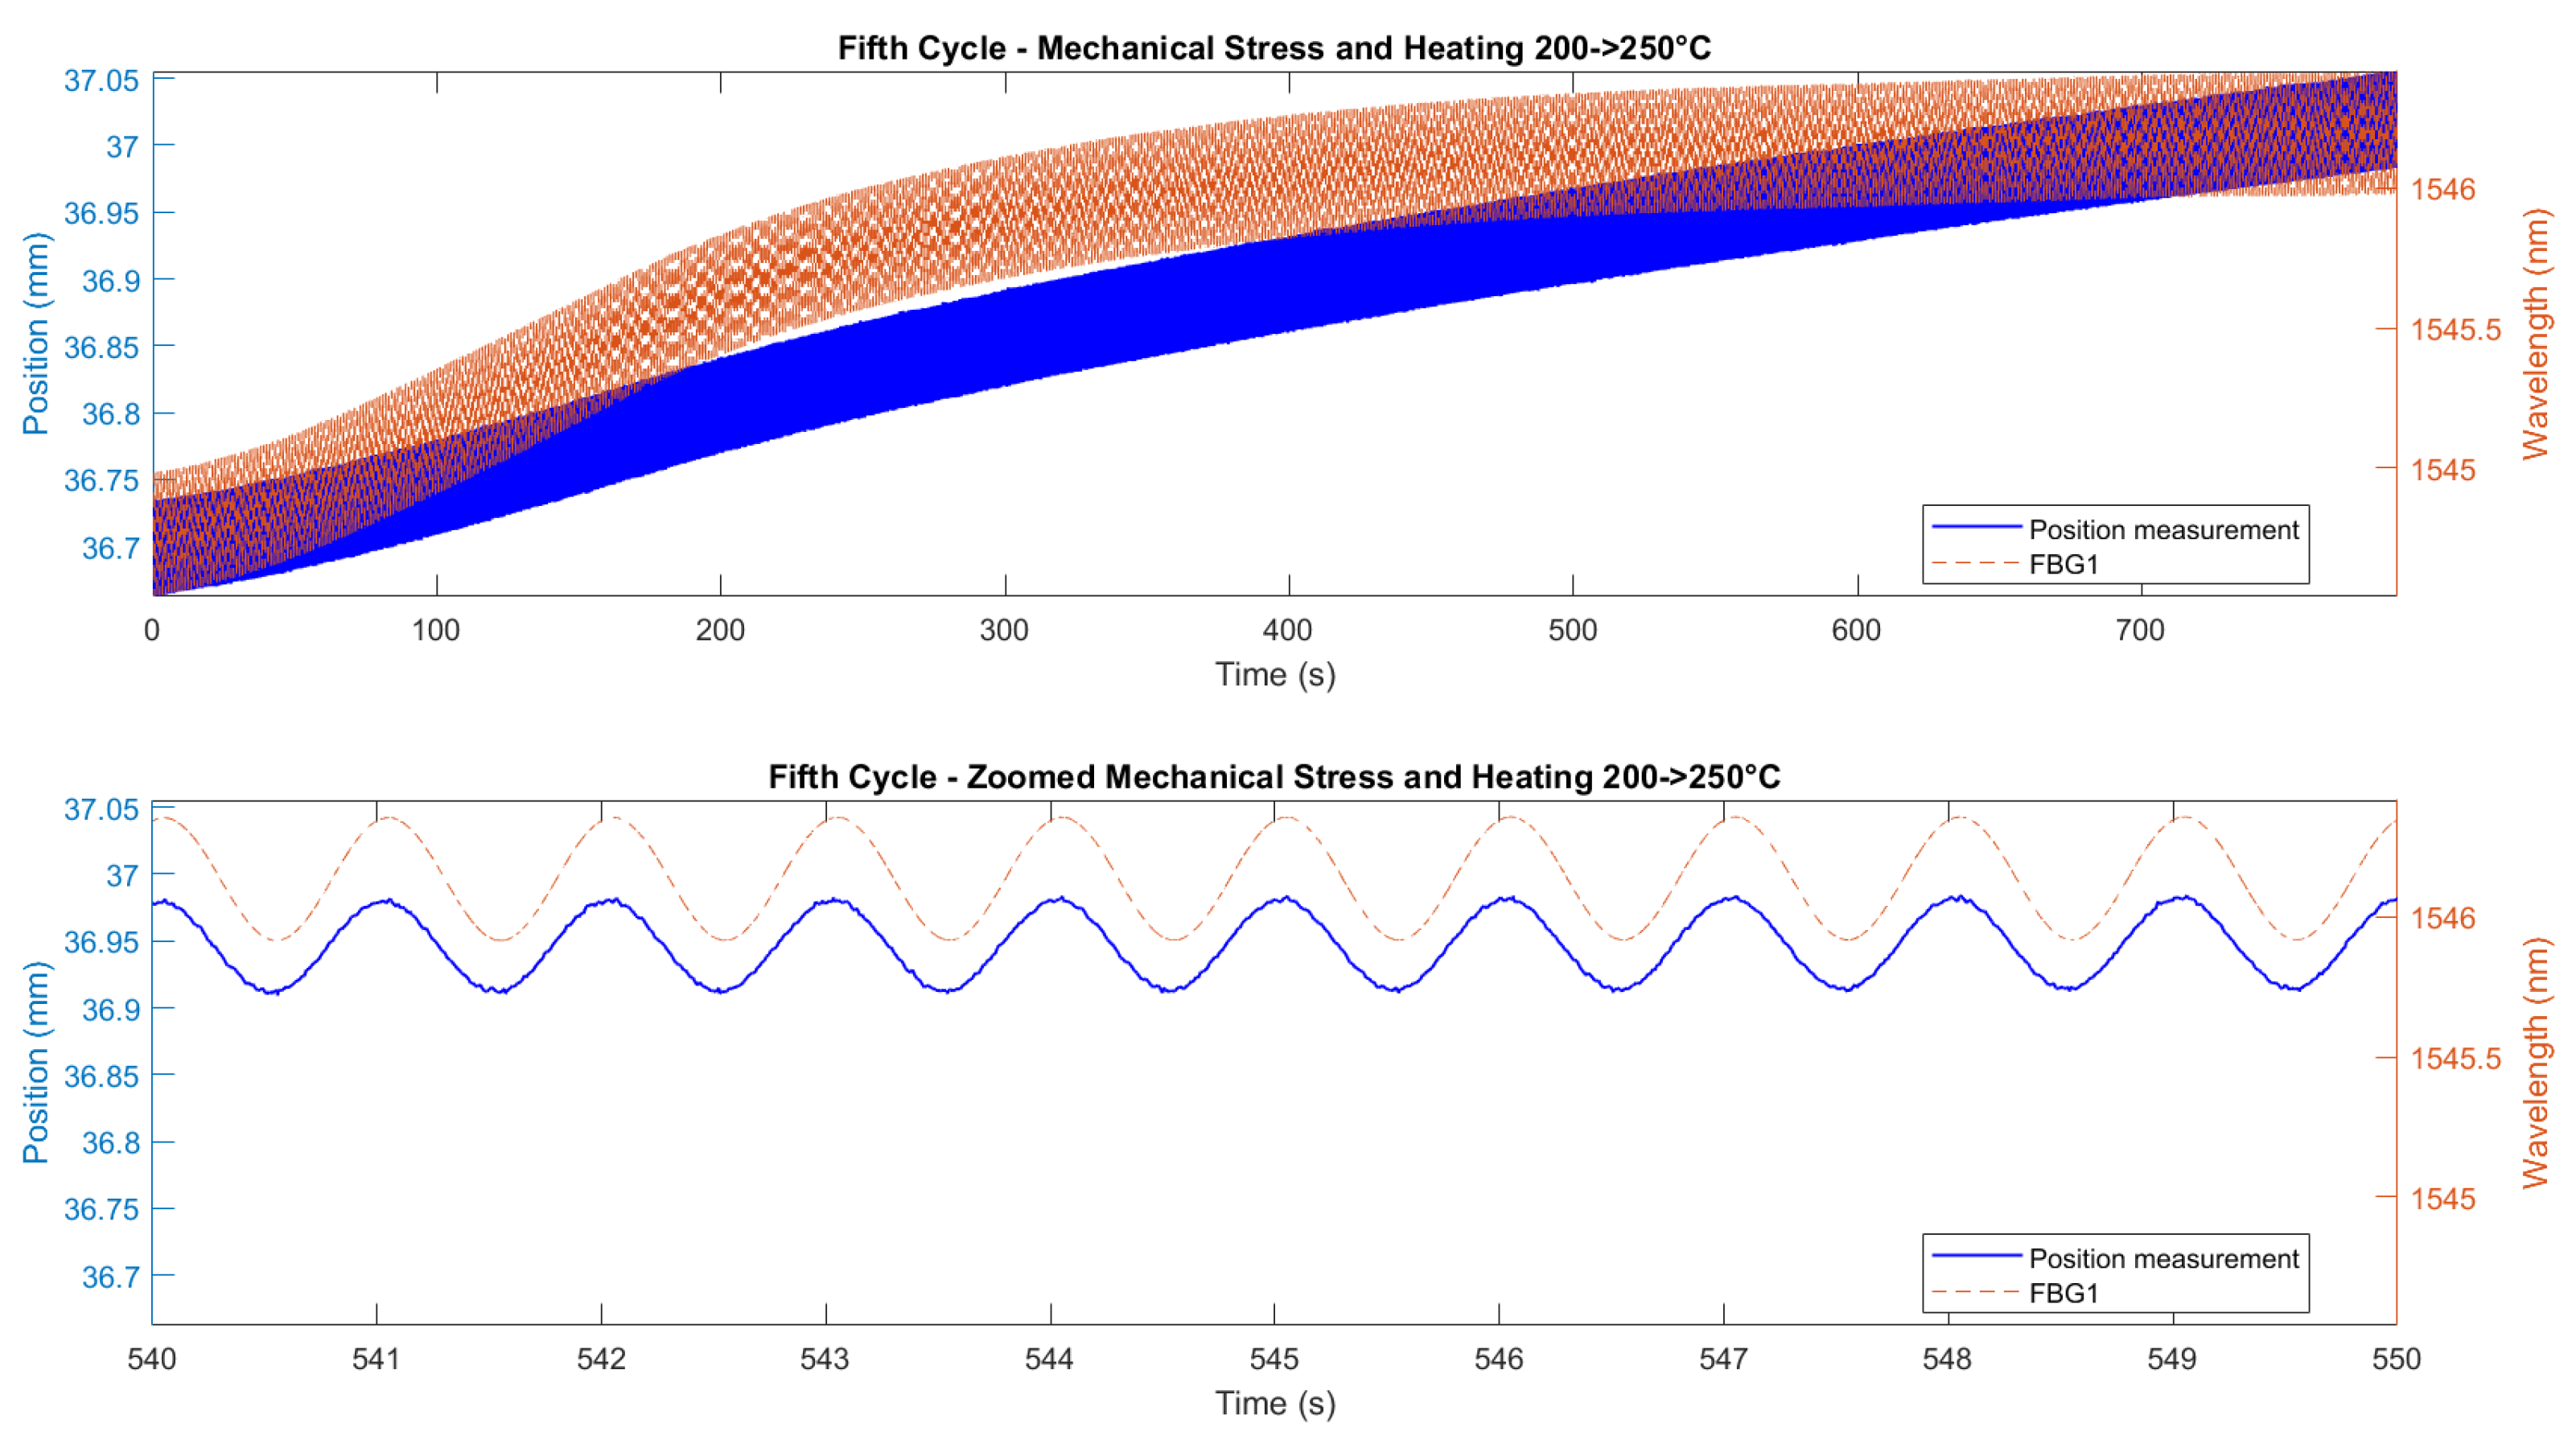
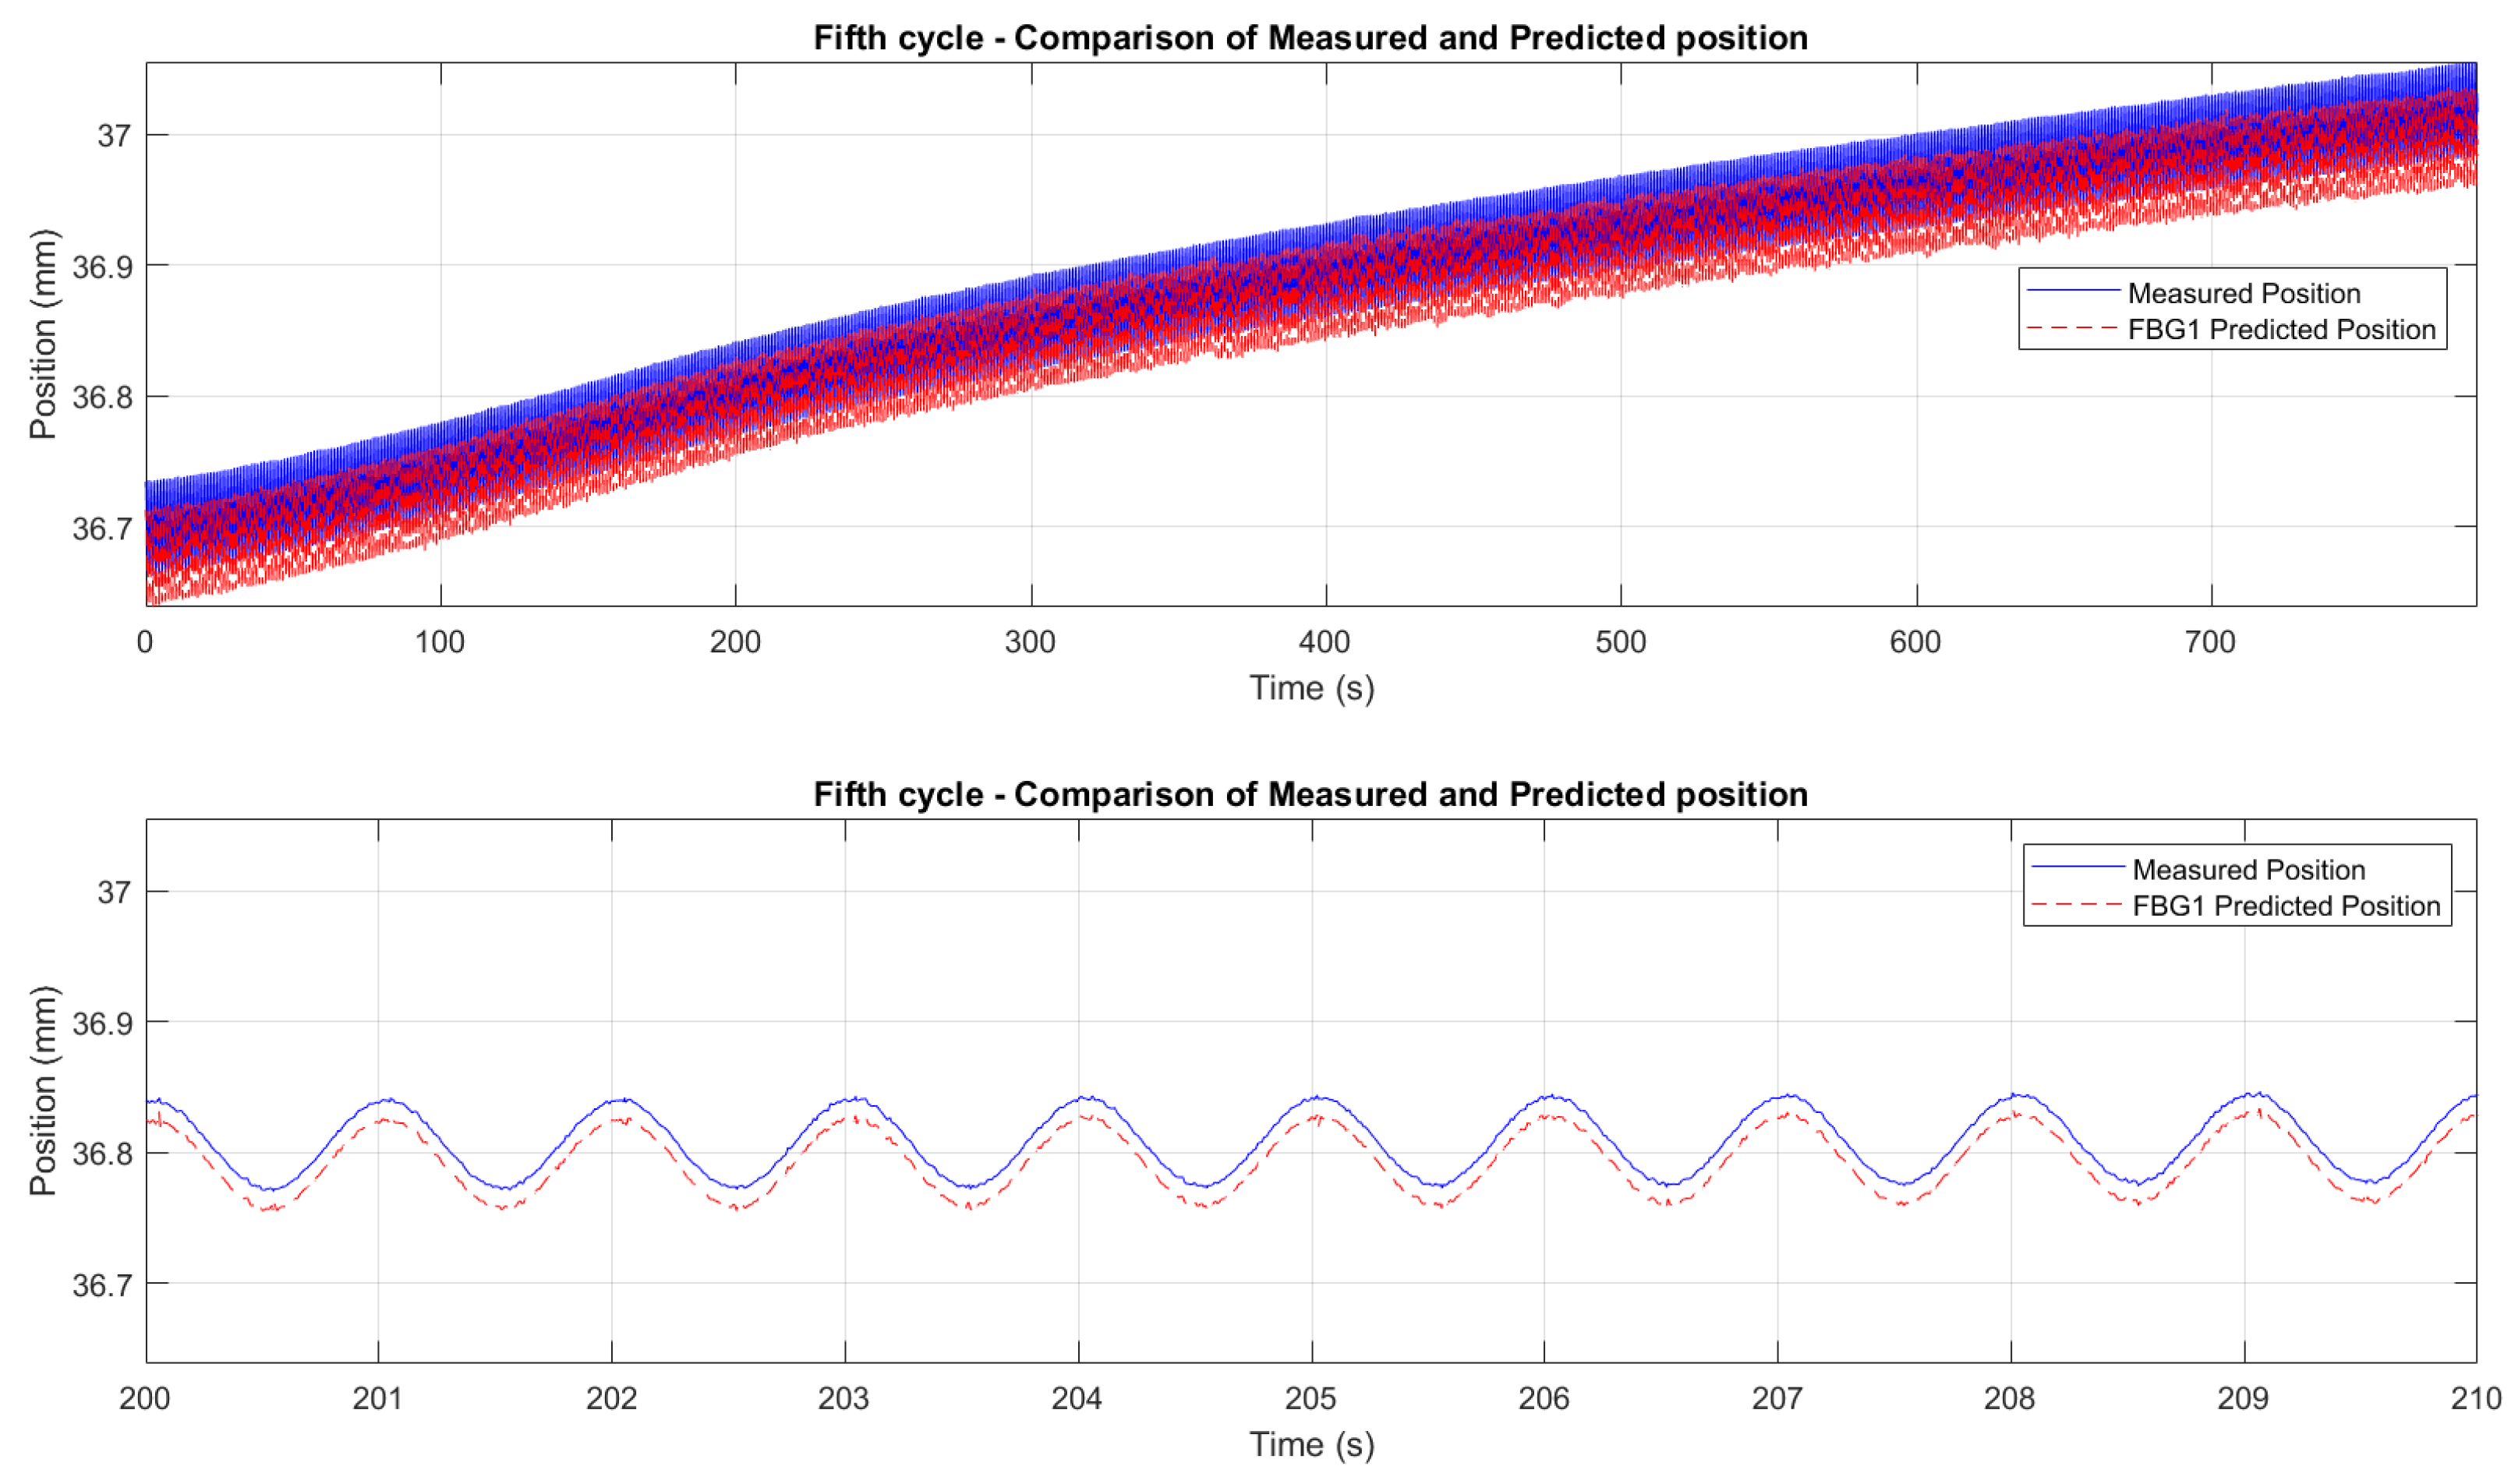
Correlation between FBG1 wavelength shift and Instron crosshead displacement during the fifth cycle of the second test (temperature ramp 200–250 °C, cyclic loading 1 Hz). Top panel shows the full cycle; bottom panel shows a zoomed interval. Blue solid line (left blue axis): Instron crosshead displacement. Orange dashed line (right orange axis): FBG wavelength shift (contains both temperature and stress contributions). A near-constant 20–30 ms time offset between the signals is observed, likely due to the viscoelastic response of the embedding resin and small synchronization differences between acquisition systems.
Figure 16.
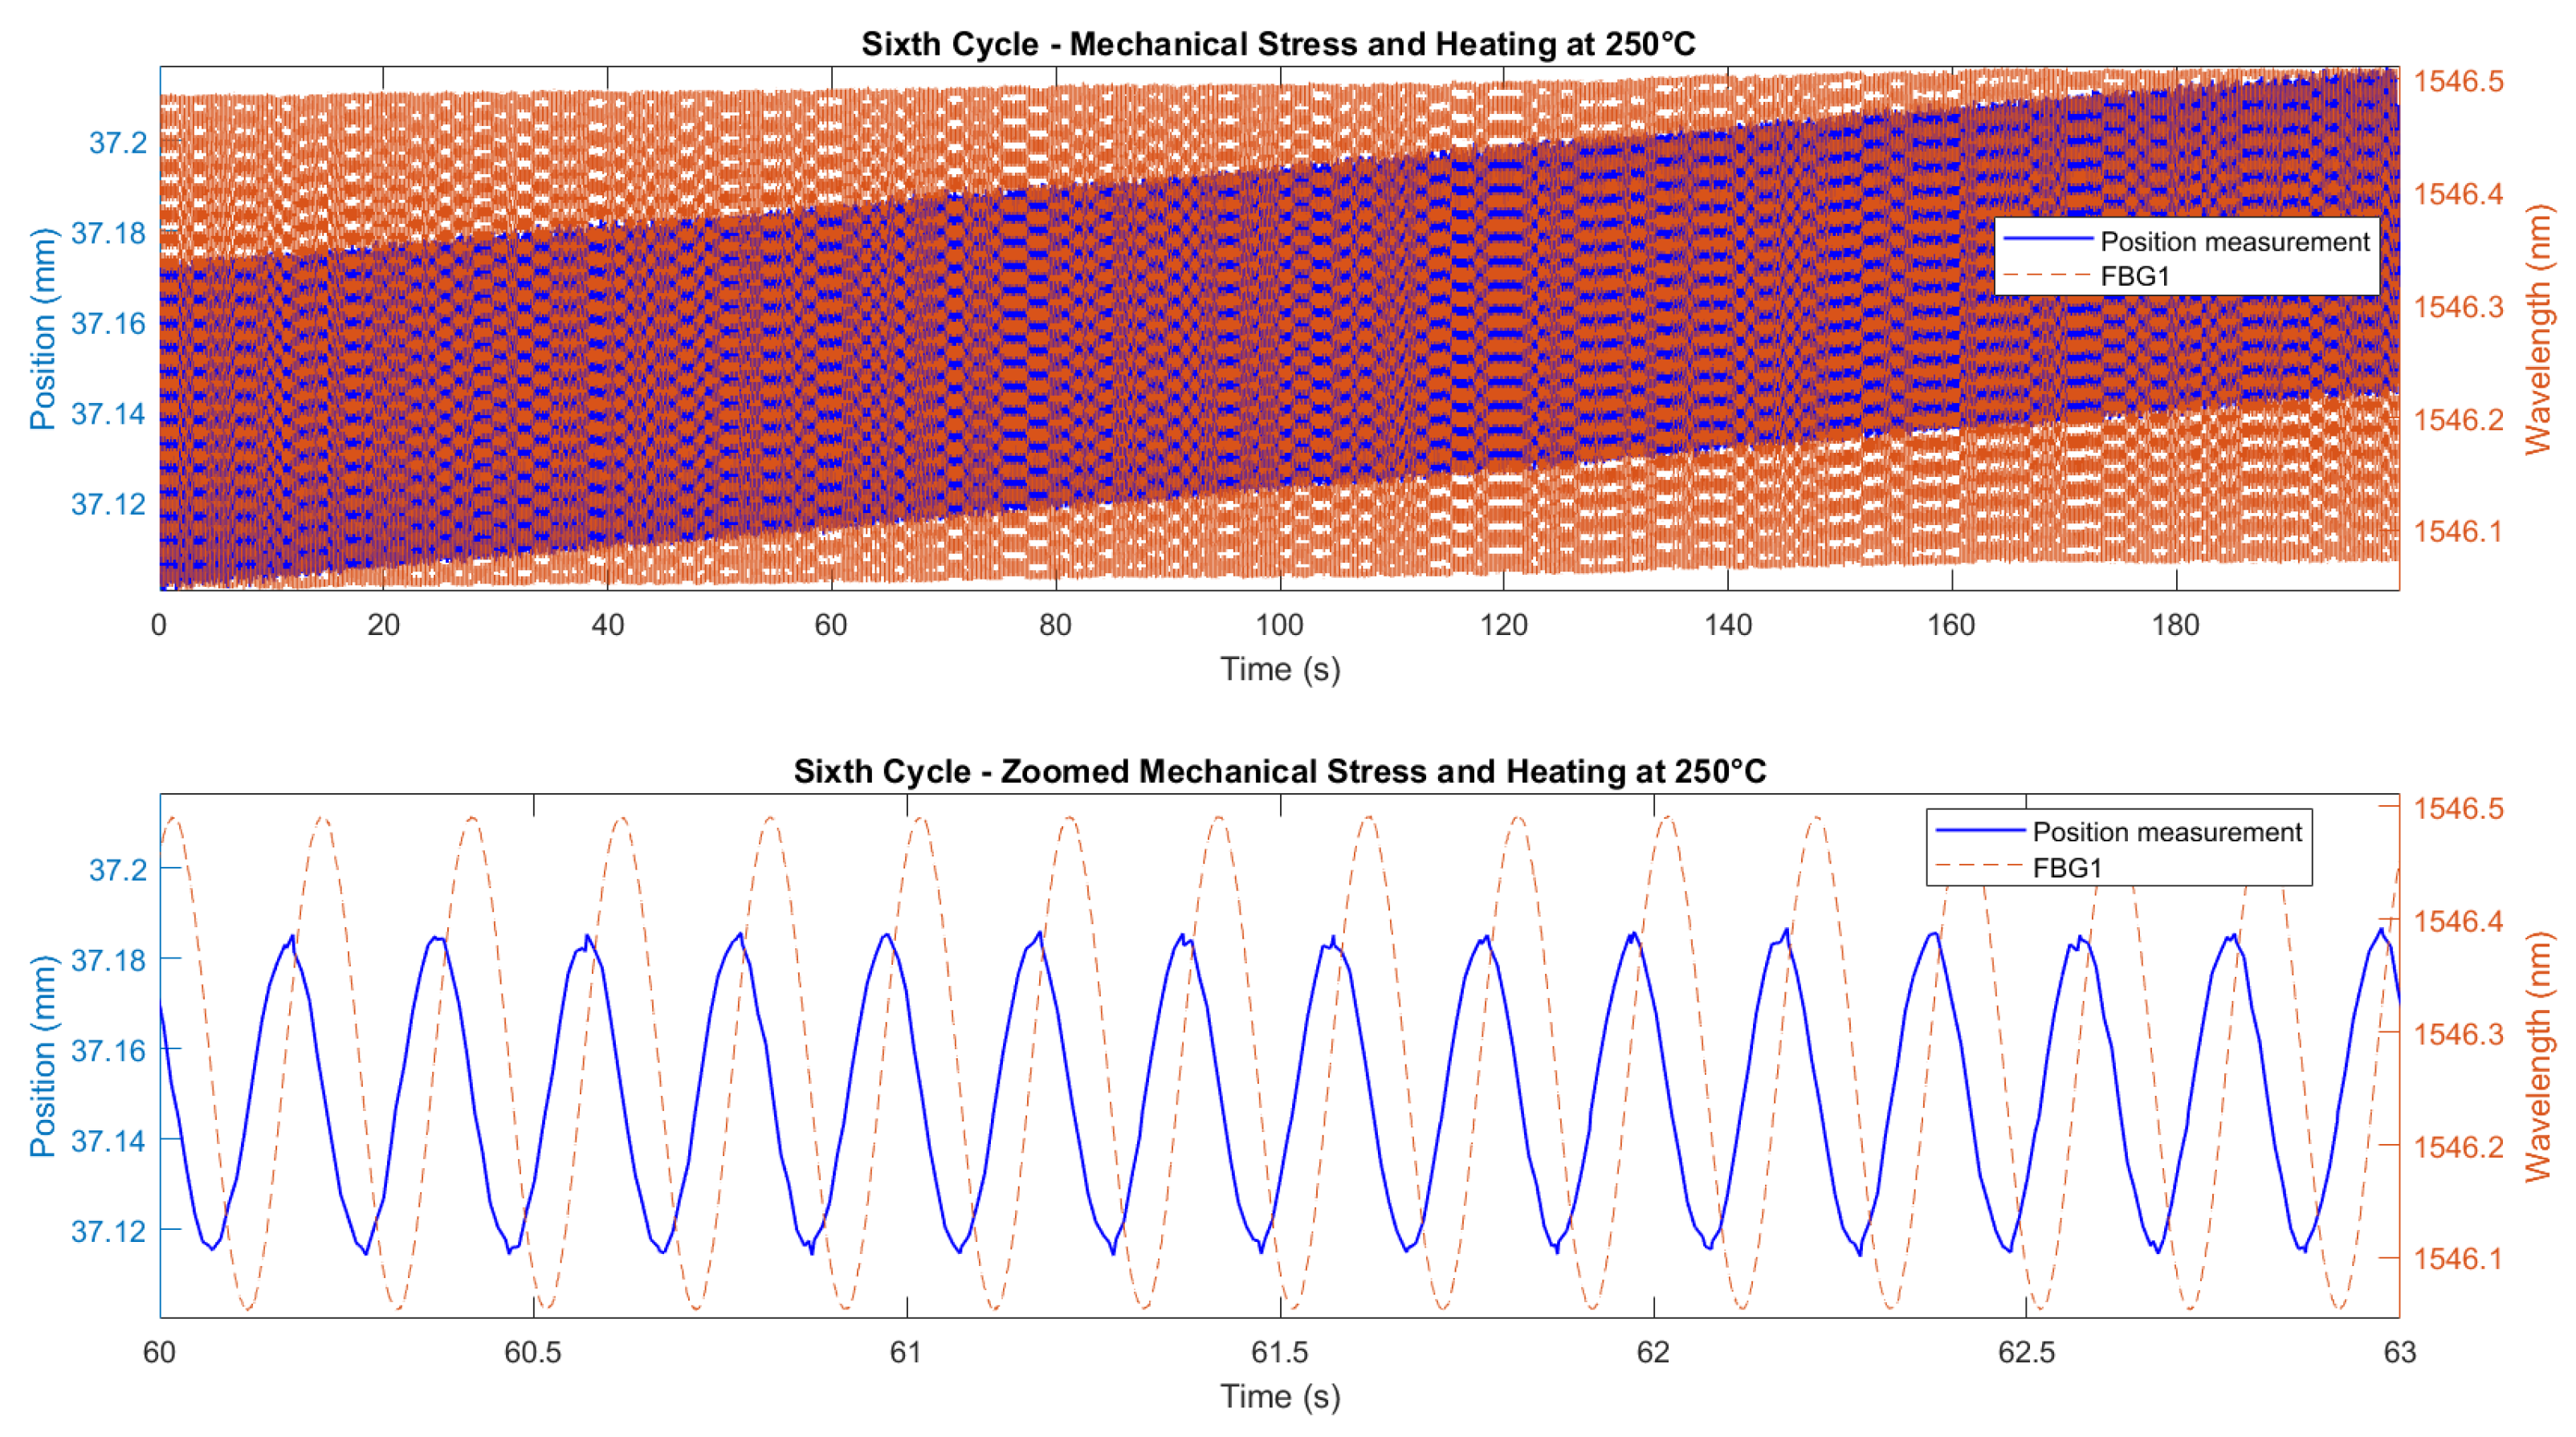
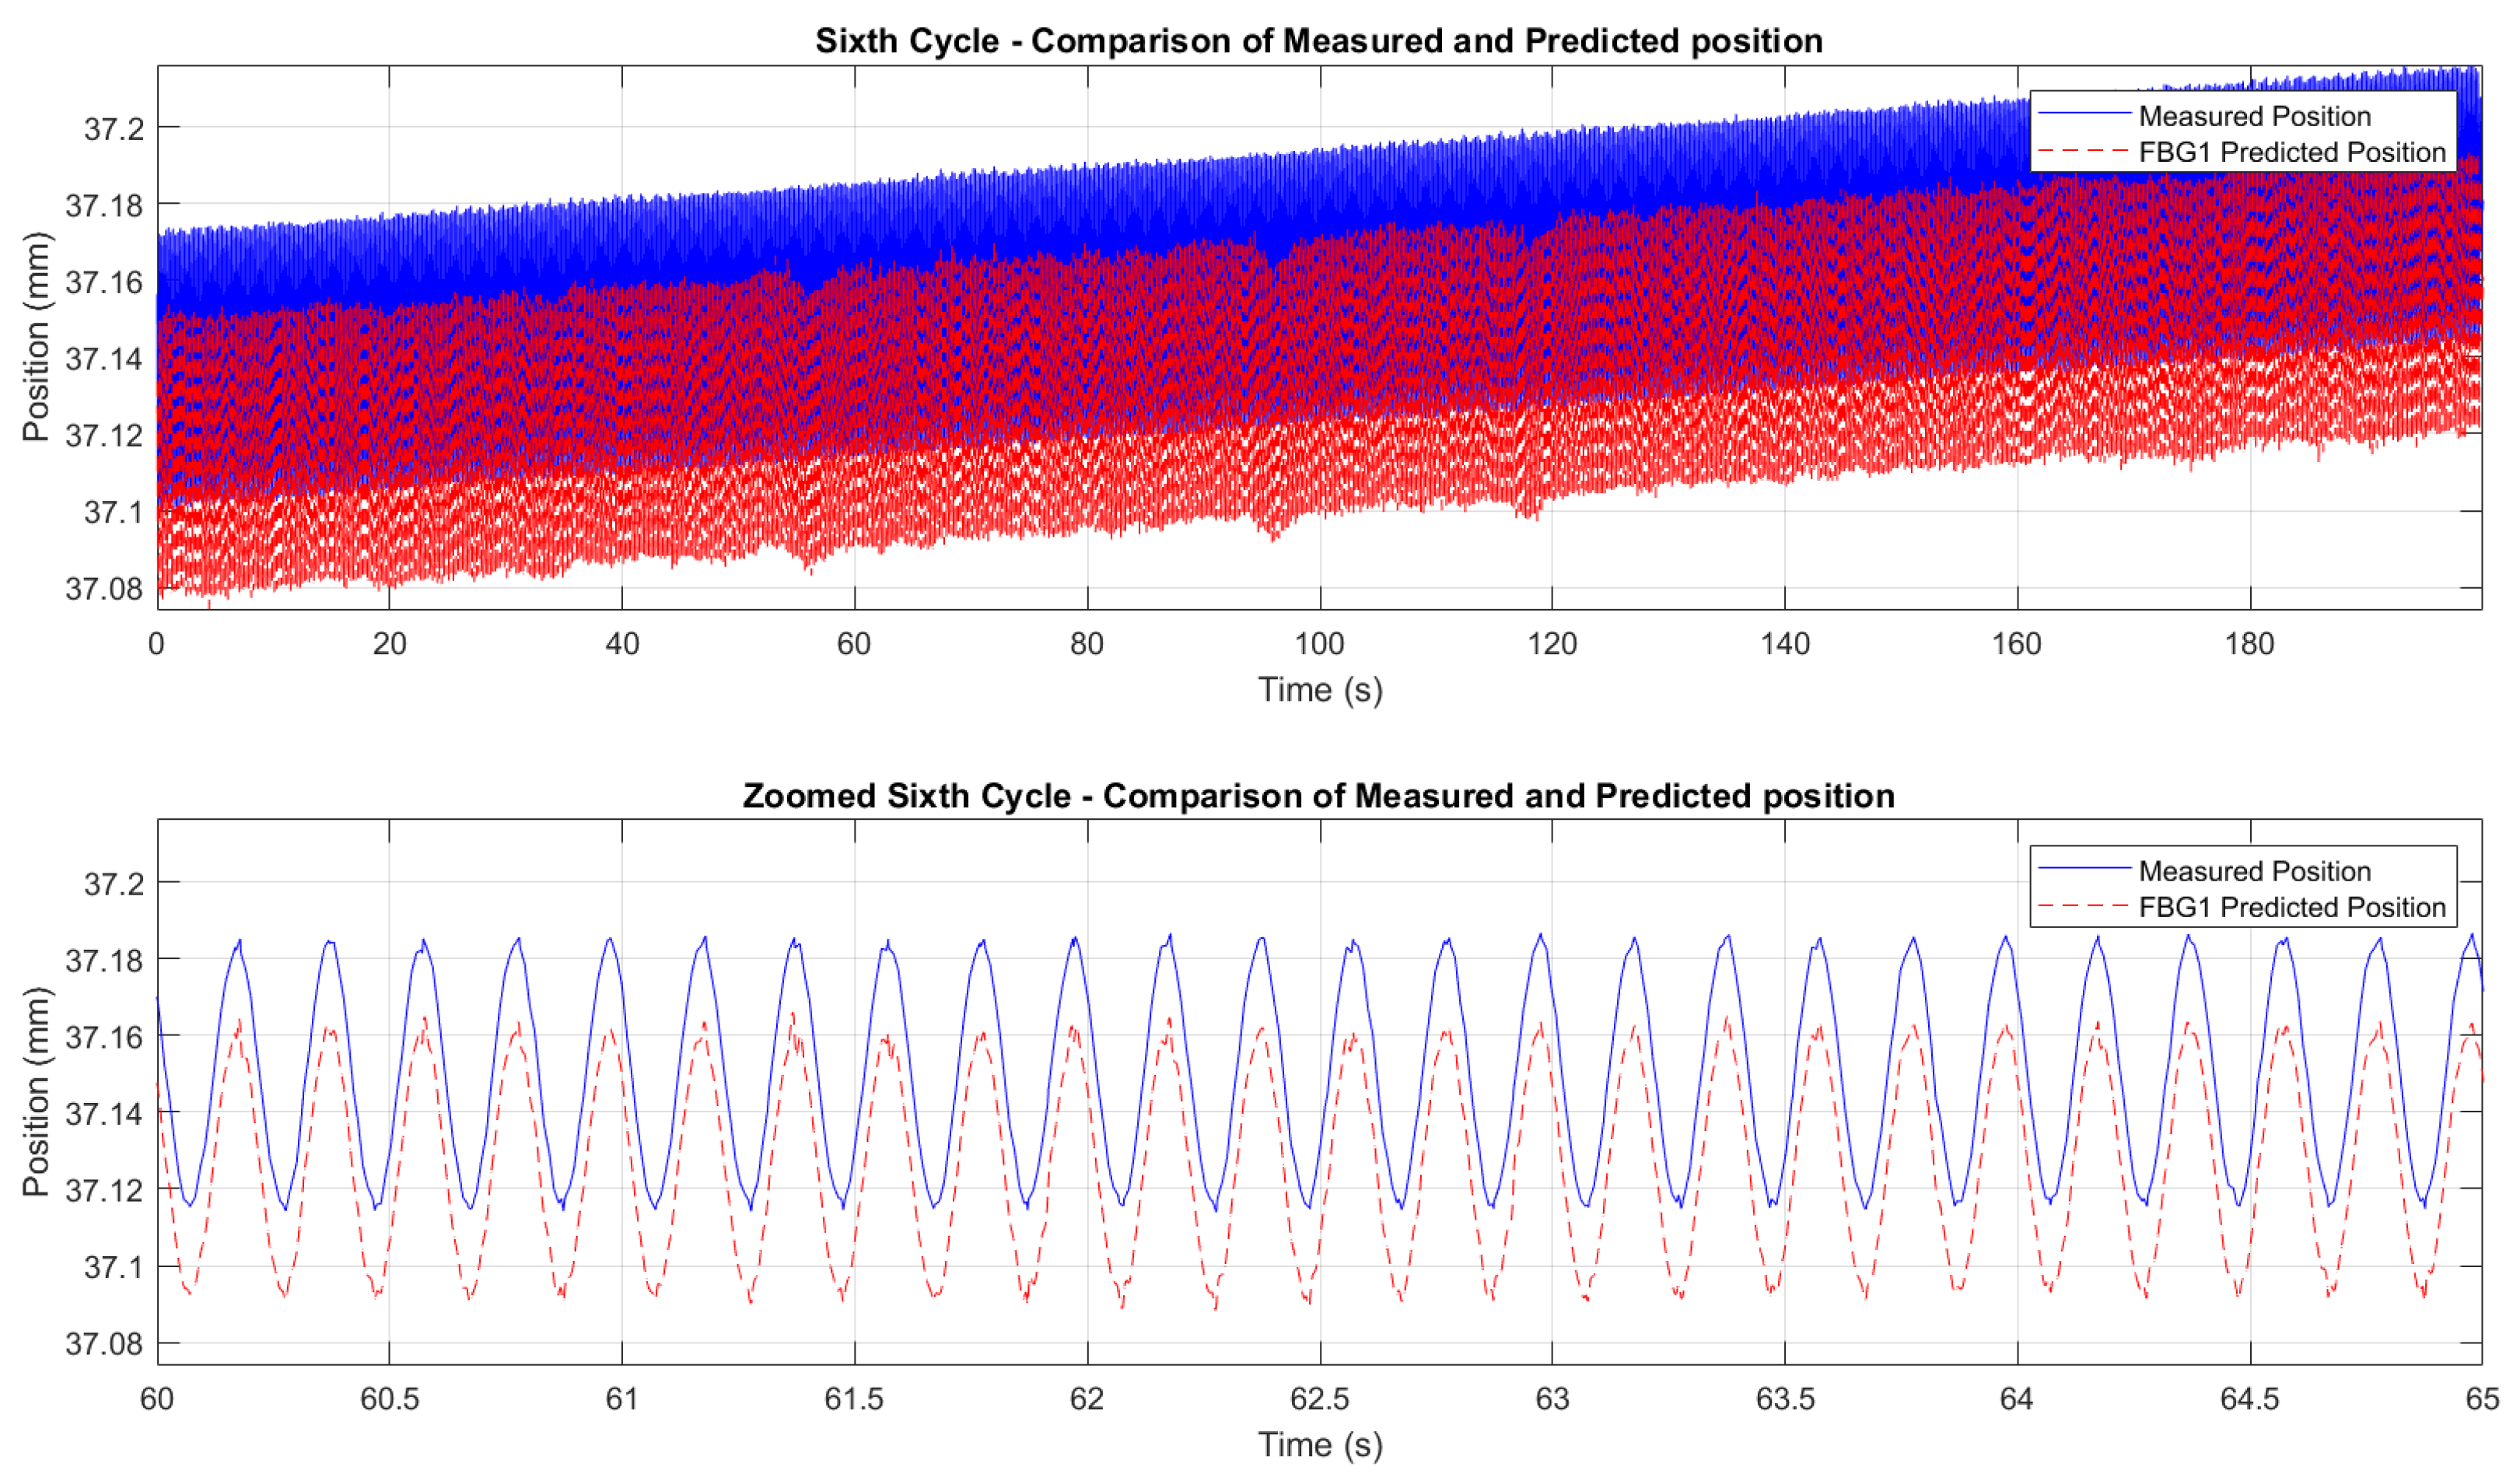
Correlation between FBG1 wavelength shift and Instron crosshead displacement during the sixth cycle of the second test (constant 250 °C, cyclic loading 5 Hz). Top panel shows the full cycle; bottom panel provides a zoomed interval for clarity. Blue solid line (left axis): Instron crosshead displacement. Orange dashed line (right axis): FBG wavelength shift (contains both temperature and stress contributions). A 20–30 ms offset, attributed to resin viscoelasticity and minor timing differences, is visible here, too; dynamic trends and amplitudes remain consistent.
Figure 17.
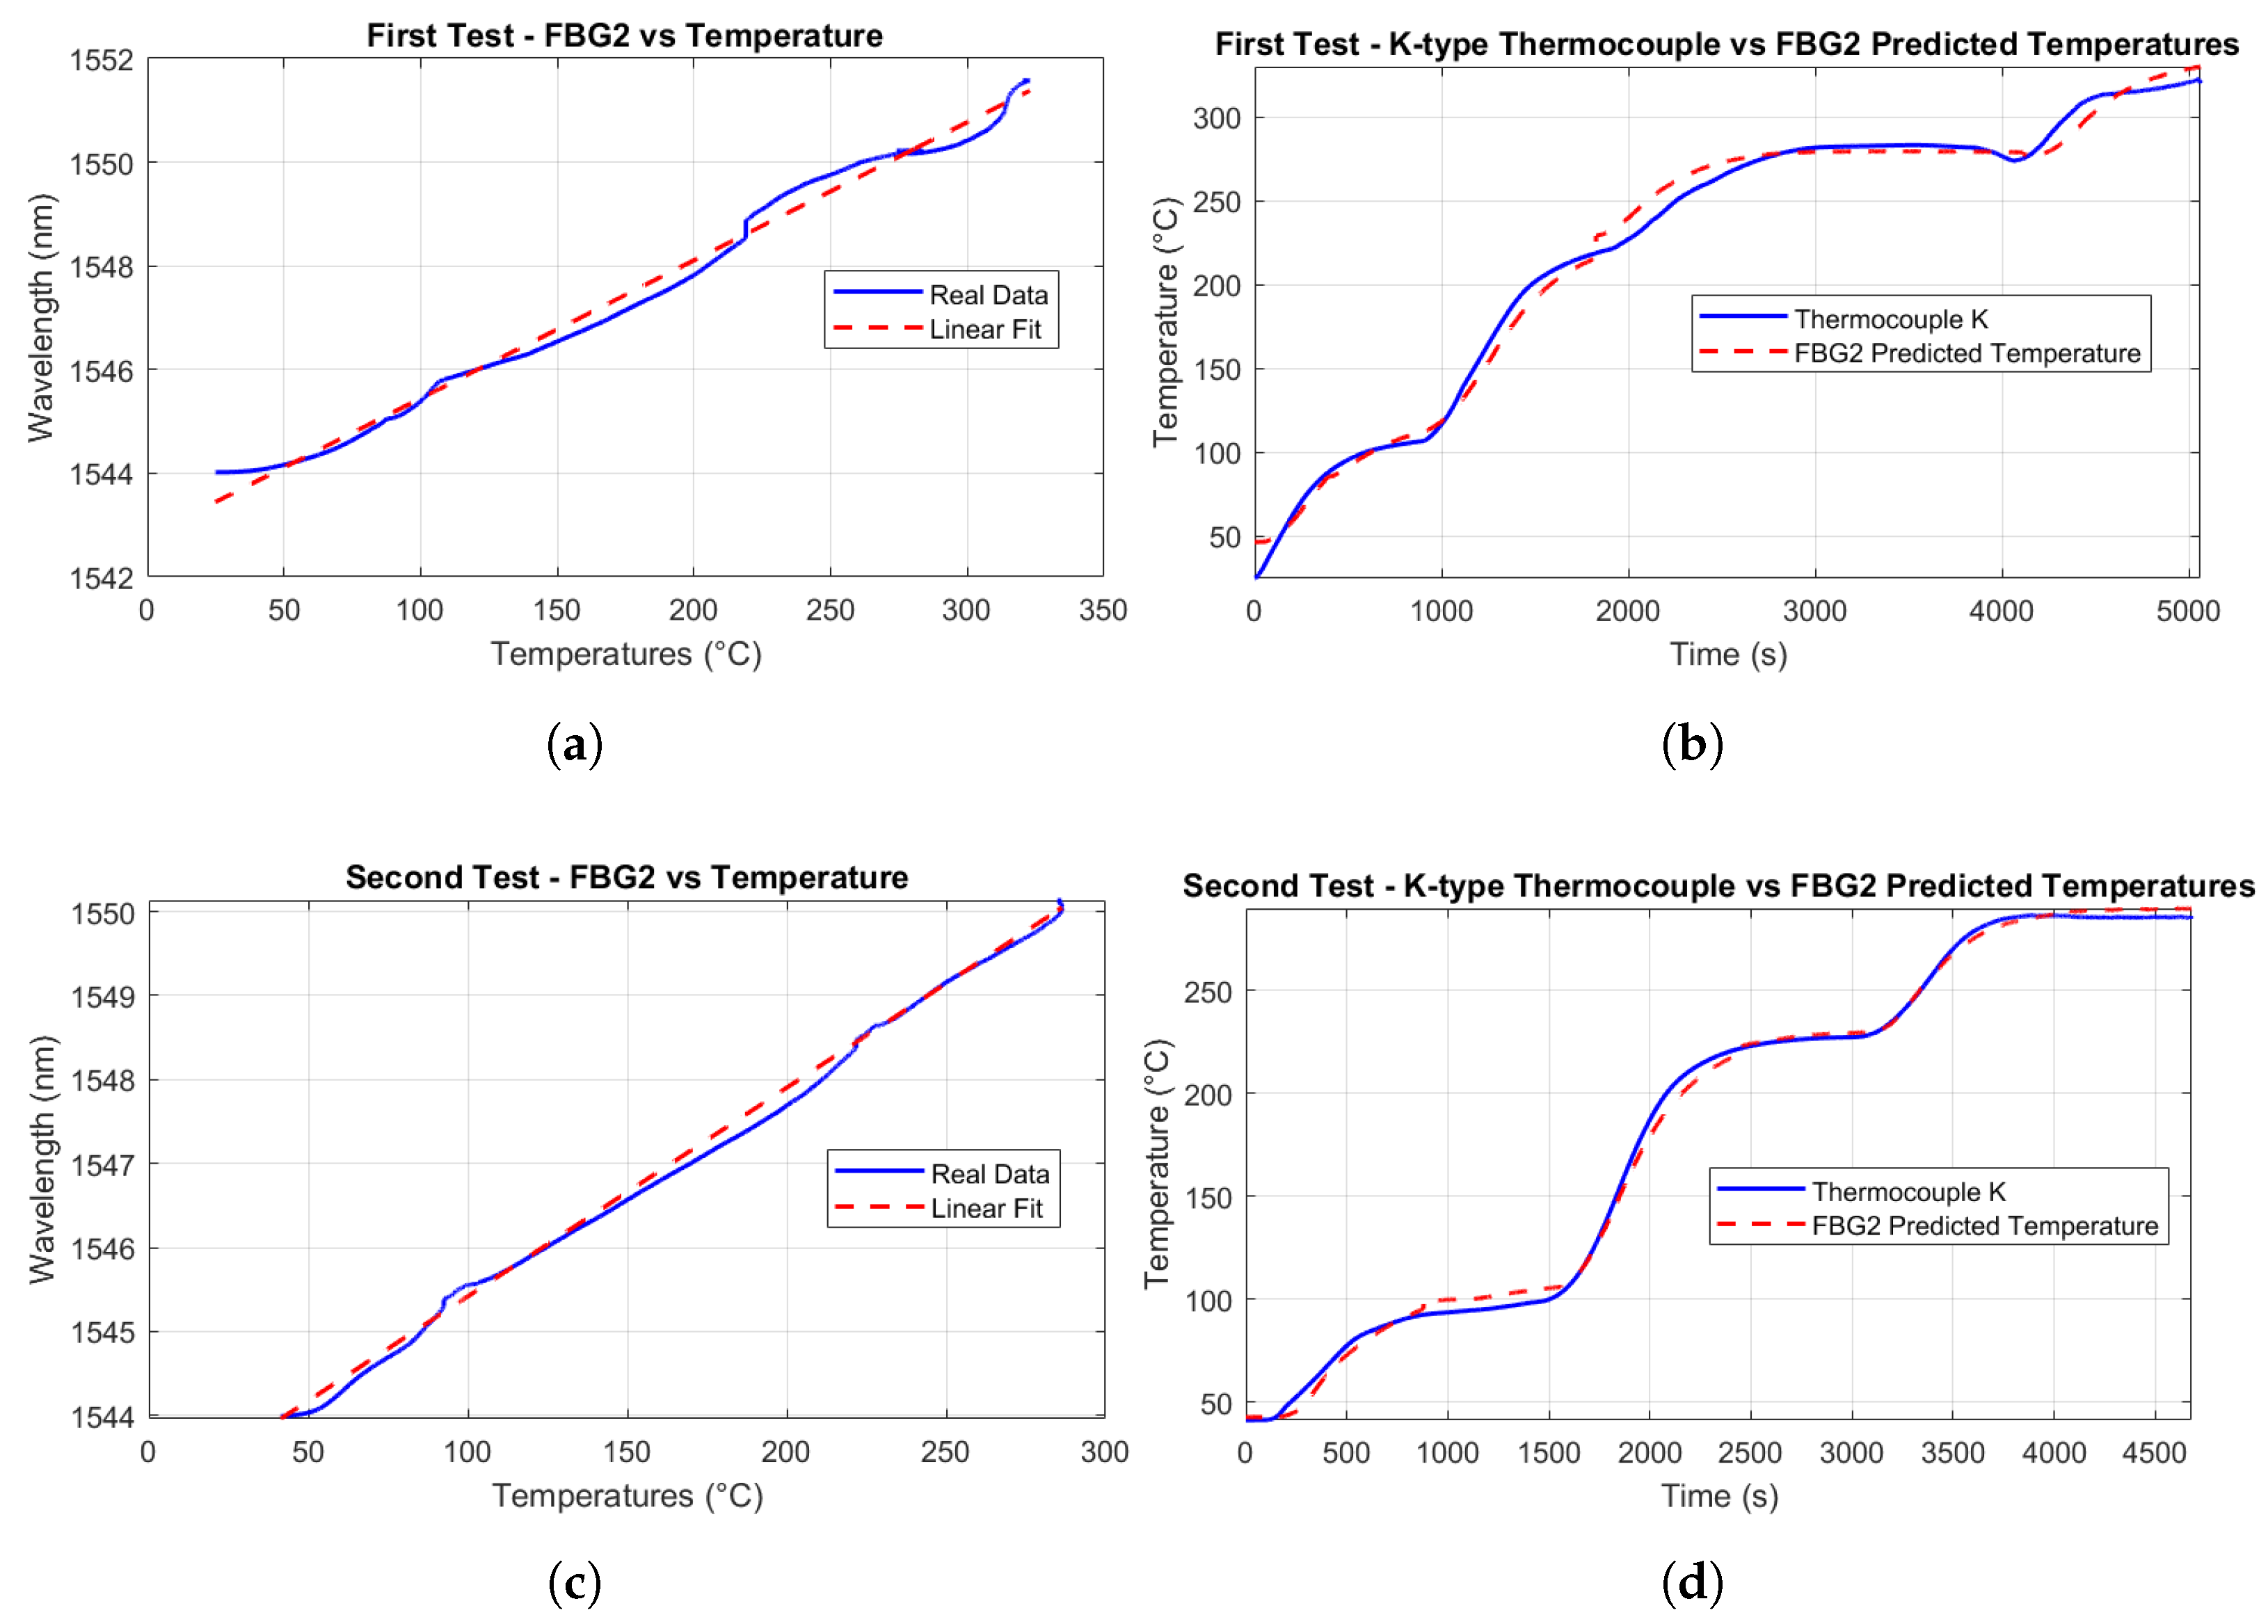
Thermal calibration of FBG2. (a) Correlation between temperature and Bragg wavelength shift during the first calibration test, with experimental data (blue line) and linear regression fit (red dashed line). (b) Temperature values predicted from FBG2 during the first test (red dashed line) compared to reference measurements from a K-type thermocouple (blue line). (c) Correlation between temperature and Bragg wavelength shift during the second calibration test, again showing raw data (blue line) and linear fit (red dashed line). (d) Predicted temperatures obtained from FBG2 during the second test (red dashed line) and comparison to the K-type thermocouple measurements (blue line).
Figure 18.
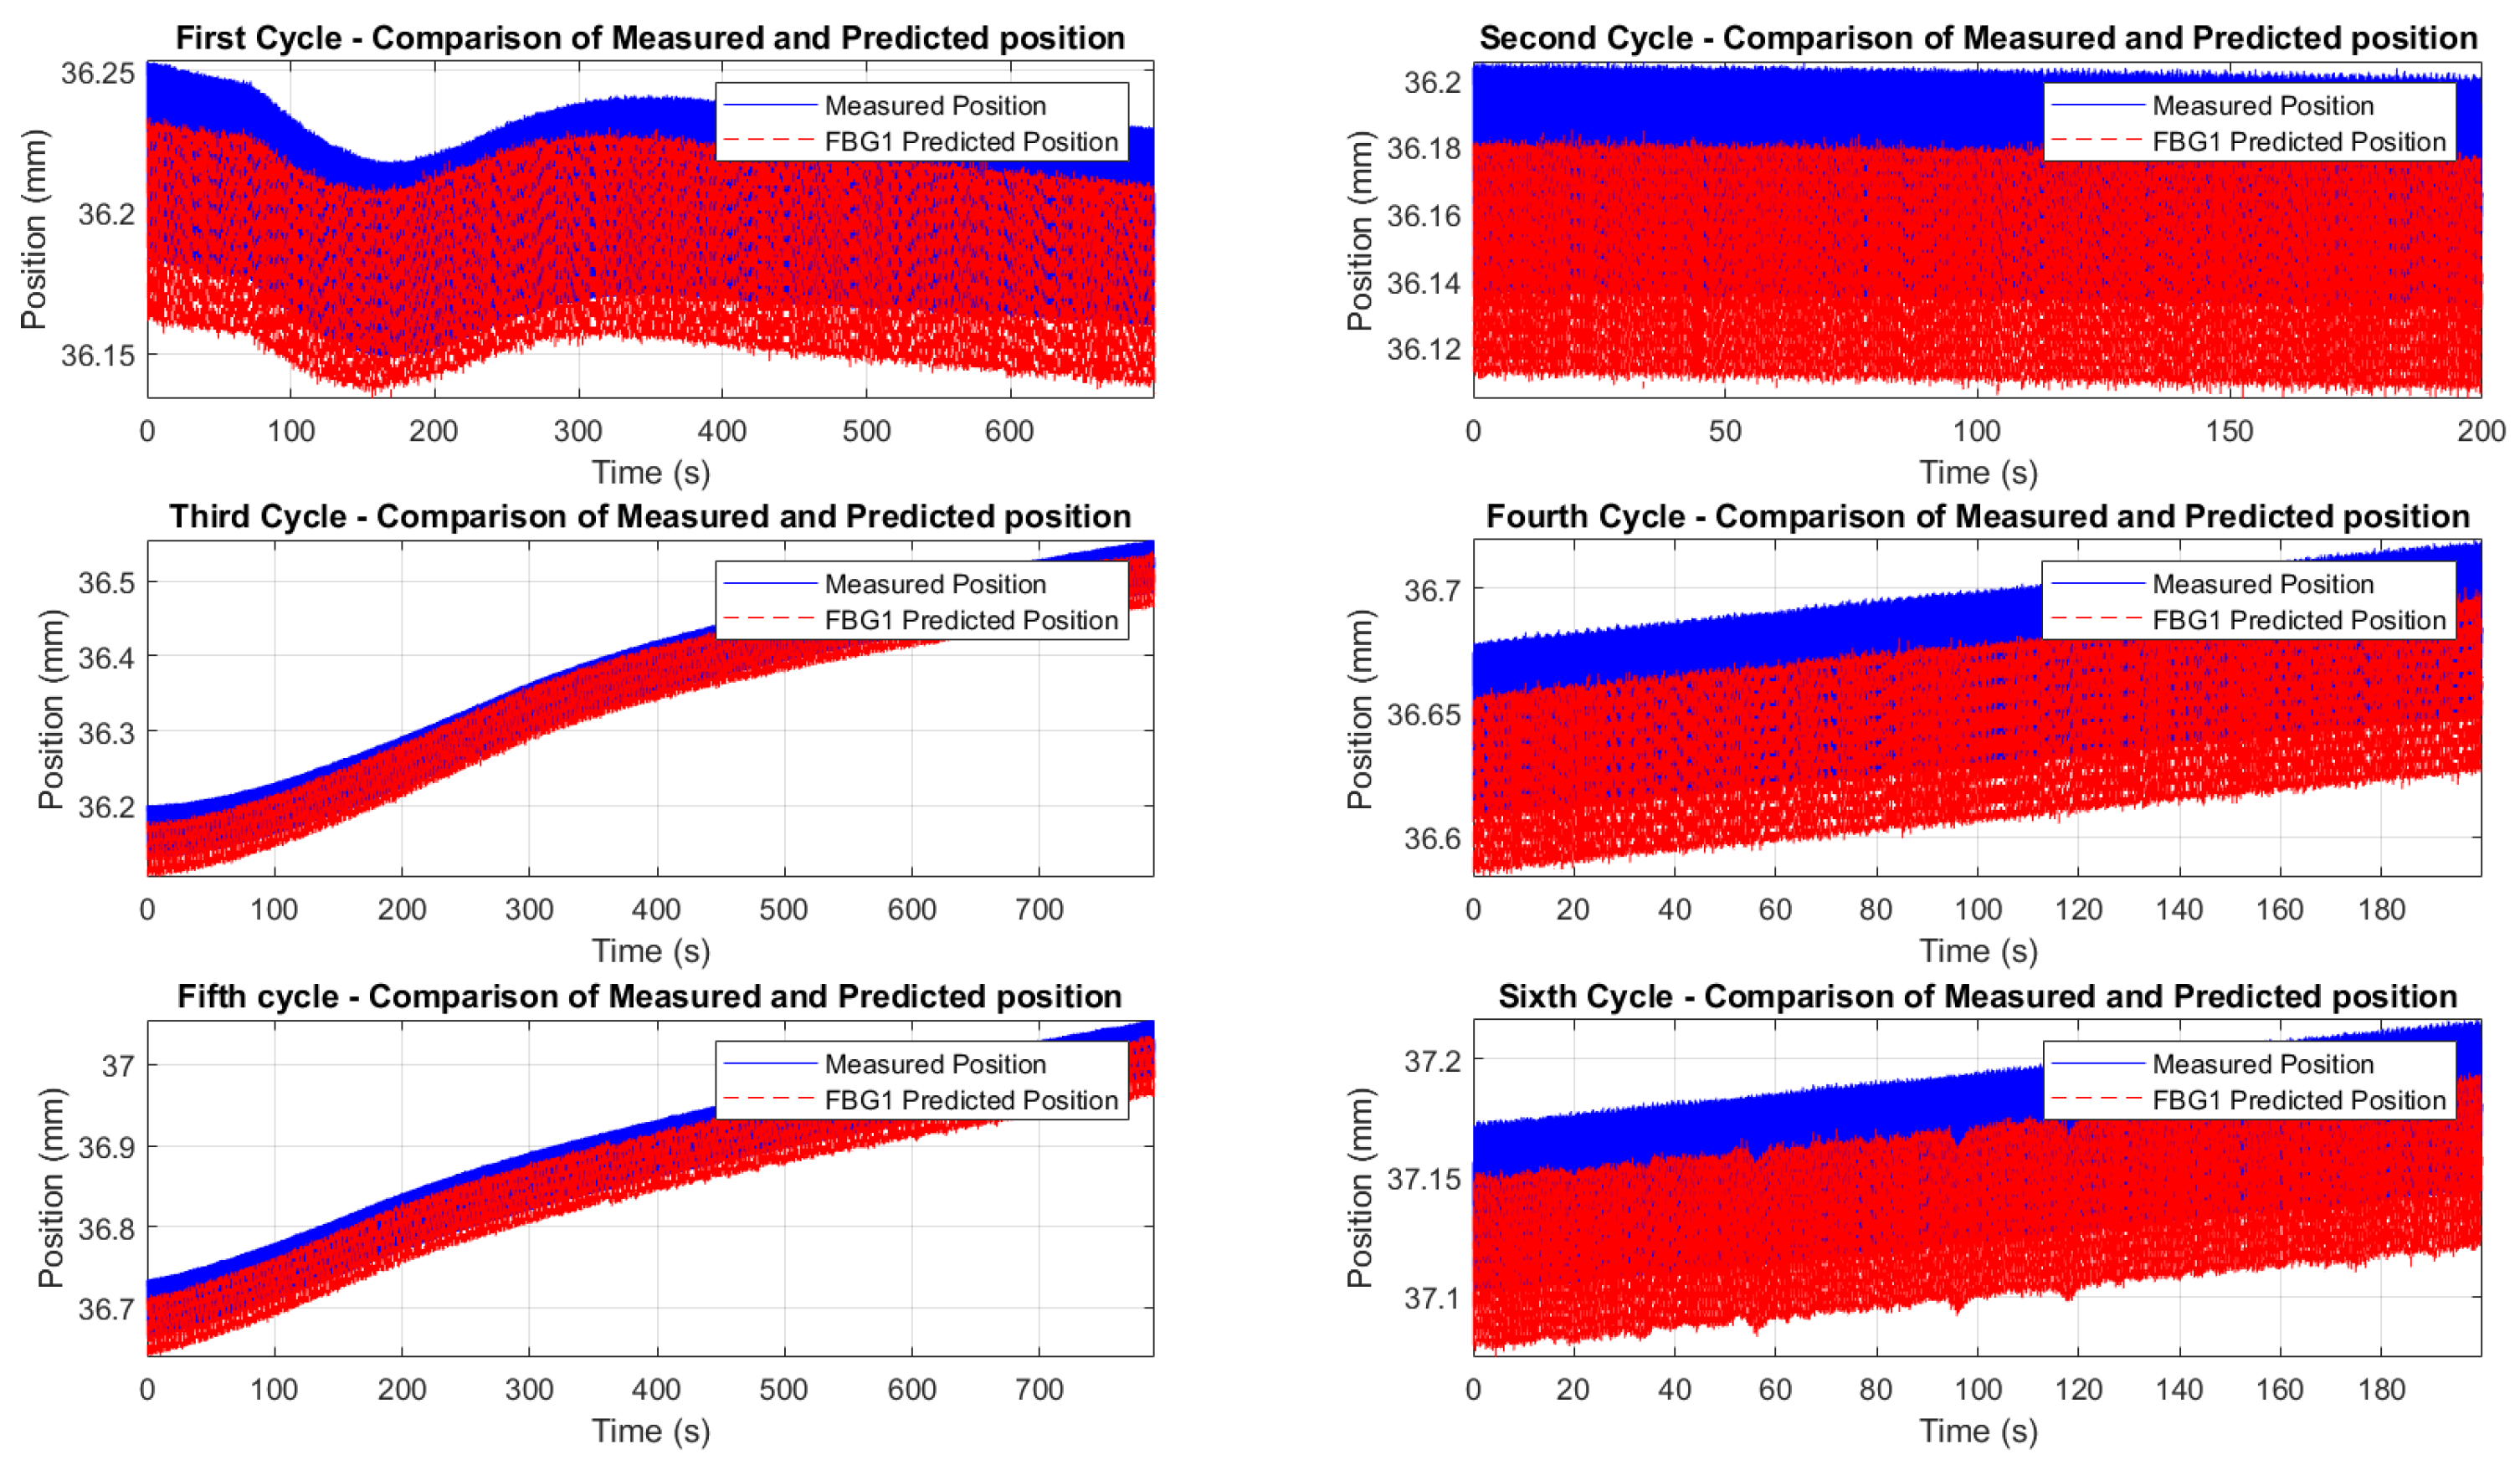
Comparison between measured displacement (blue solid line) and FBG-predicted displacement (red dashed line) during the second thermo-mechanical test. Each subplot represents one of the six consecutive loading–unloading cycles, arranged sequentially from top left to bottom right. The reference sensor (FBG2) was used to compensate for temperature-induced strain shifts, enabling an effective isolation of the displacement signal. Predicted displacements consistently undershoot the Instron crosshead values by a near-constant amount; this downward bias is primarily attributed to a calibration/intercept offset and partial strain transfer through the adhesive layer.
Figure 19.
Zoomed comparison between FBG1-predicted displacement (red dashed line) and Instron crosshead displacement (blue solid line) during the fifth cycle (temperature ramp 200–250 °C, cyclic loading 1 Hz). Predicted displacements were obtained after temperature compensation using FBG2 and conversion with the displacement sensitivity coefficients reported in
Table 3. The figure highlights excellent waveform agreement while revealing a small, near-constant bias and minor hysteretic behavior attributable to adhesive shear-lag and resin plasticity during peak loads.
Figure 20.
Zoomed comparison between FBG1-predicted displacement (red dashed line) and Instron crosshead displacement (blue solid line) during the sixth cycle (constant 250 °C, cyclic loading 5 Hz). The figure shows preserved amplitude and repeatability after temperature-effect compensation using FBG2, with a slight downward offset of the FBG prediction consistent with incomplete local strain transfer (adhesive compliance/debonding) and small synchronization/compensation residuals. Displacement sensitivity coefficients used for the prediction are reported in
Table 3.
Table 1.
Femtosecond-inscribed FBG specifications for the experimental setup.
Table 1.
Femtosecond-inscribed FBG specifications for the experimental setup.
| FBG ID | Wavelength (nm) | Reflectivity (%) |
|---|
| FBG1 | 1539.64 | 54.82 |
| FBG2 | 1544.03 | 54.45 |
| FBG3 | 1548.01 | 54.02 |
| FBG4 | 1551.94 | 53.55 |
Table 2.
Temperature sensitivity coefficients of each FBG sensor for the first and second thermal cycles.
Table 2.
Temperature sensitivity coefficients of each FBG sensor for the first and second thermal cycles.
| FBG’s ID | First Cycle (pm/°C) | Second Cycle (pm/°C) |
|---|
| FBG1 | 12.33 | 12.37 |
| FBG2 | 12.43 | 12.48 |
| FBG3 | 12.51 | 12.56 |
| FBG4 | 12.62 | 12.61 |
Table 3.
Displacement sensitivity coefficients of FBG4 and FBG1 sensors during the two thermo-mechanical test cycles.
Table 3.
Displacement sensitivity coefficients of FBG4 and FBG1 sensors during the two thermo-mechanical test cycles.
| Cycle | First Test FBG4 (nm/mm) | Second Test FBG1 (nm/mm) |
|---|
| 1 | 2.03 | 3.25 |
| 2 | 2.39 | 3.42 |
| 3 | 2.55 | 3.58 |
| 4 | 2.64 | 3.95 |
| 5 | 2.82 | 2.79 |
| 6 | 2.36 | 2.37 |
Table 4.
Thermal test performance of FBG sensors. The coefficient of determination (R2) indicates the quality of the linear fit, while the RMSE quantifies the discrepancies between FBG-estimated temperatures and K-type thermocouple reference values for the first and second thermal cycles.
Table 4.
Thermal test performance of FBG sensors. The coefficient of determination (R2) indicates the quality of the linear fit, while the RMSE quantifies the discrepancies between FBG-estimated temperatures and K-type thermocouple reference values for the first and second thermal cycles.
| Sensor | First Cycle R2 | First Cycle RMSE (°C) | Second Cycle R2 | Second Cycle RMSE (°C) |
|---|
| FBG1 | 0.9946 | 5.20 | 0.9946 | 5.06 |
| FBG2 | 0.9948 | 5.08 | 0.9948 | 4.85 |
| FBG3 | 0.9959 | 4.52 | 0.9959 | 4.44 |
| FBG4 | 0.9981 | 3.12 | 0.9981 | 2.98 |
Table 5.
Thermal compensation performance of FBG2, showing RMSE against K-type thermocouple measurements and R2 of the linear fit for the entire first and second thermo-mechanical tests. FBG2 was not mechanically loaded and served as the temperature reference.
Table 5.
Thermal compensation performance of FBG2, showing RMSE against K-type thermocouple measurements and R2 of the linear fit for the entire first and second thermo-mechanical tests. FBG2 was not mechanically loaded and served as the temperature reference.
| Test | RMSE (°C) | R2 |
|---|
| First Test | 7.28 | 0.9921 |
| Second Test | 4.03 | 0.9982 |
Table 6.
Cycle-specific RMSE values for FBG2 used for temperature compensation, computed for each of the six cycles included in the first and second thermo-mechanical tests.
Table 6.
Cycle-specific RMSE values for FBG2 used for temperature compensation, computed for each of the six cycles included in the first and second thermo-mechanical tests.
| Cycle | First Test RMSE (°C) | Second Test RMSE (°C) |
|---|
| 1 | 6.35 | 10.09 |
| 2 | 11.30 | 5.91 |
| 3 | 9.79 | 14.29 |
| 4 | 1.40 | 2.07 |
| 5 | 0.73 | 5.76 |
| 6 | 1.92 | 3.98 |
Table 7.
Cycle-specific RMSE values of displacement estimation for FBG4 and FBG1, obtained by comparing FBG-predicted positions with the Instron crosshead displacement over the first and second thermo-mechanical tests.
Table 7.
Cycle-specific RMSE values of displacement estimation for FBG4 and FBG1, obtained by comparing FBG-predicted positions with the Instron crosshead displacement over the first and second thermo-mechanical tests.
| Cycle | First Test FBG4 RMSE (mm) | Second Test FBG1 RMSE (mm) |
|---|
| 1 | 0.0117 | 0.0164 |
| 2 | 0.0076 | 0.0239 |
| 3 | 0.0152 | 0.0141 |
| 4 | 0.0161 | 0.0219 |
| 5 | 0.0112 | 0.0180 |
| 6 | 0.0125 | 0.0234 |
