3.1. Evaluation of Laser Seam
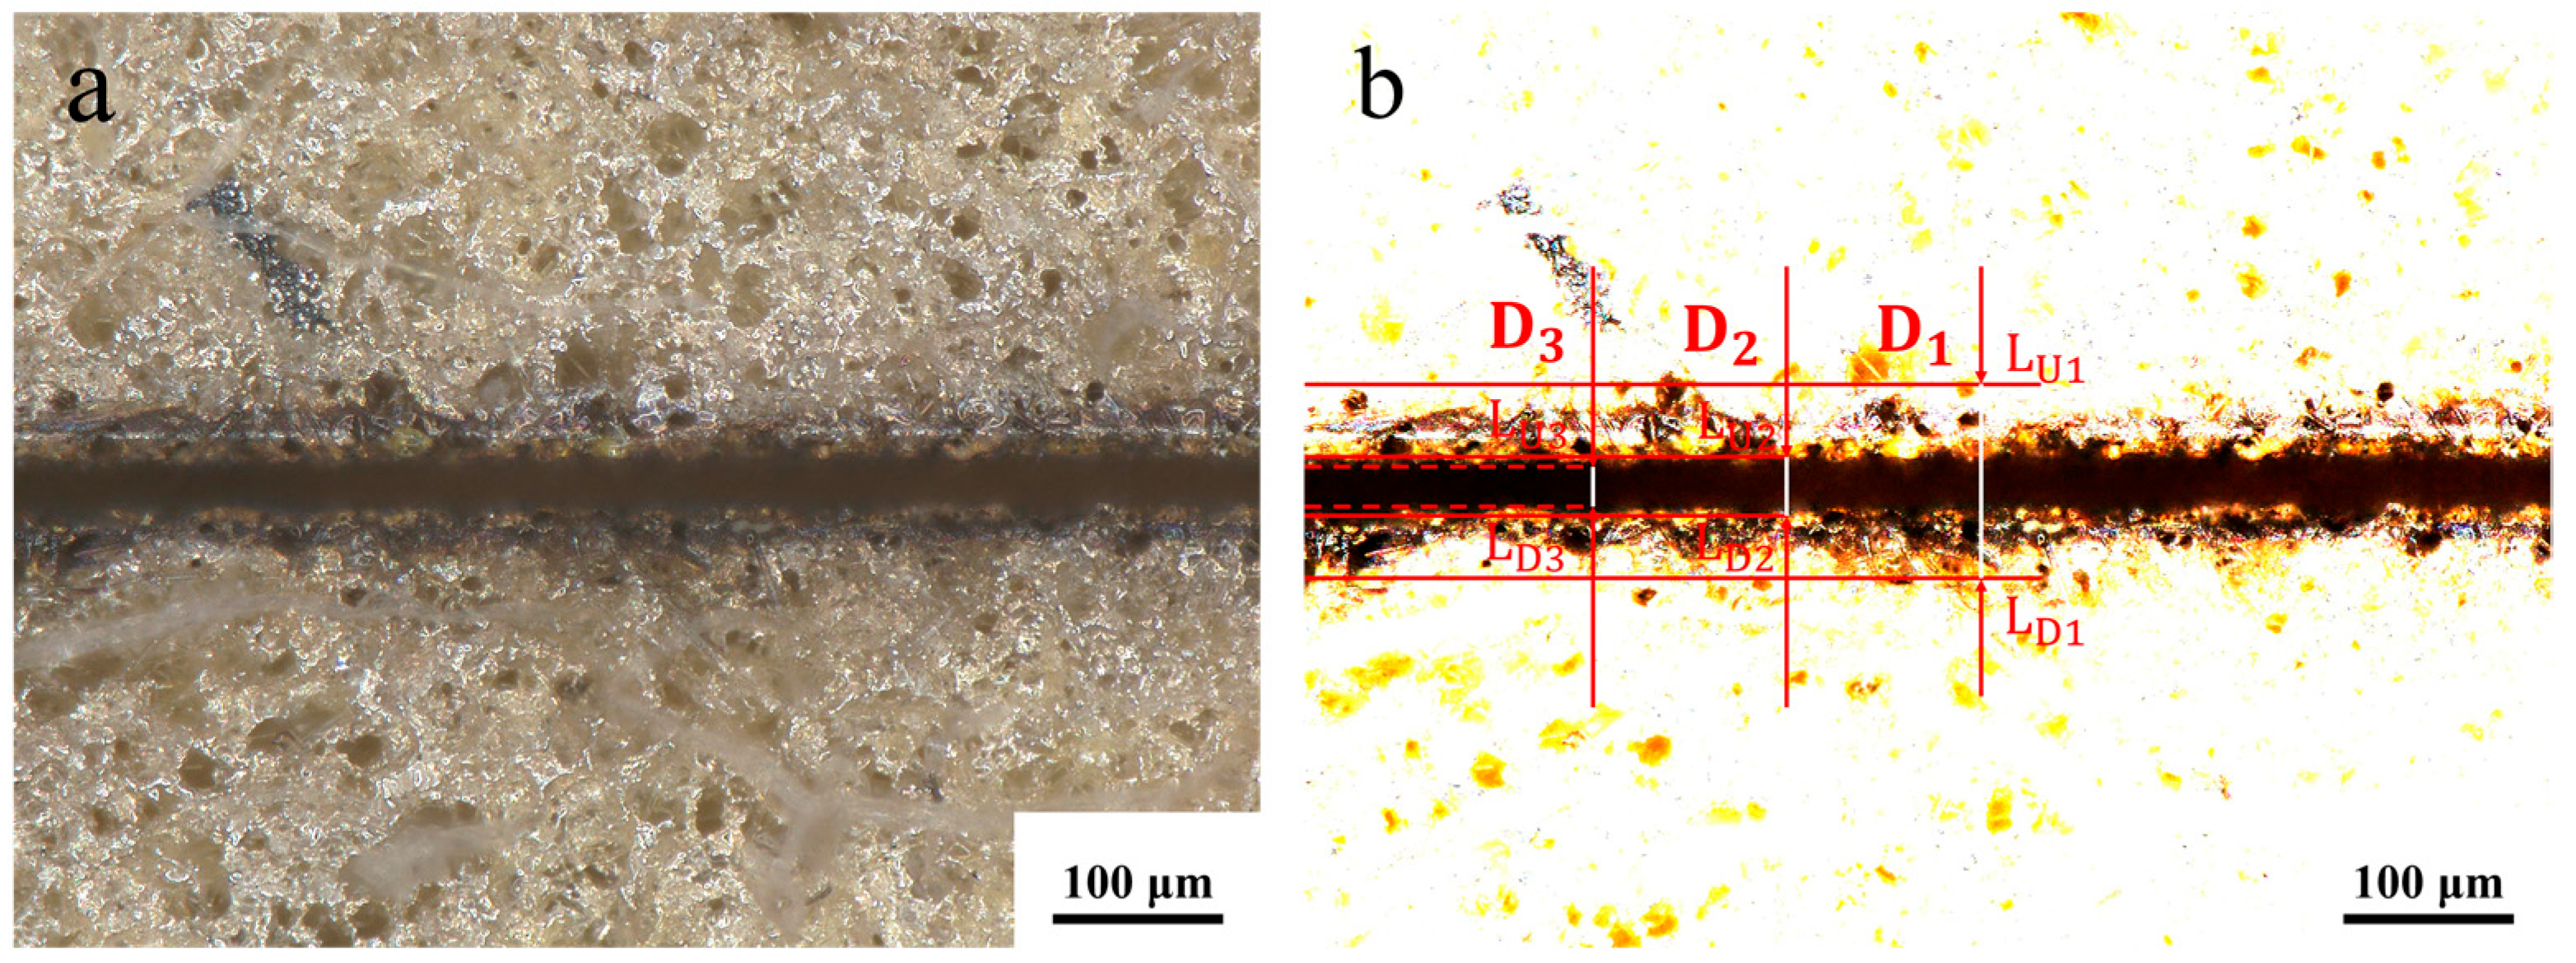
The laser etching quality evaluation system was established based on the surface morphology of the etched seam, as illustrated in
Figure 2. Evidence indicates the presence of a region that differs from the initial coating surface on both sides of the seam edge, which is known as the heat-affected zone. The upper and lower lines, designated L
U1 and L
U2, respectively, are drawn along the perimeter of the heat-affected zone. The seam edge is not a perfect straight line, and the upper tangent L
U2 and lower tangent L
D3 can be drawn along the upper edge of the seam. Similarly, the upper tangent L
D2 and lower tangent L
D3 can be drawn along the lower edge of the seam. The spacing between L
U1 and L
D1 is D
1, the spacing between L
U2 and L
D2 is D
2, and the spacing between L
U3 and L
D3 is D
3. The determination of the extent to which the coating has been removed in the ablated area is contingent upon the analysis of the seam surface morphology in conjunction with the seam cross-section. It is evident that, in accordance with the values of D
1, D
2 and D
3, the evaluation indexes of the width of the heat-affected zone (W
H), the width of the ablation (W
S), and the straightness of the seam edge (S
E) can be determined. The following formulas have been deduced for these evaluation indices:
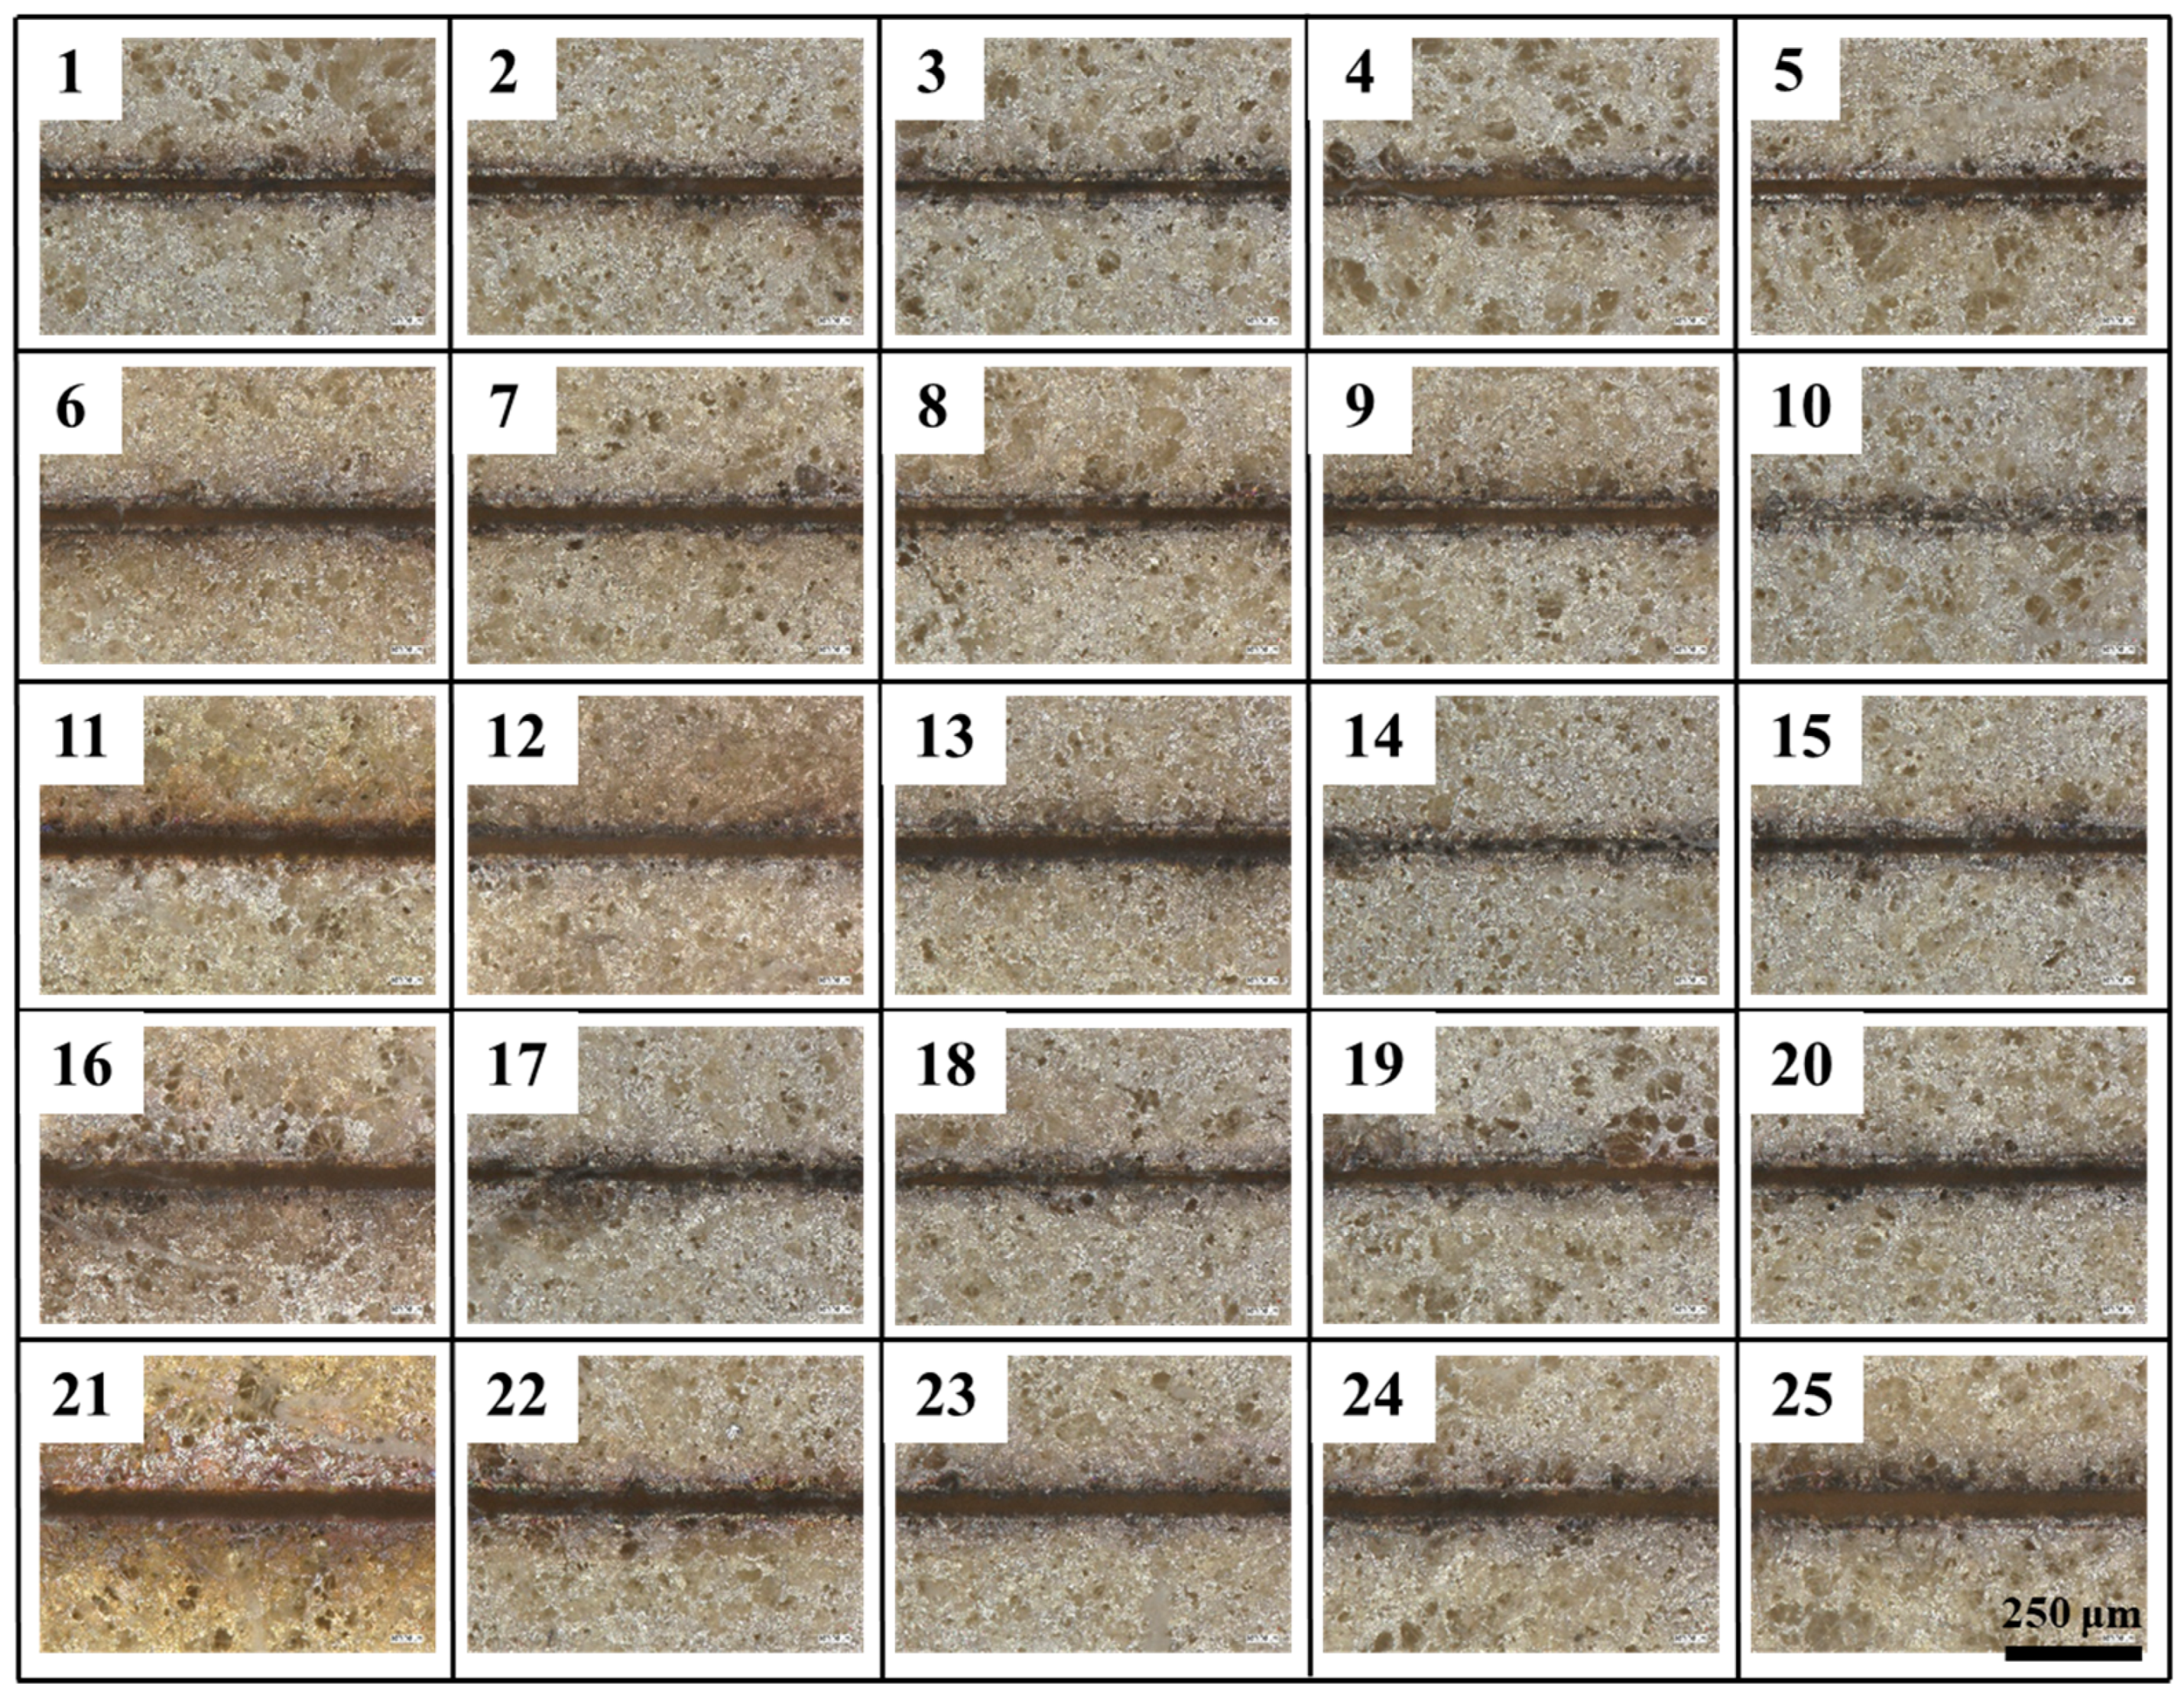
Since straightness reflects edge etching precision, it is the primary consideration in the etching evaluation system, followed by the heat-affected zone and etching width. Meanwhile, whether the coating has been completely etched away is determined by the absence of residual coating within the etching seams. It is important to note that five samples with identical parameters were selected for the calculation of the mean value for the evaluation indexes under differing process parameters. The surface morphology of each etching process is illustrated in
Figure 3, and the statistical data are presented in
Table 3.
3.2. Orthogonal Experiment Analysis of Variance
Extreme variance analysis and analysis of variance (ANOVA) are utilized in orthogonal tests to evaluate the impact of multiple factors on the outcomes of experiments. Polar deviation (R) is defined as the difference between the maximum and minimum values in the data set, with the value serving to indicate the range of fluctuation in the data. The key variables affecting the etching effect can be expeditiously screened by means of extreme variance analysis, thus facilitating the determination of the optimal combination of levels under differing etching evaluation indexes. Analysis of variance (ANOVA) is a statistical method that aims to determine the influence of controllable factors on the results of a study by examining the contribution of different sources of variation to the total variation. As demonstrated in the accompanying
Table 4,
Table 5 and
Table 6, the analysis of variance (ANOVA) encompasses a series of statistical components, including the sum of squares (SS), degrees of freedom (DOF), mean square (MS), F-value,
p-value, and the extent to which these elements contribute to the outcomes of the study. As illustrated in
Figure 3, the etched area morphology exhibited variability in its response to each test. Specifically, test10, 14, 15, 17 and 18 failed to achieve complete removal of the coating, resulting in residue formation within the etched area.
When the evaluation index is set to W
S, the results of the range analysis for each process parameter are shown in
Table 7 and
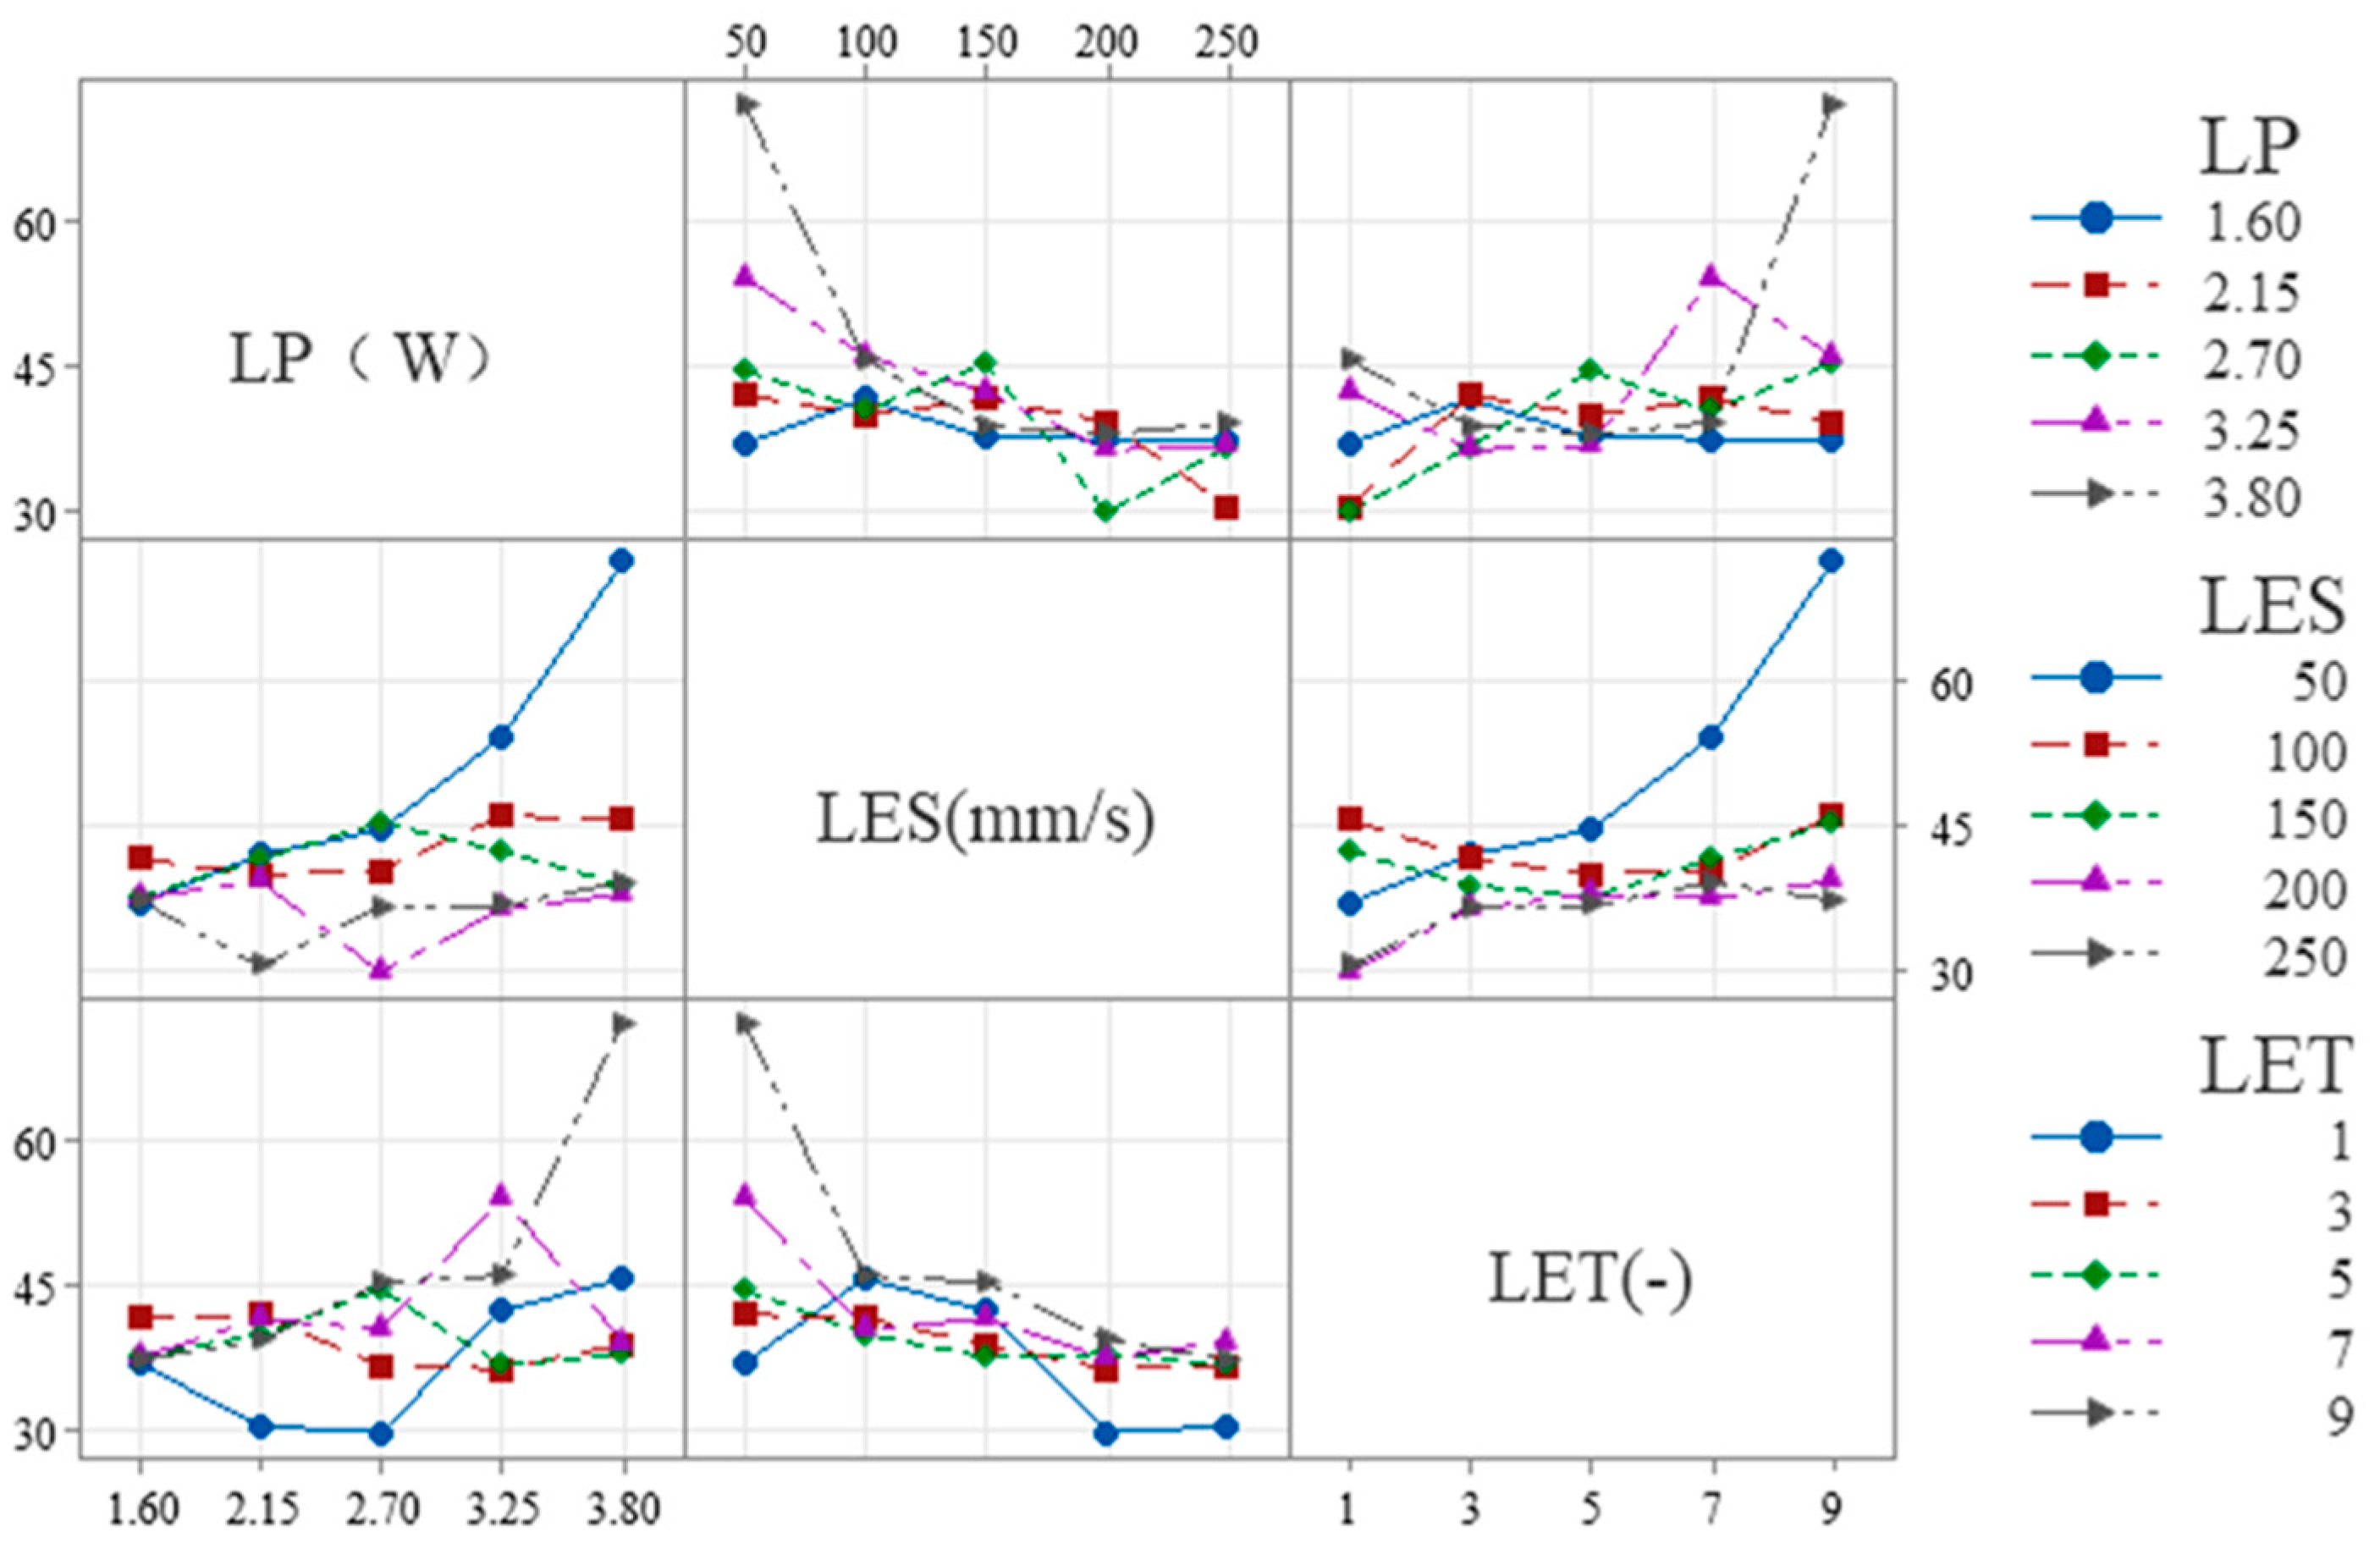
Figure 4. The effect of LET on the dependent variable exhibits a nonlinear threshold trend, first increasing and then leveling off: it is significant at low levels but not at high levels, with the high-low effects canceling each other out to result in an overall non-significant effect.
The range R
1 of the process parameter LP is 15.59 μm, and the optimum level is 1 (1.6 W). The range R
2 for the process parameter of LES is 11.39 μm, with an optimum level of 5 (250 mm/s). The process parameter LET is defined as follows: R
3 ranges from 7.99 μm with an optimal value of 1 (1 times). Therefore, the minimum W
S is theoretically obtained when the combinations of ablation process parameters are as follows: 1 (1.6 W), 5 (250 mm/s), and 1 (1 times). However, according to the combination of process parameters in the orthogonal table, it is evident that this combination of process parameters is not capable of removing the coating. Furthermore, the order of magnitude of the contribution share of each factor in
Table 4 is consistent with the order of magnitude of the extreme deviation (R
j) in
Table 7, thereby indicating that LP, LES and LET have a decreasing effect on W
S. It was determined that the conditions for complete removal of the coating from the etched area were met when the following parameter combination was utilized: 1 (1.6 W)-5 (250 mm/s)-5 (9 times) with a minimum W
S of 21.05 μm. This determination was made based on the orthogonal table ranges.
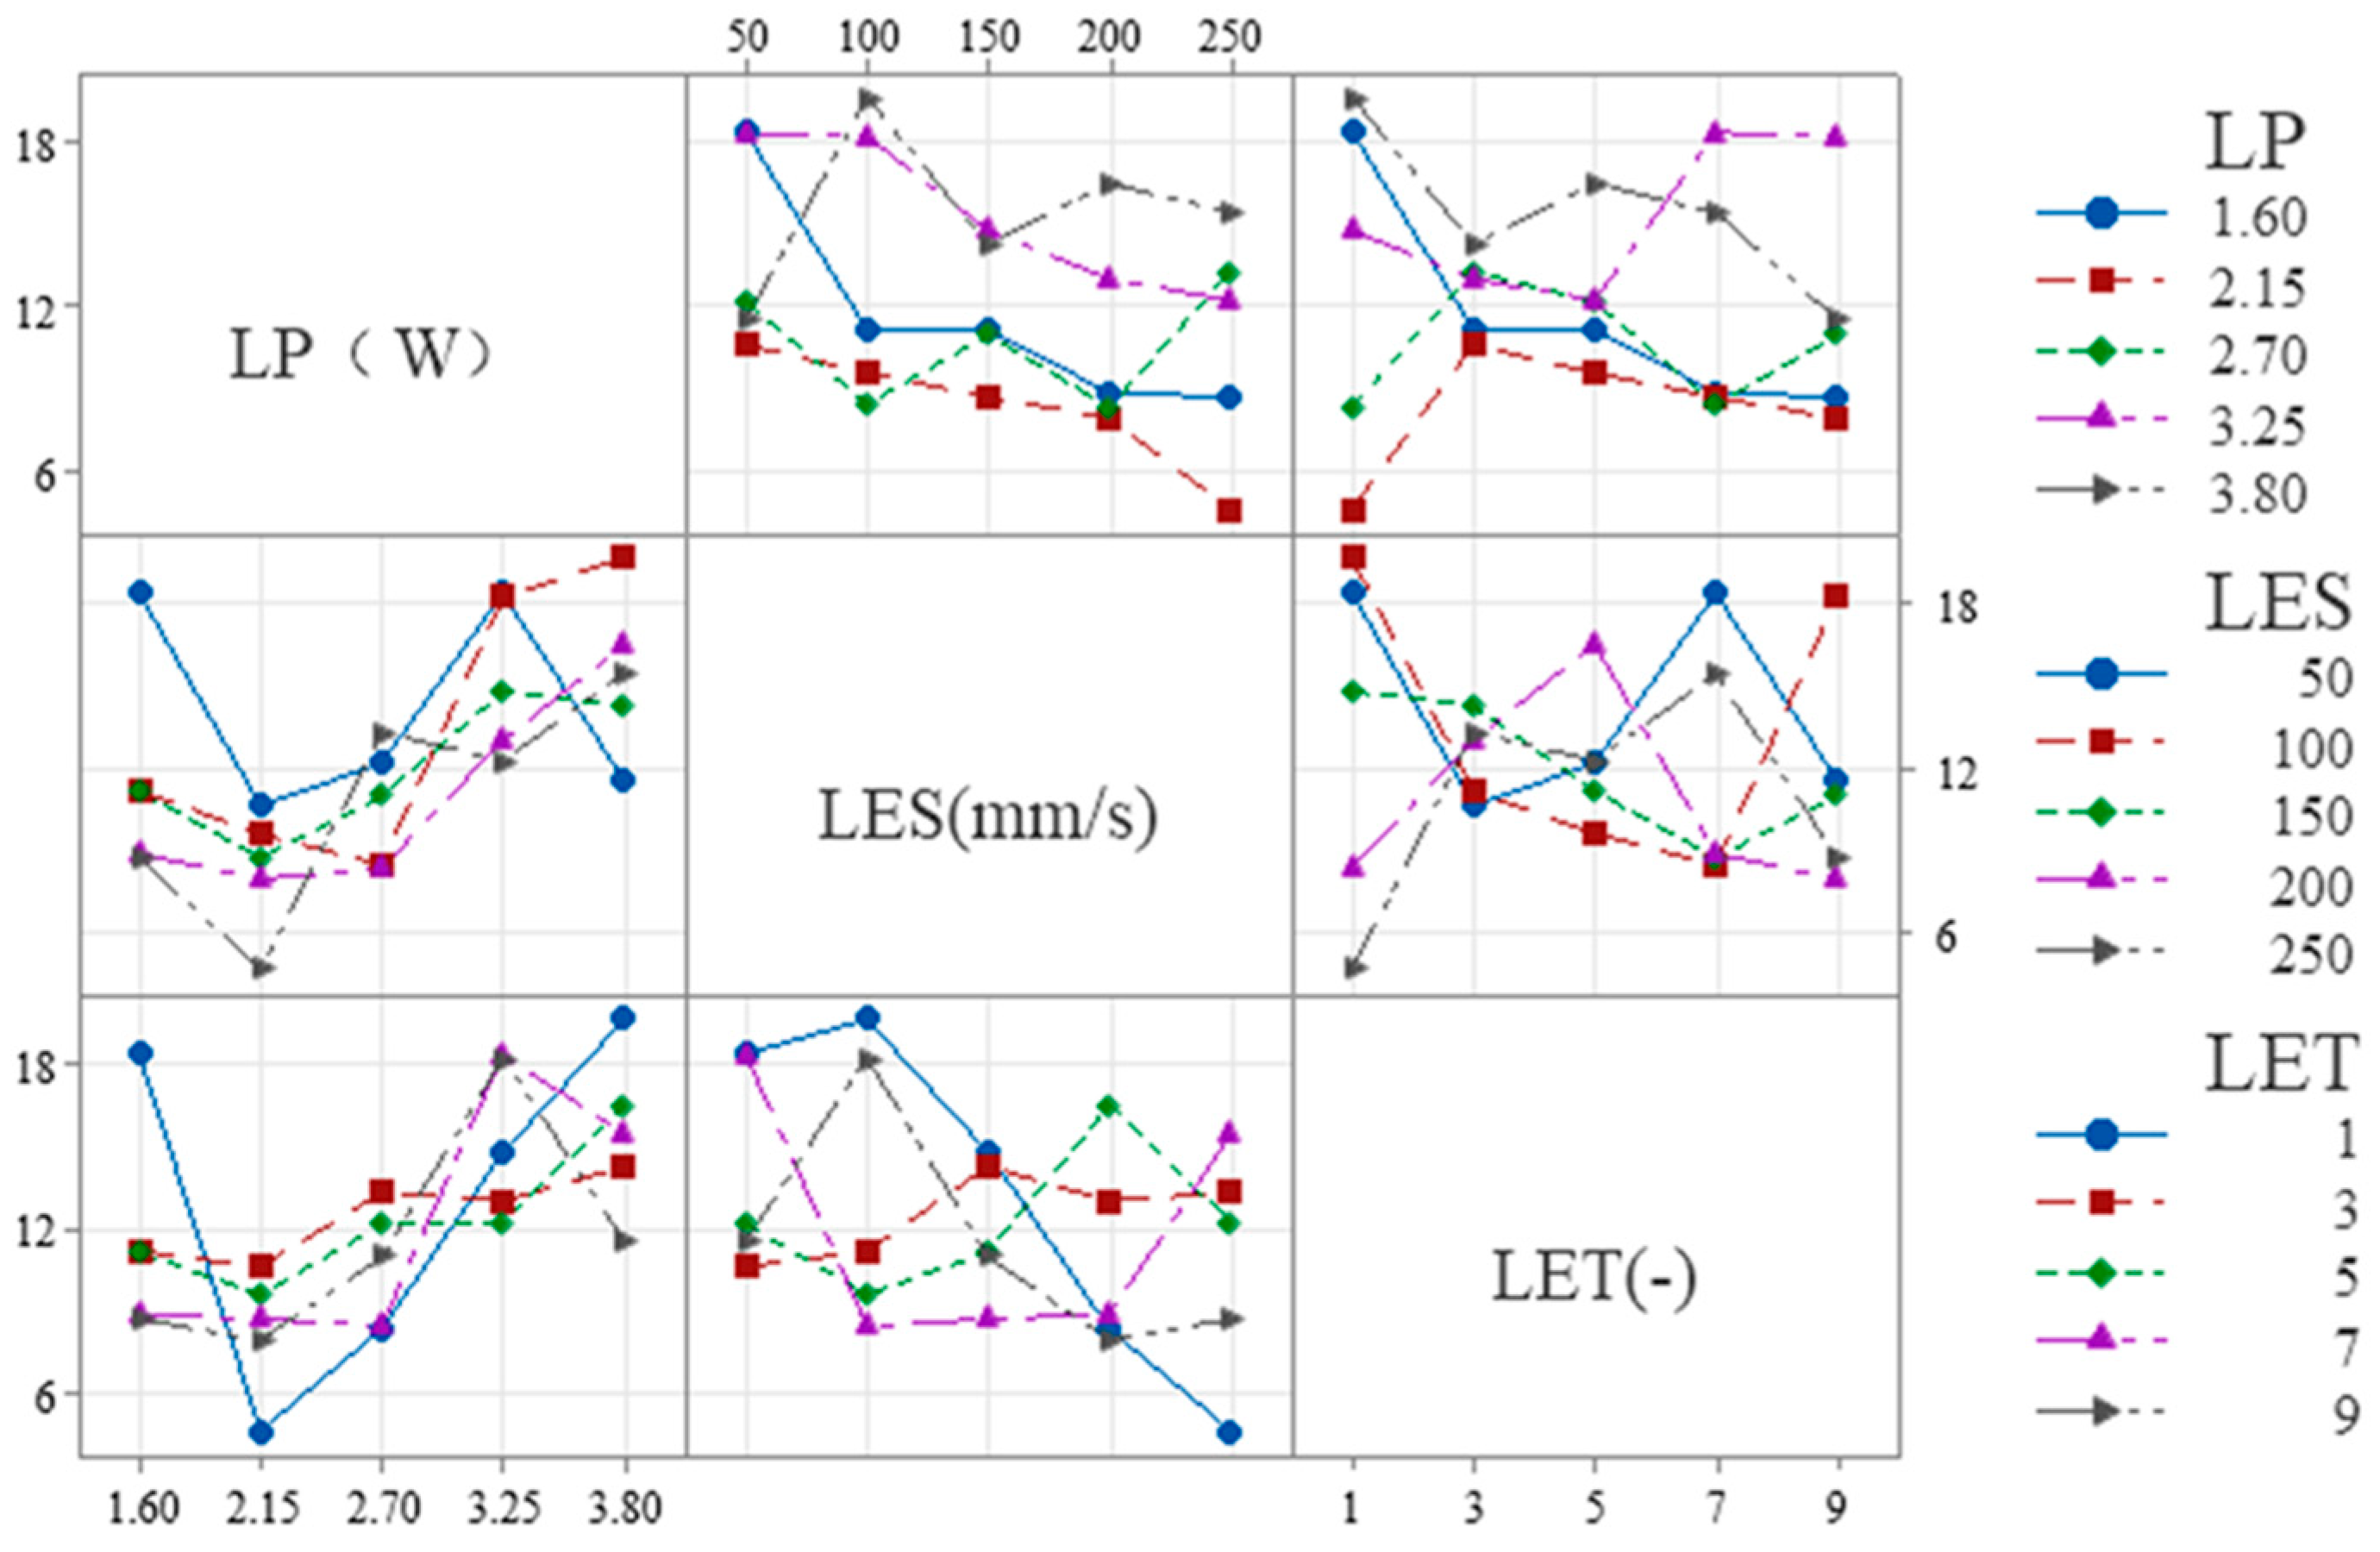
Table 8 and
Figure 5 show the results of the range analysis for each process parameter when the etching evaluation index is W
H. The effect of LP on the dependent variable exhibits a nonlinear threshold trend, initially stable before increasing. It is insignificant at low levels but significant at high levels, with the high-low effects canceling each other out to yield overall insignificance. For LP, R
1 is 8.56 μm and the optimum level is 1 (1.6 W); for LES, R
2 is 13.89 μm and the optimum level is 5 (250 mm/s); and for LET, R
3 is 10.96 μm and the optimum level is 1 (1 time). The minimum W
H is therefore obtained with the combination of etching process parameters 1 (1.6 W)-5 (250 mm/s)-1 (1 times). However, according to the combination of process parameters 2 (2.15 W)-5 (250 mm/s)-1 (1 times) in the orthogonal table, this process combination cannot remove the coating. Additionally, the contribution share of each factor in
Table 5 is consistent with the extreme deviation (R
j) in
Table 8, indicating that LES, LET and LP decrease W
H. Based on the ranges in the orthogonal table, it was determined that the coating was completely removed from the etched area when the parameter combination was 1 (1.6 W)-1 (50 mm/s)-1 (1 times), with a minimum W
H of 36.85 μm.
As illustrated in
Table 9 and
Figure 6, the results of the range analysis for each process parameter are presented, with the etching evaluation index designated as S
E. The excessively strong effect of LP on the dependent variable makes the effects of LES and LET appear relatively weak, leading to an overall lack of significance in the model. The range of the process parameter LP is 7.16 μm, with an optimum level of 2 (2.15 W). For the process parameter LES, the range is 1.68 μm, and the optimum level is 5 (250 mm/s). Finally, for the process parameter LET, the range is 1.68 μm, and the optimum level is 5 (9 times). The order of magnitude of the contribution shares of the factors in
Table 6 and the order of magnitude of the extreme deviation (R
j) in
Table 9 are consistent, indicating that LP, LES and LET have a decreasing effect on S
E. The condition of complete removal of the coating from the etched area is satisfied when the parameter combination is 2 (2.15 W)-4 (200 mm/s)-5 (9 times) and the minimum S
E is 7.9 μm, according to the range of the orthogonal table. Therefore, the minimum S
E is obtained when the parameter combination of the etching process is 2 (2.15 W)-4 (200 mm/s)-5 (9 times).
3.3. Interaction Analysis
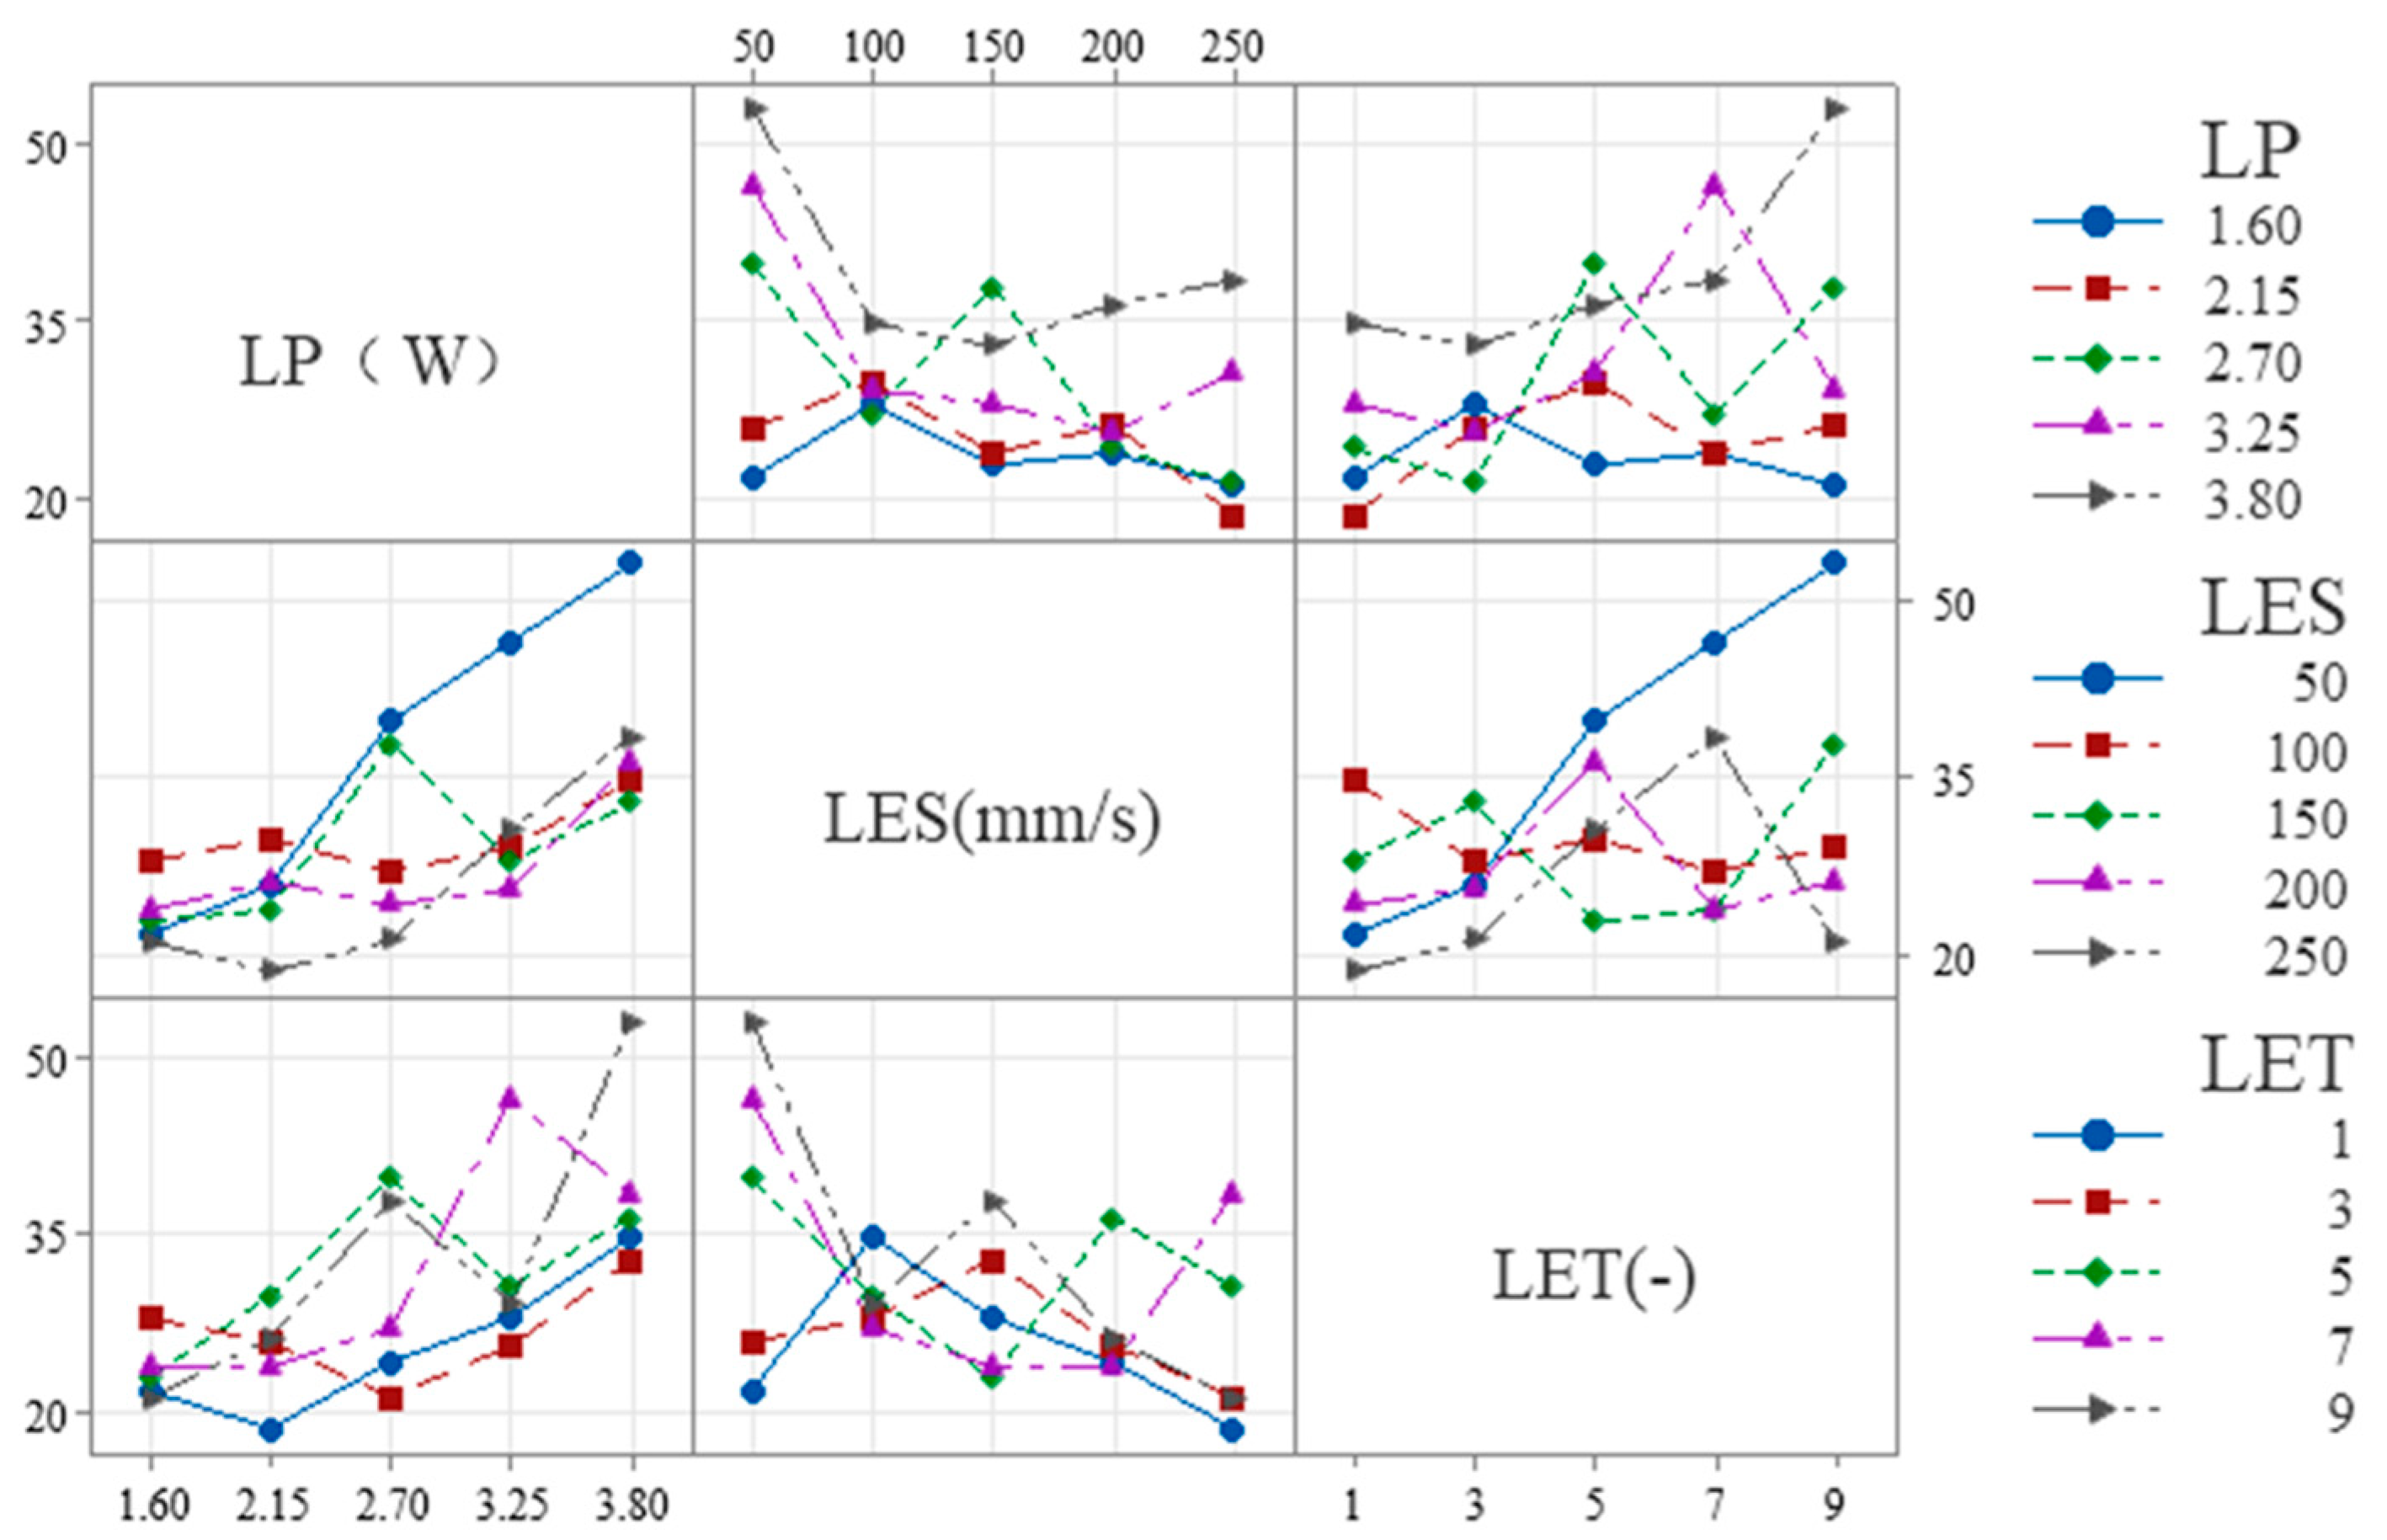
Interaction analysis can rapidly determine correlations between factors under the same evaluation metric. The notation A*B denotes the interaction between laser process parameters A and B.
Figure 5,
Figure 6 and
Figure 7 illustrate the correlations among process parameters when the evaluation metrics are LP, LES, and LET. The results are as follows:
The following is shown in
Figure 7 for W
S:
(1) LES × LP: The slope is steeper at low LES (50–100 mm/s) and flatter at high LES (200–250 mm/s), indicating that overall, the influence of LES on LP diminishes as LES increases.
(2) LET × LP: The slope is smaller at low LET (1–3) and larger at high LET (7–9), indicating that overall, as LET increases, its influence on LP tends to increase.
(3) LET × LES: The slope is smaller at low LET (1–3) and larger at high LET (7–9), indicating that overall, as LET increases, its influence on LES tends to increase.
The following is shown in
Figure 8 for W
H:
(1) LES × LP: The slope is steeper at low LES (50–100 mm/s) and flatter at high LES (200–250 mm/s), indicating that overall, the influence of LES on LP diminishes as LES increases.
(2) LET × LP: The slope is smaller at low LET (1–3) and larger at high LET (7–9), indicating that overall, as LET increases, its influence on LP tends to increase.
(3) LET × LES: The slope is smaller at low LET (1–3) and larger at high LET (7–9), indicating that overall, as LET increases, its influence on LES tends to increase.
The following is shown in
Figure 9 for S
E:
(1) LES × LP: The slope is steeper at low LES (50–100 mm/s) and flatter at high LES (200–250 mm/s), indicating that overall, the influence of LES on LP diminishes as LES increases.
(2) LET × LP: The slope is steeper at low LET (1–3) and larger at high LET (7–9), indicating that overall, as LET increases, its influence on LP tends to increase.
(3) LET × LES: The slope at low LET (1–3) is similar to that at high LET (7–9), both being higher than the slope at medium LET (3–7). This indicates that, overall, the effect of LET on LES first decreases and then increases as LET increases.
3.4. Effect of Etching Times on Etching Cross-Section
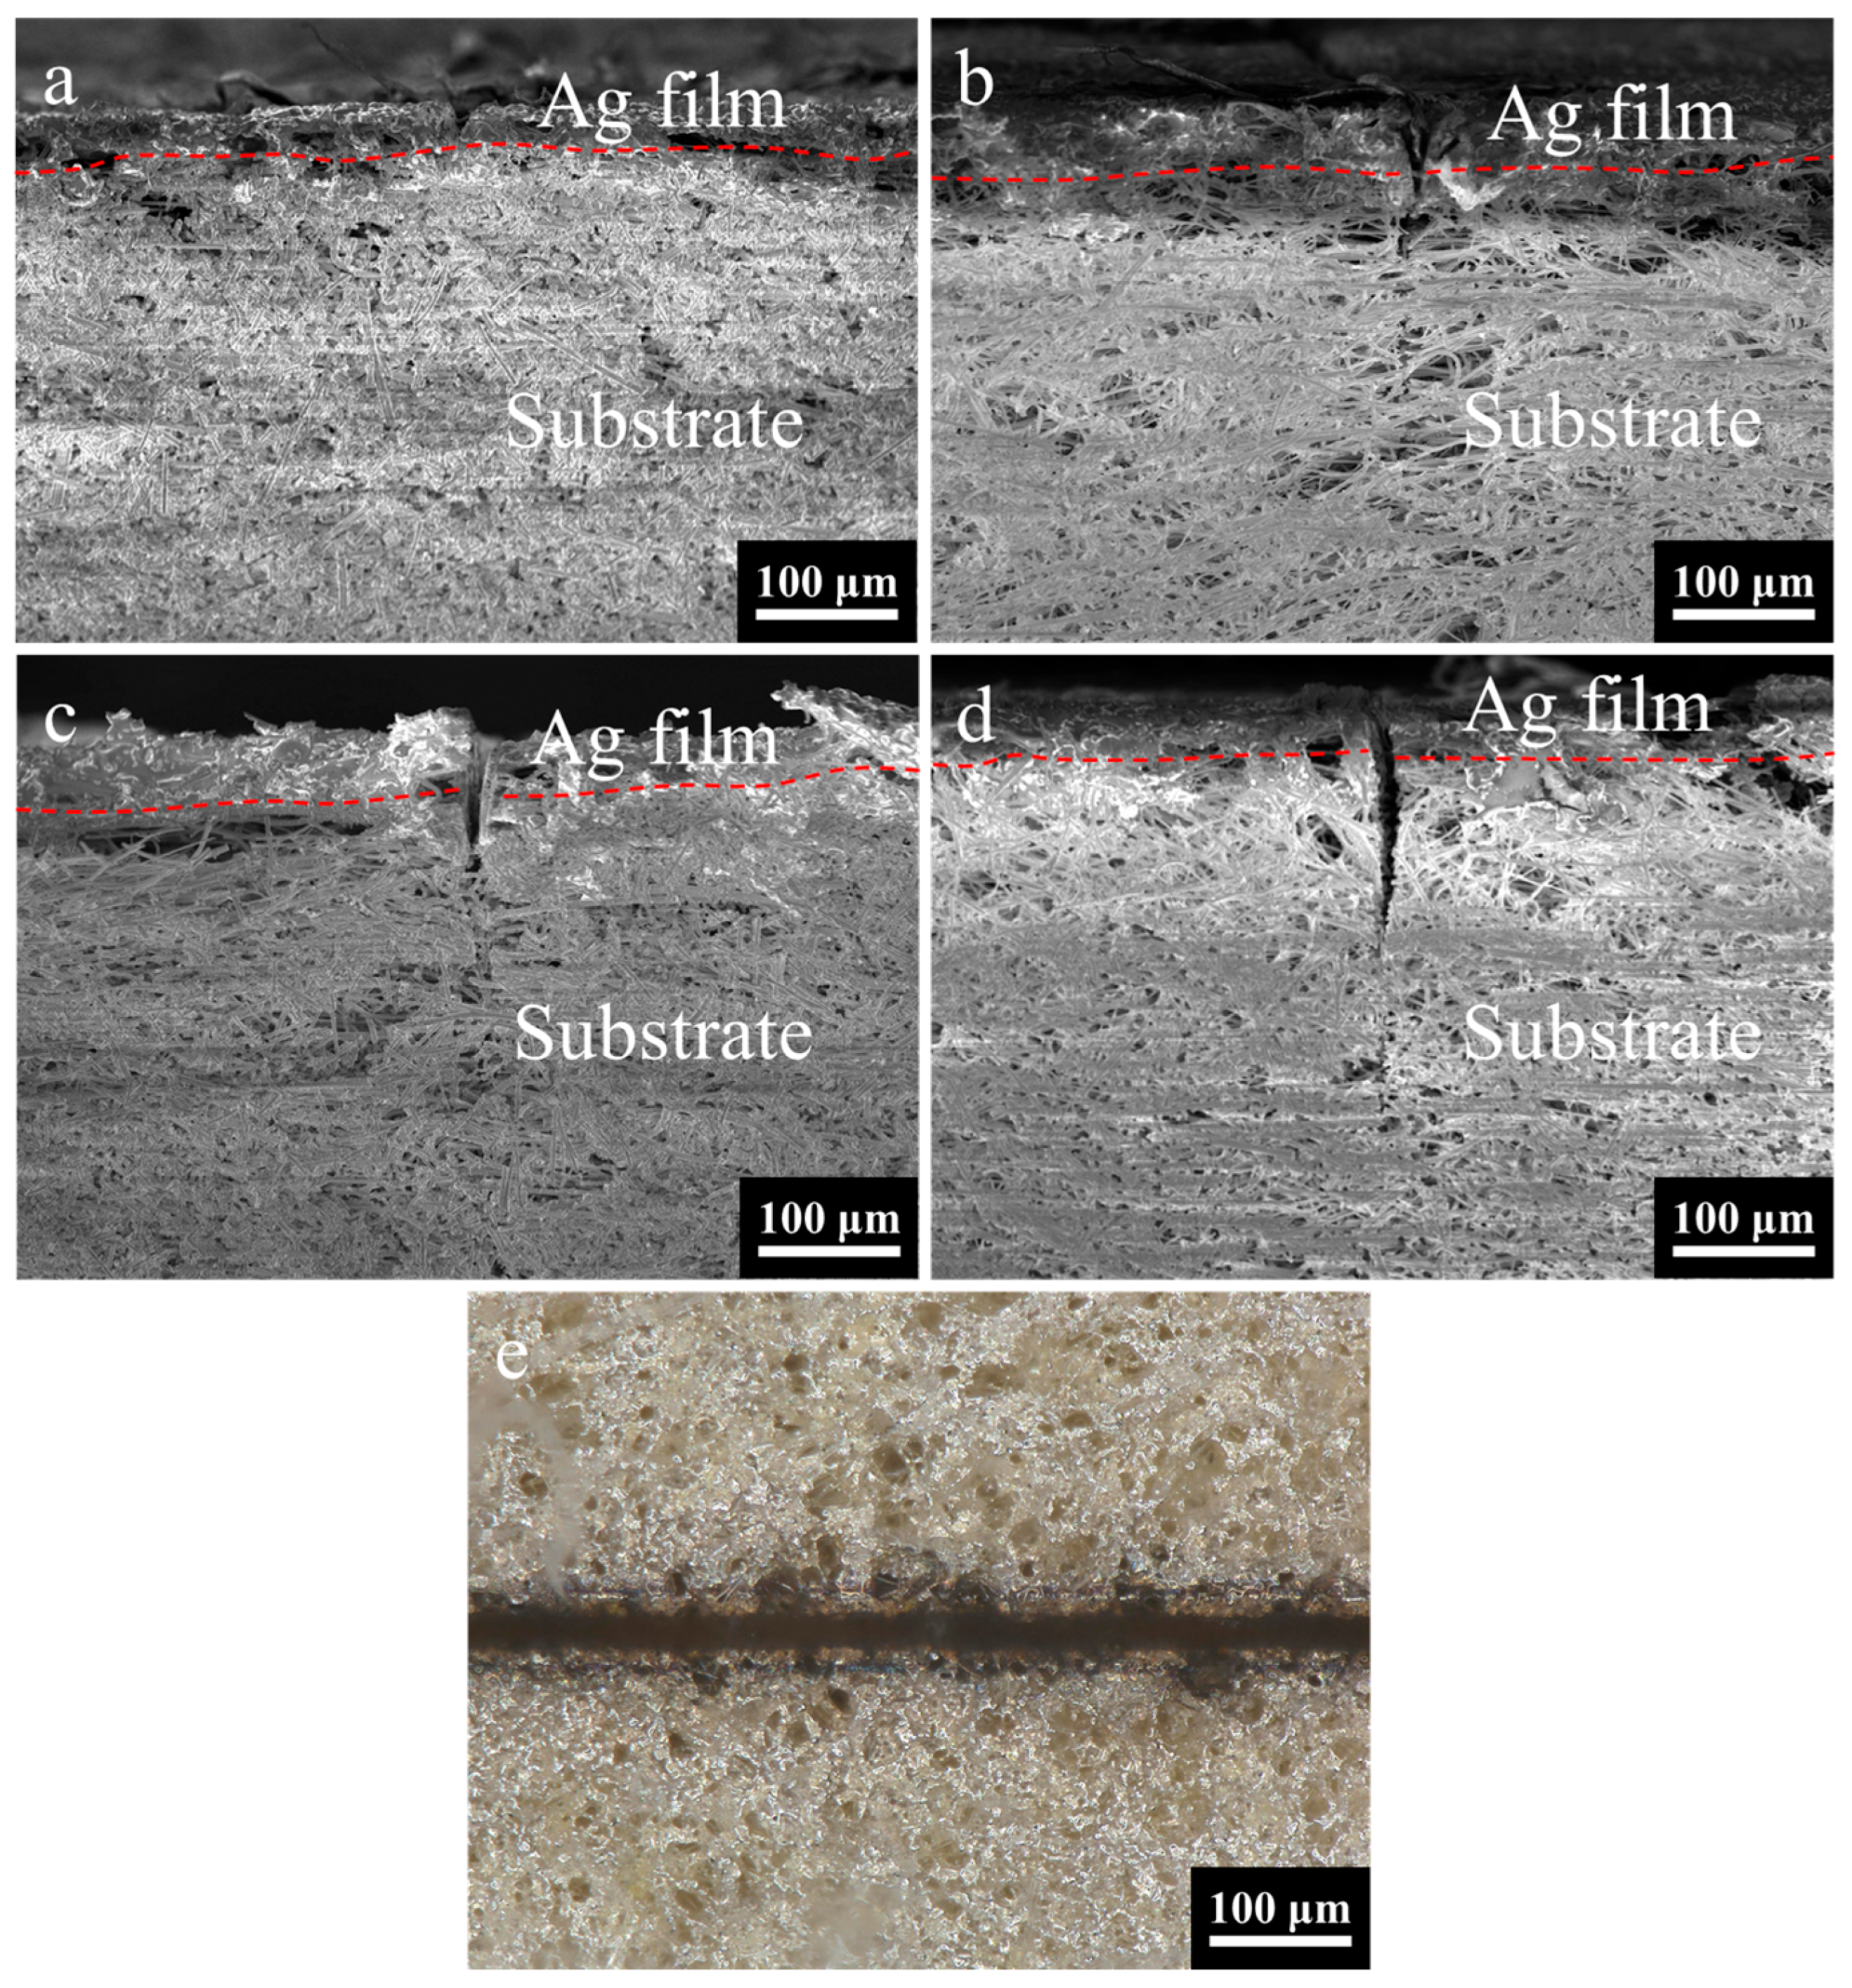
The number of laser etching times is found to be a crucial factor in achieving complete removal of the coating. The optimal process parameters are determined through experimentation and analysis. As illustrated in
Figure 10a, the cross-sectional morphology is observed under the condition of 7 etching times. The energy injected into the surface by the laser is rapidly carried away by the removed material before it can diffuse, resulting in a remarkably smooth etched edge on the silver layer. In this instance, the etching depth was measured at 21.08 μm.
As illustrated in
Figure 10b–d, there is a demonstrable change in etching depth when the number of etching times is changed from 9 to 13. The etching depth increases from 89.72 μm to 143.29 μm. It has been demonstrated that the etching depth increases in proportion to etching times. It is noteworthy that when etching times are set at 9, the result is the complete removal of the coating. It is evident that an increase in the etching times results in an increase in etching width and greater substrate damage. This observation indicates that 9 times are sufficient to completely remove the coating, with the optimal parameters being 2.15 W-200 mm/s-9 times.
The optical image of the etched surface morphology is shown in
Figure 10e, captured under the optimal process parameter combination of 2.15 W-200 mm/s-9 times, and the mean etching width is measured at 26.16 μm, the mean width of the heat-affected zone is recorded at 39.16 μm, and the mean straightness width is determined at 7.9 μm (based on five samples). As demonstrated in
Figure 10b, the etching edges are characterized by a smooth finish. This finding suggests that, within the specified process parameter configuration, the requirements for precise etching with minimal damage can be fulfilled.
3.5. Mechanism of the Femtosecond UV Laser Ablation
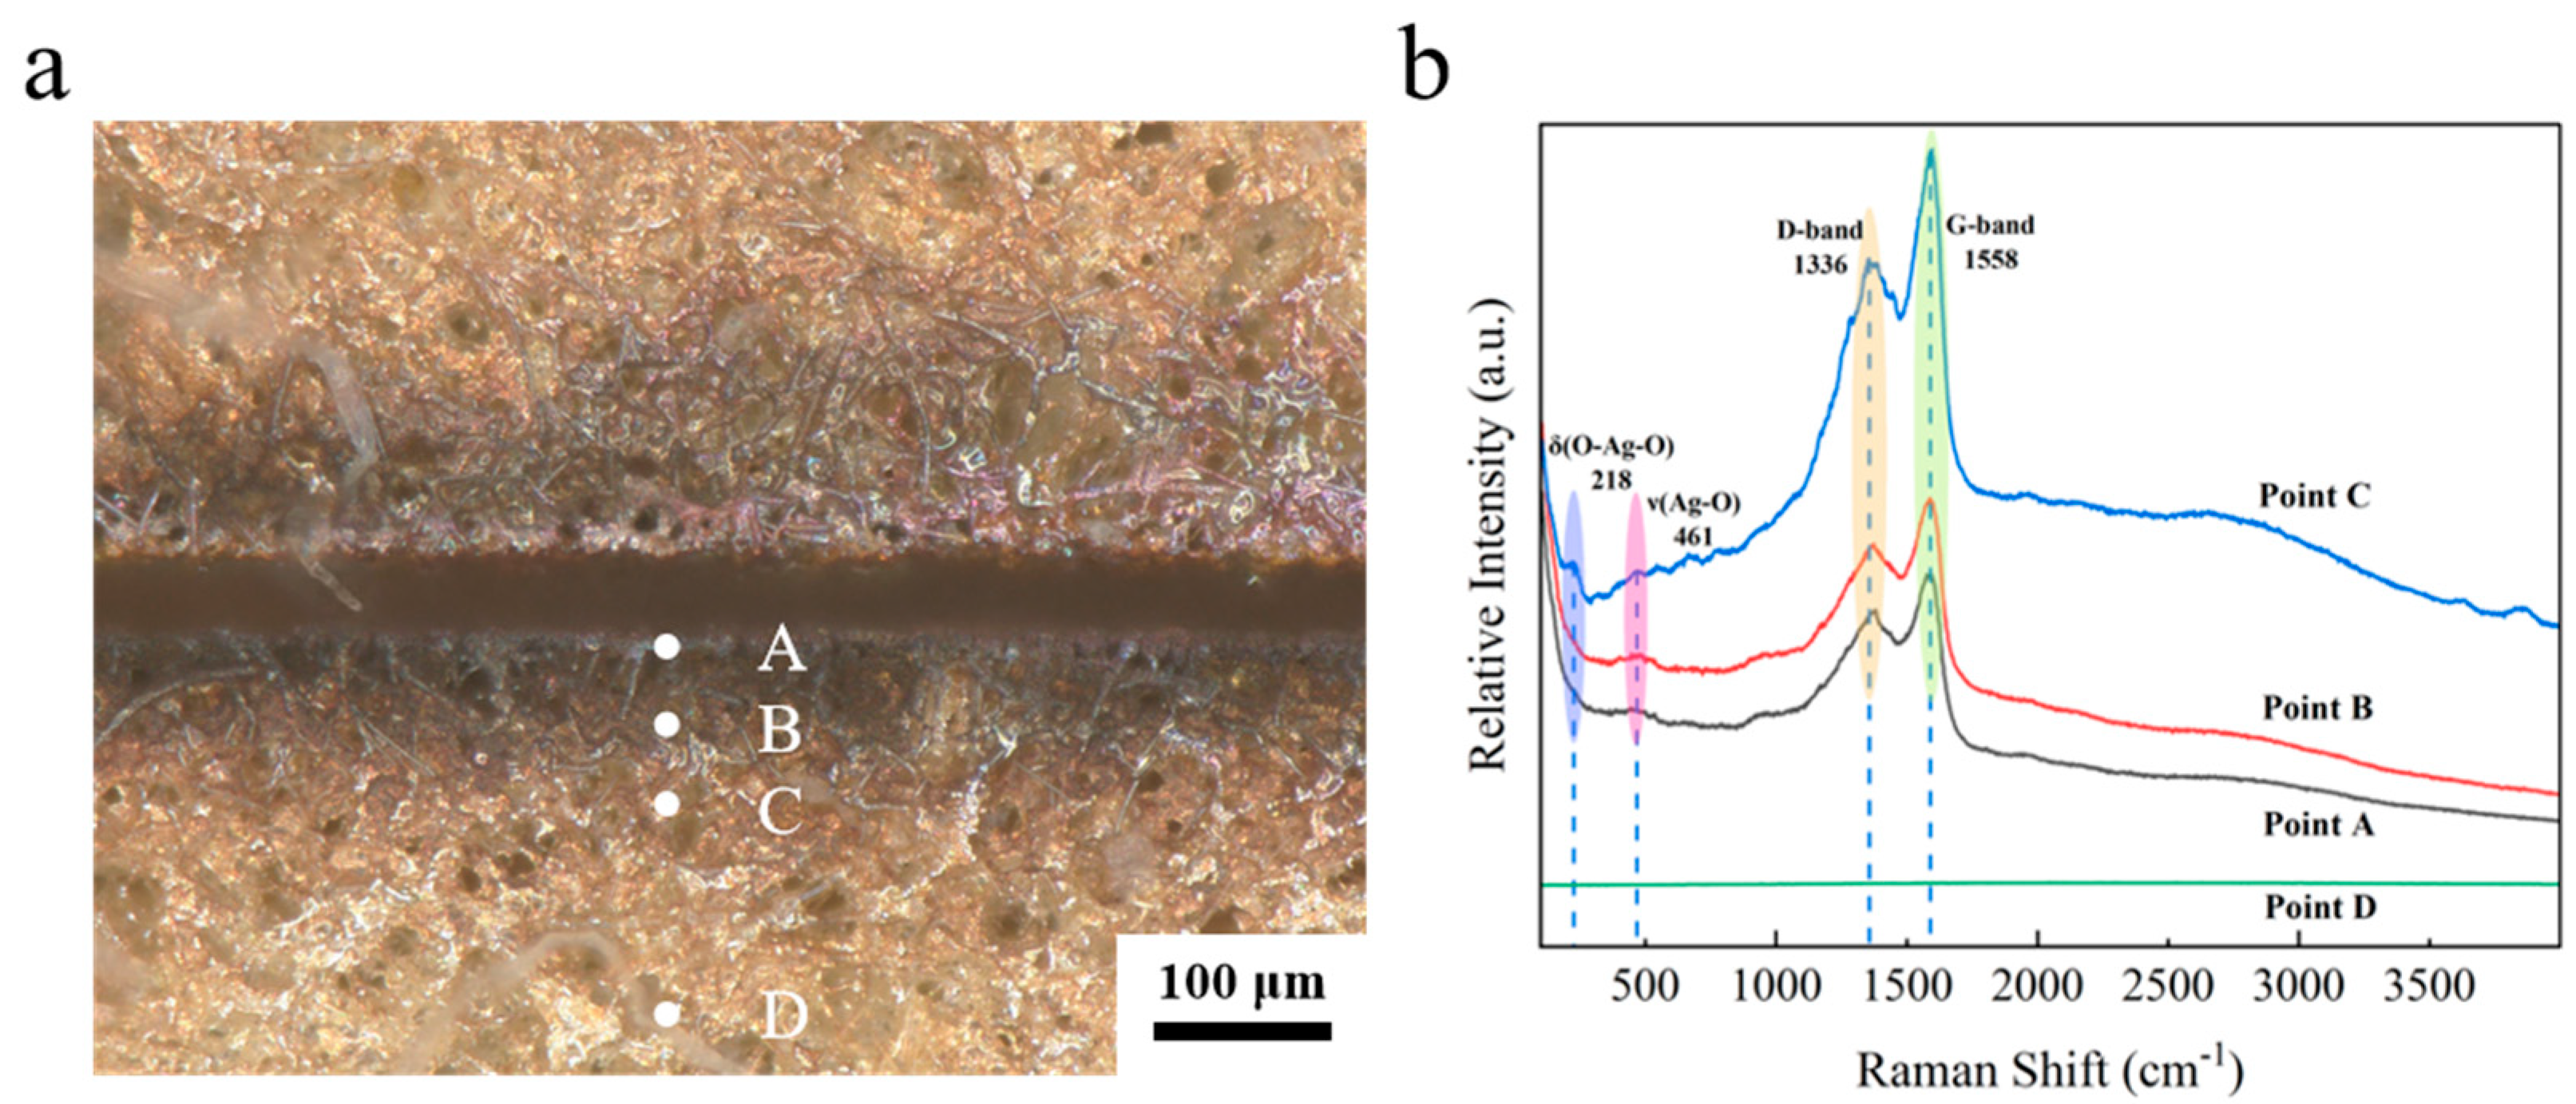
Figure 11a clearly shows that the color of the edge of the seam is blackened. In order to investigate the mechanism of etching of the ultraviolet femtosecond laser, a compositional analysis was conducted of the slit edges. As demonstrated in
Figure 11a, the local morphology of silver layer etching involves the selection of four points, A, B, C and D, which are positioned from the interior to the exterior. These points correspond to the inner wall of the etching edge, the etching edge itself, the heat-affected zone, and the unaffected zone, respectively. As demonstrated in
Figure 11b, the Raman results indicate the presence of broad superposition peaks in the range of 1351–1595 cm
−1 at points A, B, and C, which are attributed to the D-band (defect-induced peaks) and the G-band (graphitization peaks) of the amorphous carbon [
28]. The elements present in the amorphous carbon and graphite may originate from the organic vehicle in the silver paste. During the sintering process, the organic vehicle did not volatilize completely, resulting in the residual organic components in the sintered silver layer [
29]. The broad peaks observed at both points A and B near 461 cm
−1 can be attributed to the Ag-O bond stretching vibrations [
30,
31]. As demonstrated in
Figure 11b, the peaks at Raman shifts of 218 cm
−1 and 461 cm
−1 at point C correspond to the bending vibration of O-Ag-O and the stretching vibration of the Ag-O bond [
32], respectively. Compared to points A and B, the spectral line corresponding to point C exhibits a stronger peak. This is because points A and B are closer to the etching center, where the amorphous carbon generated is directly oxidized and removed due to excessively high temperatures. In contrast, point C is farther from the etching center, where temperatures are relatively lower, allowing most of the generated amorphous carbon to deposit in this region. Point D is even farther from the etching zone, lacking sufficient laser energy input. Moreover, the sintered silver layer’s surface is primarily composed of silver, whose spectral line appears as a flat line. Consequently, point D exhibits a flat line with no peaks. The results of the Raman test conducted on the ablated area indicate the presence of amorphous carbon in the vicinity, along with signs of oxidation within the ablated area itself.
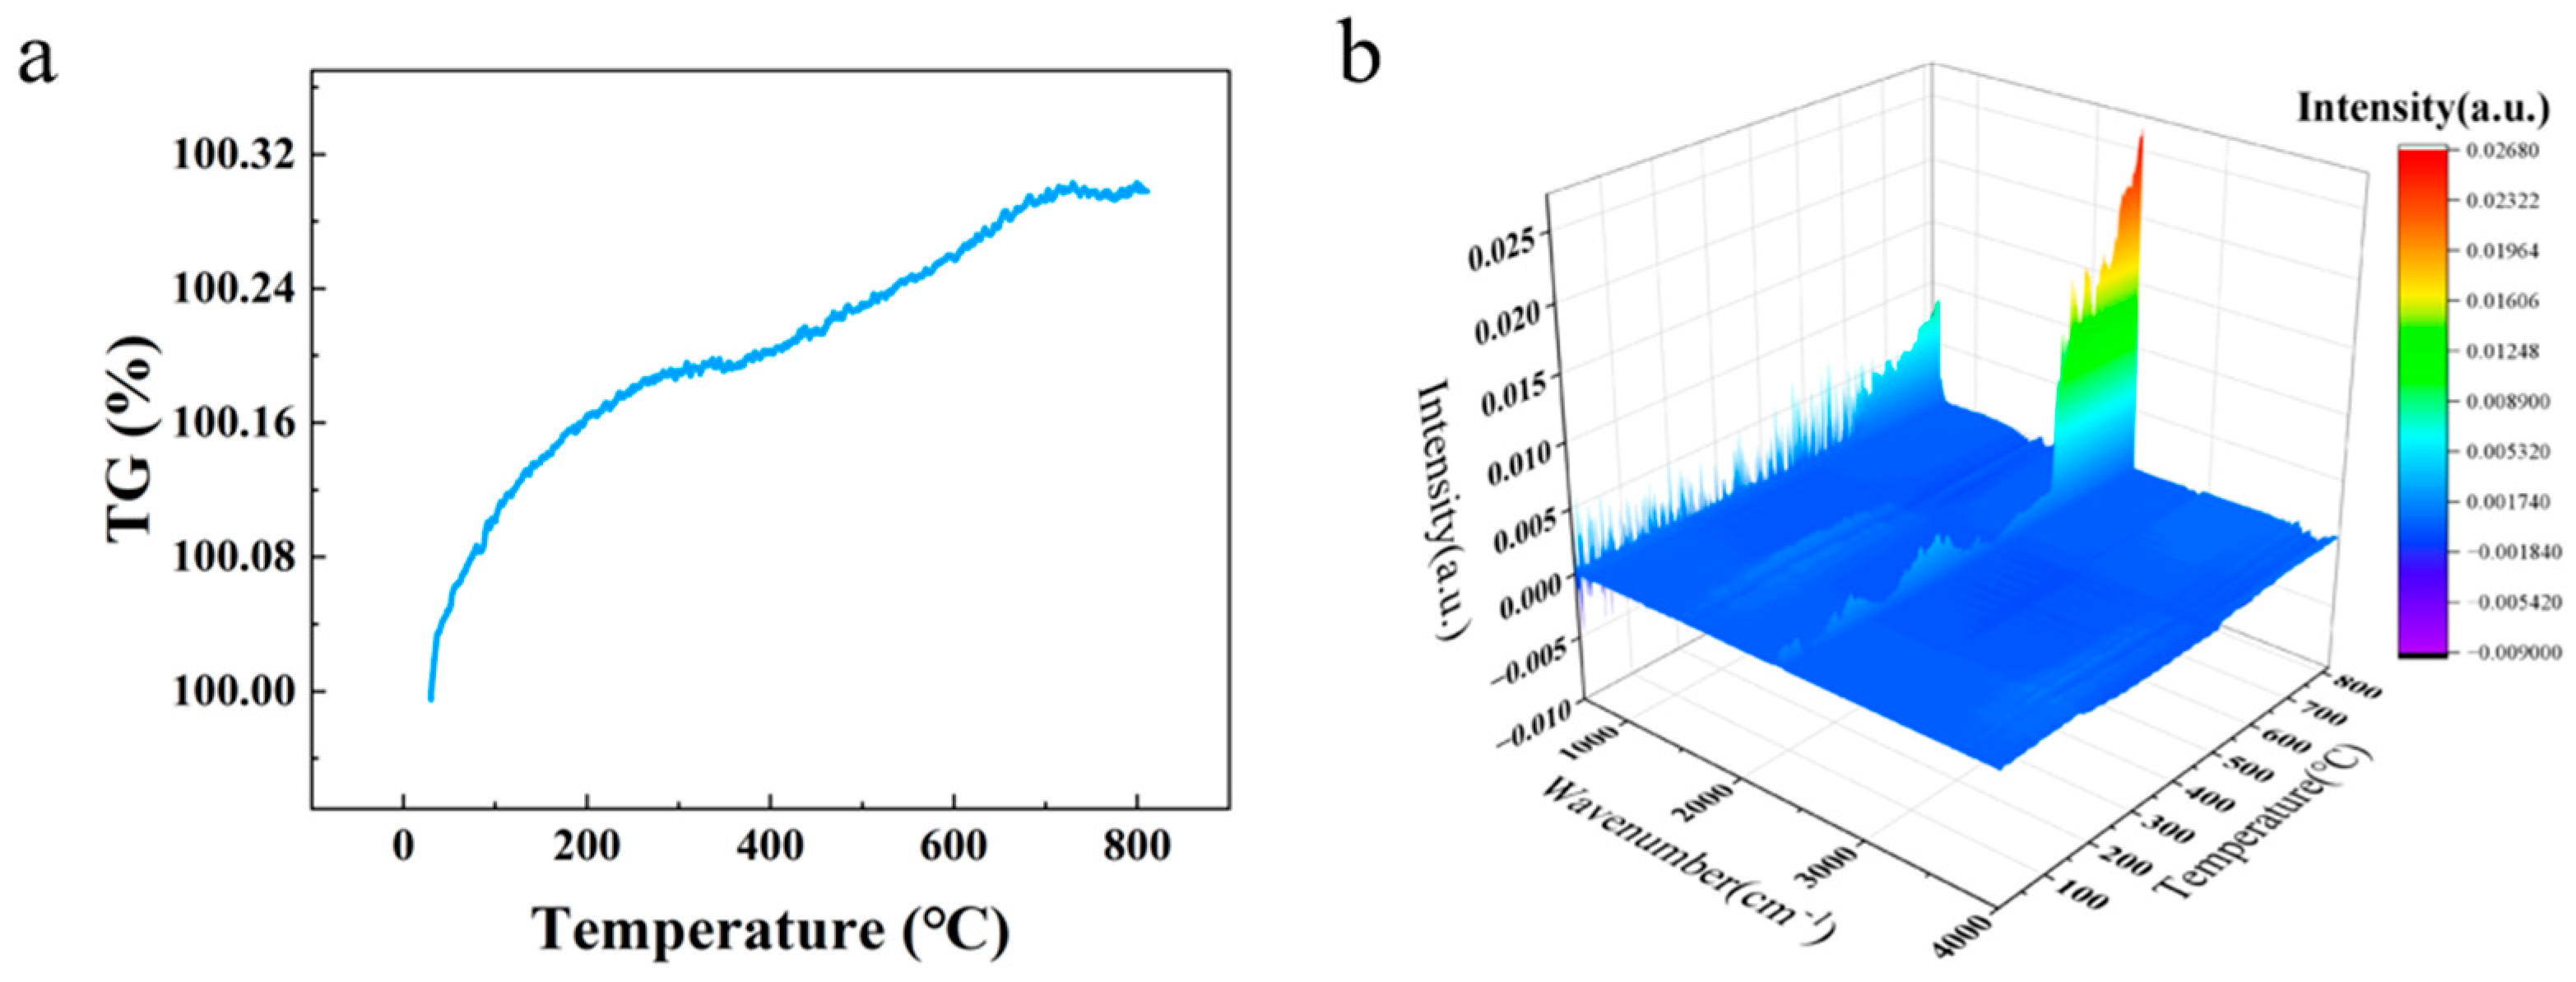
Furthermore, in order to facilitate a more profound analysis of the thermophysical change process of the composites under femtosecond laser etching, thermogravimetric tests and FTIR spectroscopy of gas products at differing temperatures were performed on the matrix and coating of the composites, respectively. As demonstrated in
Figure 12a, the quality of the silver coating exhibited stability within the temperature range of room temperature to 800 °C, as evidenced by the TG curves. The curve demonstrates a marginal overall increase from 100% to 100.3%. In accordance with the established formula, 2Ag + 1/2 O
2 = Ag
2O, it can be deduced that the mass of silver undergoes an approximate 10.7% increase following oxidation. However, the actual increase in mass is negligible, suggesting that only the surface layer is oxidized, resulting in a marginal increase in mass. As shown in
Figure 12b, no identifiable infrared peaks appear below 650 °C. When the temperature exceeds 650 °C, the characteristic peak for the asymmetric stretching vibration of CO
2 appears around 2300 cm
−1 [
33]. This phenomenon is attributable to the decomposition of residual carbon within the coating, which results in the generation of CO
2.
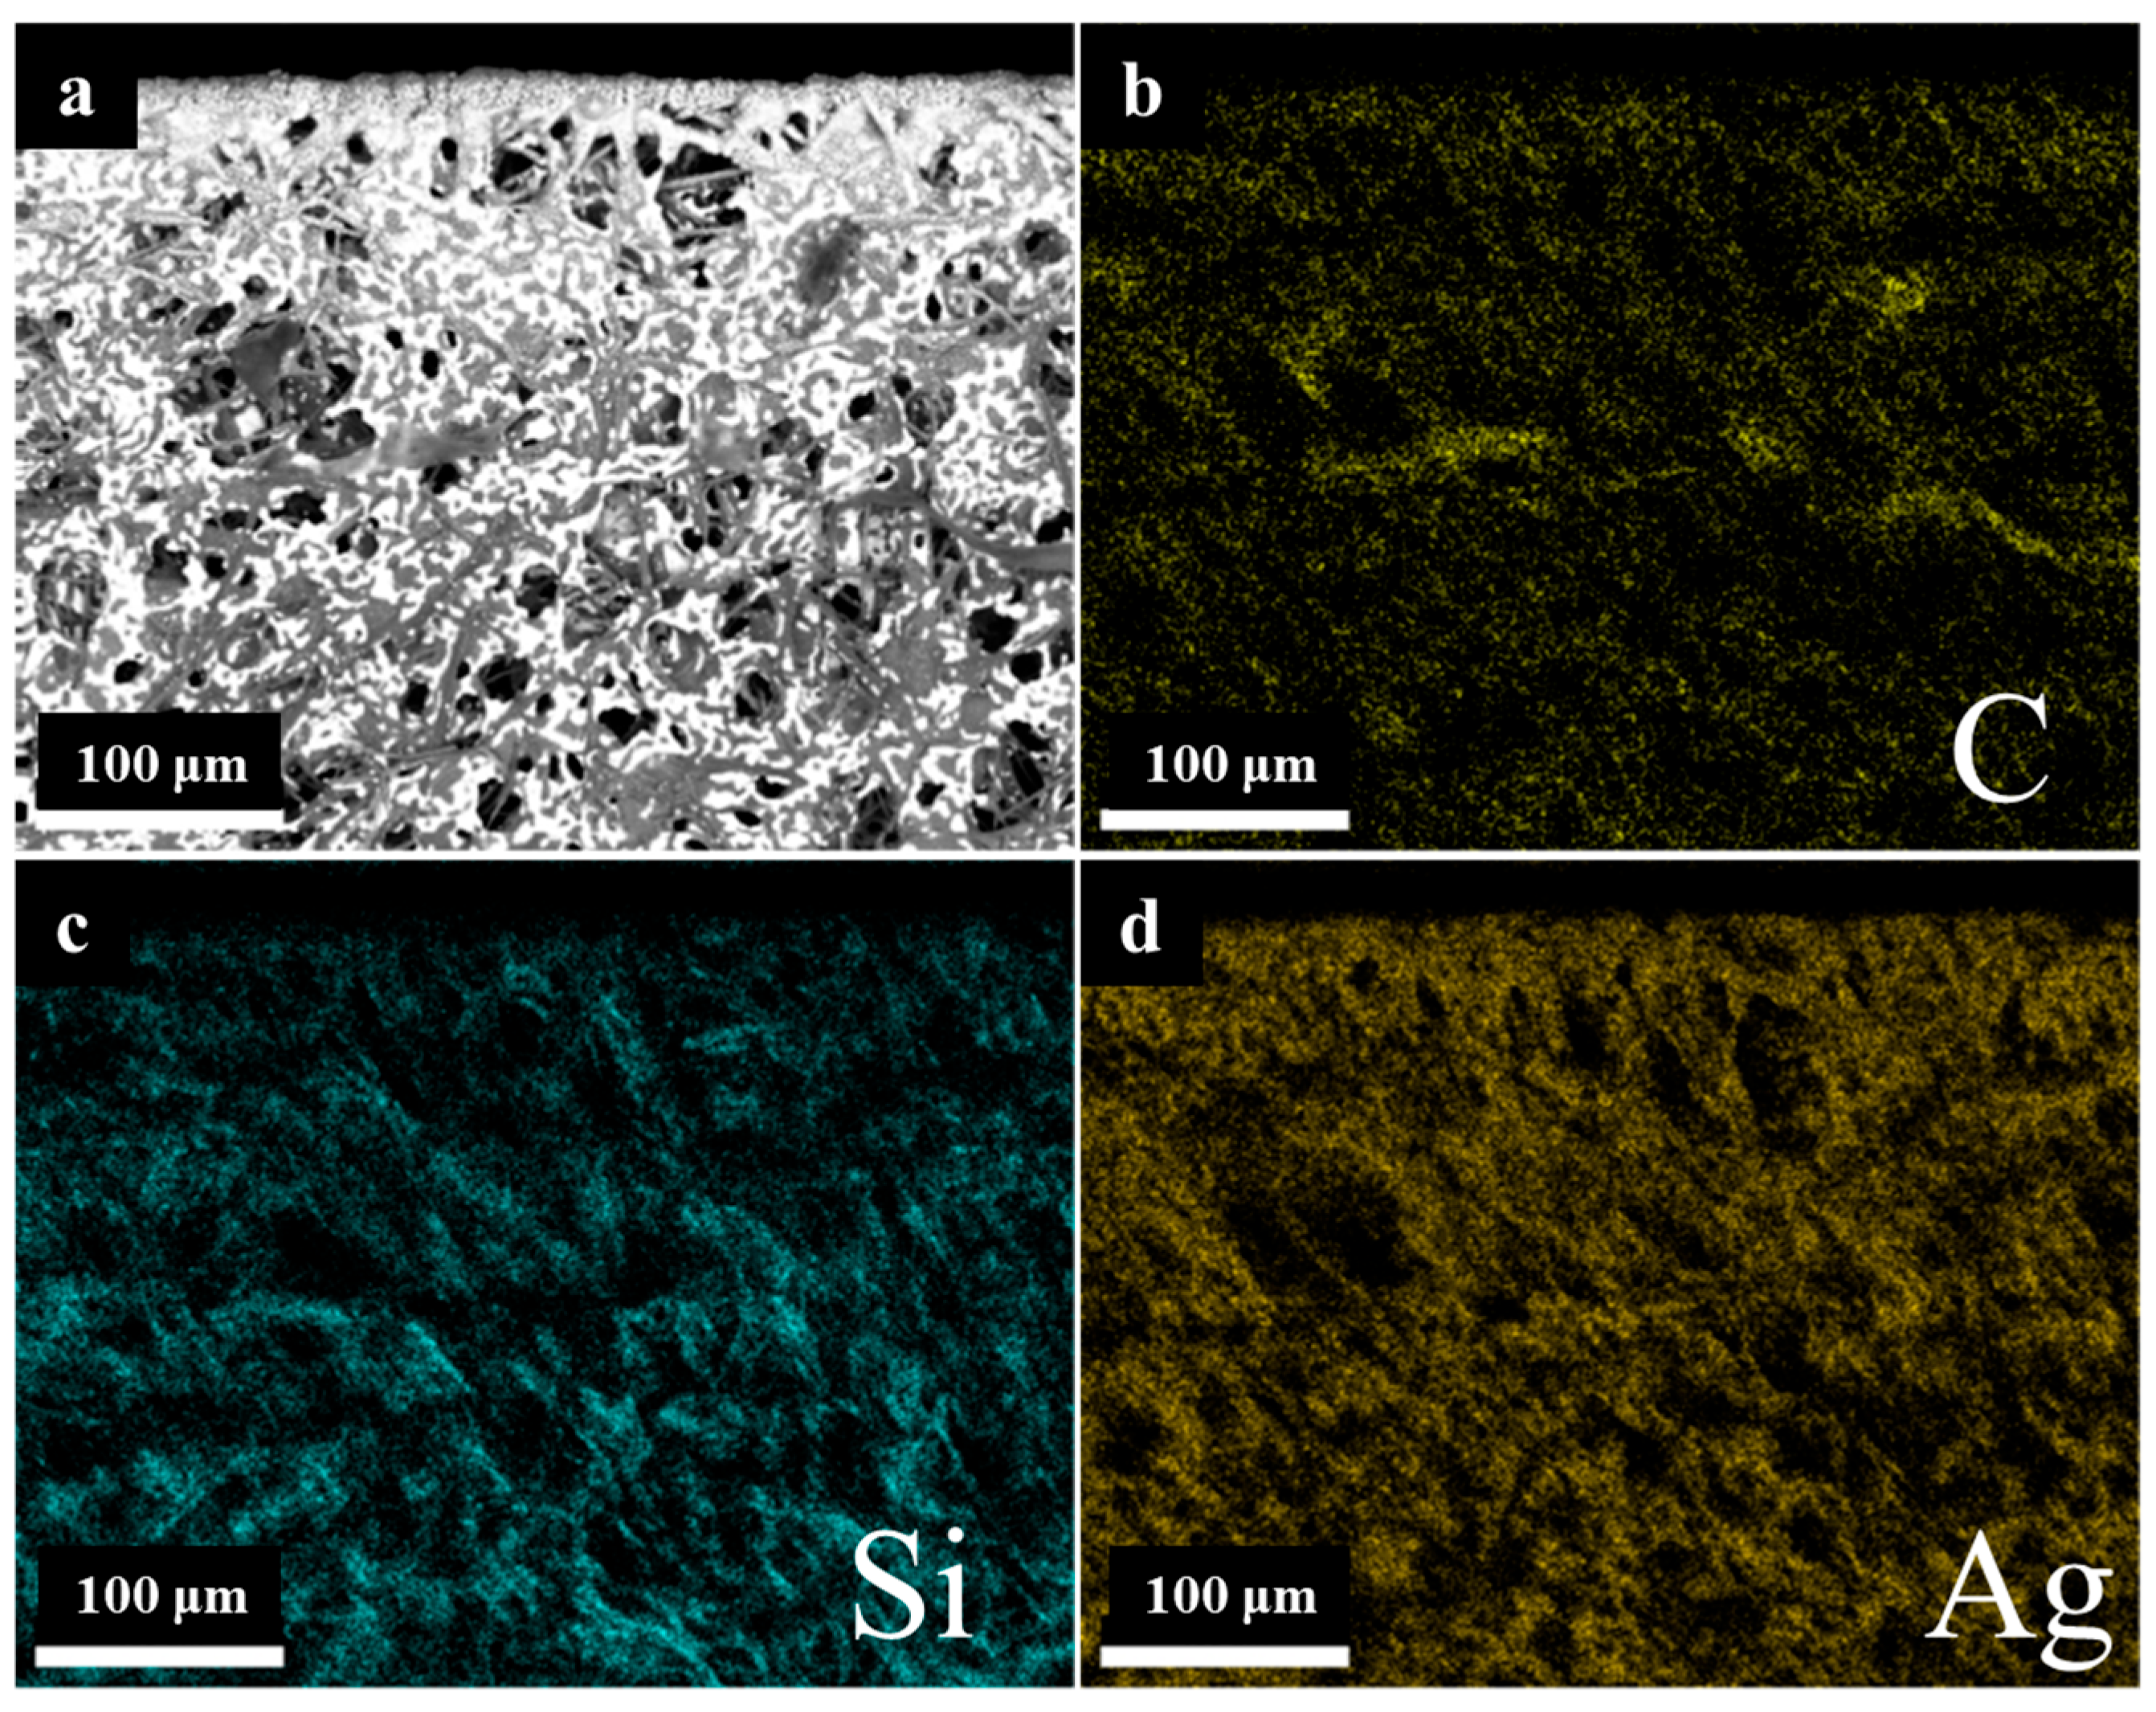
Furthermore, the elemental distribution surrounding the etched area was analyzed by means of SEM energy dispersive X-ray analysis (SEM-EDAX), as illustrated in
Figure 13. The elemental distribution of Si and Ag does not differ significantly from that of the initial surface, whereas the distribution of C in the vicinity of the etched area is low, presumably due to the rapid oxidation of C to CO
2 under the influence of high laser energy. It can be posited that the elemental distribution of C is principally located within the heat-affected zone. This observation suggests that etching spatters are more frequently deposited in this area.
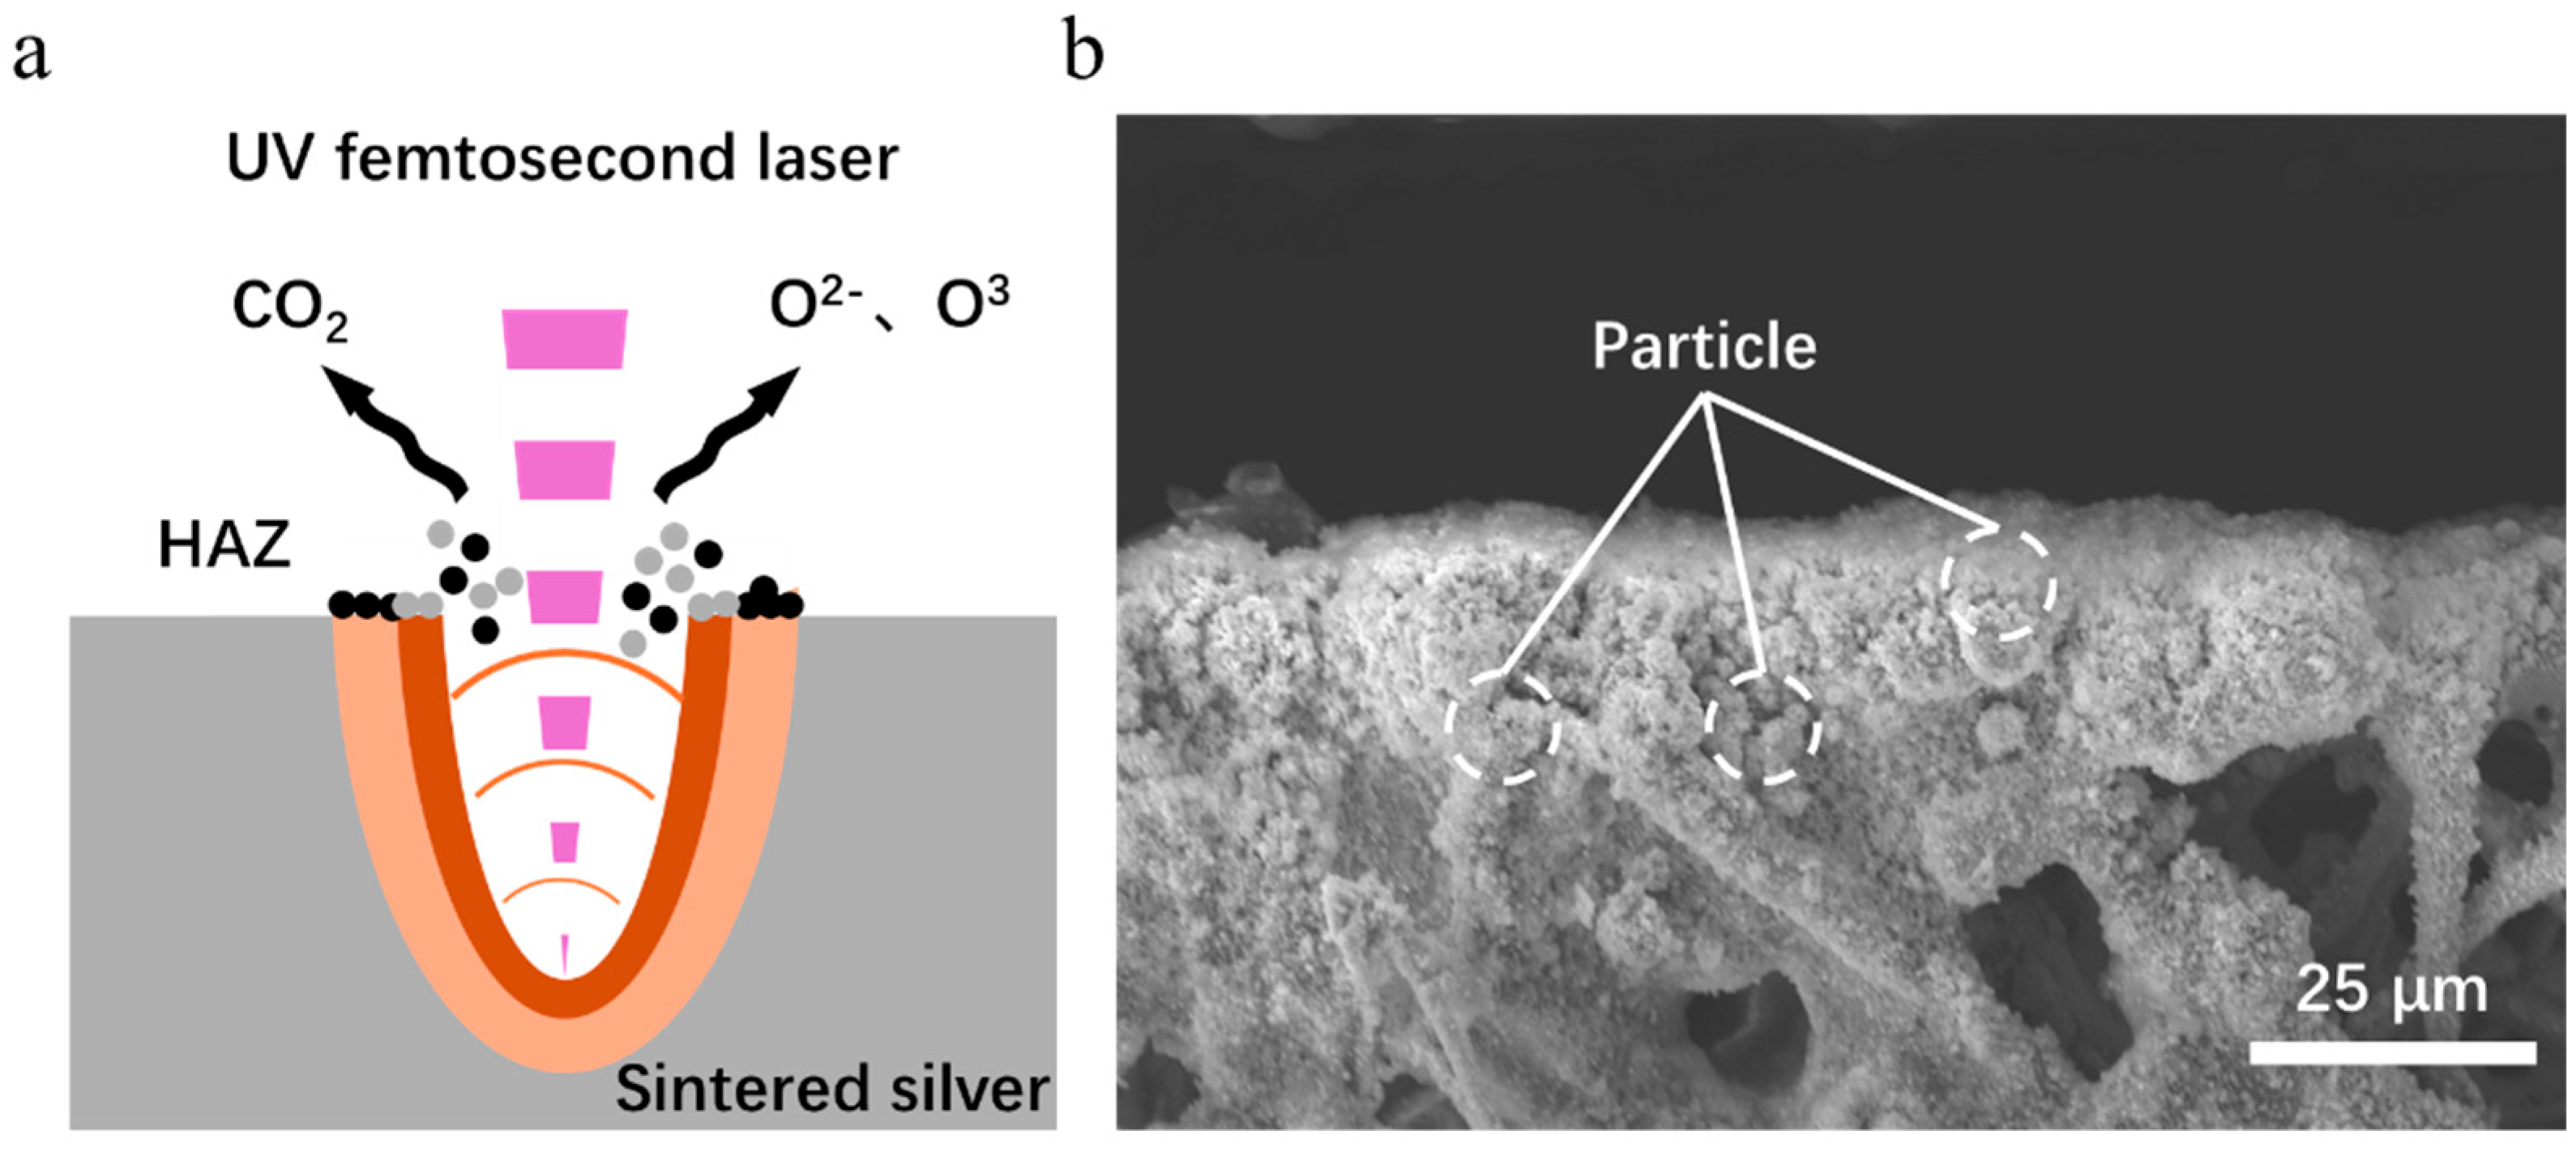
As shown in
Figure 14a, the ablation mechanism of the material primarily manifests as photothermal ablation [
34]. During laser–material interaction, the high-energy laser ionizes the air to produce reactive oxygen species (atomic oxygen and ozone), while the laser-induced high-temperature, high-pressure plasma (electron density > 10
17 cm
−3, temperature > 5000 K) [
35] ejects a large amount of gaseous material (Ag, C). The reactive oxygen species (Ag, C) then evaporate. The gaseous substances (Ag, C) that are splashed out react with the reactive oxygen species, resulting in the oxidation of gaseous silver by cooling and its deposition around the seam, as shown in
Figure 14b. Part of the vaporized carbon impurities are oxidized and converted to CO
2, which dissipates in the air; the other part is deposited in the heat-affected zone.
