
An Improved Algorithm to Extract Moiré Fringe Phase for Wafer-Mask Alignment in Nanoimprint Lithography


Abstract
1. Introduction
2. Principle
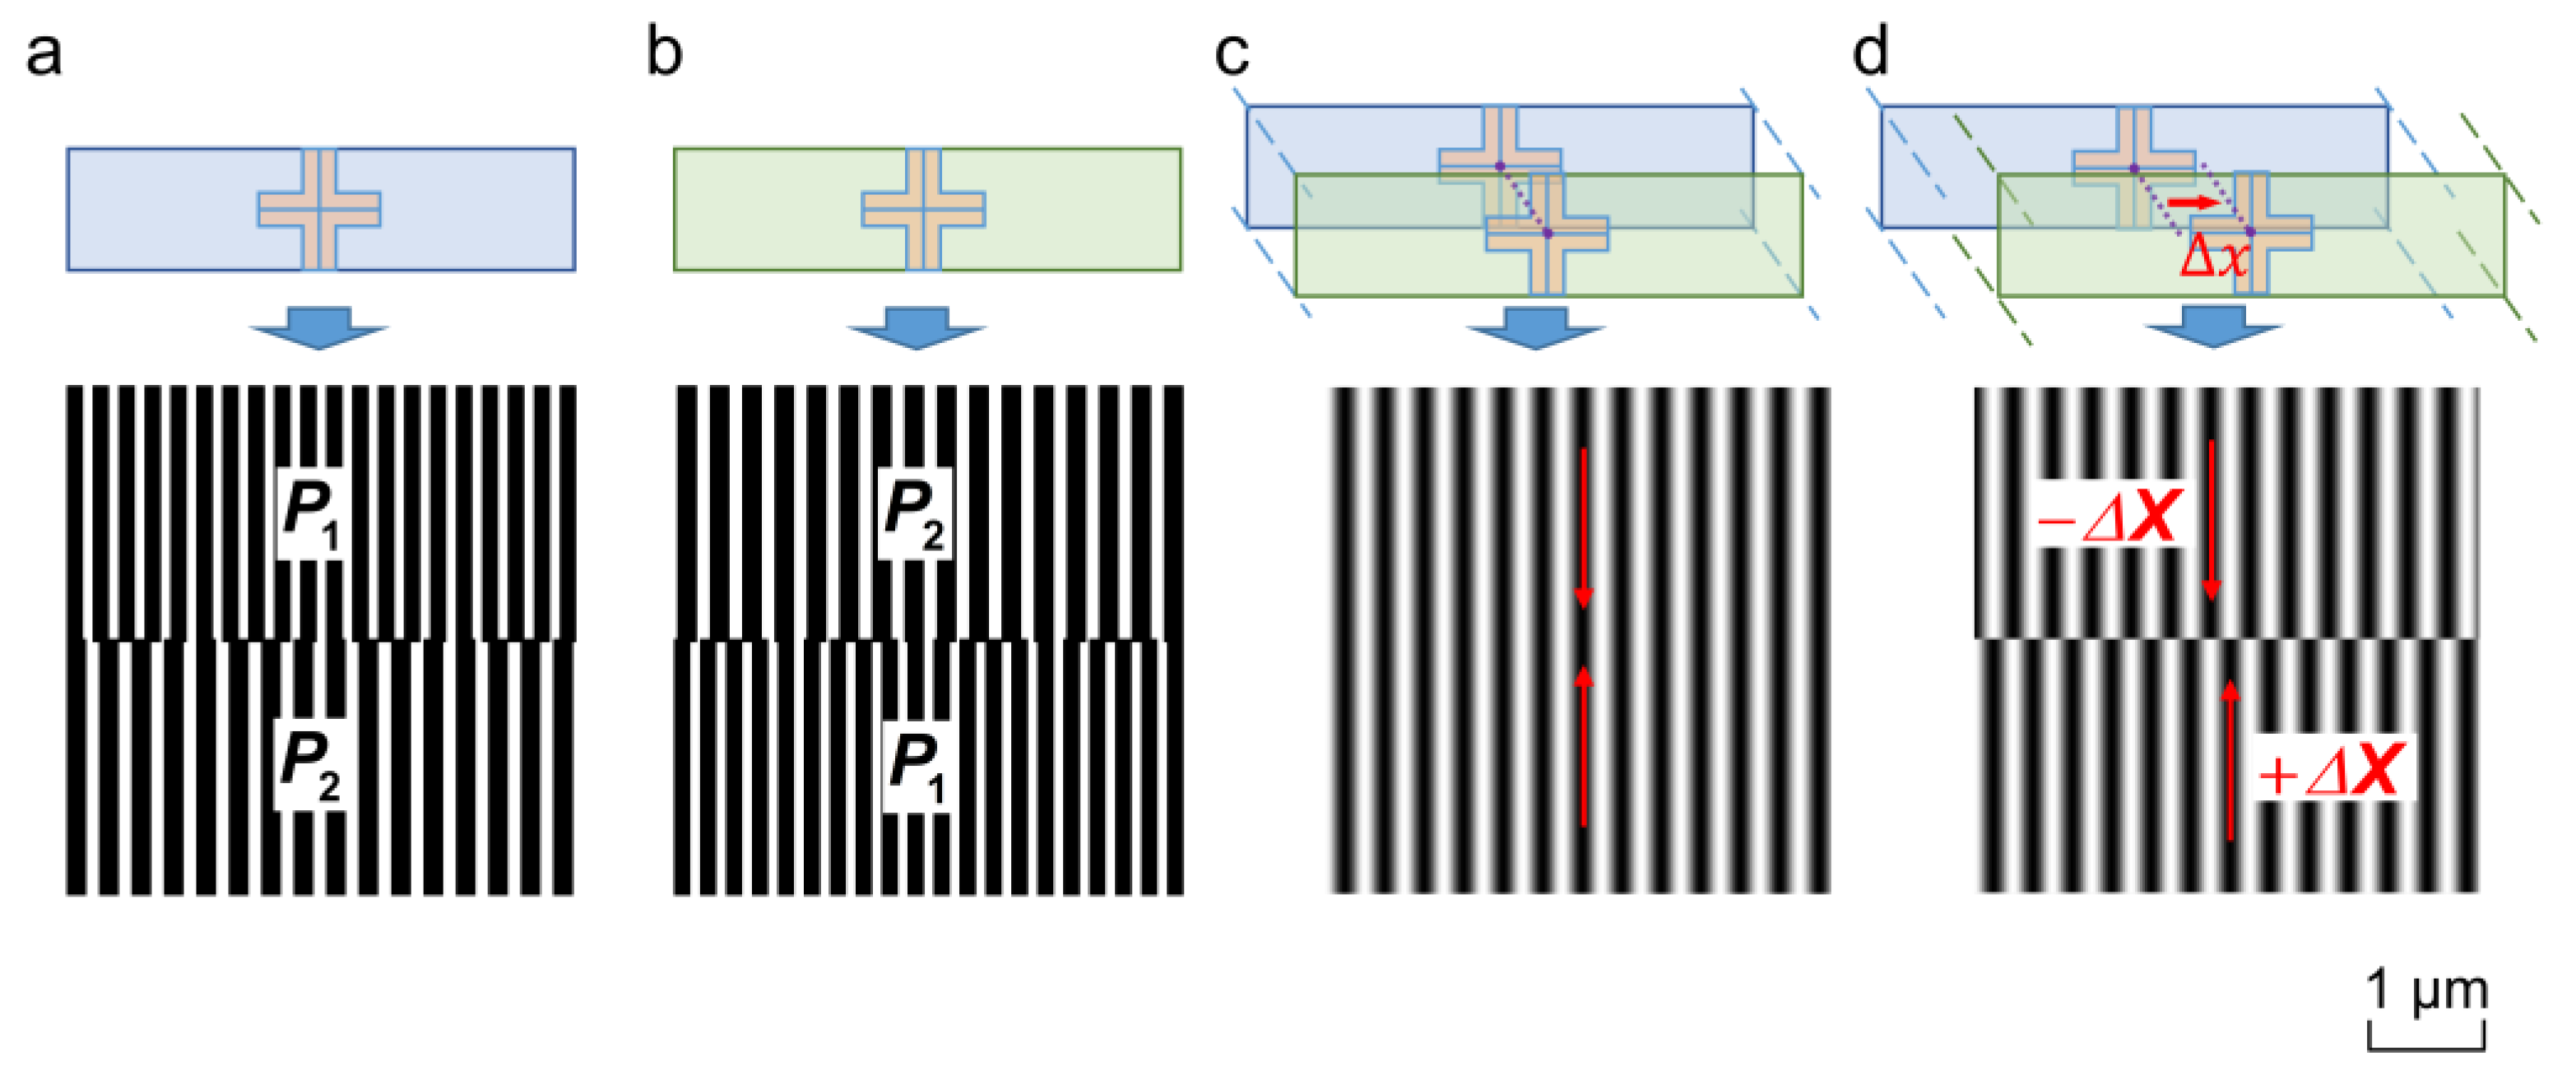
2.1. Alignment Principle
2.2. Phase-Processing Algorithm
2.2.1. Improved 2D-FWT Algorithm Theoretical Model
2.2.2. Annotations for Implementations of Algorithms
- (1)
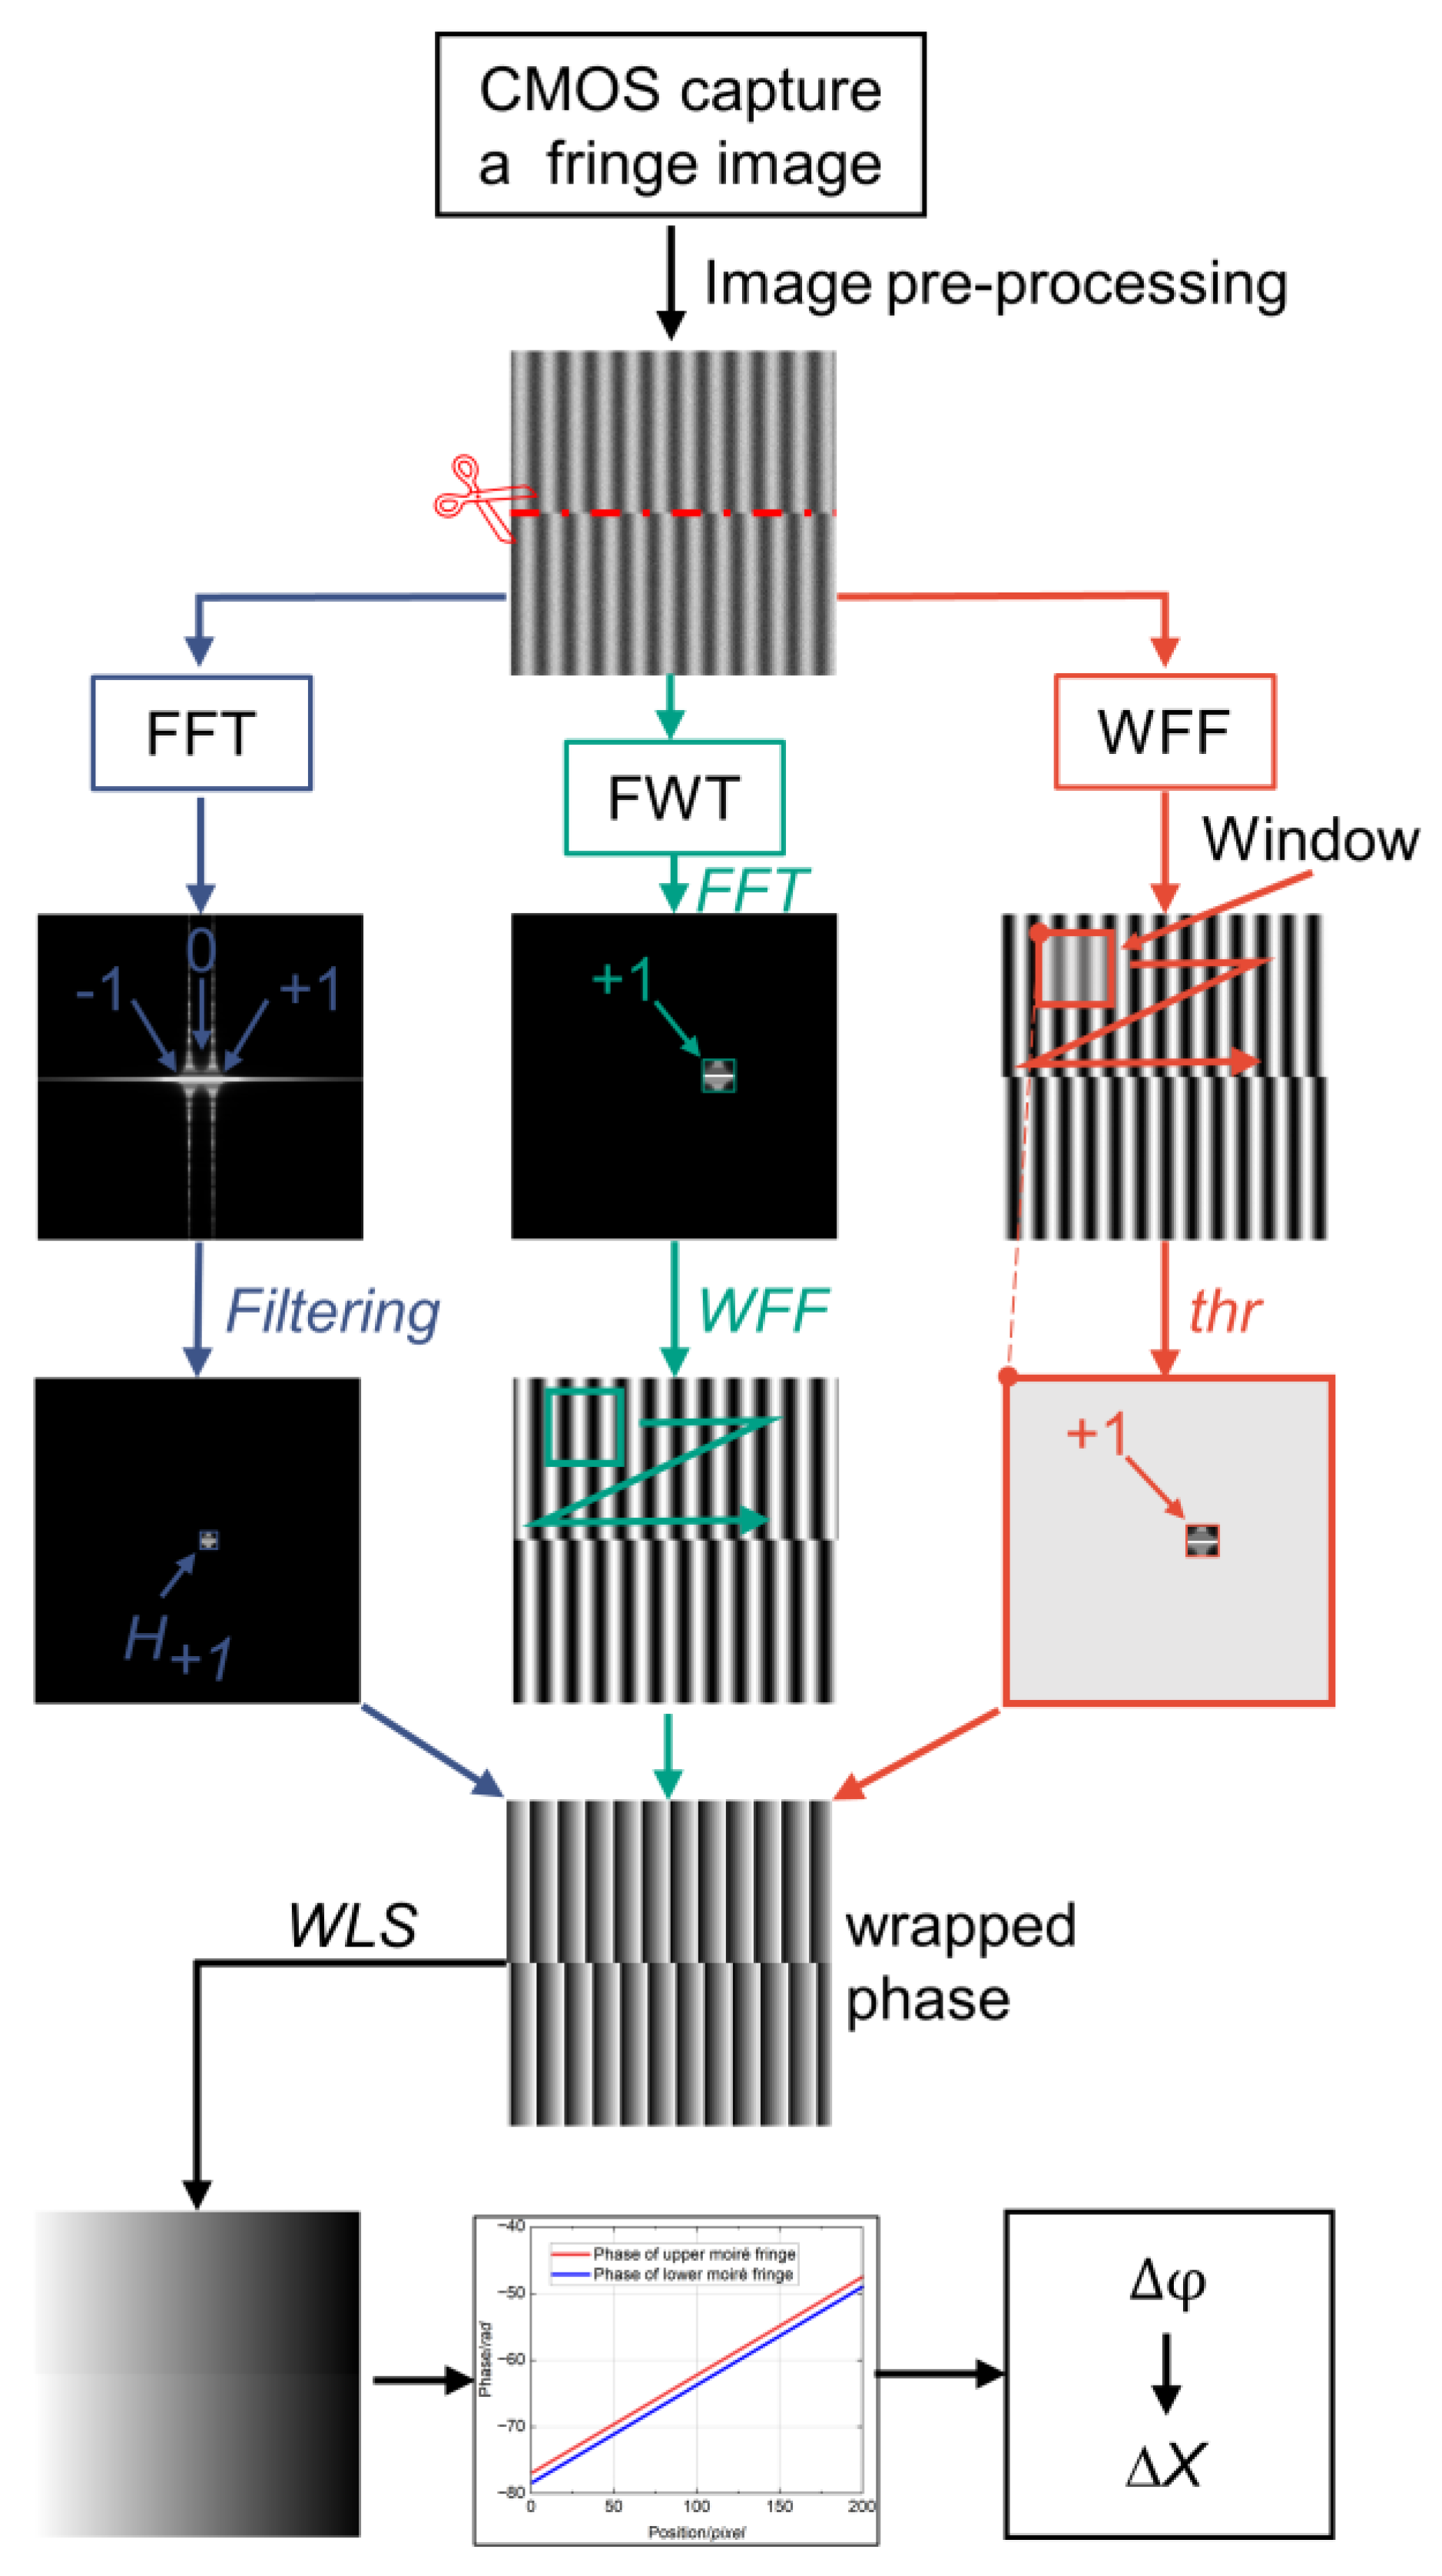
- The conventional strategy for 2D-FFT implementation is used. A 2D Hanning bandpass filter is used to extract the +1-level spectrum. The filter bandwidth is manually determined based on the spectrum distribution characteristics. Minimize the filter size to reduce noise interference when using 2D-FFT, and maximize the size to extract the complete spectrum information using the 2D-FWT. Thus, there is a trade-off between noise or spectrum loss and spectrum extraction accuracy.
- (2)
- To balance the frequency and time resolutions, the size of the Gaussian window function is set as , with . To reduce spectral leakage, the frequency range must be extended to . Given that the frequency range of the fringe pattern is estimated by the FT as , the spectral range of the FWT is set as [28]. The sampling frequency must be adequately small to accurately locate the local frequencies in the frequency range. However, to ensure a reasonable run time, the sampling interval only needs to cover the window uniformly for dense sampling. Therefore, the sampling frequency can be set as , and a finer sampling frequency can be set if higher precision sampling is desired. In addition, the choice of the threshold considerably affects the phase extraction results: an excessively large threshold may lead to distortion of the eigen-signal, and an excessively small threshold may lead to noise leakage. Both cases may result in phase distortions. A larger threshold interval can be selected to achieve nearly optimal filtering results, followed by fine-tuning based on the desired phase extraction effect.
- (3)
- When processing fringe patterns with the WFF, the lower frequency limit of the right half-plane of the spectral range must be located between the 0- and +1-level spectrum to completely extract the spectrum and avoid the infiltration of the 0-level spectrum. In this context, the selection of the lower frequency limit is critical for algorithm debugging and must be undertaken as the first step. However, the small window size results in a very small distance between both spectrums, and as such, an adjustment is very time-consuming. After setting the lower frequency limit, the threshold can be further adjusted to optimize the results. Fortunately, the proposed 2D-FWT does not need to consider this.
2.2.3. Phase Unwrapping Algorithm
3. Simulation
3.1. Pre-Processing
- (1)
- Image pre-processing: The fringe contrast may be reduced due to illumination disturbances and mark fabrication defects. Morphological methods can improve the contrast. If the fringe is severely disturbed by noise, spatial filtering can be applied for noise reduction without losing the critical information of the original image.
- (2)
- Image segmentation: Because of the truncation of the Moiré fringe along the middle misalignment, the phase is discontinuous at this position. To solve this problem, the image is segmented into upper and lower parts along the middle pixel mutation and processed separately before performing phase extraction. This step can avoid the loss of key information of the fundamental frequency and reduce phase error.
- (3)
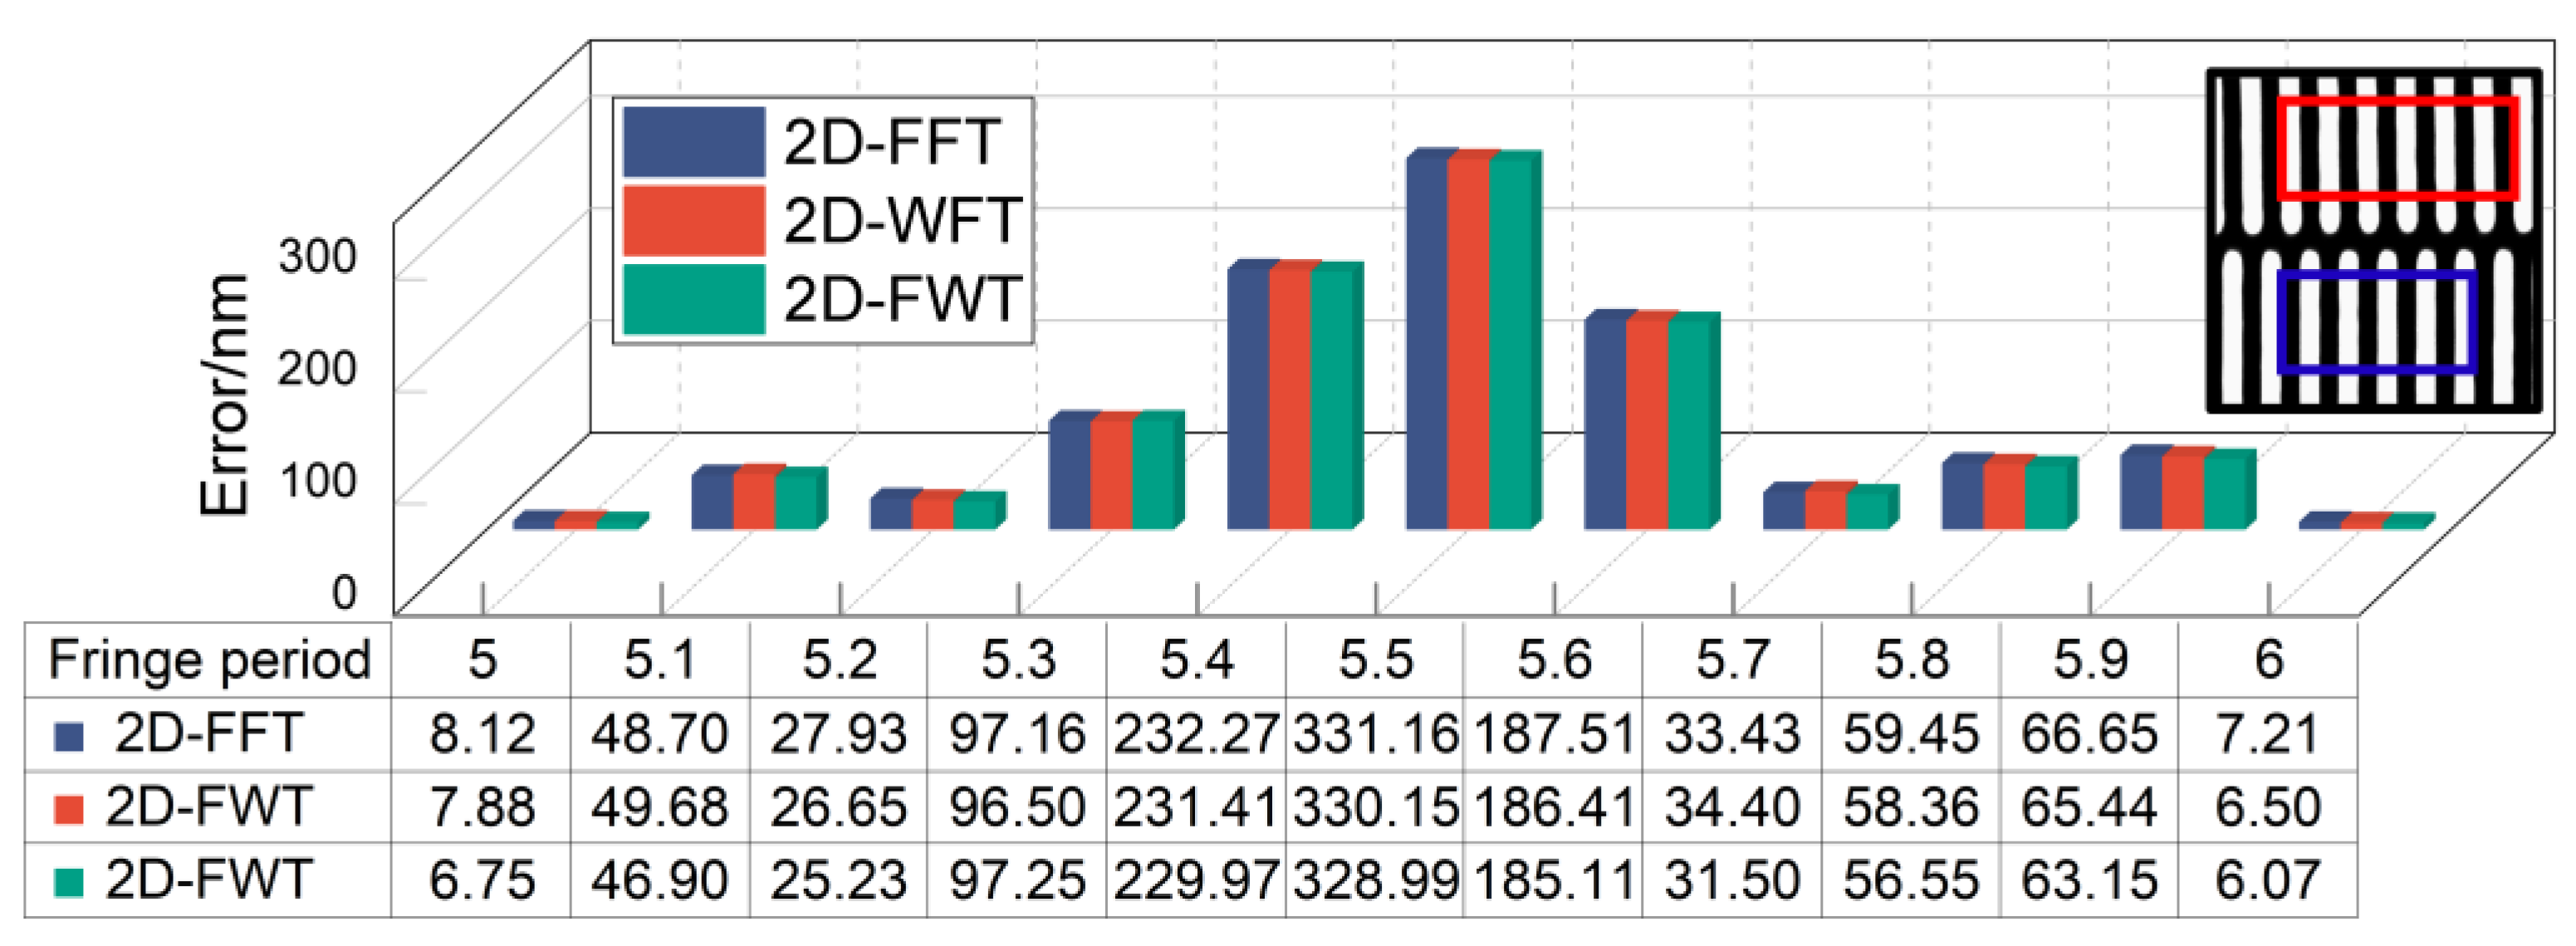
- Integral multiple truncations: According to the sampling theorem, the captured Moiré fringe pattern is truncated using an integer period () to reduce spectral leakage and improve the accuracy of the FWT algorithm.
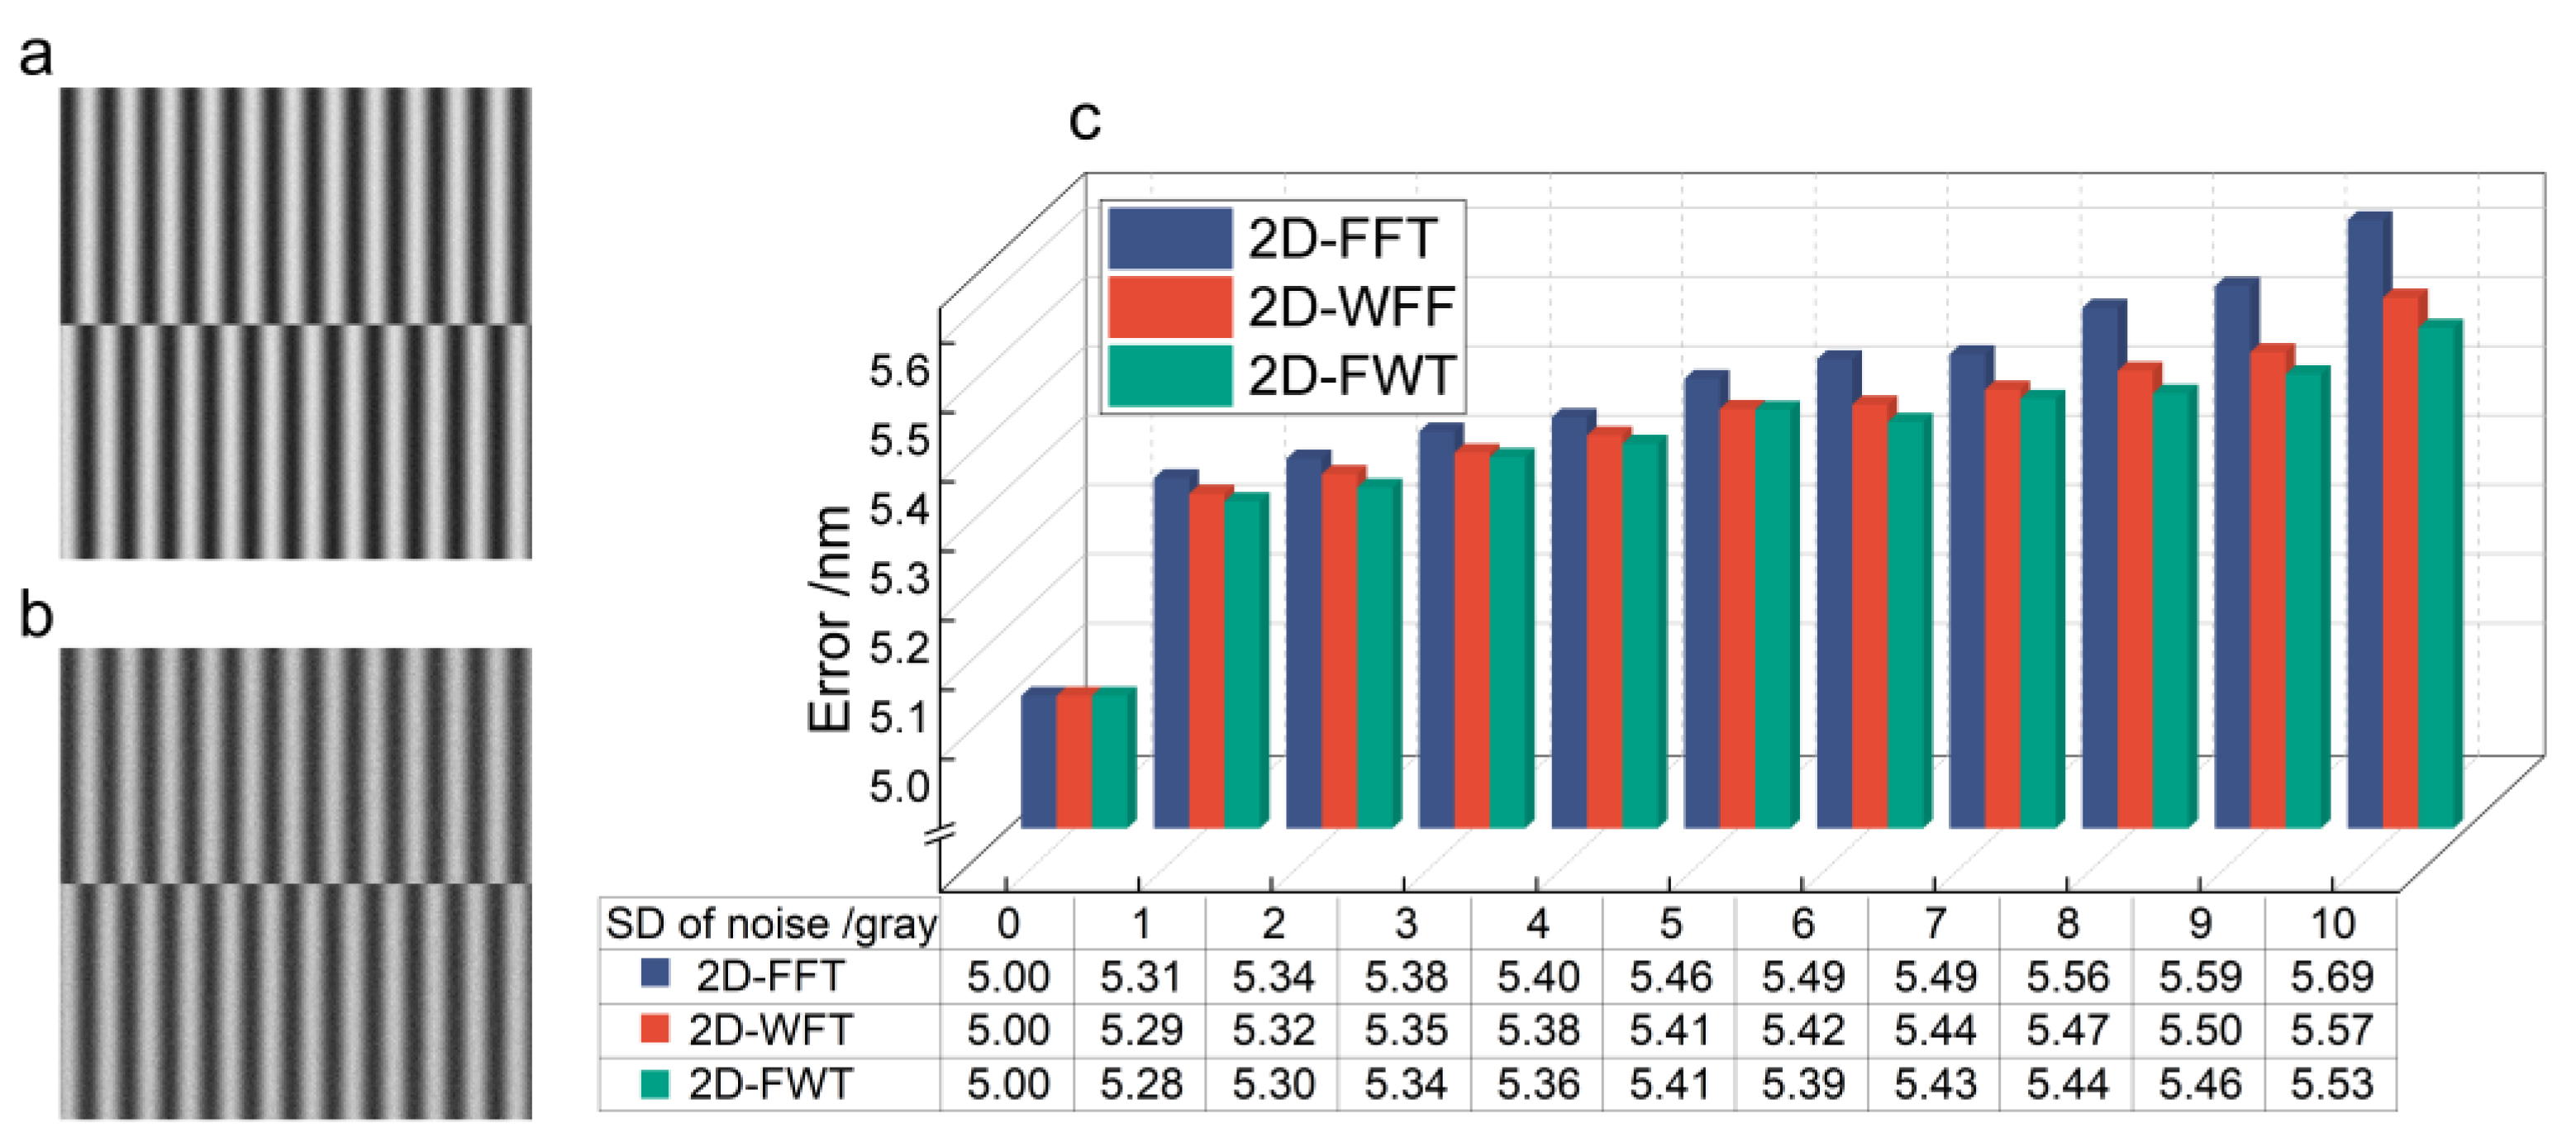
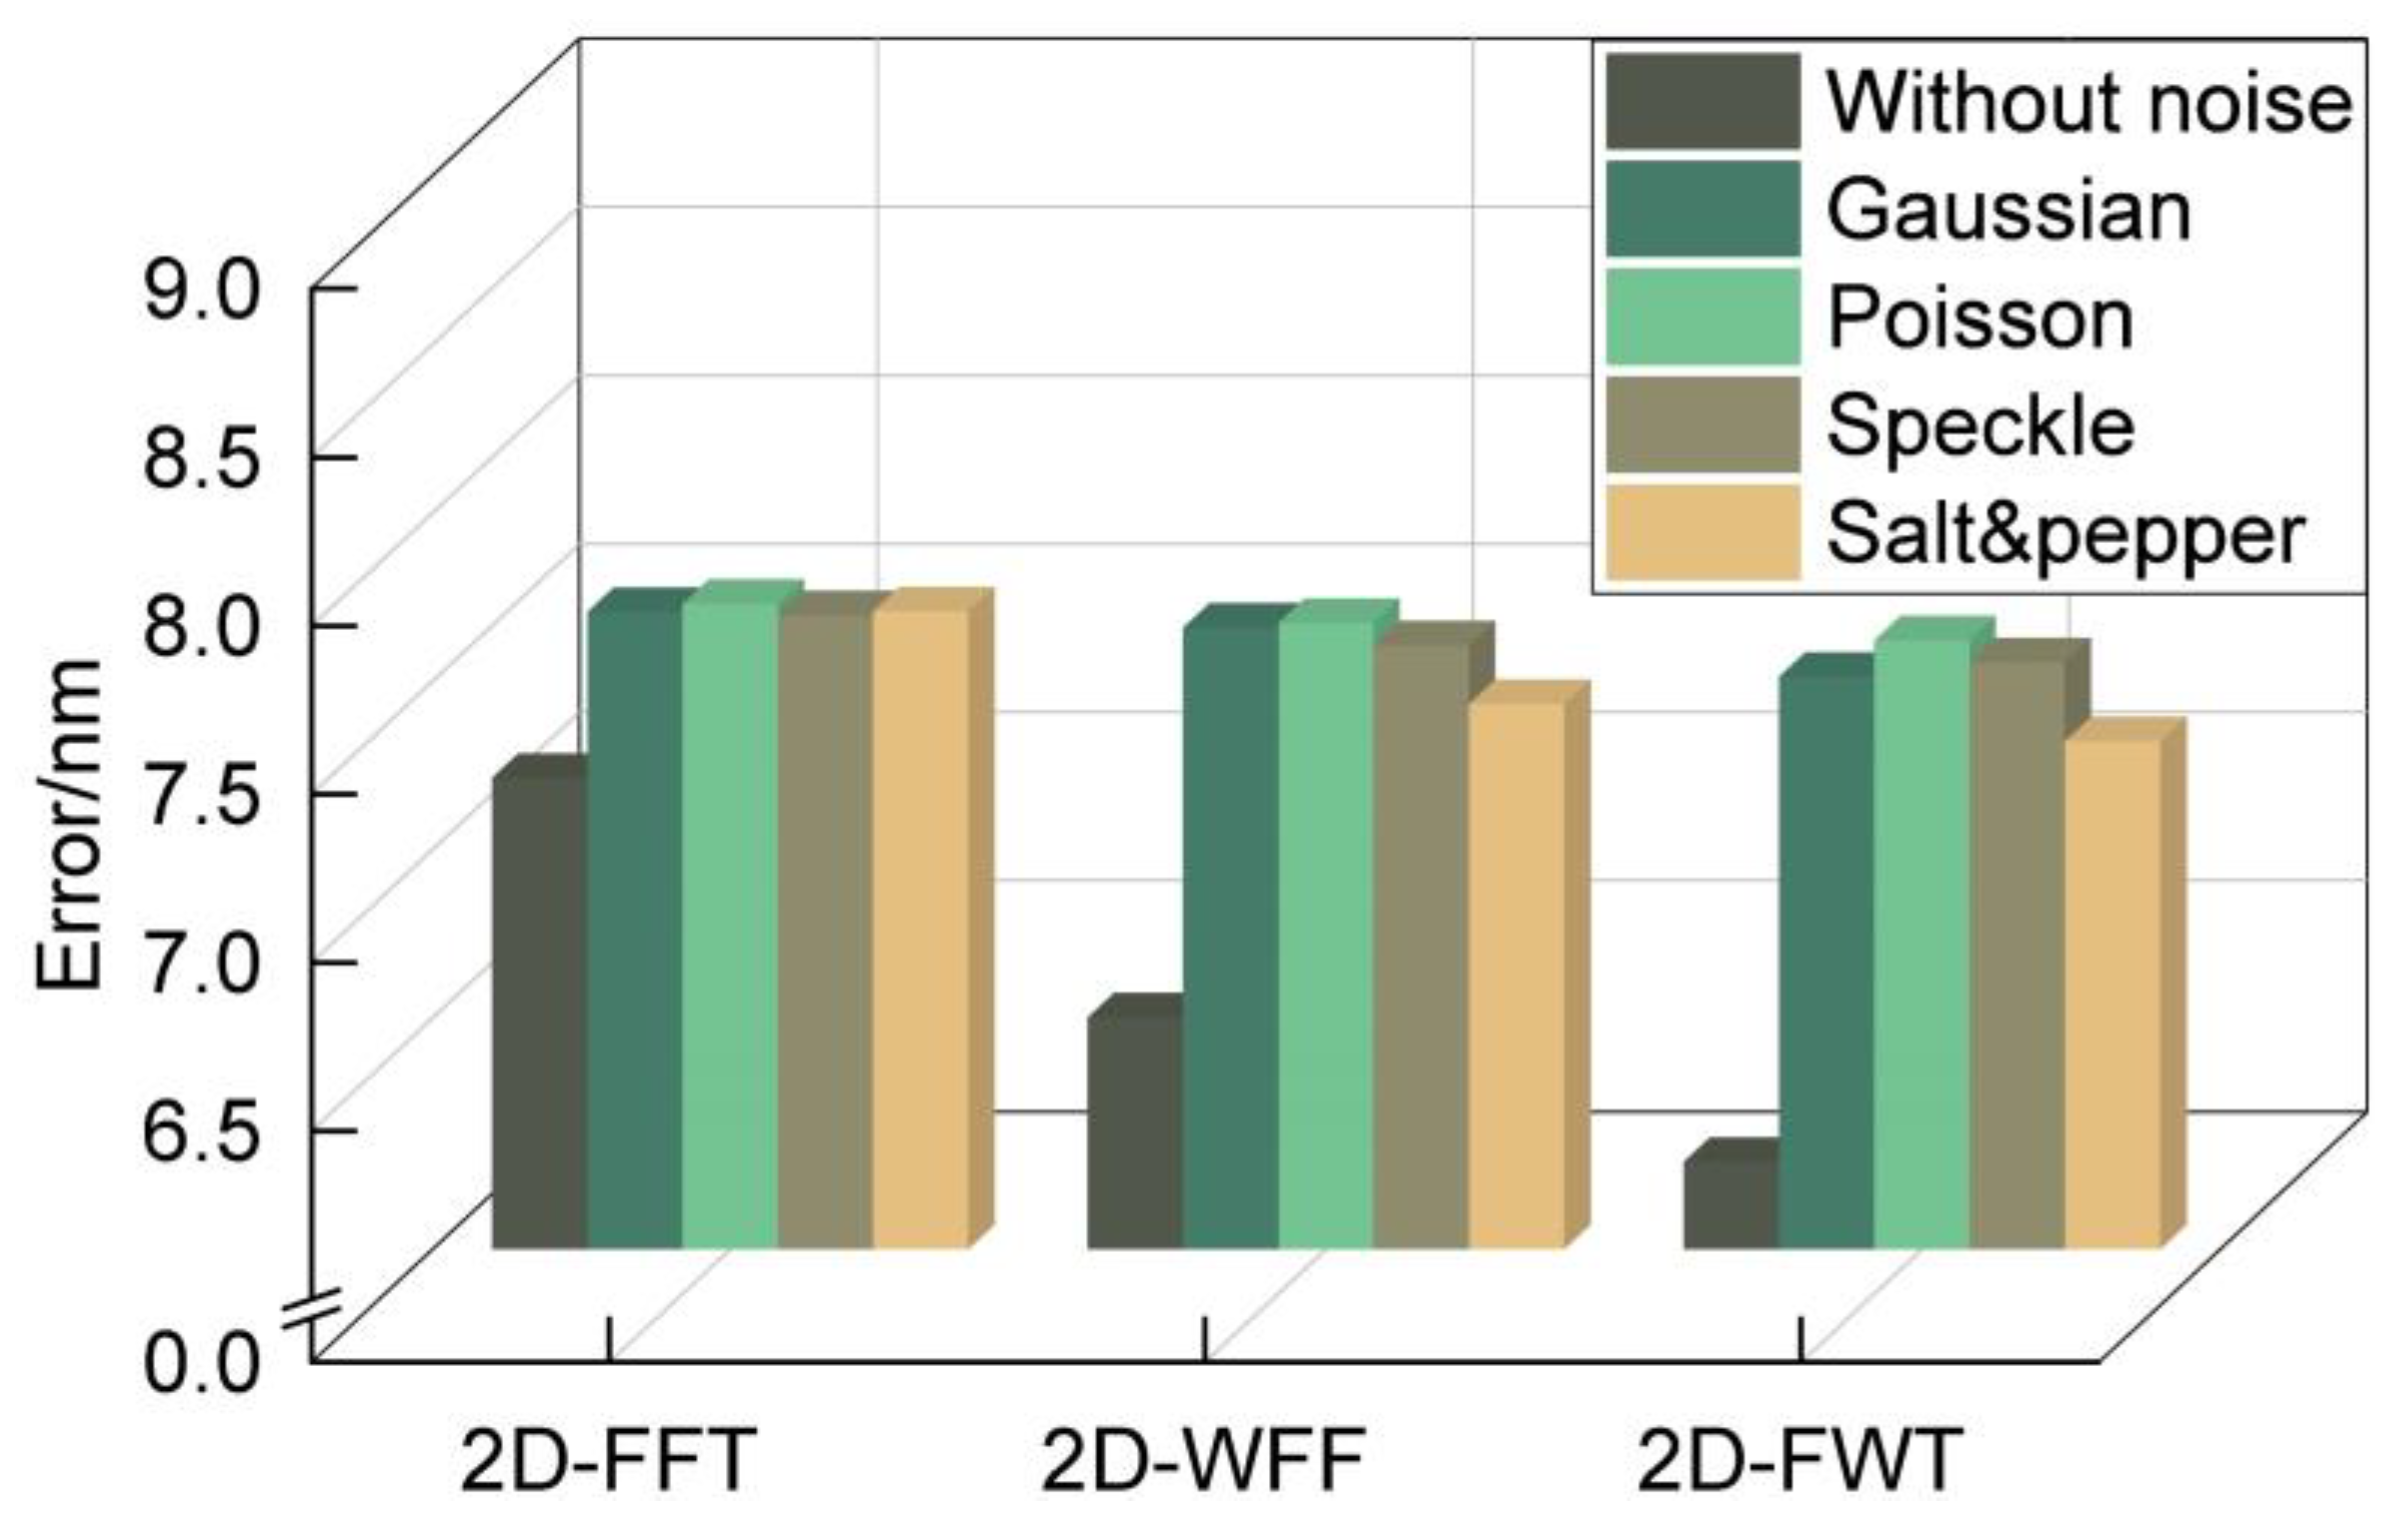
3.2. Robustness Testing of Algorithms
4. Experiment
4.1. Alignment Marks Fabrication
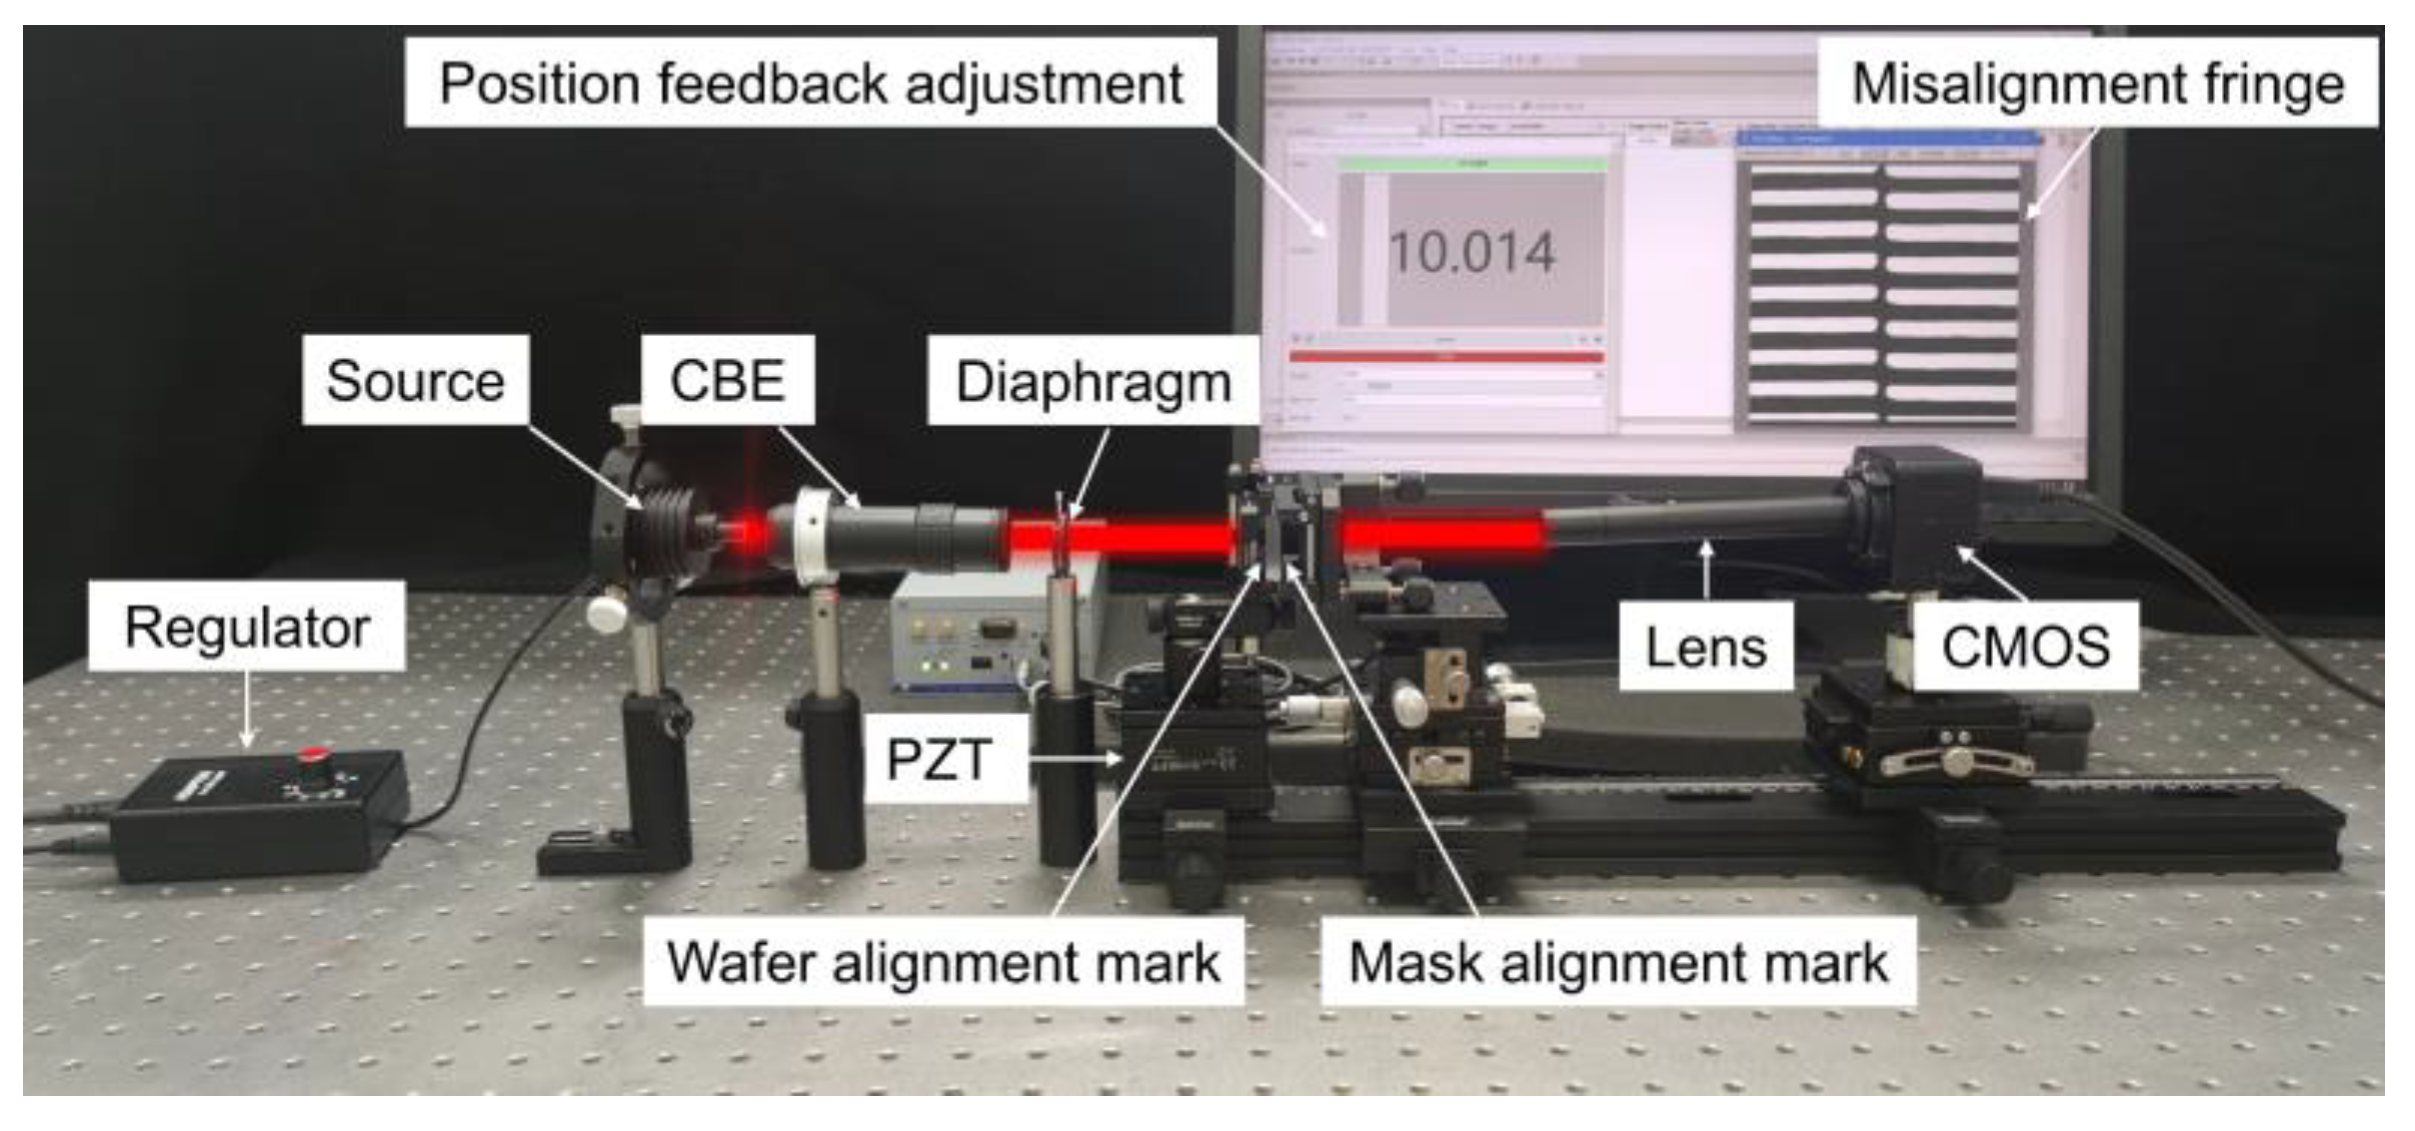
4.2. Measurement System
4.3. Experimental Results
4.4. Uncertainty Analysis
5. Discussion
6. Conclusions
Author Contributions
Funding
Data Availability Statement
Conflicts of Interest
Appendix A

| Error Source | Description |
|---|---|
| (1). Alignment mark fabrication error | Mark fabrication errors affect the Moiré fringe imaging quality. Although Moiré fringe can reduce grating etching errors, fabrication errors may lead to fringe distortion. Errors such as period deviations, etching position shifts, and shape irregularities affect the imaging and thus the alignment accuracy. |
| (2). Alignment signal error | When the truncate fringe length is not an integer period, the truncate error may lead to spectral leakage, thereby limiting the phase extraction accuracy. In addition, the fringe is affected by the imaging contrast, which in turn affects the phase extraction quality. The in-plane angular displacement misalignment of the two markers will produce a tilted moiré fringe and affect the radial displacement measurement, so the two alignment markers need to be leveled before the experiment. |
| (3). Image collection error | When collecting fringe images using CMOS cameras, spectral leakage may occur owing to the difference between the CMOS pixels and fringe periodicity. In addition, image collection is inevitably affected by dark currents and circuit noise, among other factors. These aspects may lead to phase variations and alignment errors. |
| (4). Phase algorithm error | In fringe analysis, phase extraction and unwrapping algorithms may induce phase errors. Specifically, the accuracy is affected by noise, image distortion, signal-to-noise ratio, and the sampling interval. Unwrapping algorithms encounter challenges in scenarios involving phase discontinuities, especially when the phase variation is large or there exist multiple discontinuities. |
| (5). PZT movement error | The movement error of PZT may lead to the accumulation of step experiment errors, thereby adversely affecting the alignment accuracy. |
| (6). Wafer and mask stress distortion | During NIL alignment, contact between the wafer and mask may lead to changes in the local stress, resulting in distortion of the alignment marks. This distortion can directly affect the imaging quality of the fringe with shape distortion. |
| (7). Environmental disturbances | Although we construct the experimental system on an optical platform inside an ultra-clean vibration isolation laboratory, external vibrations and airflow disturbances cannot be eliminated. These disturbances can affect the stability of the alignment marks and imaging quality of the Moiré fringe, thereby influencing the experimental results. |
References
- Cox, L.M.; Martinez, A.M.; Blevins, A.K.; Sowan, N.; Ding, Y.; Bowman, C.N. Nanoimprint Lithography: Emergent Materials and Methods of Actuation. Nano Today 2020, 31, 100838. [Google Scholar] [CrossRef]
- Chou, S.Y.; Krauss, P.R.; Renstrom, P.J. Imprint of Sub-25 Nm Vias and Trenches in Polymers. Appl. Phys. Lett. 1995, 67, 3114–3116. [Google Scholar] [CrossRef]
- Lundstrom, M.S.; Alam, M.A. Moore’s Law: The Journey Ahead. Science 2022, 378, 722–723. [Google Scholar] [CrossRef] [PubMed]
- Sharma, E.; Rathi, R.; Misharwal, J.; Sinhmar, B.; Kumari, S.; Dalal, J.; Kumar, A. Evolution in Lithography Techniques: Microlithography to Nanolithography. Nanomaterials 2022, 12, 2754. [Google Scholar] [CrossRef]
- IEEE International Roadmap for Devices and Systems. IRDS 2023 Lithography; IEEE International Roadmap for Devices and Systems: New York, NY, USA, 2023. [Google Scholar]
- Gruber, M.; Hagedorn, D.; Eckert, W. Precise and Simple Optical Alignment Method for Double-Sided Lithography. Appl. Opt. 2001, 40, 5052. [Google Scholar] [CrossRef]
- Flanders, D.C.; Smith, H.I.; Austin, S. A New Interferometric Alignment Technique. Appl. Phys. Lett. 1977, 31, 426–428. [Google Scholar] [CrossRef]
- Zhou, H. Subnanometer Alignment System for X-Ray Lithography. J. Vac. Sci. Technol. B Microelectron. Nanometer Struct. 1994, 12, 3261–3264. [Google Scholar] [CrossRef]
- Xu, F.; Zhao, Y.; Ni, L.; Wu, Q.; Xia, H. Two-Dimensional Hanning Self-Convolution Window for Enhancing Moiré Fringe Alignment in Lithography. Mech. Syst. Sig. Process. 2024, 208, 111052. [Google Scholar] [CrossRef]
- Yu, D.; Liu, J.; Zhou, J.; Sun, H.; Jin, C.; Wang, J. Depth–Depth of Focus Moiré Fringe Alignment via Broad-Spectrum Modulation. Photonics 2024, 11, 138. [Google Scholar] [CrossRef]
- Wang, N.; Li, Y.; Jiang, W.; Qin, Z.; Liu, J. Large-Range Two-Dimensional Sub-Nano-Misalignment Sensing for Lithography with a Piecewise Frequency Regression Network. Opt. Lett. 2024, 49, 1485–1488. [Google Scholar] [CrossRef]
- Jin, C.; Yu, D.; Sun, H.; Liu, J.; Zhou, J.; Wang, J. An Adjustment Strategy for Tilted Moiré Fringes via Deep Q-Network. Photonics 2024, 11, 666. [Google Scholar] [CrossRef]
- Fan, J.; Lu, S.; Zou, J.; Yang, K.; Zhu, Y.; Liao, K. High-Precision Wafer Bonding Alignment Mark Using Moiré Fringes and Digital Grating. Micromachines 2022, 13, 2159. [Google Scholar] [CrossRef] [PubMed]
- Huang, B.; Wang, C.; Fang, H.; Zhou, S.; Suga, T. Moiré-Based Alignment Using Centrosymmetric Grating Marks for High-Precision Wafer Bonding. Micromachines 2019, 10, 339. [Google Scholar] [CrossRef]
- Xu, F.; Chang, S.; Zhang, J.; Pan, C.; Xia, H. Enhancing Accuracy of Alignment Measurement in Lithography Using Two-Dimensional Desirable Sidelobe Convolution Window. Measurement 2024, 242, 116196. [Google Scholar] [CrossRef]
- Wang, N.; Jiang, W.; Zhang, Y. Misalignment Measurement with Dual-Frequency Moiré Fringe in Nanoimprint Lithography. Opt. Express 2020, 28, 6755–6765. [Google Scholar] [CrossRef]
- Shao, J.; Ding, Y.; Tian, H.; Li, X.; Li, X.; Liu, H. Digital Moiré Fringe Measurement Method for Alignment in Imprint Lithography. Opt. Laser Technol. 2012, 44, 446–451. [Google Scholar] [CrossRef]
- Li, N.; Wu, W.; Chou, S.Y. Sub-20-Nm Alignment in Nanoimprint Lithography Using Moiré Fringe. Nano Lett. 2006, 6, 2626–2629. [Google Scholar] [CrossRef]
- Xu, F.; Chang, S.; Zhao, Y.; Li, W.; Xia, H. High-Precision Moiré Alignment Method Using Centrosymmetric Grating for 3D Interlayer Interconnect. Opt. Lasers Eng. 2023, 171, 107815. [Google Scholar] [CrossRef]
- Duhamel, P.; Vetterli, M. Fast Fourier Transforms: A Tutorial Review and a State of the Art. Signal Process. 1990, 19, 259–299. [Google Scholar] [CrossRef]
- Yang, C.; Lu, Q.; Zhao, J.; Miao, H. Window Size Selection in Windowed Fourier Transform for Phase Retrieval. Opt. Lasers Eng. 2010, 48, 1096–1103. [Google Scholar] [CrossRef]
- Kemao, Q. Applications of Windowed Fourier Fringe Analysis in Optical Measurement: A Review. Opt. Lasers Eng. 2015, 66, 67–73. [Google Scholar] [CrossRef]
- Kemao, Q. Windowed Fringe Pattern Analysis; SPIE: Strasbourg, France, 2013; ISBN 978-0-8194-9643-0. [Google Scholar]
- Huang, L.; Kemao, Q.; Pan, B.; Asundi, A.K. Comparison of Fourier Transform, Windowed Fourier Transform, and Wavelet Transform Methods for Phase Extraction from a Single Fringe Pattern in Fringe Projection Profilometry. Opt. Lasers Eng. 2010, 48, 141–148. [Google Scholar] [CrossRef]
- Xu, F.; Zhou, S.; Hu, S. The Leveling of Mask and Wafer in Proximity Nanolithography Using Fringe Pattern Phase Analysis. Optik 2014, 125, 3176–3180. [Google Scholar] [CrossRef]
- Shah, F.A.; Nisar, K.S.; Lone, W.Z.; Tantary, A.Y. Uncertainty Principles for the Quadratic-phase Fourier Transforms. Math. Methods Appl Sci. 2021, 44, 10416–10431. [Google Scholar] [CrossRef]
- Kemao, Q.; Wang, H.; Gao, W. Windowed Fourier Transform for Fringe Pattern Analysis: Theoretical Analyses. Appl. Opt. 2008, 47, 5408. [Google Scholar] [CrossRef]
- Kemao, Q. Two-Dimensional Windowed Fourier Transform for Fringe Pattern Analysis: Principles, Applications and Implementations. Opt. Lasers Eng. 2007, 45, 304–317. [Google Scholar] [CrossRef]
- Ghiglia, D.C.; Romero, L.A. Robust Two-Dimensional Weighted and Unweighted Phase Unwrapping That Uses Fast Transforms and Iterative Methods. J. Opt. Soc. Am. A 1994, 11, 107. [Google Scholar] [CrossRef]
- Herráez, M.A.; Burton, D.R.; Lalor, M.J.; Gdeisat, M.A. Reading and Understanding Continuous Wavelet Transforms. Appl. Opt. 2002, 41, 7437–7444. [Google Scholar] [CrossRef]
- Goldstein, R.M.; Zebker, H.A.; Werner, C.L. Satellite Radar Interferometry: Two-Dimensional Phase Unwrapping. Radio Sci. 1988, 23, 713–720. [Google Scholar] [CrossRef]
- Zhao, Z.; Zhang, H.; Xiao, Z.; Du, H.; Zhuang, Y.; Fan, C.; Zhao, H. Robust 2D Phase Unwrapping Algorithm Based on the Transport of Intensity Equation. Meas. Sci. Technol. 2019, 30, 015201. [Google Scholar] [CrossRef]
- Pritt, M.D.; Shipman, J.S. Least-Squares Two-Dimensional Phase Unwrapping Using FFT’s. IEEE Trans. Geosci. Remote Sens. 1994, 32, 706–708. [Google Scholar] [CrossRef]
- Xu, B.; Wu, Q.; Dong, L.; Wei, Y. Selection of DBO Measurement Wavelength for Bottom Mark Asymmetry Based on FDTD Method. J. Semicond. 2019, 40, 122403. [Google Scholar] [CrossRef]
- Tang, J.; Zhong, W.; Li, S. Unidirectional Optical Transmission of a Dual Metallic Grating with Grooves. Plasmonics 2020, 15, 1799–1805. [Google Scholar] [CrossRef]
- Cunha, J.; Queiroz, J.; Silva, C.; Gentile, F.; Aguiam, D.E. pyMOE: Mask Design and Modeling for Micro Optical Elements and Flat Optics. Comput. Phys. Commun. 2024, 305, 109331. [Google Scholar] [CrossRef]
- Sanchez-Brea, L.M.; Soria-Garcia, A.; Andres-Porras, J.; Pastor-Villarrubia, V.; Elshorbagy, M.H.; del Hoyo, J.; Torcal-Milla, F.J.; Alda, J. Diffractio: An Open-Source Library for Diffraction and Interference Calculations. In Proceedings of the Optics and Photonics for Advanced Dimensional Metrology III, Strasbourg, France, 18 June 2024; p. 46. [Google Scholar]
- Guide to the Expression of Uncertainty in Measurement—Part 6: Developing and Using Measurement Models. 2020. Available online: https://www.bipm.org/en/doi/10.59161/JCGMGUM-6-2020 (accessed on 14 November 2024).
- Disawal, R.; Prakash, S. Measurement of Displacement Using Phase Shifted Wedge Plate Lateral Shearing Interferometry. Opt. Laser Technol. 2016, 77, 64–71. [Google Scholar] [CrossRef]
- Zhu, J.; Hu, S.; Yu, J.; Tang, Y.; Xu, F.; He, Y.; Zhou, S.; Li, L. Influence of Tilt Moiré Fringe on Alignment Accuracy in Proximity Lithography. Opt. Lasers Eng. 2013, 51, 371–381. [Google Scholar] [CrossRef]
- Zhu, J.; Hu, S.; Yu, J.; Zhou, S.; Tang, Y.; Zhong, M.; Zhao, L.; Chen, M.; Li, L.; He, Y.; et al. Four-Quadrant Gratings Moiré Fringe Alignment Measurement in Proximity Lithography. Opt. Express 2013, 21, 3463–3473. [Google Scholar] [CrossRef]
- Shang, H.; Liu, C.; Wang, R. Measurement Methods of 3D Shape of Large-Scale Complex Surfaces Based on Computer Vision: A Review. Measurement 2022, 197, 111302. [Google Scholar] [CrossRef]
- Psota, P.; Mokrý, P.; Lédl, V.; Stašík, M.; Matoušek, O.; Kredba, J. Absolute and Pixel-Wise Measurements of Vibration Amplitudes Using Time-Averaged Digital Holography. Opt. Lasers Eng. 2019, 121, 236–245. [Google Scholar] [CrossRef]
- Zhong, J.; Liu, D.; Chi, S.; Tu, Z.; Zhong, S. Vision-Based Fringe Projection Measurement System for Radial Vibration Monitoring of Rotating Shafts. Mech. Syst. Sig. Process. 2022, 181, 109467. [Google Scholar] [CrossRef]


| SD of Noise/Gray Level | 1 | 2 | 3 | 4 | 5 | 6 | 7 | 8 | 9 | 10 |
|---|---|---|---|---|---|---|---|---|---|---|
| 2D-FFT/nm | 0.314 | 0.342 | 0.381 | 0.402 | 0.457 | 0.485 | 0.493 | 0.560 | 0.591 | 0.686 |
| 2D-WFT/nm | 0.291 | 0.320 | 0.351 | 0.376 | 0.414 | 0.420 | 0.442 | 0.469 | 0.495 | 0.574 |
| 2D-FWT/nm | 0.280 | 0.300 | 0.344 | 0.364 | 0.412 | 0.395 | 0.428 | 0.436 | 0.464 | 0.531 |
| Original Experiment | Sensitivity Comparison Experiment | |||||
|---|---|---|---|---|---|---|
| Max Error | Mean Error | Std Error | Max Error | Mean Error | Std Error | |
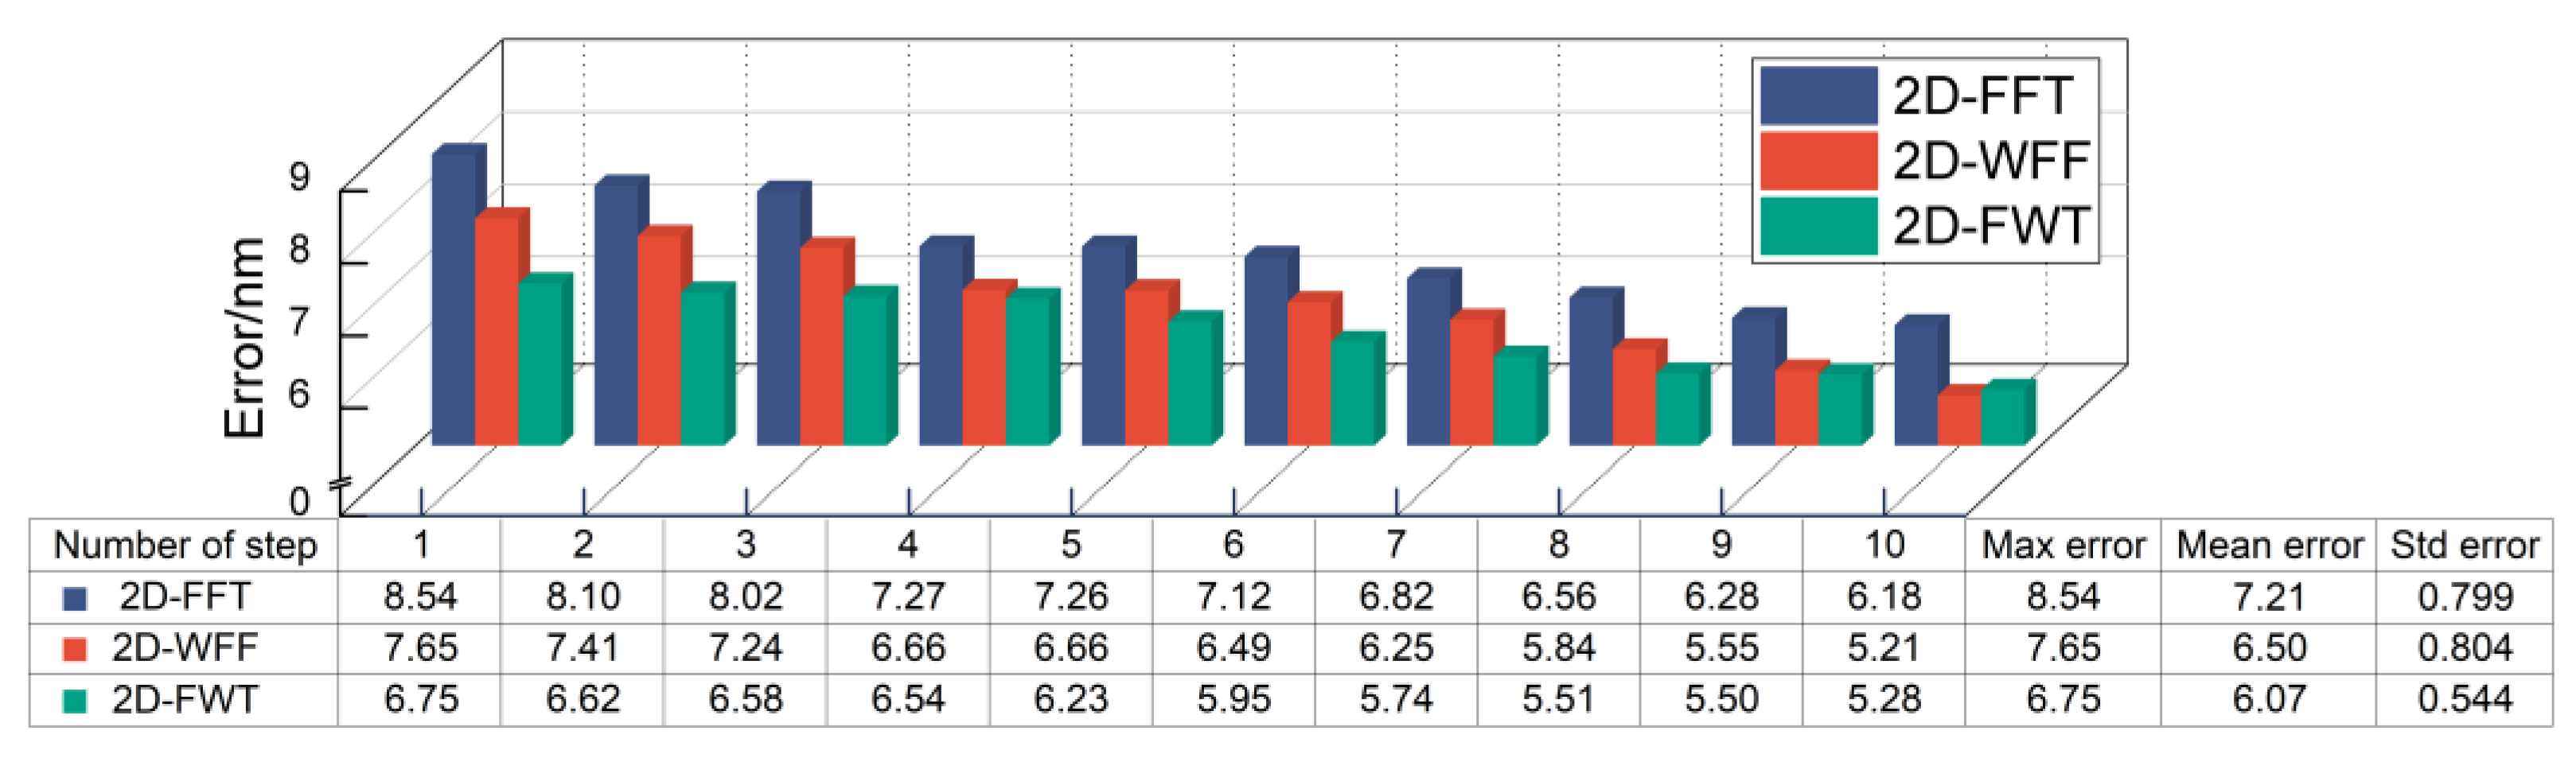
| 2D-FFT | 8.54 | 7.21 | 0.799 | 9.31 | 8.32 | 0.973 |
| 2D-WFT | 7.65 | 6.50 | 0.804 | 8.74 | 7.76 | 1.034 |
| 2D-FWT | 6.75 | 6.07 | 0.544 | 7.83 | 7.34 | 0.713 |
| Source of Uncertainty | |||
|---|---|---|---|
| Grating period | 1 × 10⁻⁷ | ||
| Grating surface quality | 1 × 10⁻⁶ | ||
| Grating line shape | 1 × 10⁻⁷ | ||
| Grating etching depth | 1 × 10⁻⁶ | ||
| Equipment stability | 1 × 10⁻⁶ | ||
| Grating manufacturing process | 1 × 10⁻⁶ | ||
| Temperature variation | 1 × 10⁻⁵ | ||
| Mechanical vibrations | 1 × 10⁻⁵ | ||
| Air turbulence | 1 × 10⁻⁶ | ||
| Electromagnetic interference | 1 × 10⁻⁵ | ||
| Light stability | 1 × 10⁻³ | ||
| Optical component quality | 1 × 10⁻³ | ||
| PZT jitter | 1 × 10⁻² | ||
| Combined uncertainty | |||
Disclaimer/Publisher’s Note: The statements, opinions and data contained in all publications are solely those of the individual author(s) and contributor(s) and not of MDPI and/or the editor(s). MDPI and/or the editor(s) disclaim responsibility for any injury to people or property resulting from any ideas, methods, instructions or products referred to in the content. |
© 2024 by the authors. Licensee MDPI, Basel, Switzerland. This article is an open access article distributed under the terms and conditions of the Creative Commons Attribution (CC BY) license (https://creativecommons.org/licenses/by/4.0/).
Share and Cite
Xu, F.; Ding, Y.; Chen, W.; Xia, H. An Improved Algorithm to Extract Moiré Fringe Phase for Wafer-Mask Alignment in Nanoimprint Lithography. Micromachines 2024, 15, 1408. https://doi.org/10.3390/mi15121408
Xu F, Ding Y, Chen W, Xia H. An Improved Algorithm to Extract Moiré Fringe Phase for Wafer-Mask Alignment in Nanoimprint Lithography. Micromachines. 2024; 15(12):1408. https://doi.org/10.3390/mi15121408
Chicago/Turabian StyleXu, Feifan, Yinye Ding, Wenhao Chen, and Haojie Xia. 2024. "An Improved Algorithm to Extract Moiré Fringe Phase for Wafer-Mask Alignment in Nanoimprint Lithography" Micromachines 15, no. 12: 1408. https://doi.org/10.3390/mi15121408
APA StyleXu, F., Ding, Y., Chen, W., & Xia, H. (2024). An Improved Algorithm to Extract Moiré Fringe Phase for Wafer-Mask Alignment in Nanoimprint Lithography. Micromachines, 15(12), 1408. https://doi.org/10.3390/mi15121408