

Photoplethysmography-Based Distance Estimation for True Wireless Stereo


Abstract
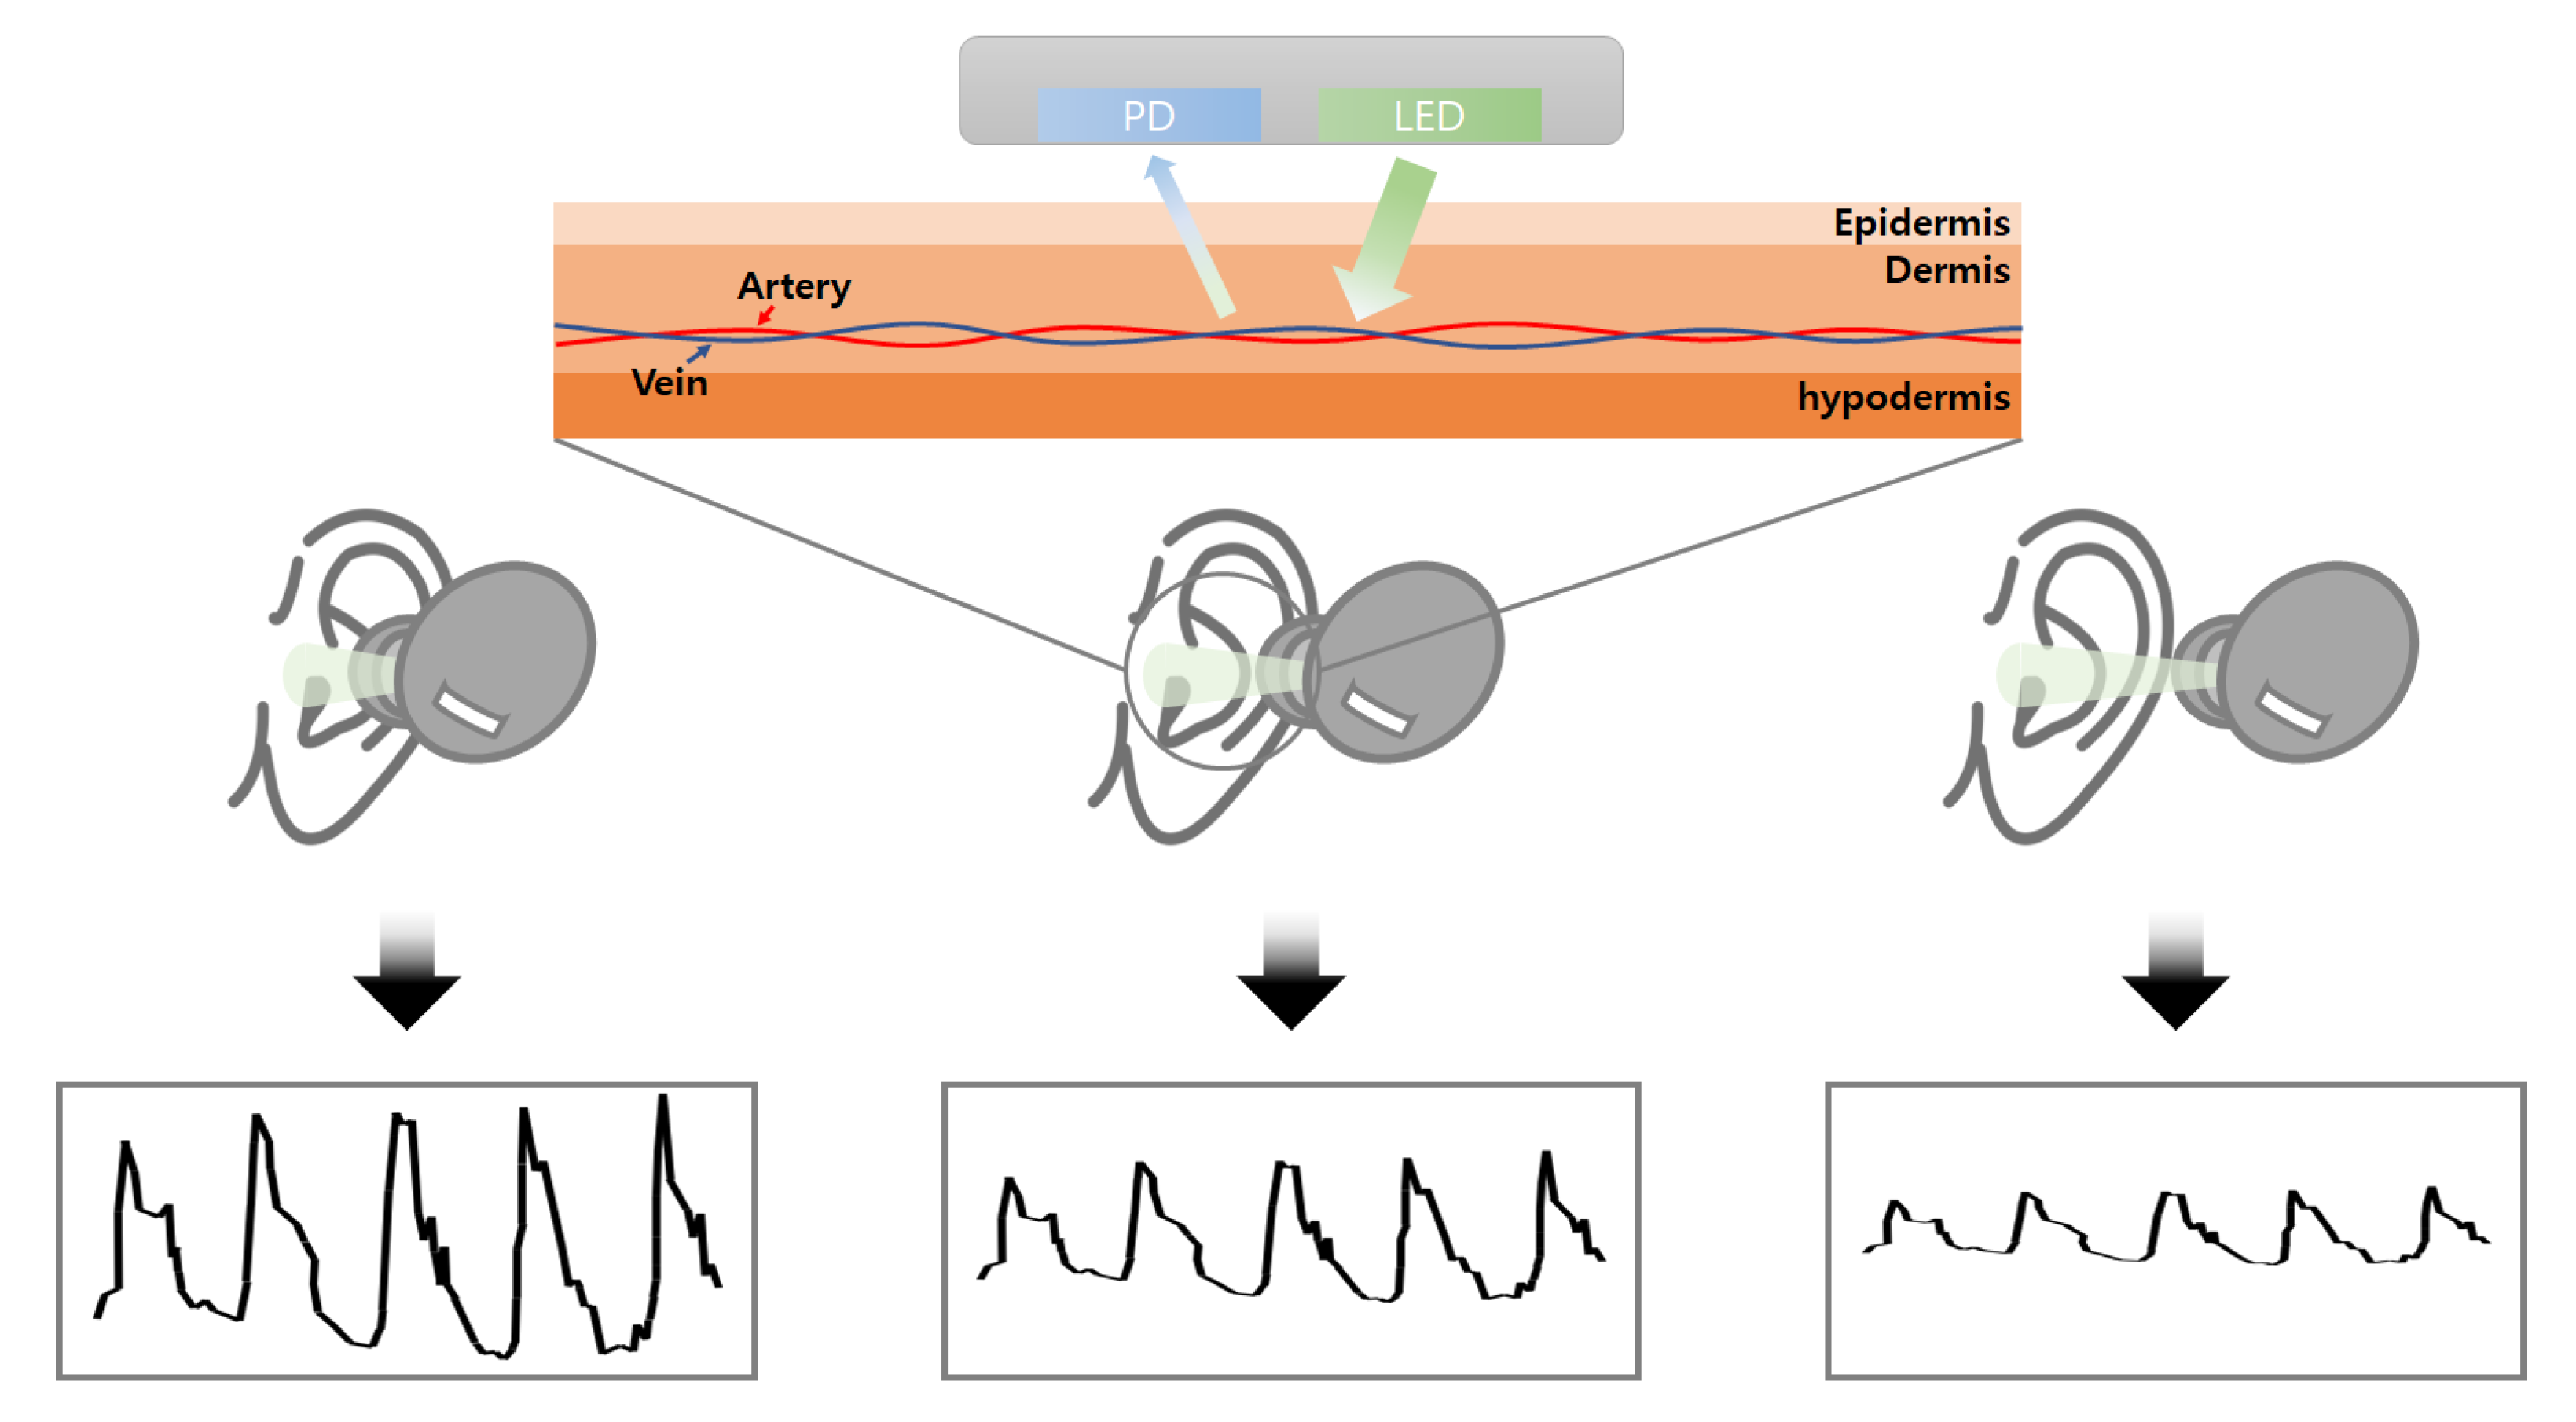
1. Introduction
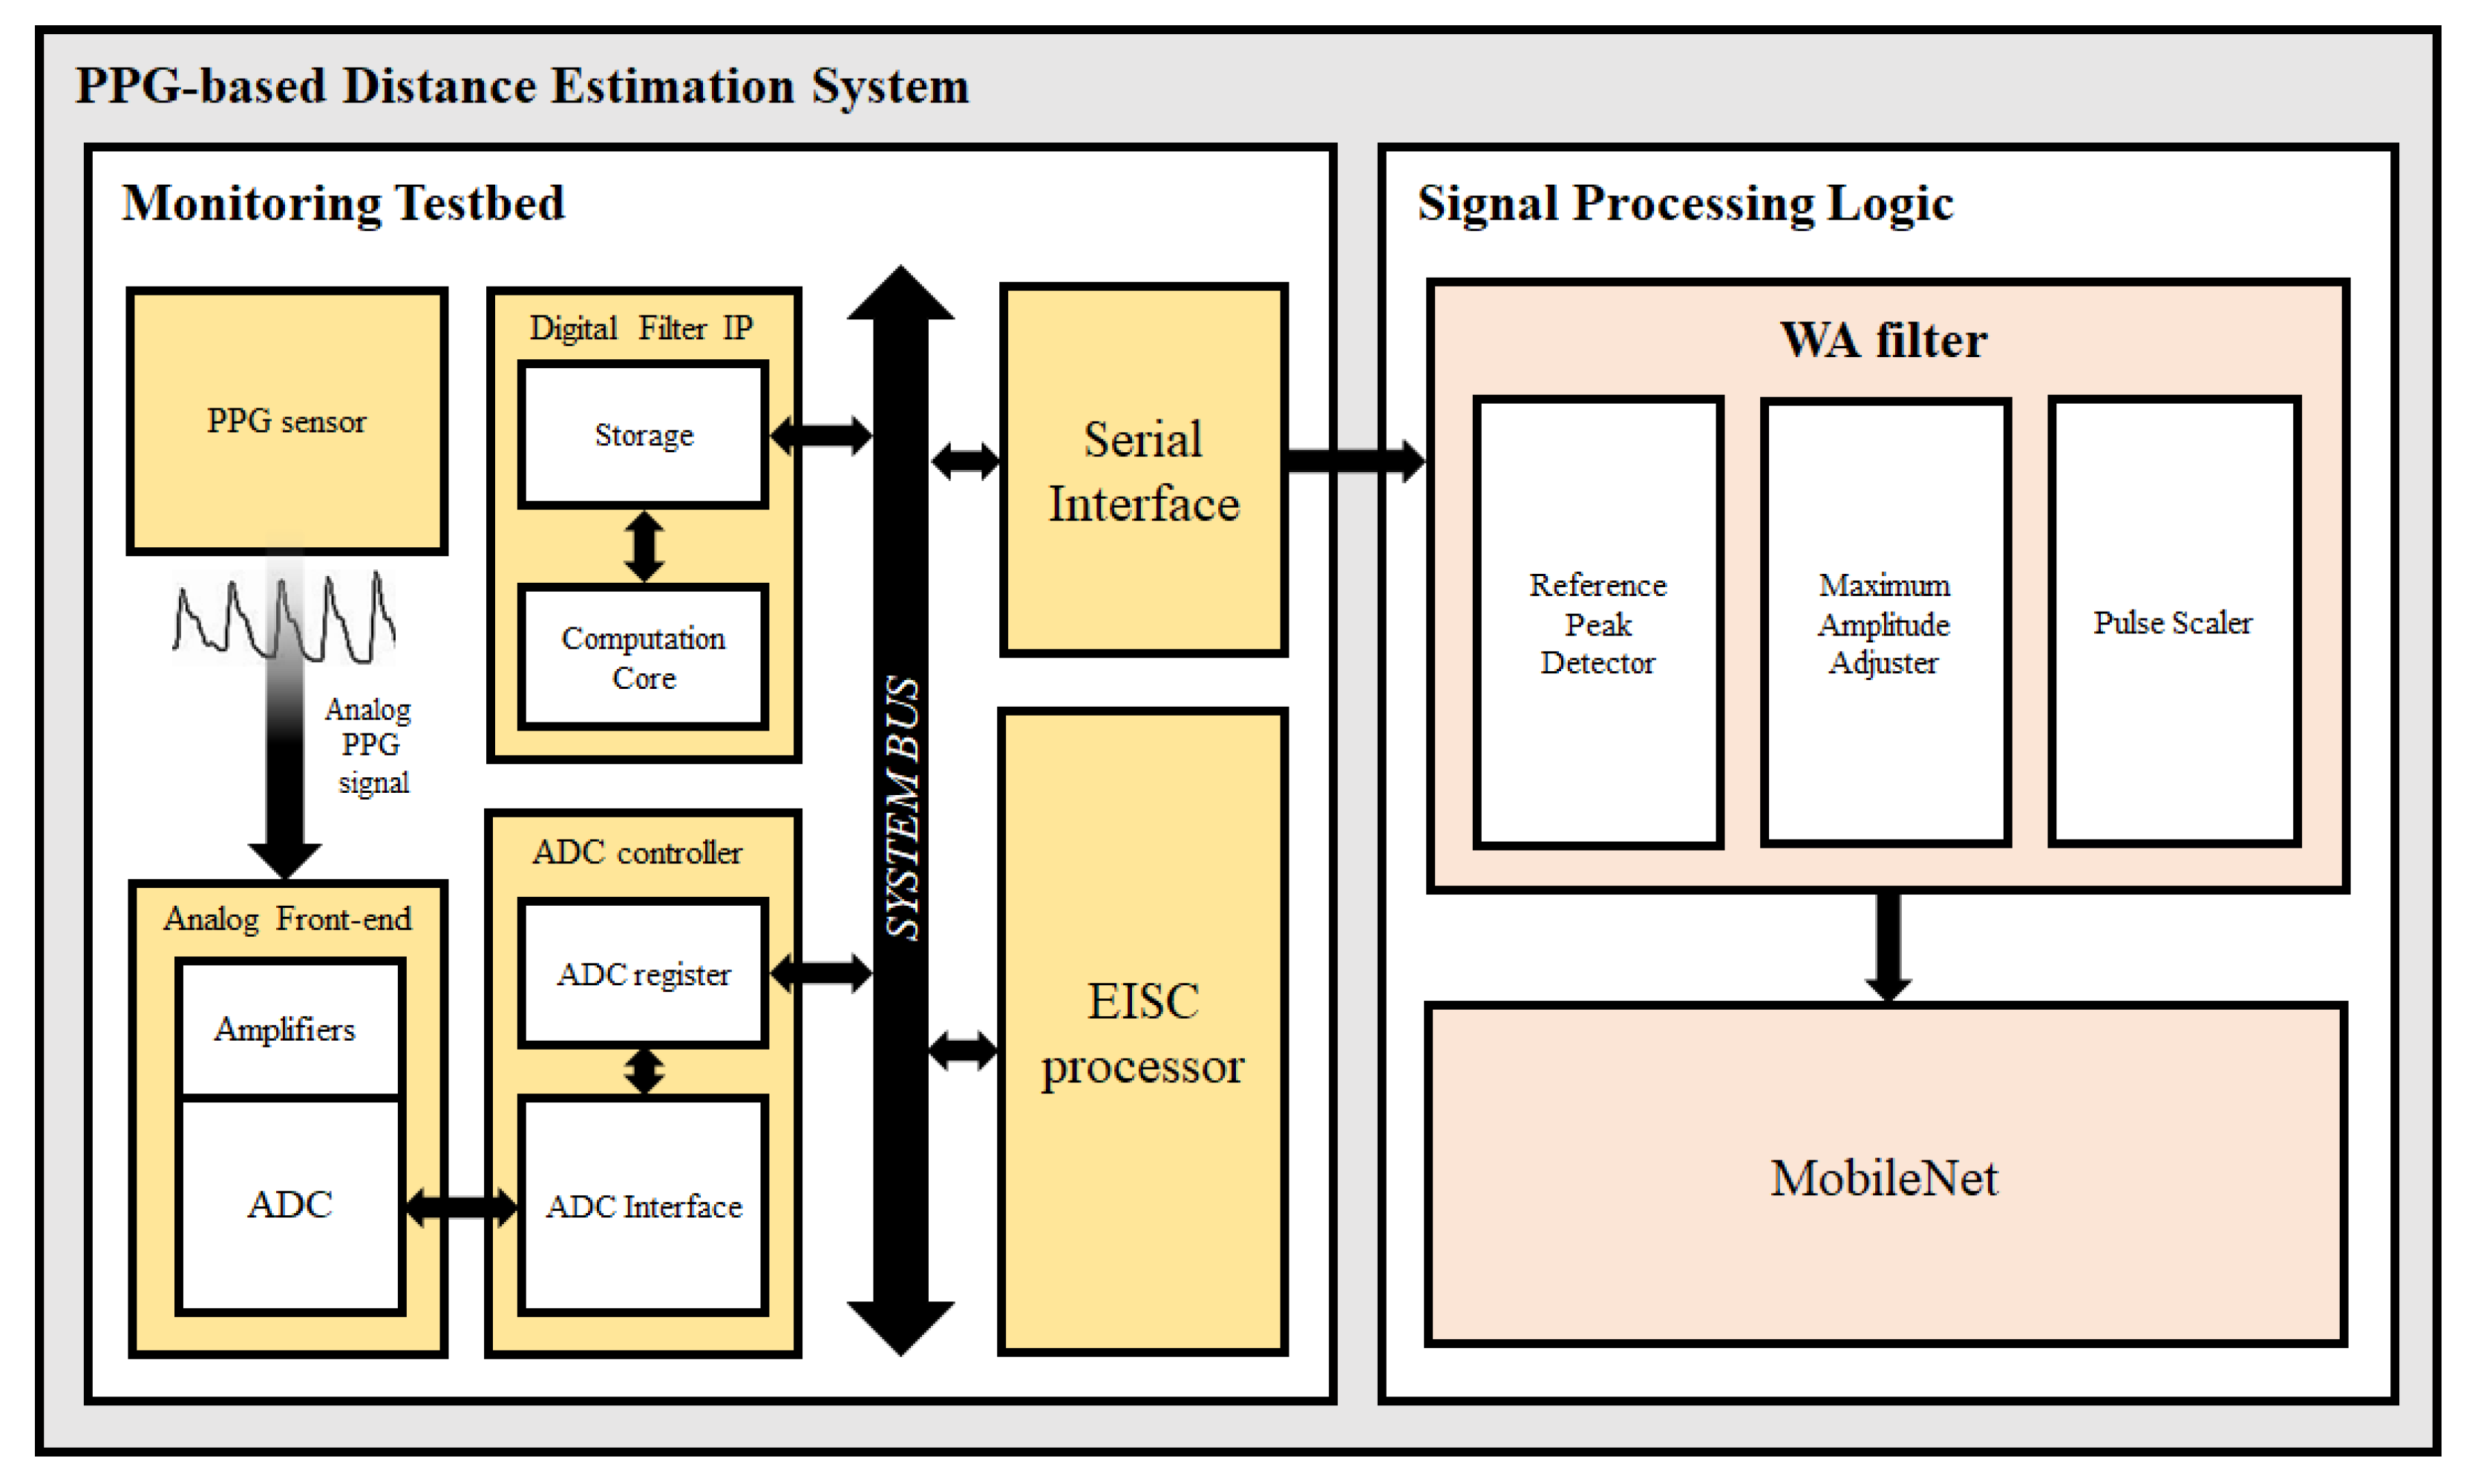
2. System Architecture
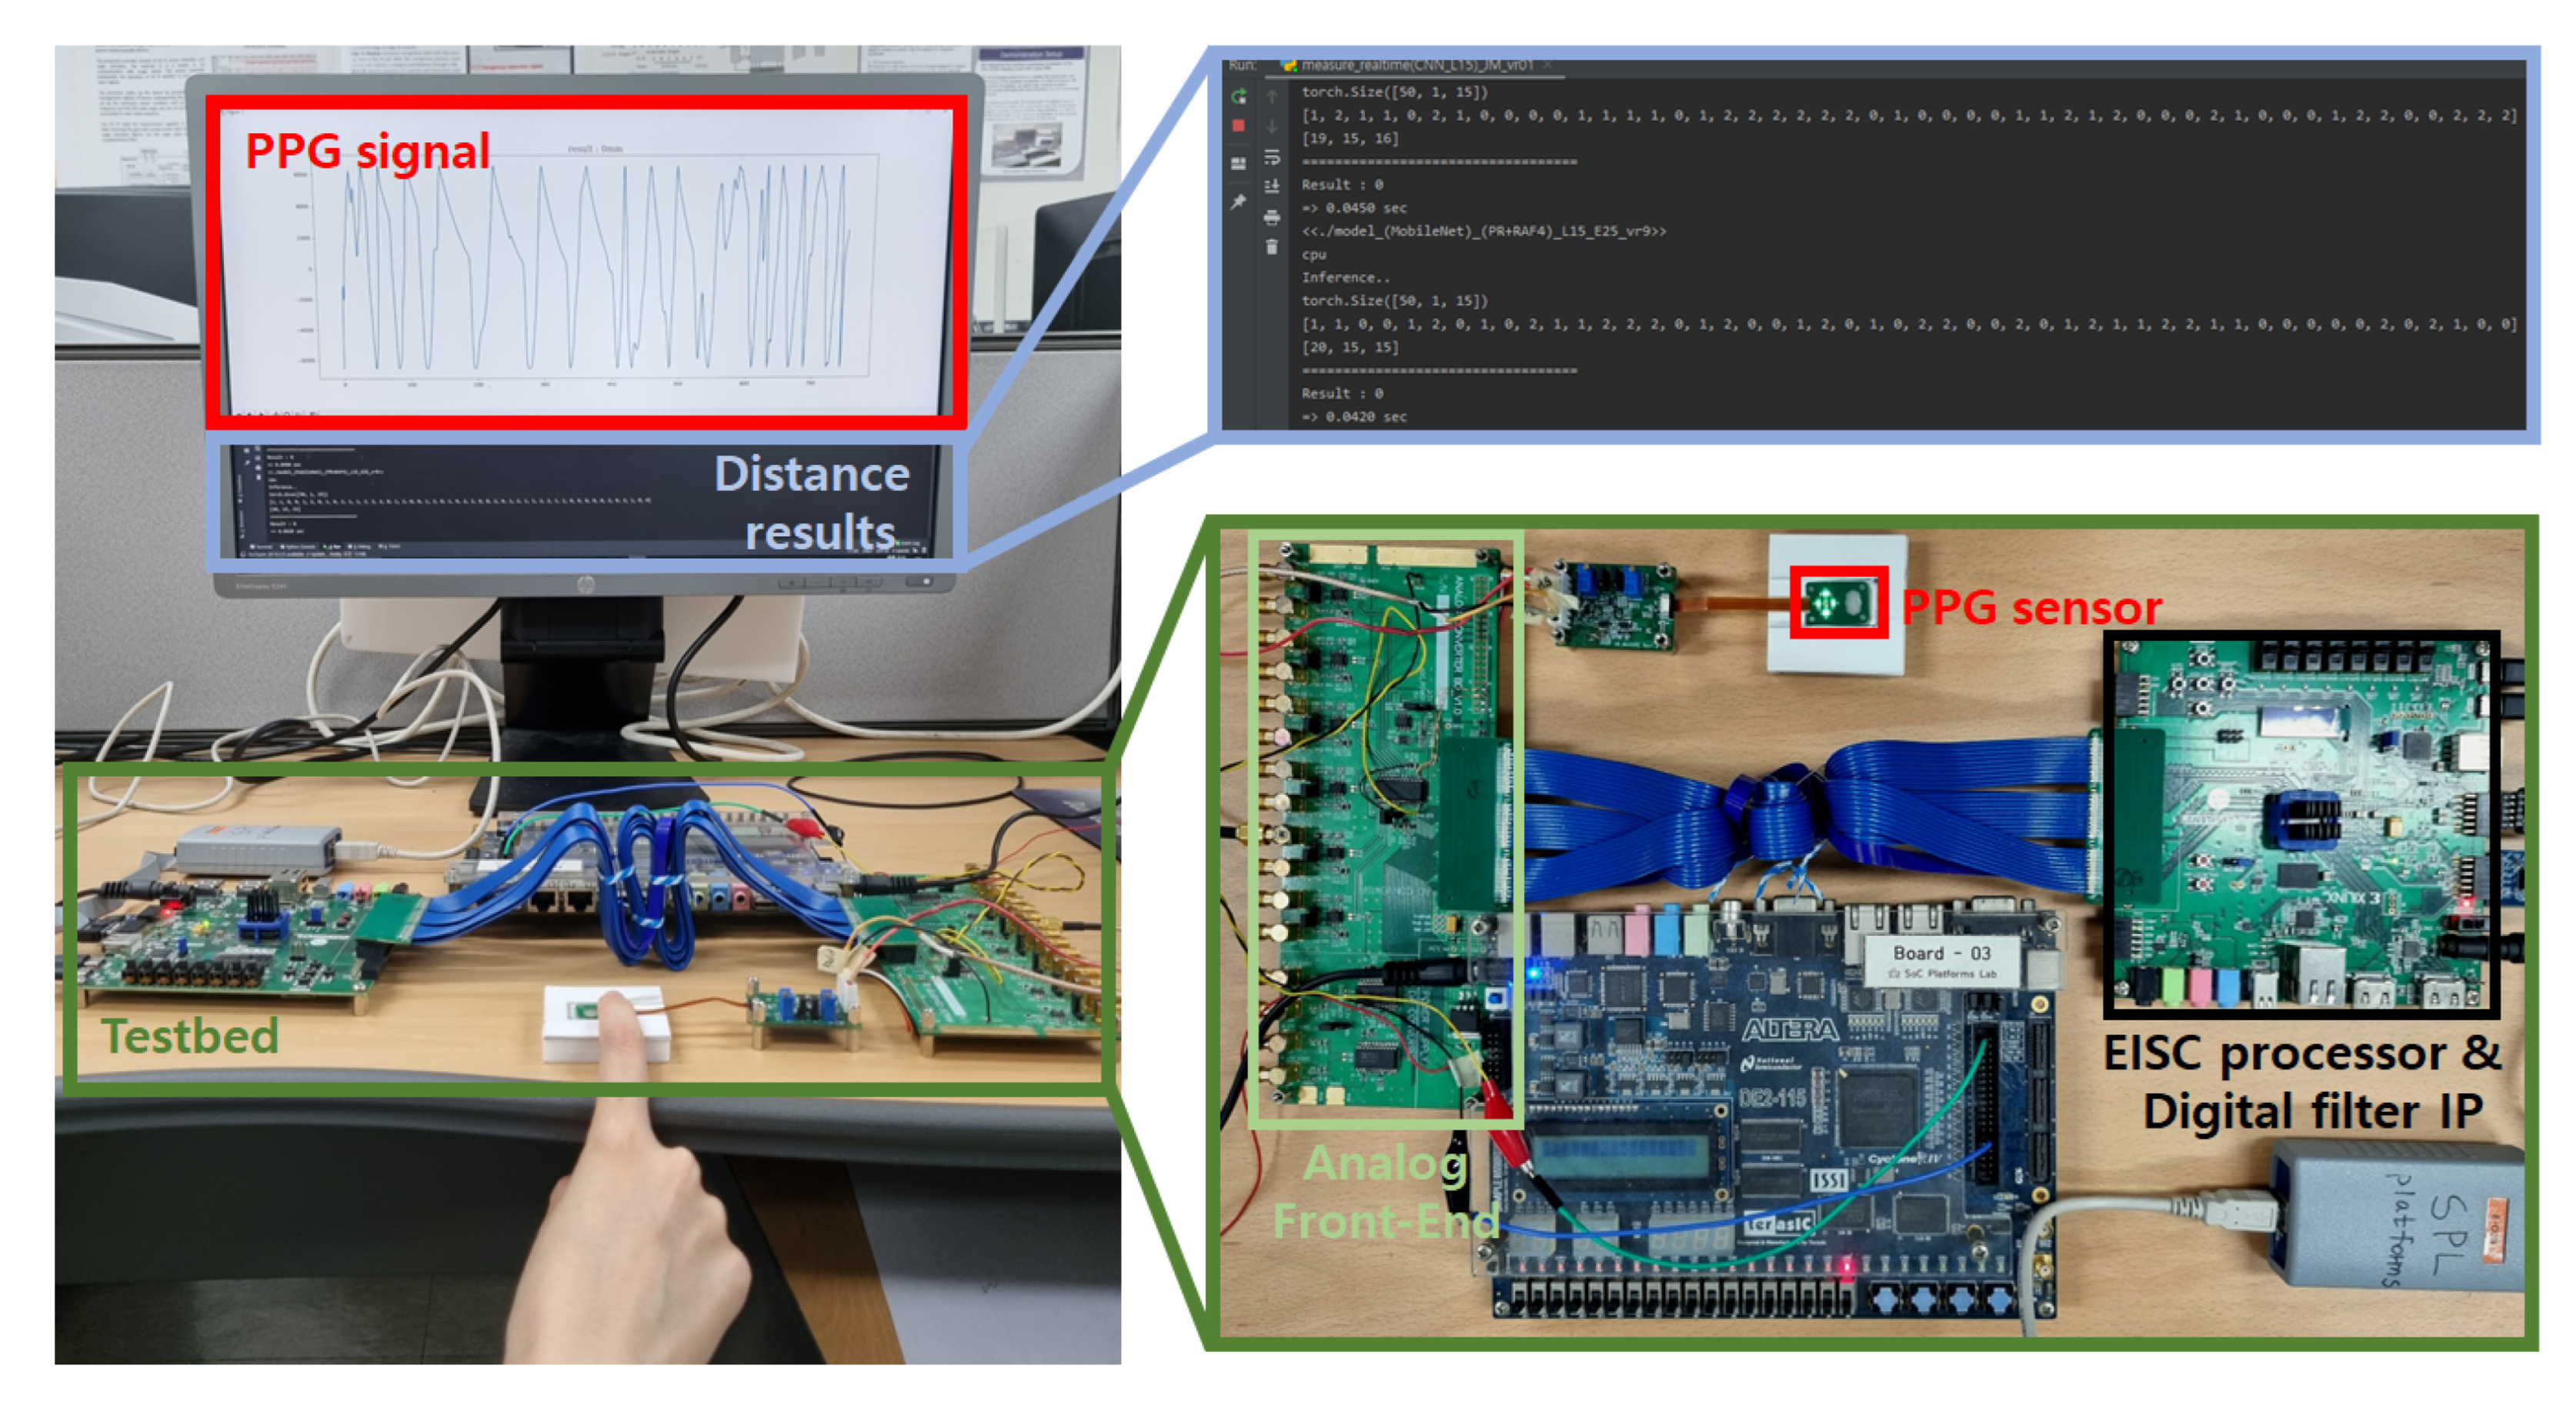
2.1. PPG Monitoring Testbed
2.2. Signal Processing Logic
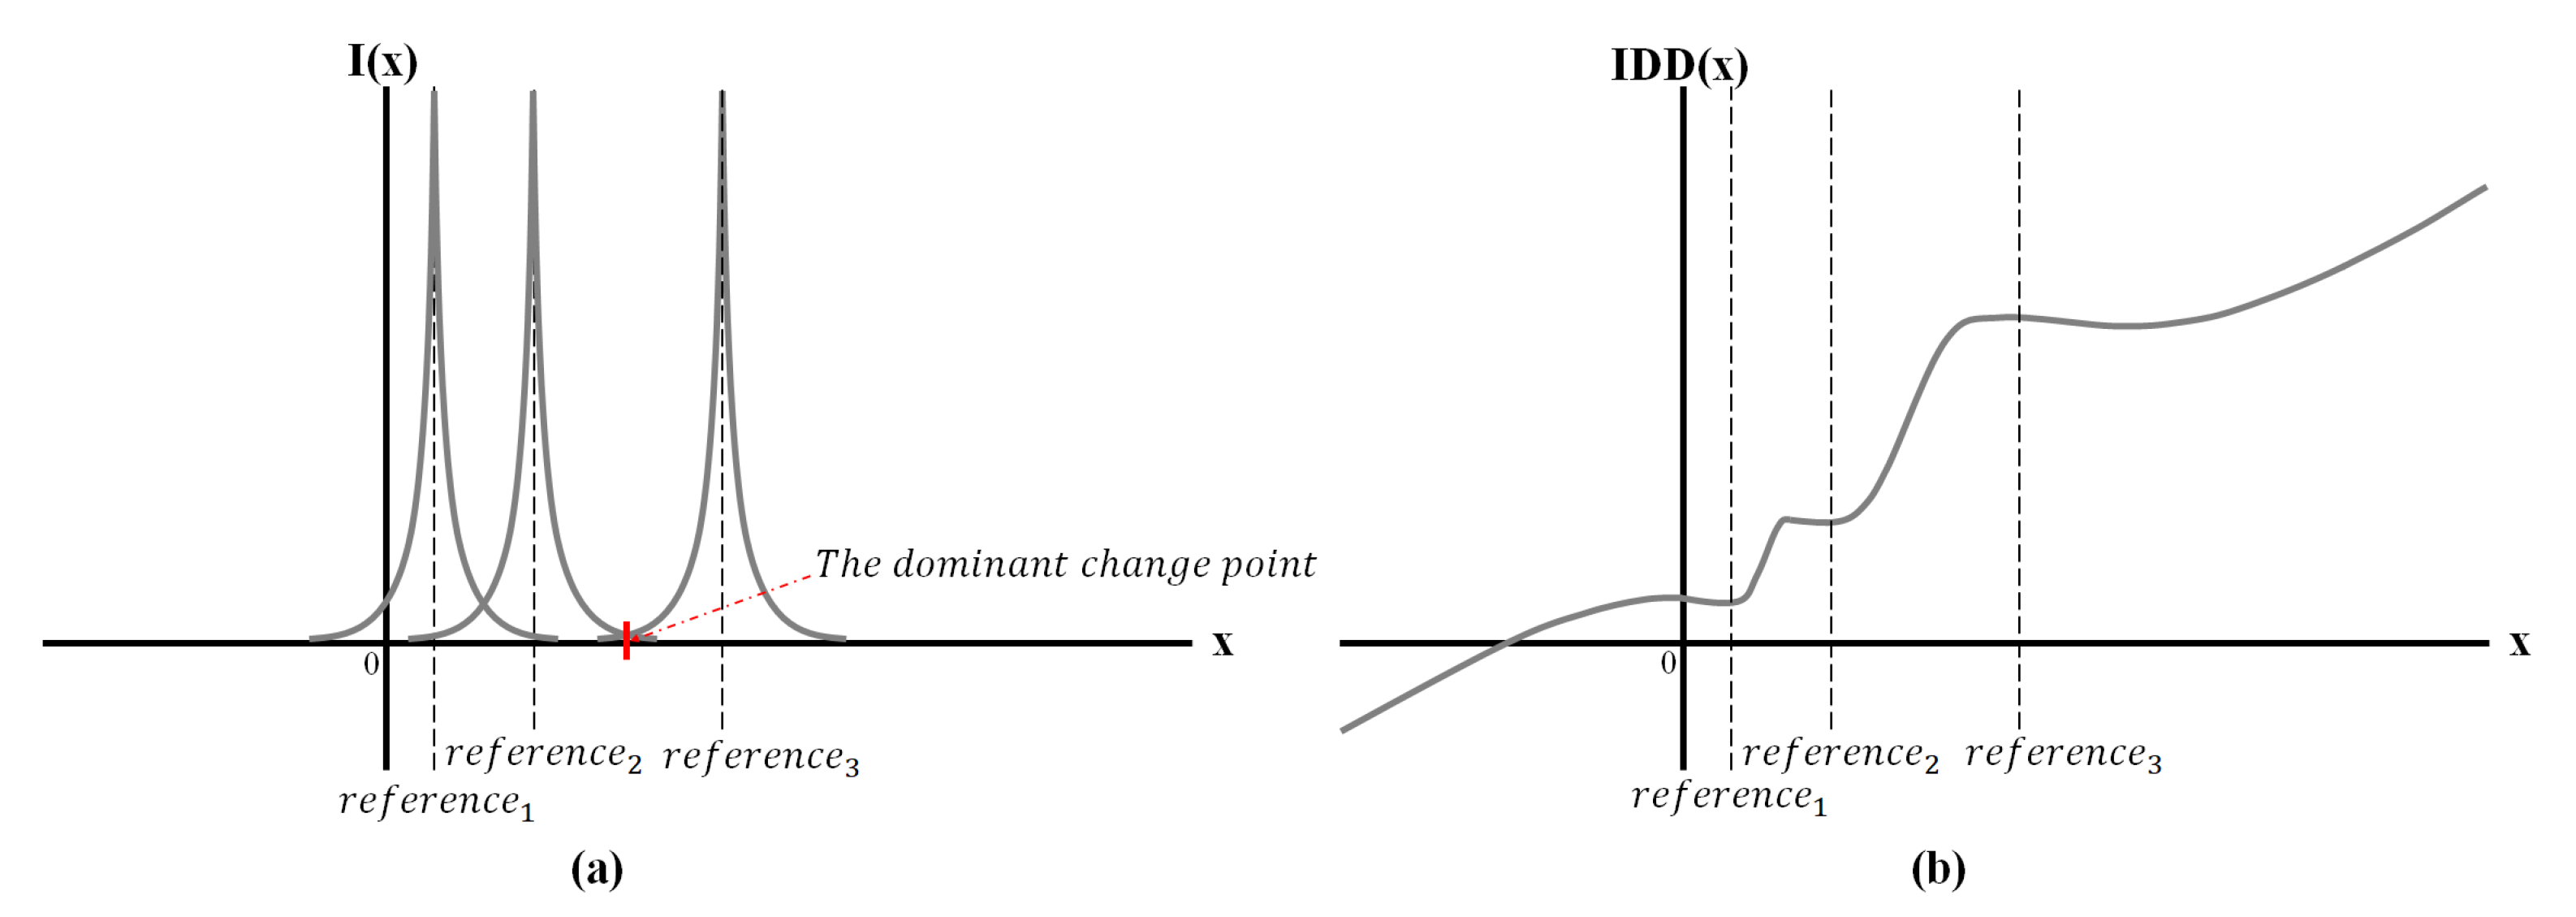
2.2.1. Influence Differential Distribution (IDD) Function
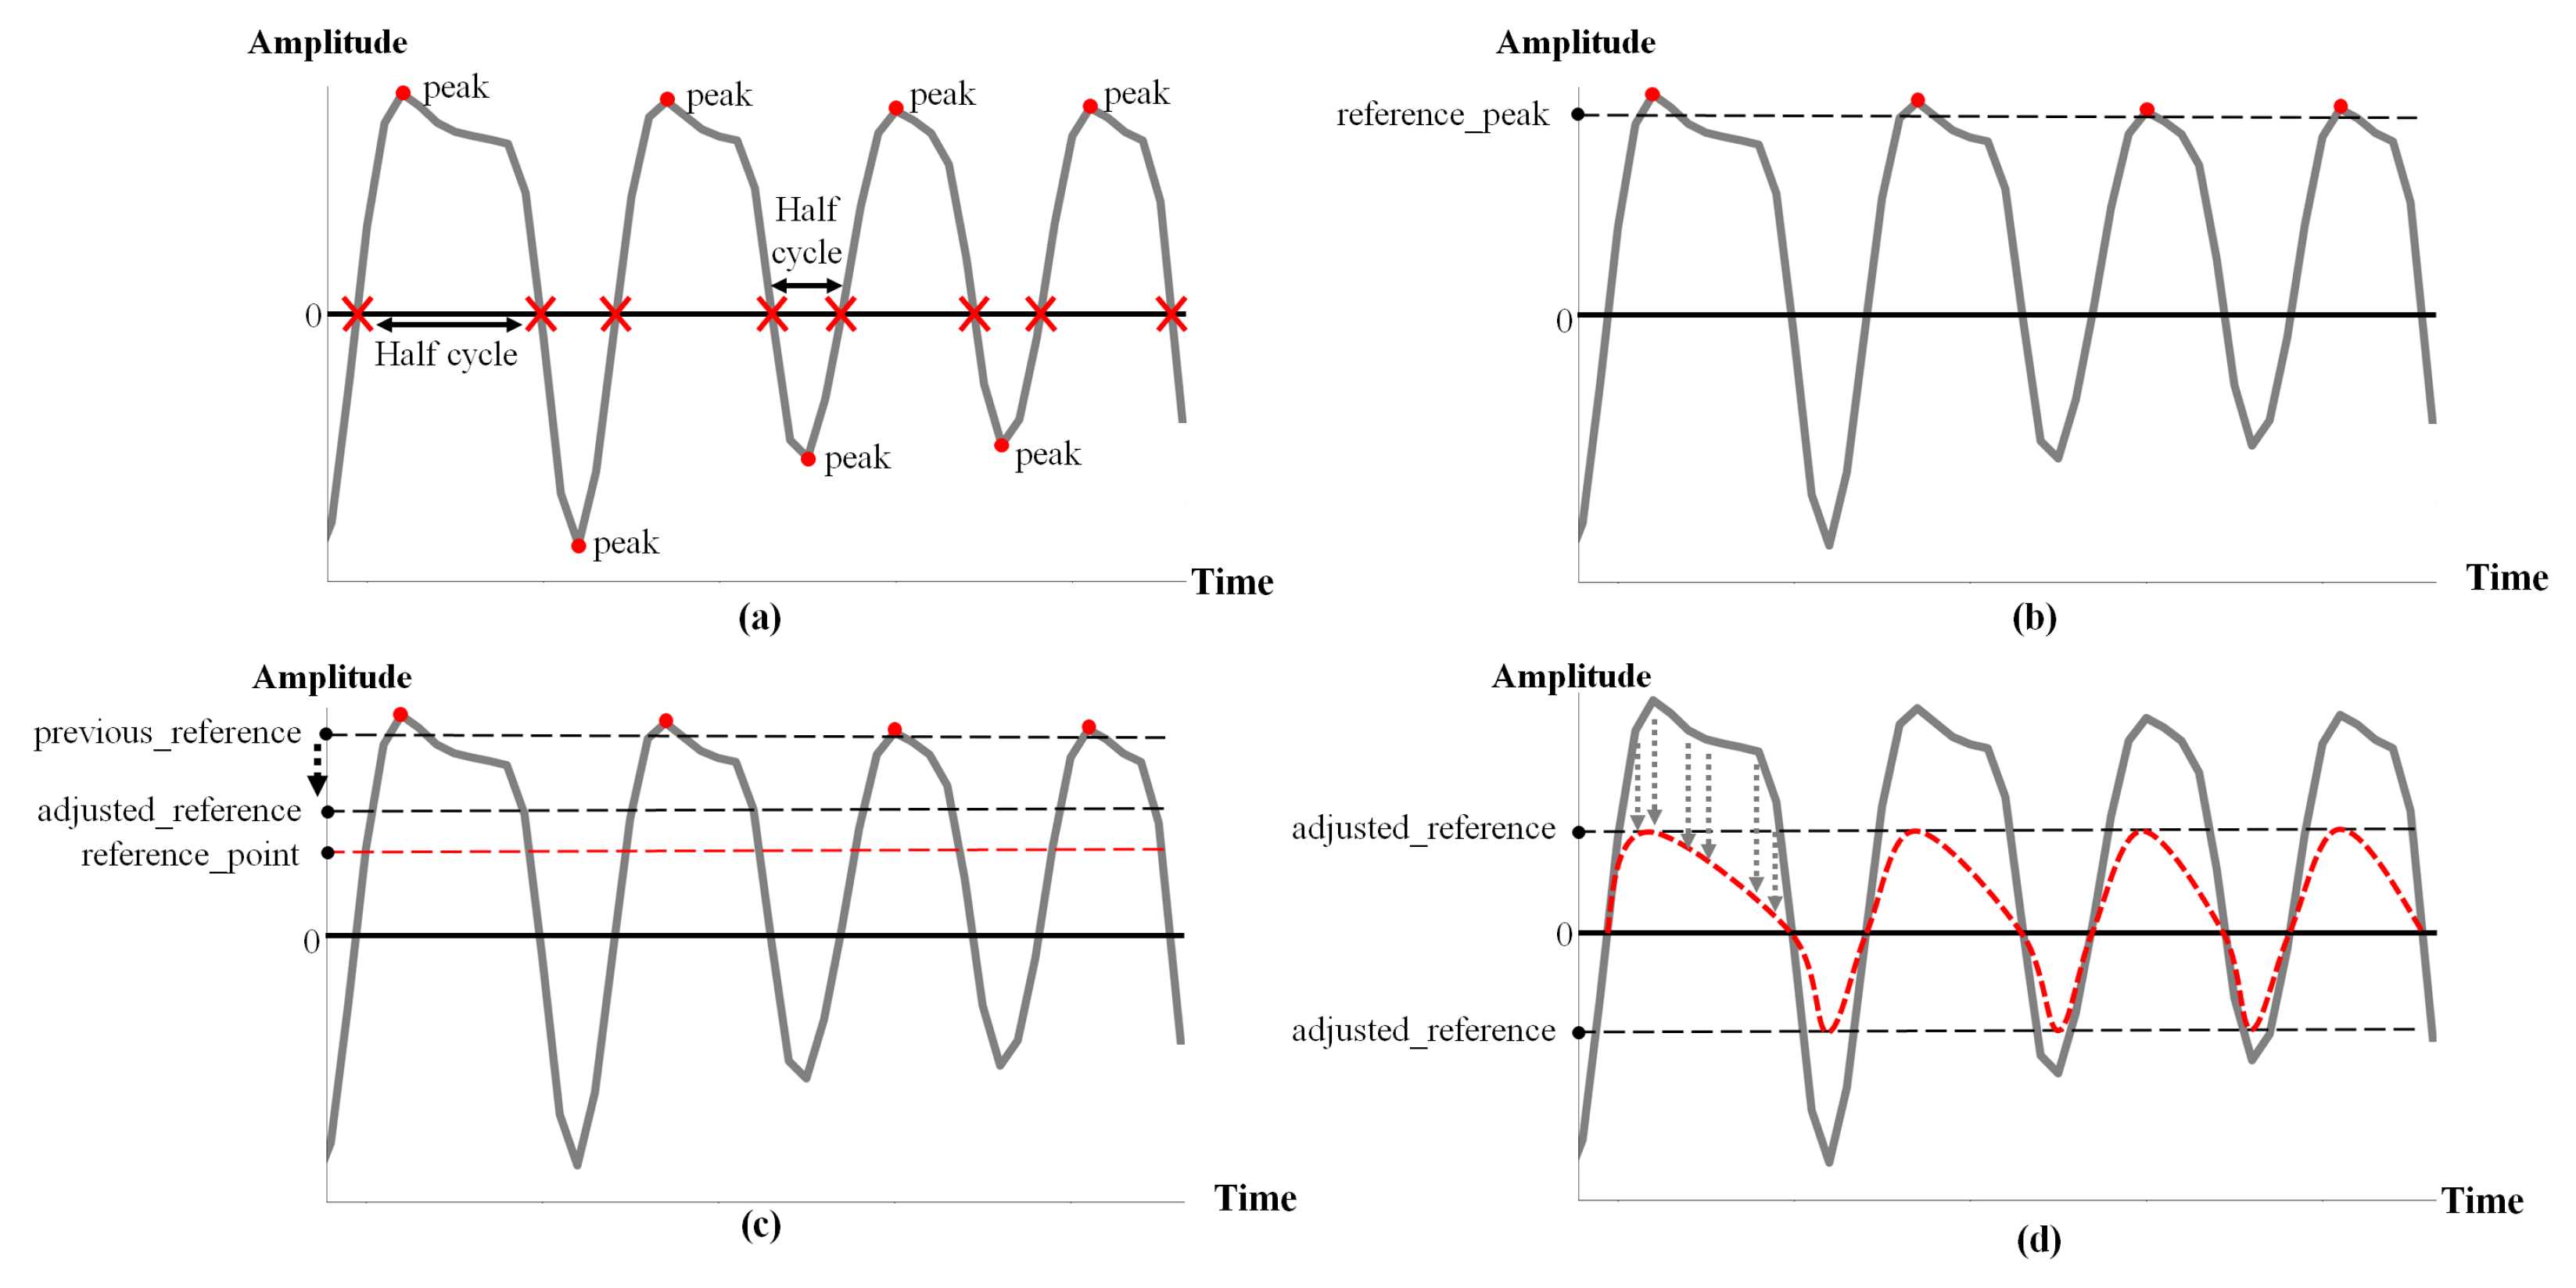
2.2.2. WA Filter
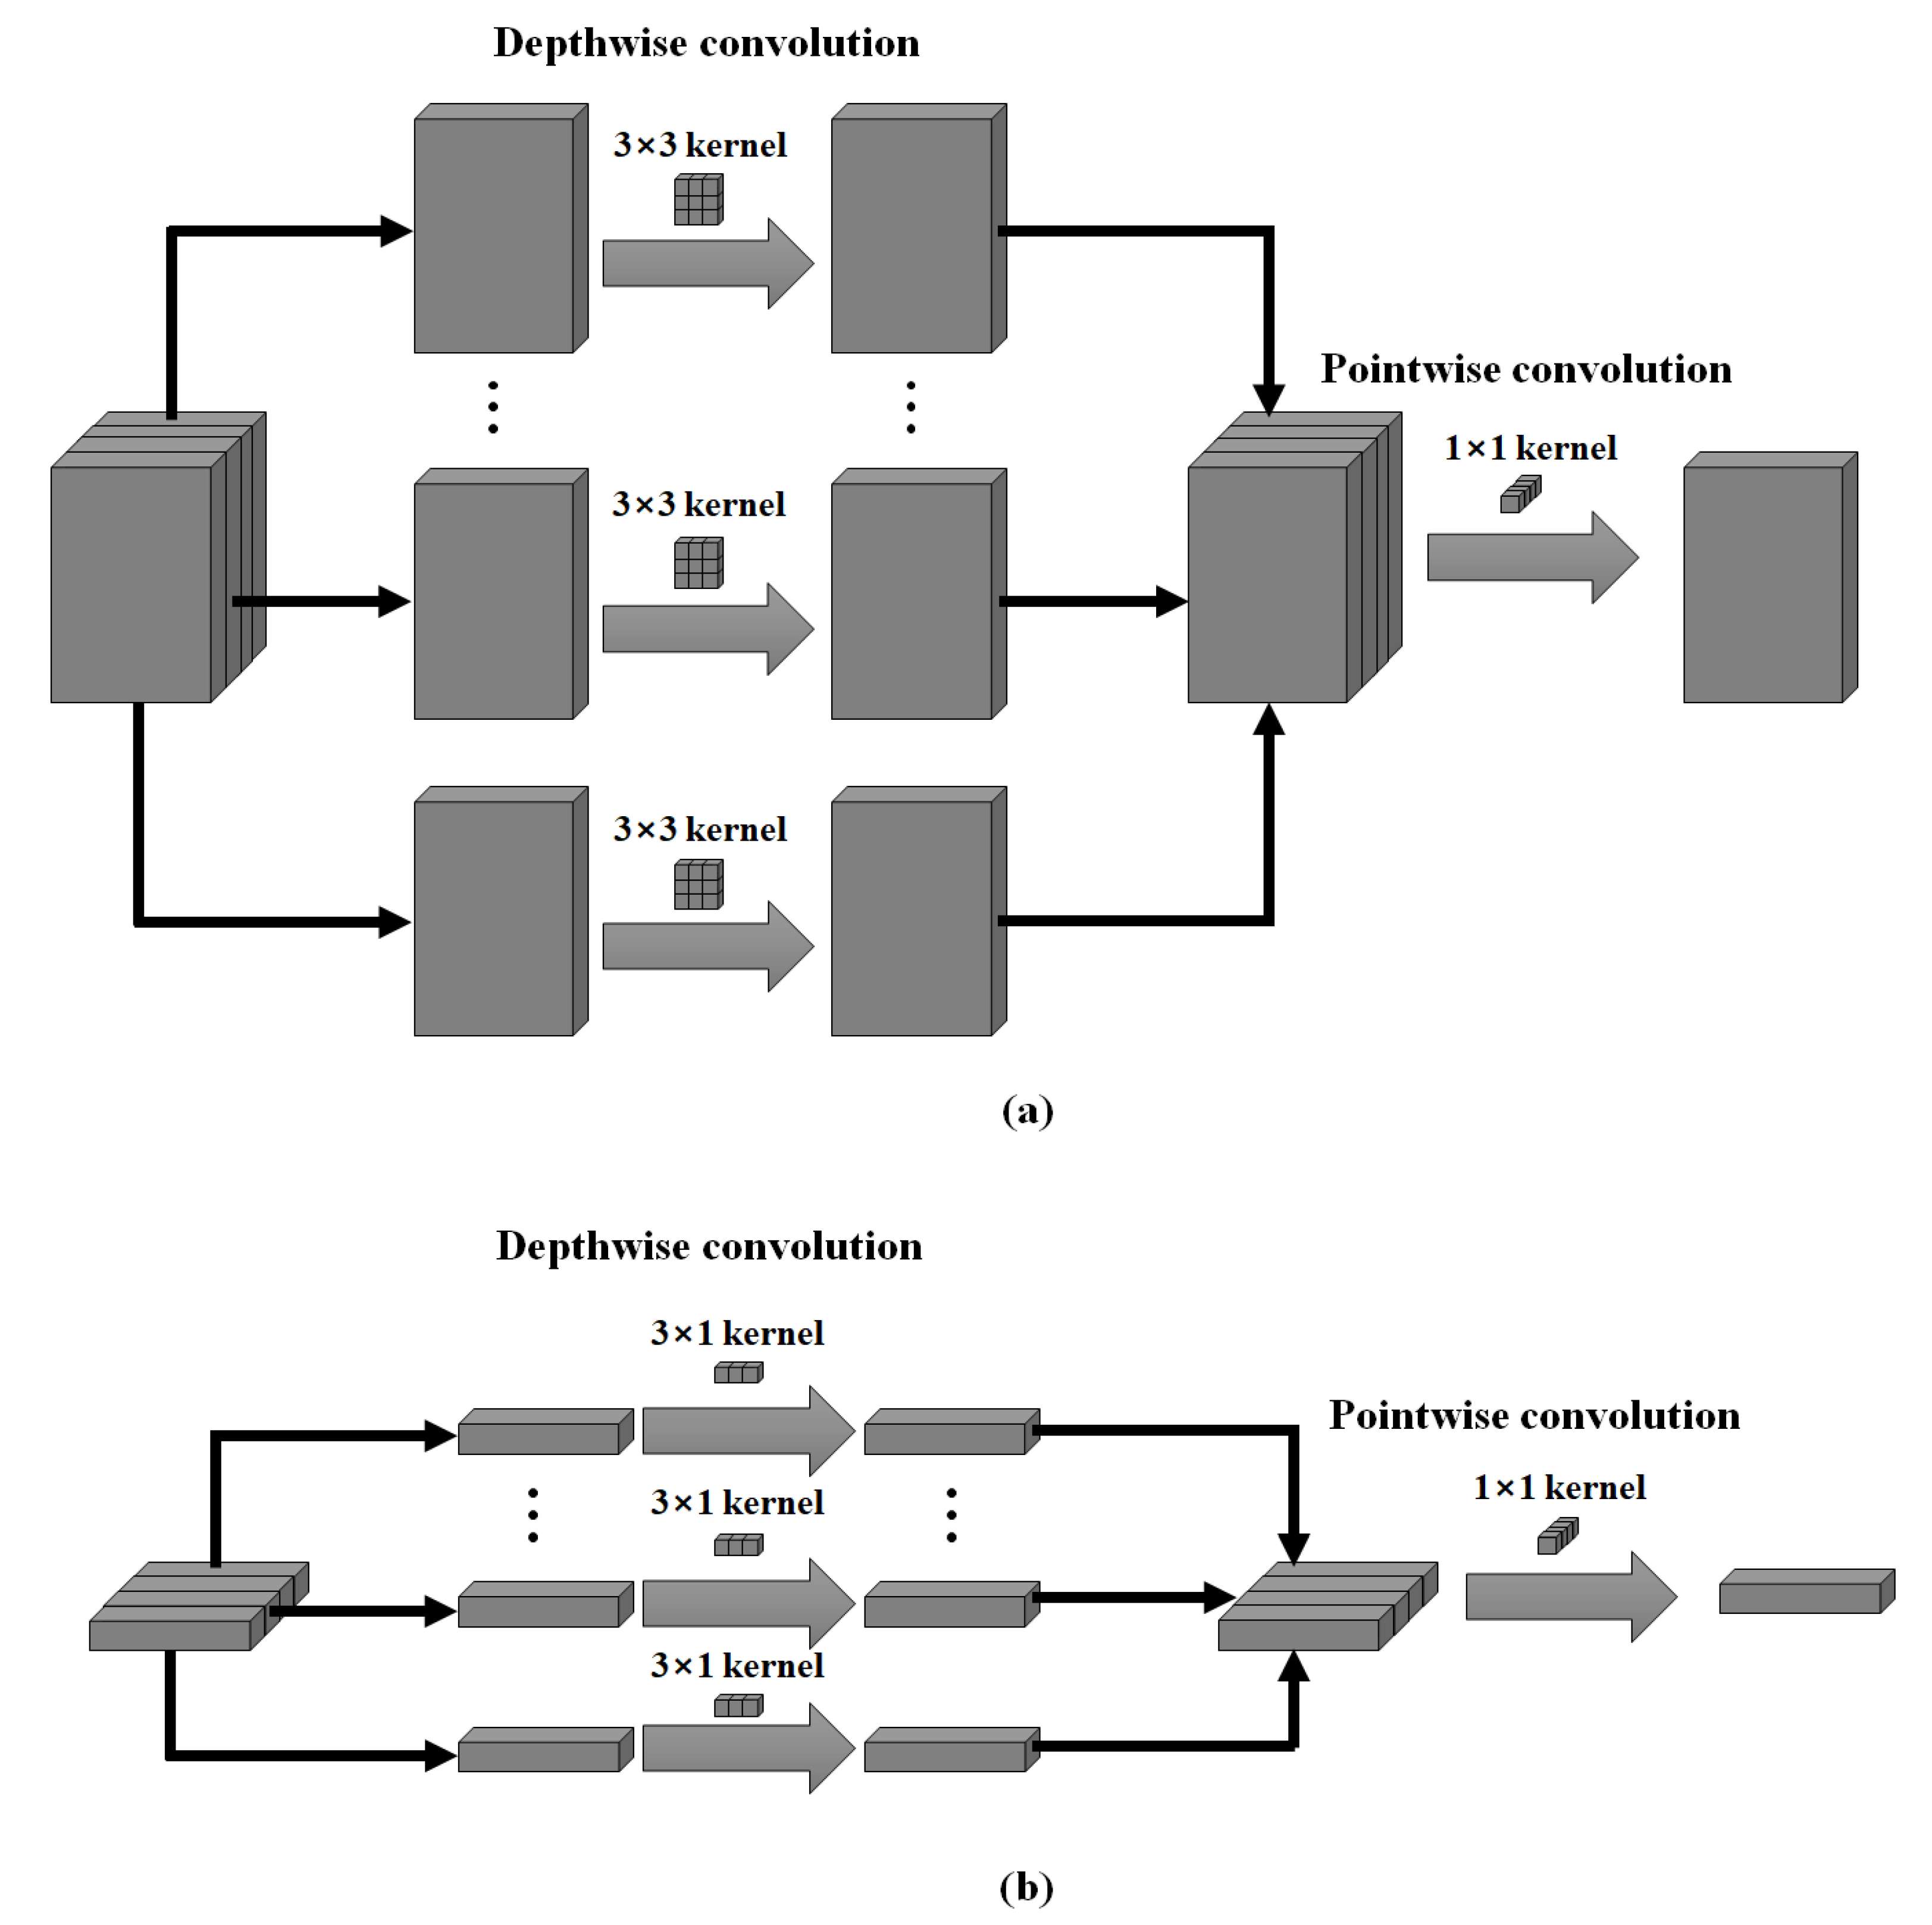
2.2.3. MobileNet
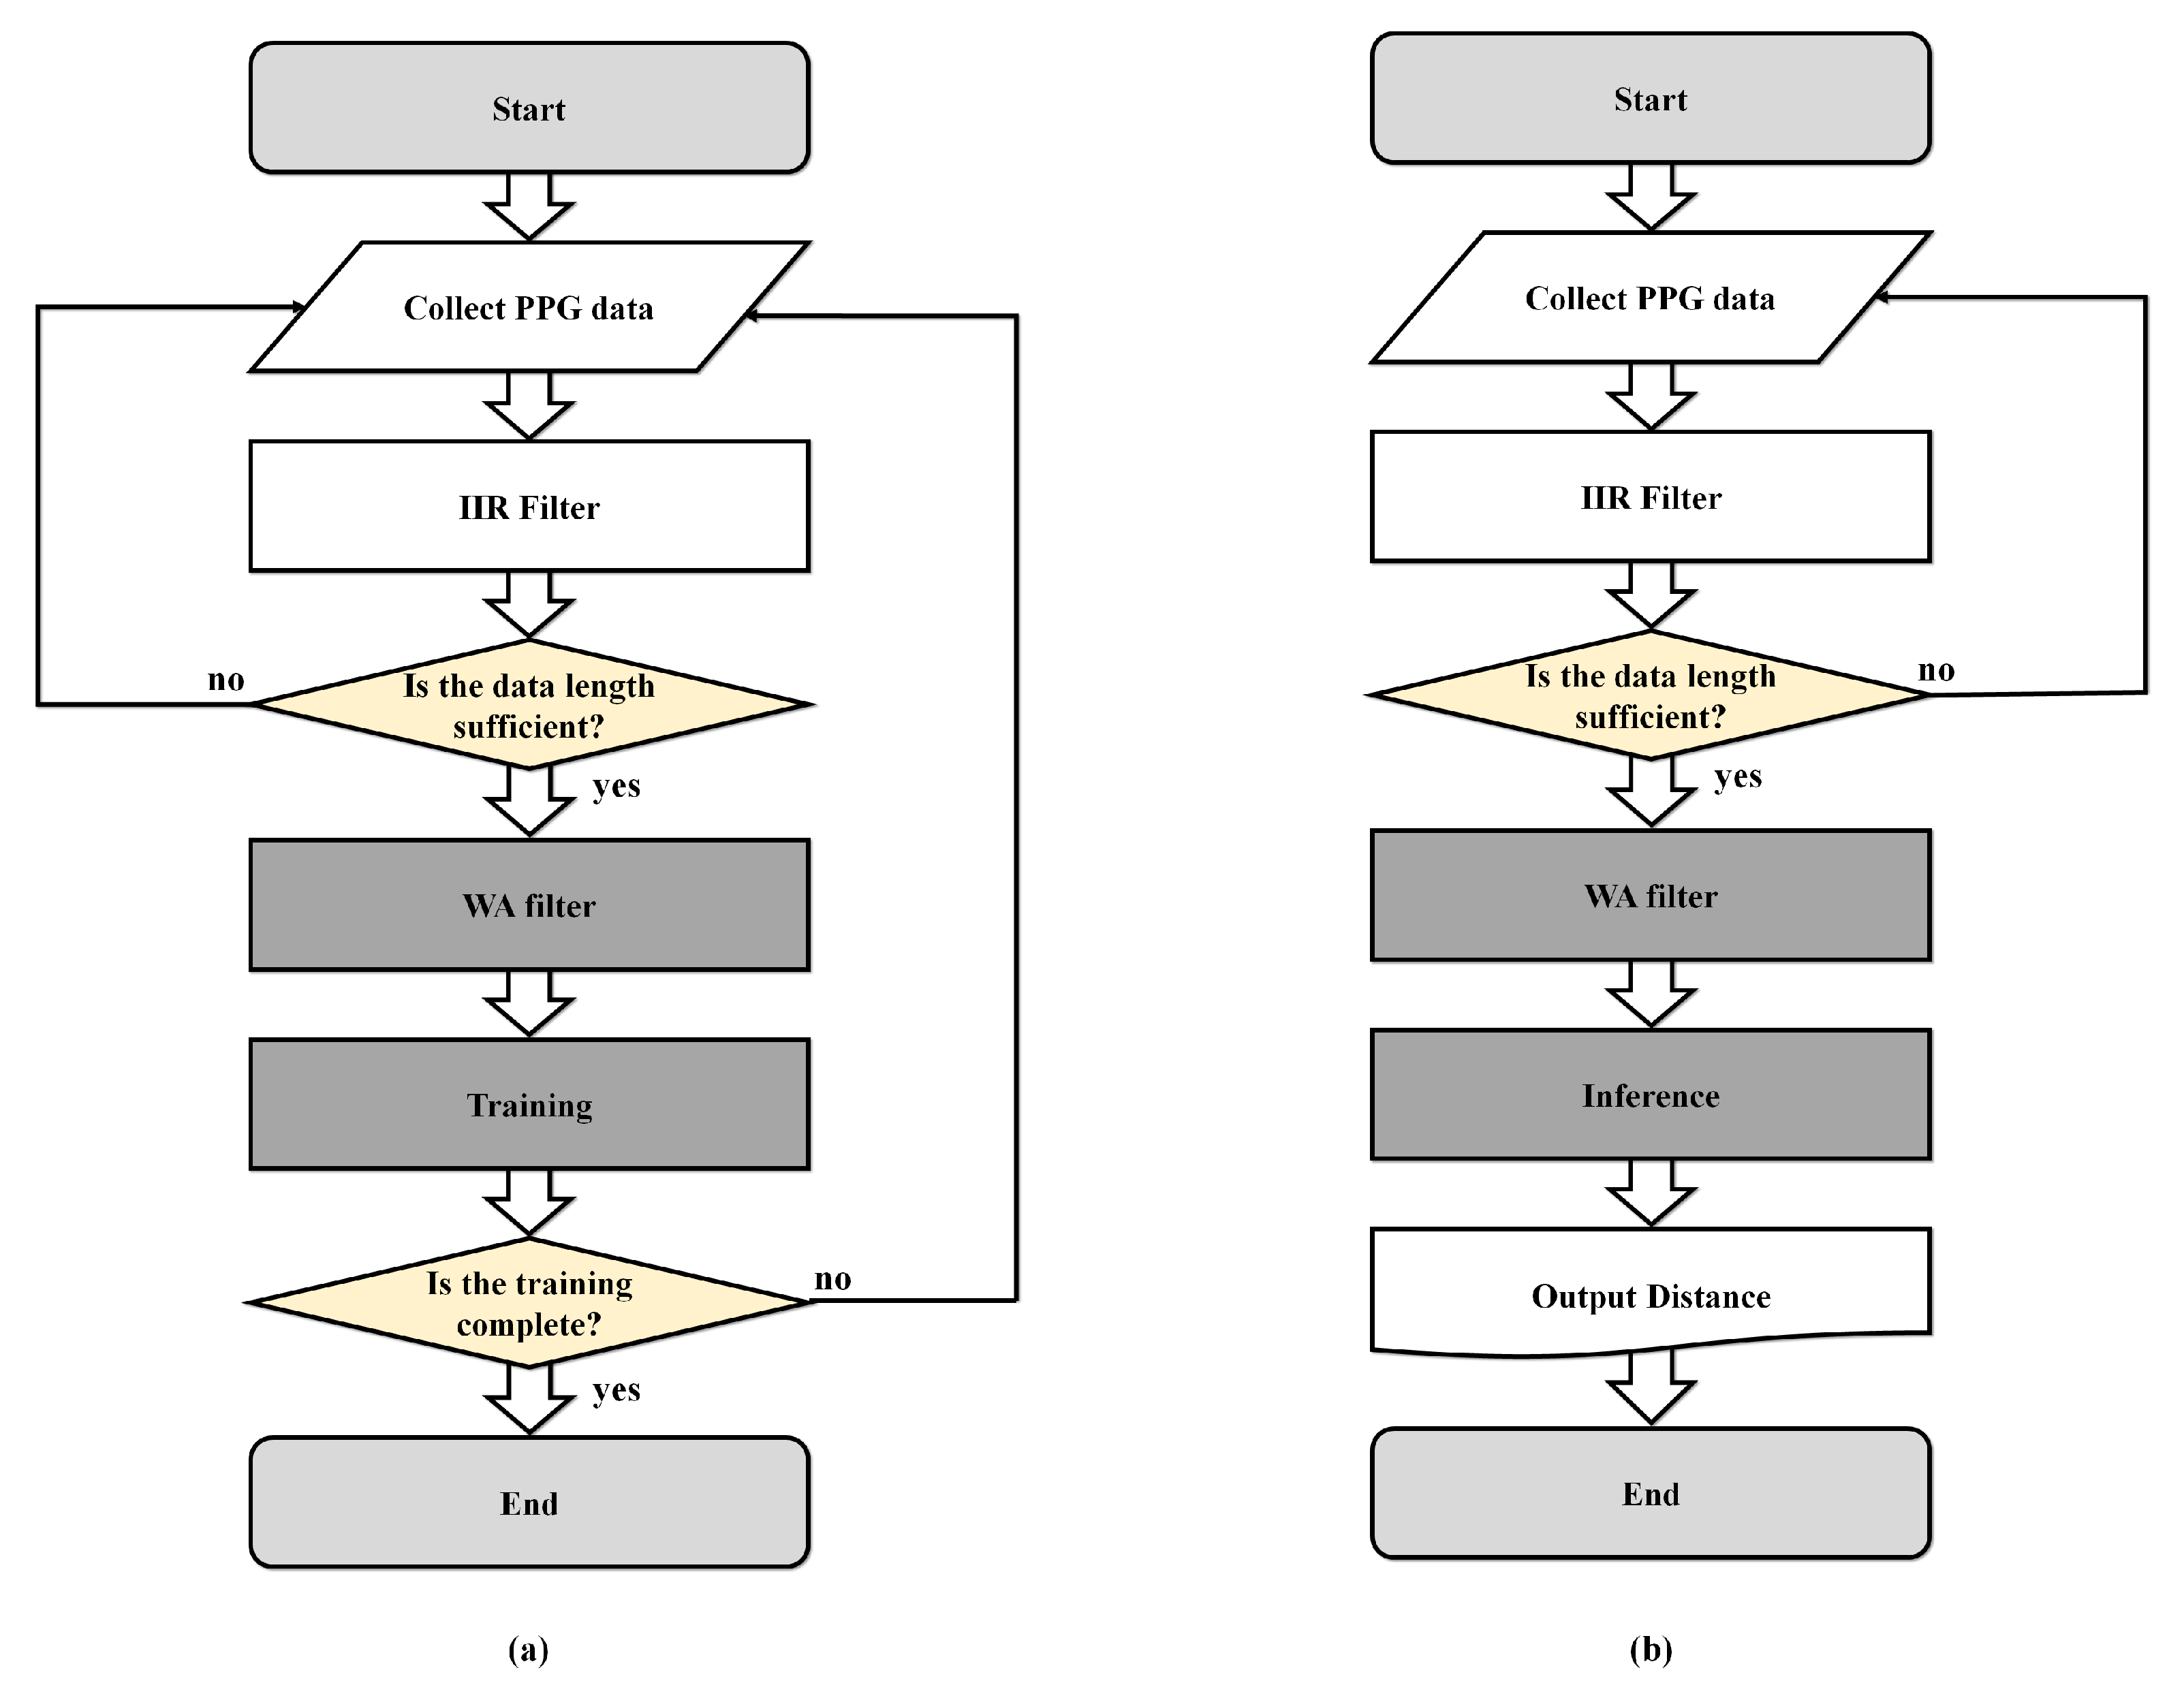
3. Algorithm Flow
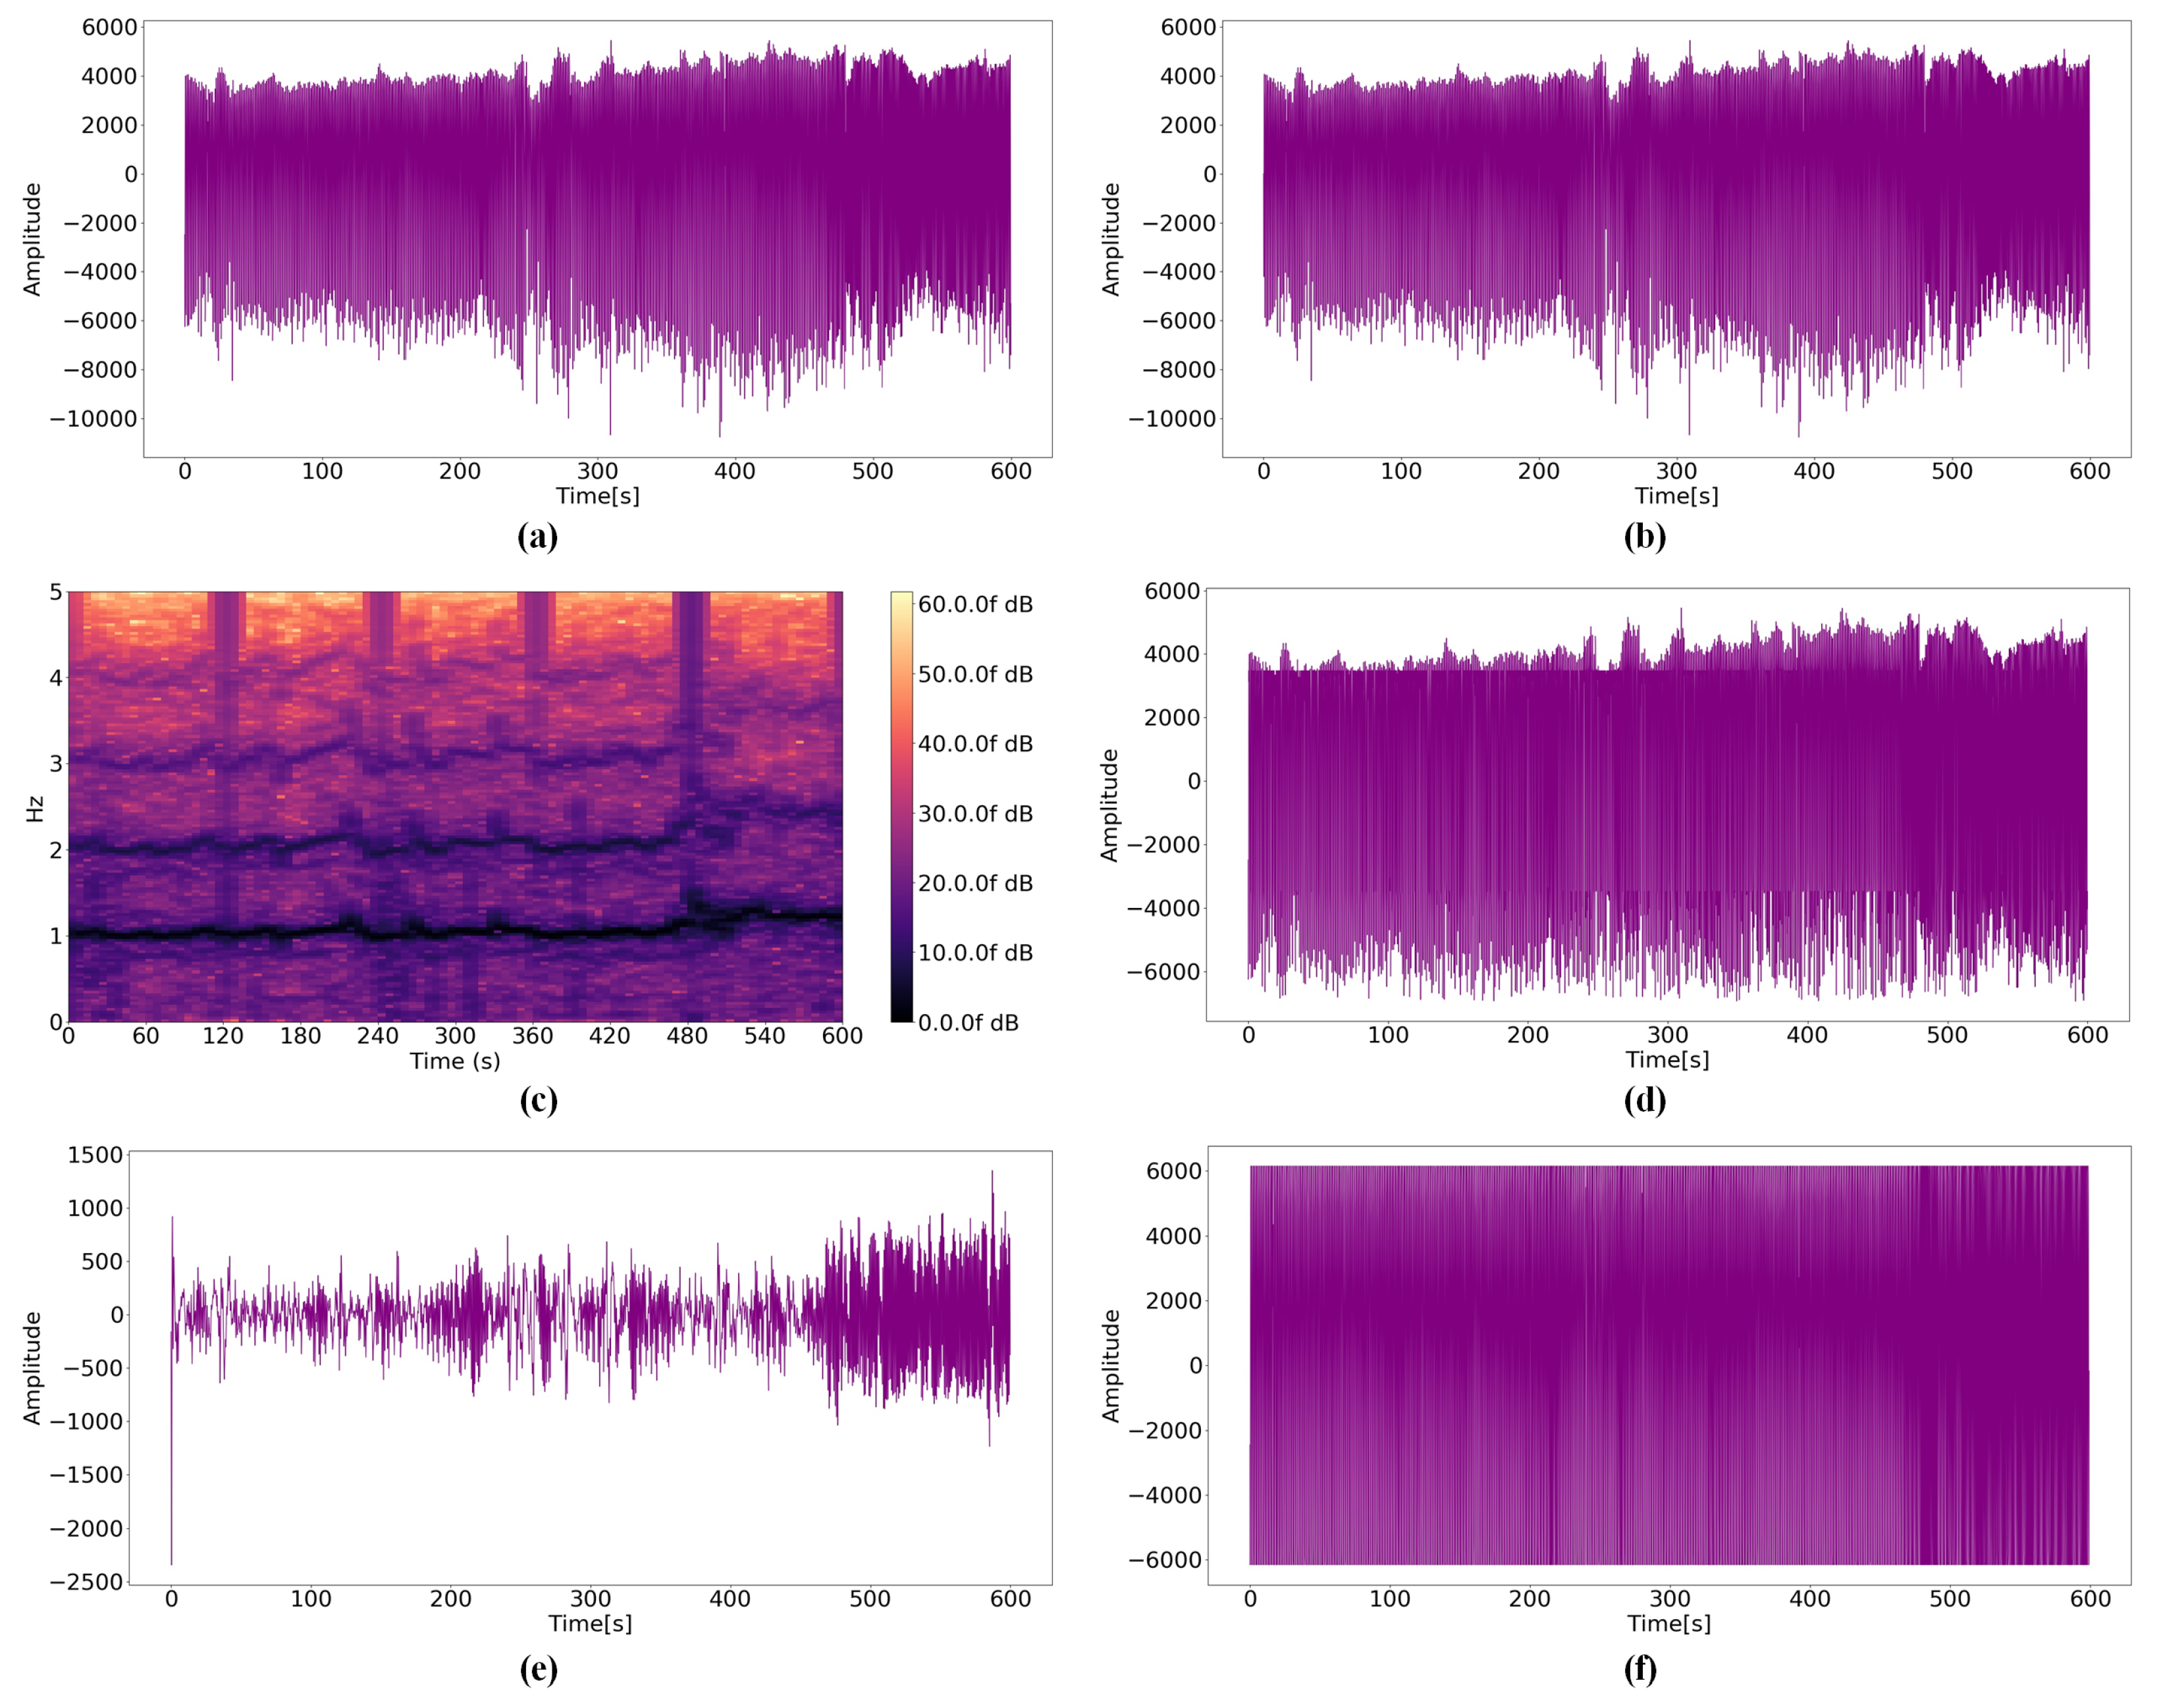
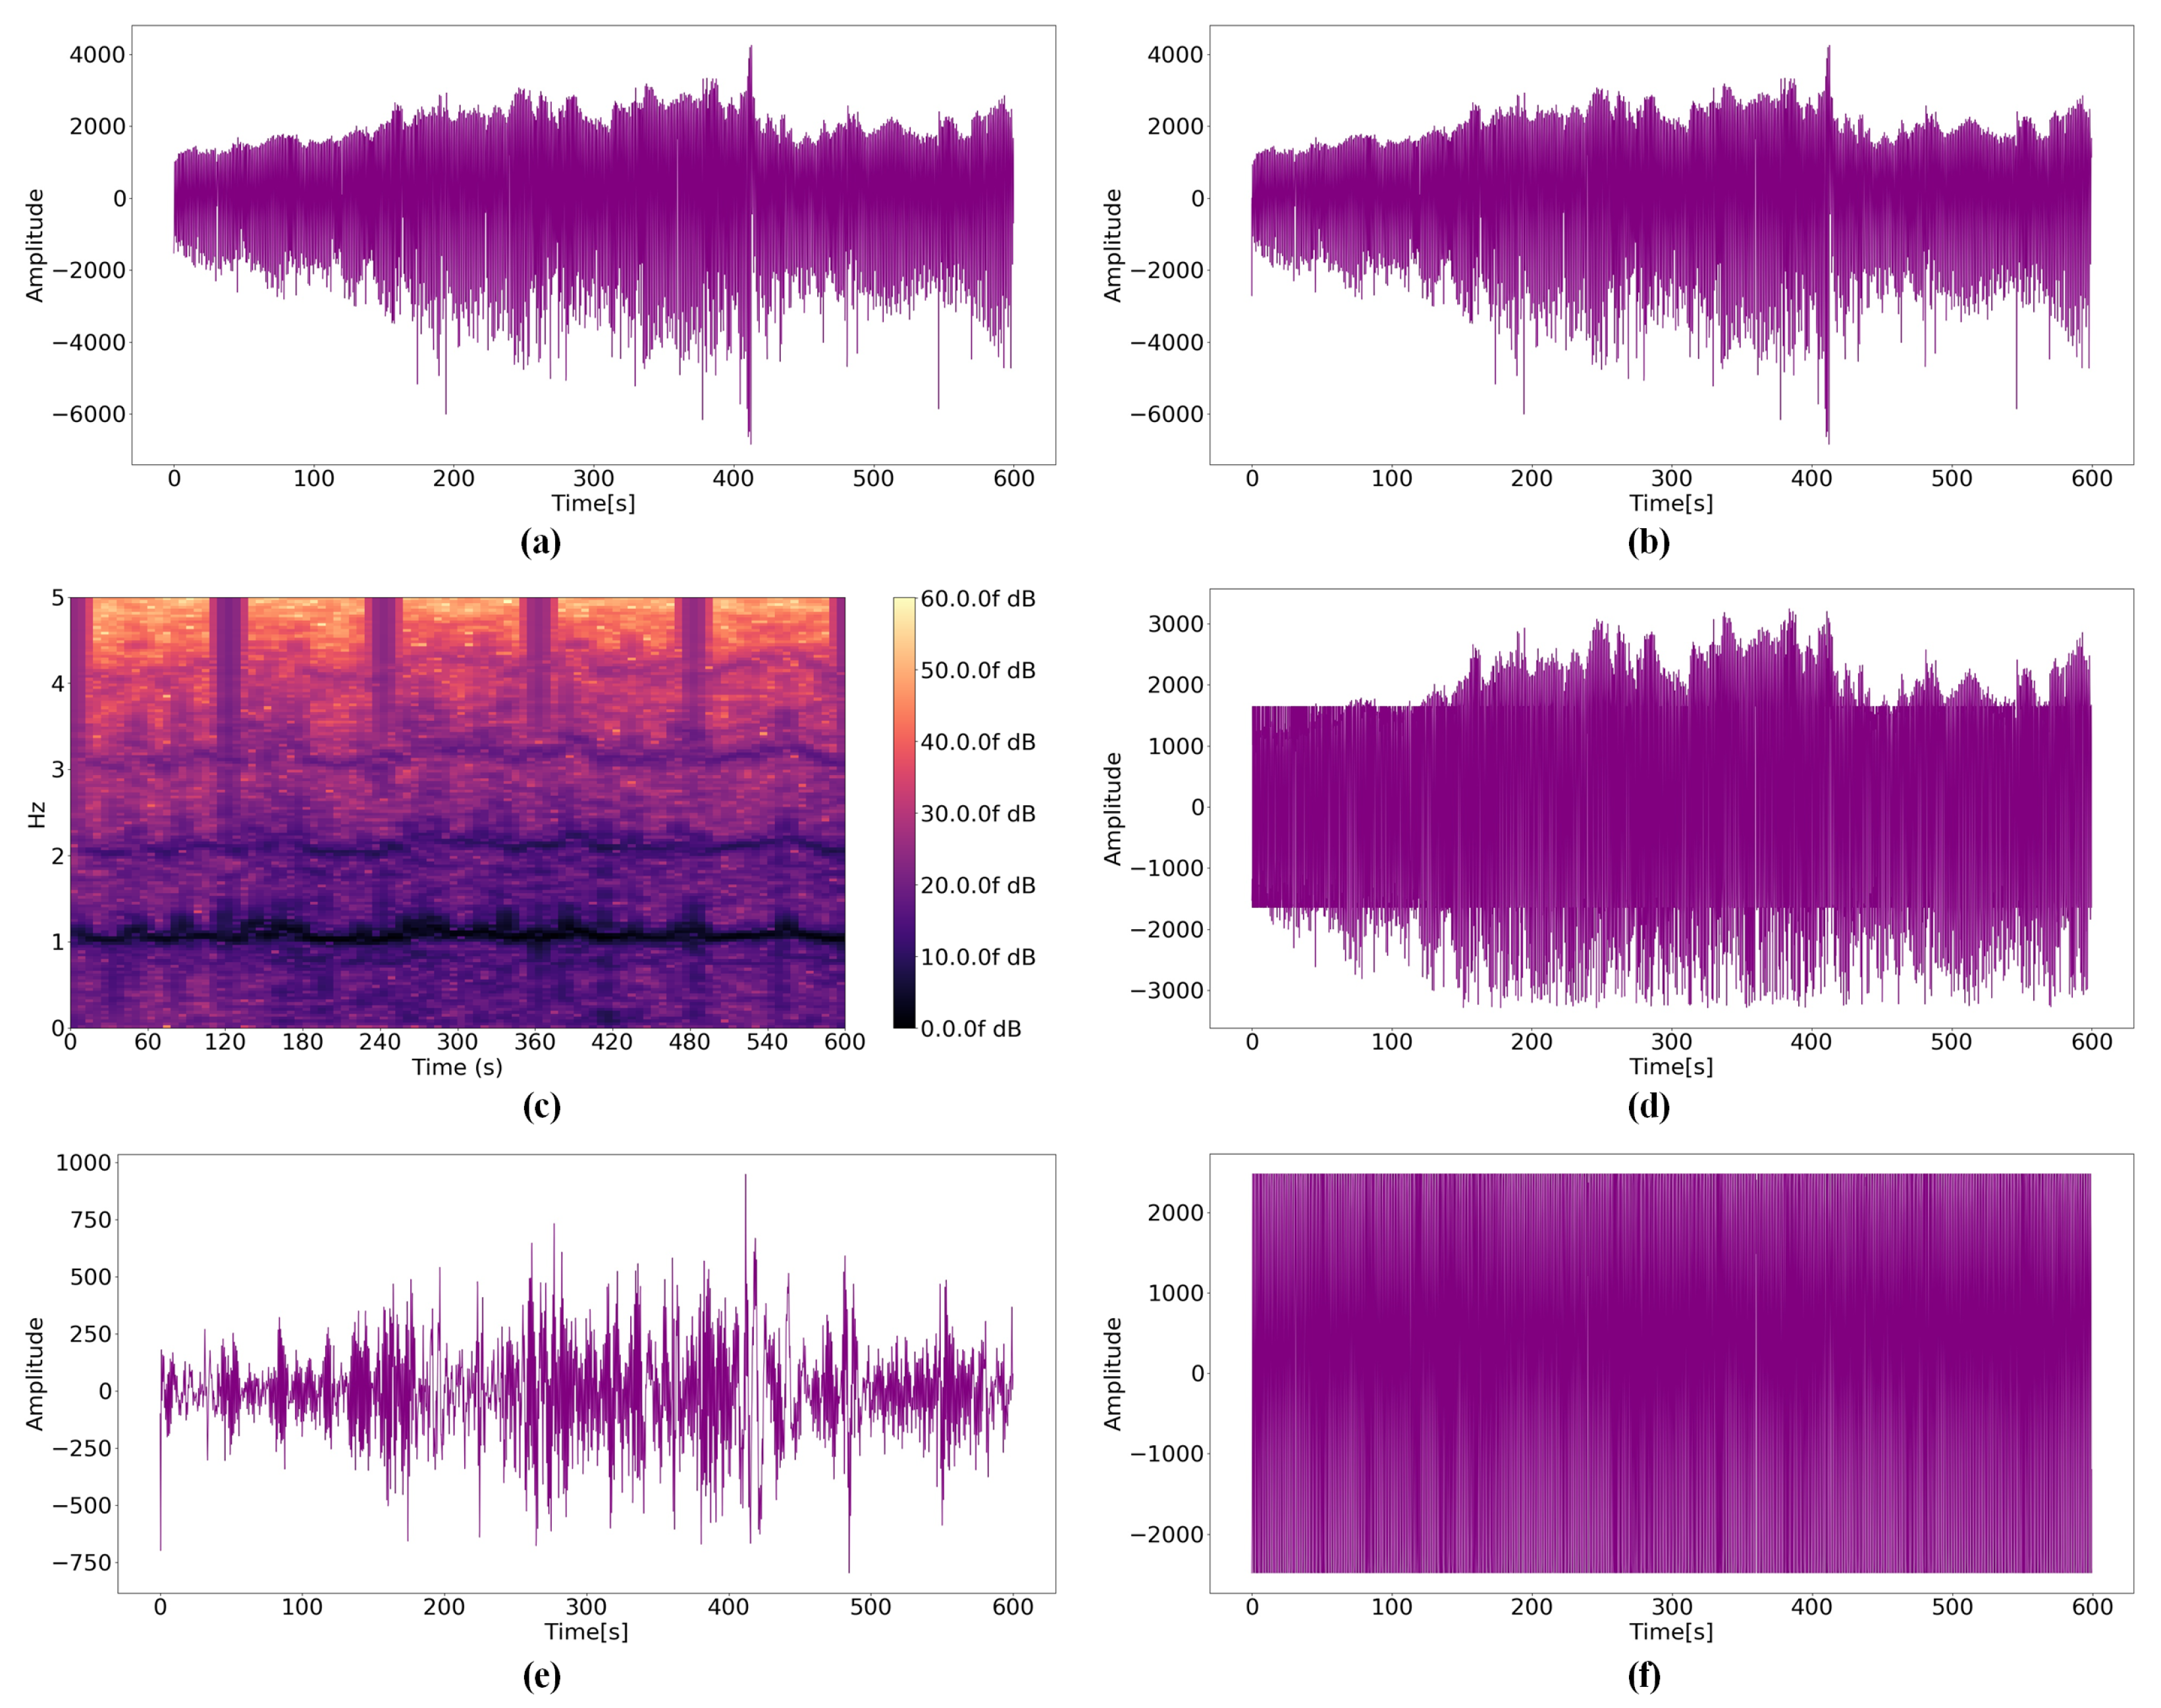
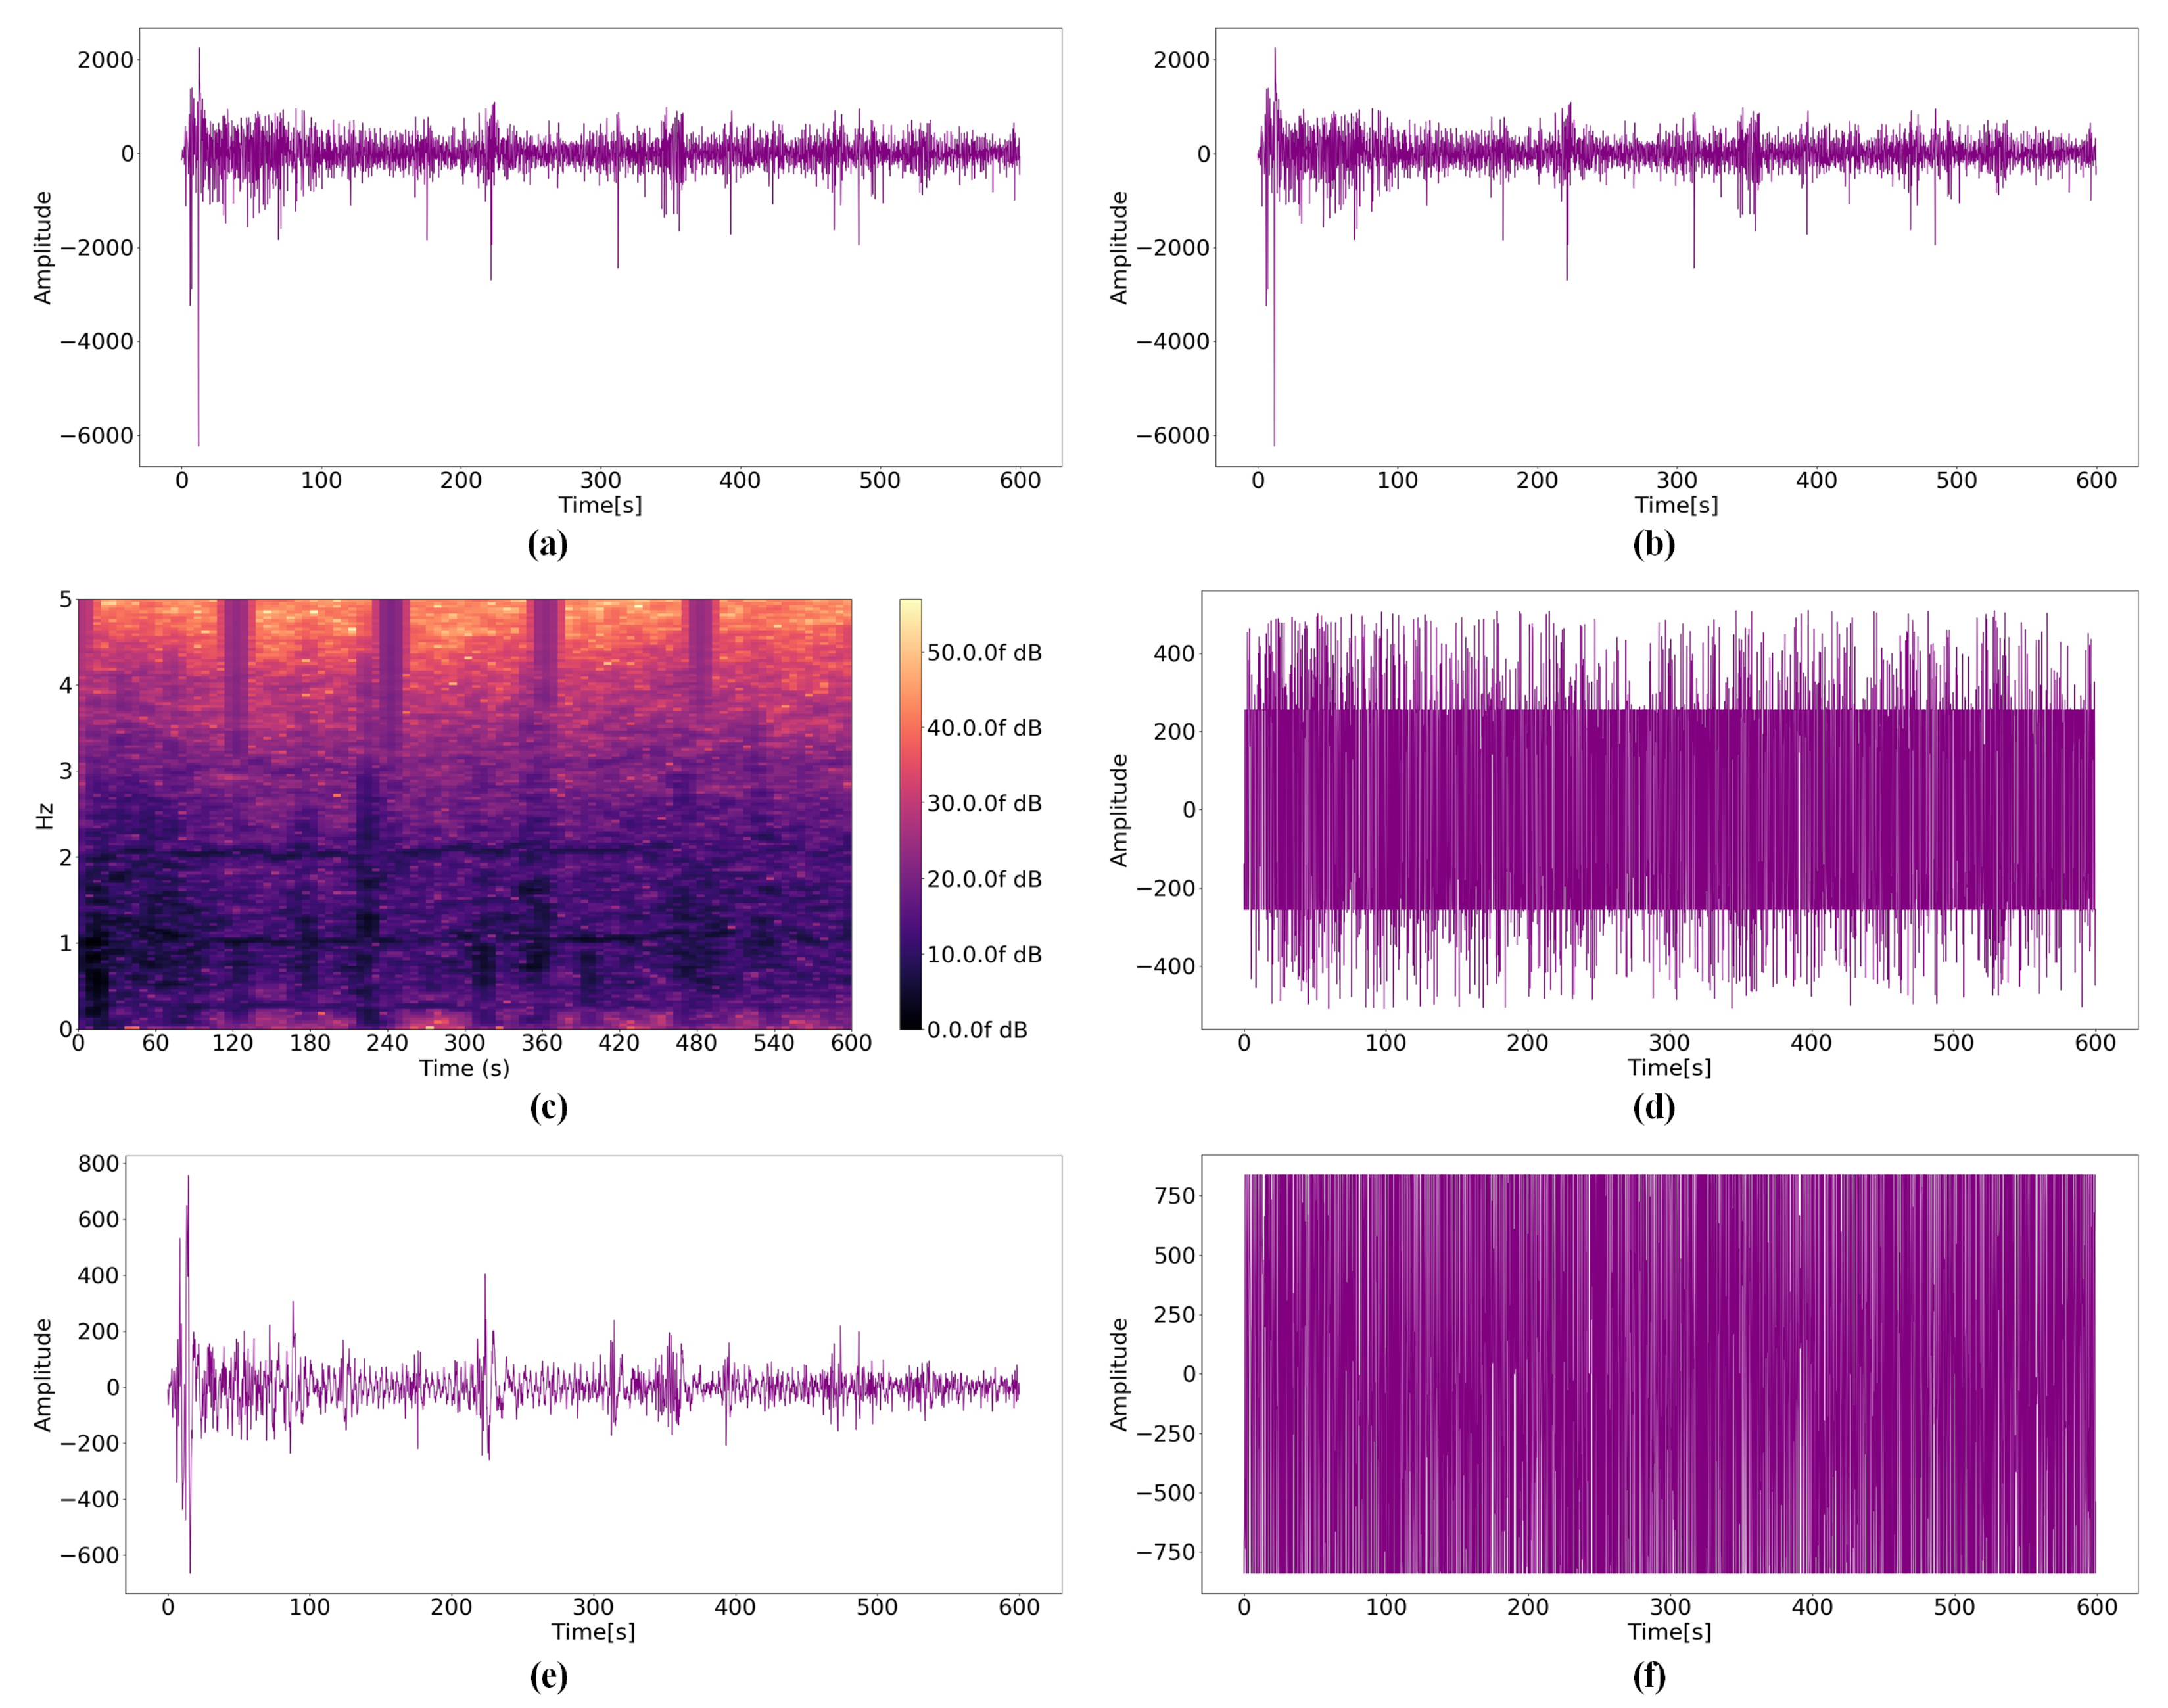
4. Experiment
5. Conclusions
Author Contributions
Funding
Data Availability Statement
Conflicts of Interest
References
- Cai, M.; Liao, W.H. Design, Modeling, and Experiments of Electromagnetic Energy Harvester Embedded in Smart Watch and Wristband as Power Source. IEEE/ASME Trans. Mechatron. 2021, 26, 2104–2114. [Google Scholar] [CrossRef]
- Wu, K.; Huang, Y.; Chen, W.; Chen, L.; Zhang, X.; Wang, L.; Ruby, R. Power Saving and Secure Text Input for Commodity Smart Watches. IEEE Trans. Mob. Comput. 2021, 20, 2281–2296. [Google Scholar] [CrossRef]
- Giggins, O.M.; Doyle, J.; Sojan, N.; Moran, O.; Crabtree, D.R.; Fraser, M.; Muggeridge, D.J. Accuracy of Wrist-Worn Photoplethysmography Devices at Measuring Heart Rate in the Laboratory and During Free-Living Activities. In Proceedings of the 2021 43rd Annual International Conference of the IEEE Engineering in Medicine & Biology Society (EMBC), Virtual Conference, 1–5 November 2021; pp. 6970–6973. [Google Scholar]
- Shu, Y.S.; Chen, Z.X.; Lin, Y.H.; Wu, S.H.; Huang, W.H.; Chiou, A.Y.C.; Huang, C.Y.; Hsieh, H.Y.; Liao, F.W.; Zou, T.F.; et al. 26.1 A 4.5 mm2 Multimodal Biosensing SoC for PPG, ECG, BIOZ and GSR Acquisition in Consumer Wearable Devices. In Proceedings of the 2020 IEEE International Solid- State Circuits Conference-(ISSCC), San Francisco, CA, USA, 16–20 February 2020; pp. 400–402. [Google Scholar]
- Esgalhado, F.; Fernandes, B.; Vassilenko, V.; Batista, A.; Russo, S. The Application of Deep Learning Algorithms for PPG Signal Processing and Classification. Computers 2021, 10, 158. [Google Scholar] [CrossRef]
- Zargari, A.H.A.; Aqajari, S.A.H.; Khodabandeh, H.; Rahmani, A.M.; Kurdahi, F. An accurate non-accelerometer-based ppg motion artifact removal technique using cyclegan. arXiv 2021, arXiv:2106.11512. [Google Scholar]
- Shimazaki, S.; Kawanaka, H.; Ishikawa, H.; Inoue, K.; Oguri, K. Cuffless Blood Pressure Estimation from only the Waveform of Photoplethysmography using CNN. In Proceedings of the 2019 41st Annual International Conference of the IEEE Engineering in Medicine and Biology Society (EMBC), Berlin, Germany, 23–27 July 2019; pp. 5042–5045. [Google Scholar]
- Haque, C.A.; Kwon, T.H.; Kim, K.D. Cuffless Blood Pressure Estimation Based on Monte Carlo Simulation Using Photoplethysmography Signals. Sensors 2022, 22, 1175. [Google Scholar] [CrossRef] [PubMed]
- Haddad, S.; Boukhayma, A.; Di Pietrantonio, G.; Barison, A.; de Preux, G.; Caizzone, A. Photoplethysmography Based Blood Pressure Monitoring Using the Senbiosys Ring. In Proceedings of the 2021 43rd Annual International Conference of the IEEE Engineering in Medicine & Biology Society (EMBC), Virtual Conference, 1–5 November 2021; pp. 1609–1612. [Google Scholar]
- Wang, D.; Yang, X.; Liu, X.; Ma, L.; Li, L.; Wang, W. Photoplethysmography-Based Blood Pressure Estimation Combining Filter-Wrapper Collaborated Feature Selection With LASSO-LSTM Model. IEEE Trans. Instrum. Meas. 2021, 70, 1–14. [Google Scholar] [CrossRef]
- Yigzaw, T.; Gared, F.; Kassaw, A. Performance Analysis of Adaptive Filter and Machine Learning Algorithms for Heart Rate Estimation Using PPG Signal. In Proceedings of the 2021 International Conference on Information and Communication Technology for Development for Africa (ICT4DA), Bahir Dar, Ethiopia, 22–24 November 2021; pp. 6–11. [Google Scholar]
- Kılıçkaya, S.; Güner, A.; Dal, B. Comparison of Different Machine Learning Techniques for the Cuffless Estimation of Blood Pressure using PPG Signals. In Proceedings of the 2020 International Congress on Human-Computer Interaction, Optimization and Robotic Applications (HORA), Ankara, Turkey, 26–27 June 2020; pp. 1–6. [Google Scholar]
- Aliamiri, A.; Shen, Y. Deep learning based atrial fibrillation detection using wearable photoplethysmography sensor. In Proceedings of the 2018 IEEE EMBS International Conference on Biomedical & Health Informatics (BHI), Las Vegas, NV, USA, 4–7 March 2018; pp. 442–445. [Google Scholar]
- Kim, D.K.; Kim, Y.T.; Kim, H.; Kim, D.J. DeepCNAP: A Deep Learning Approach for Continuous Noninvasive Arterial Blood Pressure Monitoring Using Photoplethysmography. IEEE J. Biomed. Health Inform. 2022, 26, 3697–3707. [Google Scholar] [CrossRef] [PubMed]
- Gasparini, F.; Grossi, A.; Giltri, M.; Bandini, S. Personalized PPG Normalization Based on Subject Heartbeat in Resting State Condition. Signals 2022, 3, 249–265. [Google Scholar] [CrossRef]
- Rodriguez-Labra, J.I.; Kosik, C.; Maddipatla, D.; Narakathu, B.B.; Atashbar, M.Z. Development of a PPG Sensor Array as a Wearable Device for Monitoring Cardiovascular Metrics. IEEE Sens. J. 2021, 21, 26320–26327. [Google Scholar] [CrossRef]
- Jarchi, D.; Charlton, P.; Pimentel, M.; Casson, A.; Tarassenko, L.; Clifton, D.A. Estimation of respiratory rate from motion contaminated photoplethysmography signals incorporating accelerometry. Healthc. Technol. Lett. 2019, 6, 19–26. [Google Scholar] [CrossRef] [PubMed]
- Zheng, X.; Dwyer, V.M.; Barrett, L.A.; Derakhshani, M.; Hu, S. Adaptive notch-filtration to effectively recover photoplethysmographic signals during physical activity. Biomed. Signal Process. Control 2022, 72, 103303. [Google Scholar] [CrossRef]
- Kuwalek, P.; Burlaga, B.; Jesko, W.; Konieczka, P. Research on methods for detecting respiratory rate from photoplethysmographic signal. Biomed. Signal Process. Control 2021, 66, 102483. [Google Scholar] [CrossRef]
- Lee, Y.K.; Jo, J.; Lee, Y.; Shin, H.S.; Kwon, O.W. Particle filter-based noise reduction in PPG signals for robust emotion recognition. In Proceedings of the 2012 IEEE International Conference on Consumer Electronics (ICCE), Las Vegas, NV, USA, 13–16 January 2012; pp. 598–599. [Google Scholar]
- Liang, Y.; Elgendi, M.; Chen, Z.; Ward, R. An optimal filter for short photoplethysmogram signals. Sci. Data 2018, 5, 180076. [Google Scholar] [CrossRef] [PubMed]
- Mishra, B.; Nirala, N.S. A Survey on Denoising Techniques of PPG Signal. In Proceedings of the 2020 IEEE International Conference for Innovation in Technology (INOCON), Bangaluru, India, 6–8 November 2020; pp. 1–8. [Google Scholar]
- Lee, J.; Chung, H.; Lee, H. Multi-Mode Particle Filtering Methods for Heart Rate Estimation From Wearable Photoplethysmography. IEEE Trans. Biomed. Eng. 2019, 66, 2789–2799. [Google Scholar] [CrossRef] [PubMed]
- Wolling, F.; Wasala, S.M.; Van Laerhoven, K. Optimal Preprocessing of Raw Signals from Reflective Mode Photoplethysmography in Wearable Devices. In Proceedings of the 2021 43rd Annual International Conference of the IEEE Engineering in Medicine & Biology Society (EMBC), Virtual Conference, 1–5 November 2021; pp. 1157–1163. [Google Scholar]
- Dataset from PPG wireless sensor for activity monitoring. Data Brief 2020, 29, 105044. [CrossRef] [PubMed]
- Xu, K.; Jiang, X.; Dai, C.; Chen, W. Stochastic Modeling for Photoplethysmography Compression. In Proceedings of the 2020 42nd Annual International Conference of the IEEE Engineering in Medicine & Biology Society (EMBC), Montreal, QC, Canada, 20–24 July 2020; pp. 5925–5928. [Google Scholar]
- Kim, J.K.; Oh, J.H.; Gwon, O.S.; Yang, J.W.; Lee, S.E. Real-time PPG monitoring system for mobile healthcare devices. In Proceedings of the 2017 IEEE International Symposium on Consumer Electronics (ISCE), Kuala Lumpur, Malaysia, 14–15 November 2017; pp. 84–85. [Google Scholar]
- Lecun, Y.; Bottou, L.; Bengio, Y.; Haffner, P. Gradient-based learning applied to document recognition. Proc. IEEE 1998, 86, 2278–2324. [Google Scholar] [CrossRef]
- Howard, A.G.; Zhu, M.; Chen, B.; Kalenichenko, D.; Wang, W.; Weyand, T.; Andreetto, M.; Adam, H. Mobilenets: Efficient convolutional neural networks for mobile vision applications. arXiv 2017, arXiv:1704.04861. [Google Scholar]
- Li, Q.; Li, R.; Ji, K.; Dai, W. Kalman Filter and Its Application. In Proceedings of the 2015 8th International Conference on Intelligent Networks and Intelligent Systems (ICINIS), Tianjin, China, 1–3 November 2015; pp. 74–77. [Google Scholar]
- Go, K.H.; Han, C.Y.; Cho, K.N.; Lee, S.E. Crime Prevention System: Crashing Window Sound Detection Using AI Processor. In Proceedings of the 2021 IEEE International Conference on Consumer Electronics (ICCE), Las Vegas, NV, USA, 10–12 January 2021; pp. 1–2. [Google Scholar]
- Yoon, Y.H.; Hwang, D.H.; Yang, J.H.; Lee, S.E. Intellino: Processor for Embedded Artificial Intelligence. Electronics 2020, 9, 1169. [Google Scholar] [CrossRef]
- Jeong, Y.; Oh, H.W.; Kim, S.; Lee, S.E. An Edge AI Device based Intelligent Transportation System. J. Inf. Commun. Converg. Eng. 2022, 20, 166–173. [Google Scholar] [CrossRef]
- Hwang, D.H.; Han, C.Y.; Oh, H.W.; Lee, S.E. ASimOV: A Framework for Simulation and Optimization of an Embedded AI Accelerator. Micromachines 2021, 12, 838. [Google Scholar] [CrossRef] [PubMed]


| Filter | Signal Length | |||||
|---|---|---|---|---|---|---|
| 120 | 60 | 30 | 20 | 15 | 10 | |
| Raw data | 80.7% | 87.6% | 90.7% | 90.4% | 91.0% | 90.3% |
| Kalman | 80.1% | 88.0% | 90.4% | 90.2% | 90.9% | 90.0% |
| STFT | 37.6% | 39.8% | 40.8% | 39.4% | 38.8% | 37.3% |
| Modified average | 81.6% | 89.0% | 91.6% | 92.0% | 92.3% | 92.2% |
| BPS + SMA | 62.5% | 71.3% | 73.5% | 73.6% | 74.0% | 71.1% |
| WA | 81.1% | 87.0% | 90.7% | 93.4% | 93.9% | 94.6% |
| Filter | Signal Length | |||||
|---|---|---|---|---|---|---|
| 120 | 60 | 30 | 20 | 15 | 10 | |
| Raw data | 83.6% | 82.7% | 83.1% | 83.4% | 83.2% | 82.8% |
| Kalman | 83.7% | 82.6% | 82.9% | 83.2% | 82.7% | 82.7% |
| STFT | 23.9% | 25.5% | 27.0% | 28.2% | 29.1% | 30.0% |
| Modified average | 86.3% | 85.4% | 84.9% | 84.7% | 84.5% | 84.4% |
| BPS + SMA | 83.7% | 82.4% | 80.4% | 78.1% | 75.9% | 74.8% |
| WA | 76.4% | 76.0% | 75.7% | 76.5% | 73.9% | 75.9% |
| Filter | Signal Length | |
|---|---|---|
| 120 | 60 | |
| Raw data | 67.8% | 75.6% |
| Kalman | 69.3% | 76.5% |
| STFT | 39.5% | 41.0% |
| Modified average | 70.4% | 78.8% |
| BPS + SMA | 47.2% | 50.5% |
| WA | 78.4% | 71.5% |
| Filter | Signal Length | |||||
|---|---|---|---|---|---|---|
| 120 | 60 | 30 | 20 | 15 | 10 | |
| Raw data | 88.4% | 86.9% | 89.4% | 90.1% | 87.3% | 88.1% |
| Kalman | 90.3% | 83.6% | 89.6% | 86.5% | 89.3% | 87.4% |
| STFT | 40.7% | 37.7% | 38.8% | 37.6% | 36.3% | 36.2% |
| Modified average | 90.9% | 90.4% | 90.8% | 89.0% | 89.7% | 89.4% |
| BPS + SMA | 74.8% | 77.0% | 77.4% | 74.7% | 73.3% | 74.1% |
| WA | 90.3% | 90.8% | 90.5% | 91.2% | 92.5% | 92.2% |
| Filter | Signal Length | |||||
|---|---|---|---|---|---|---|
| 120 | 60 | 30 | 20 | 15 | 10 | |
| Intellino | 0.987 | 3.612 | 14.037 | 31.918 | 54.806 | 126.462 |
| MobileNet | 0.310 | 0.362 | 0.535 | 0.918 | 1.397 | 1.561 |
| Metrics | Signal Length | |||||
|---|---|---|---|---|---|---|
| 120 | 60 | 30 | 20 | 15 | 10 | |
| Precision | 89.7% | 90.3% | 90.9% | 92.0% | 92.6% | 92.0% |
| Recall | 90.0% | 90.5% | 91.3% | 92.1% | 92.8% | 92.5% |
| F1 Score | 0.899 | 0.904 | 0.911 | 0.921 | 0.927 | 0.922 |
Disclaimer/Publisher’s Note: The statements, opinions and data contained in all publications are solely those of the individual author(s) and contributor(s) and not of MDPI and/or the editor(s). MDPI and/or the editor(s) disclaim responsibility for any injury to people or property resulting from any ideas, methods, instructions or products referred to in the content. |
© 2023 by the authors. Licensee MDPI, Basel, Switzerland. This article is an open access article distributed under the terms and conditions of the Creative Commons Attribution (CC BY) license (https://creativecommons.org/licenses/by/4.0/).
Share and Cite
Jeong, Y.; Park, J.; Kwon, S.B.; Lee, S.E. Photoplethysmography-Based Distance Estimation for True Wireless Stereo. Micromachines 2023, 14, 252. https://doi.org/10.3390/mi14020252
Jeong Y, Park J, Kwon SB, Lee SE. Photoplethysmography-Based Distance Estimation for True Wireless Stereo. Micromachines. 2023; 14(2):252. https://doi.org/10.3390/mi14020252
Chicago/Turabian StyleJeong, Youngwoo, Joungmin Park, Sun Beom Kwon, and Seung Eun Lee. 2023. "Photoplethysmography-Based Distance Estimation for True Wireless Stereo" Micromachines 14, no. 2: 252. https://doi.org/10.3390/mi14020252
APA StyleJeong, Y., Park, J., Kwon, S. B., & Lee, S. E. (2023). Photoplethysmography-Based Distance Estimation for True Wireless Stereo. Micromachines, 14(2), 252. https://doi.org/10.3390/mi14020252