
Espial: Electrochemical Soil pH Sensor for In Situ Real-Time Monitoring

 , ,
, , 
Abstract
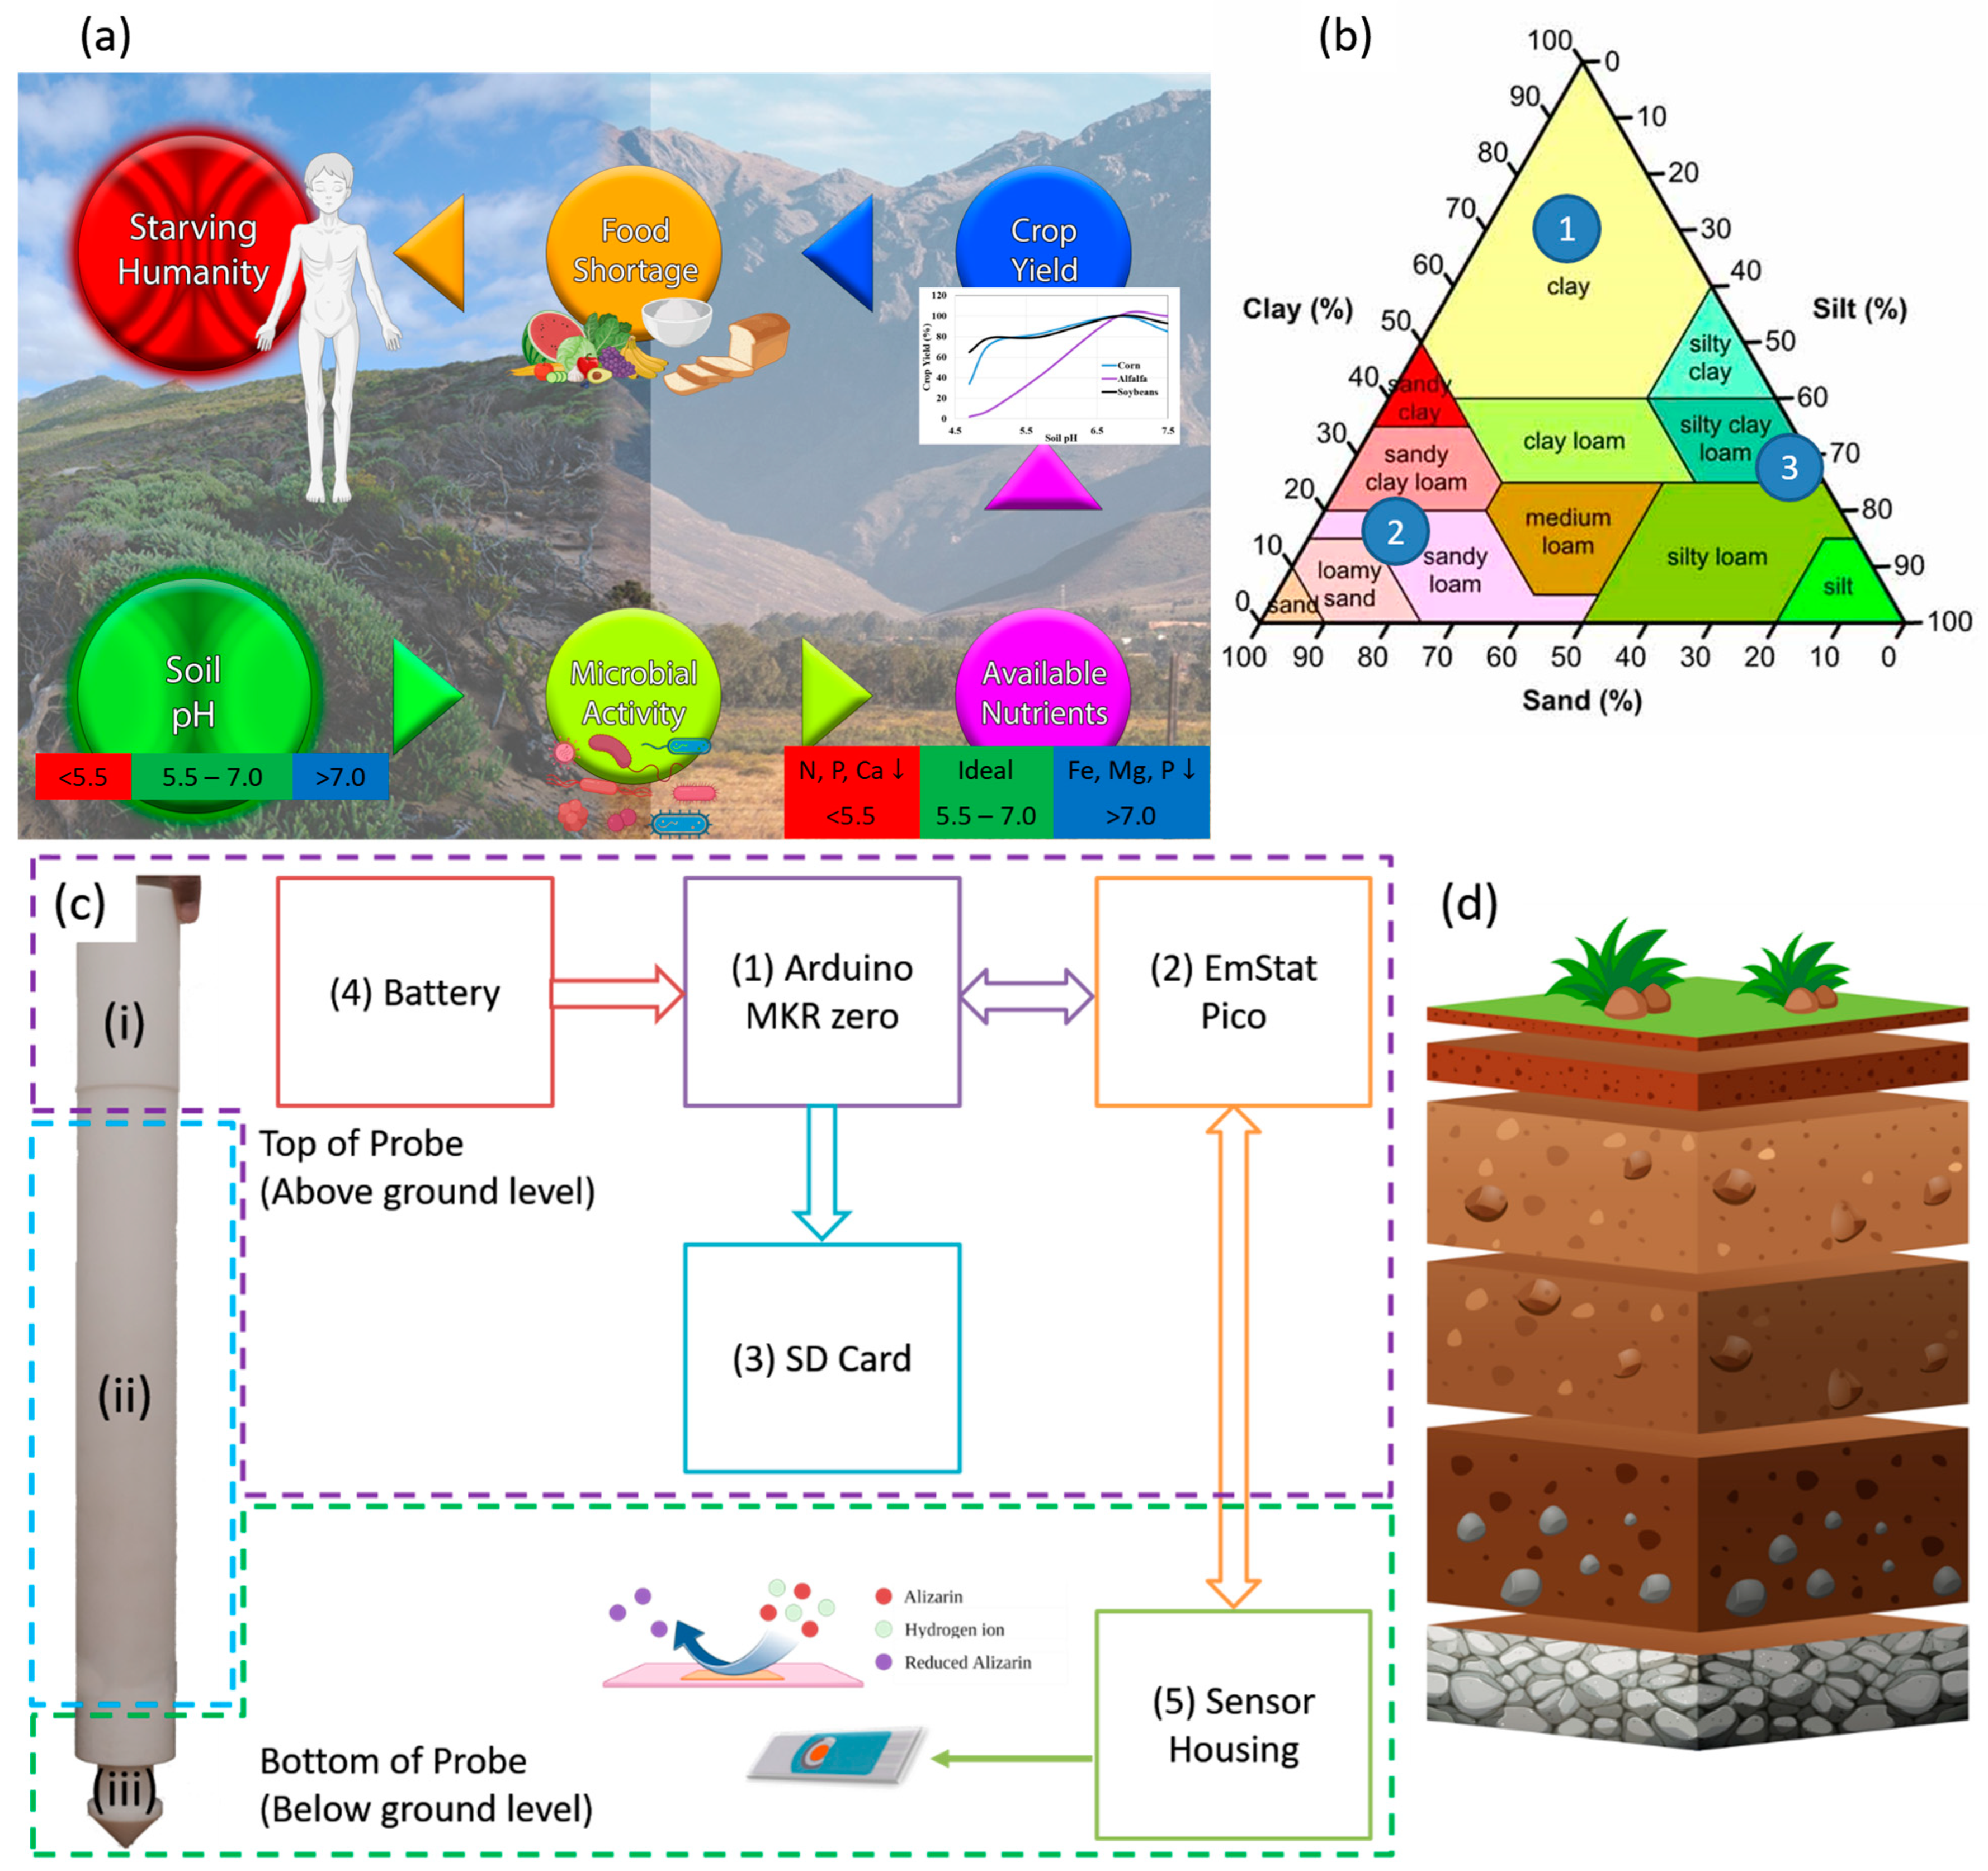
:1. Introduction
2. Materials and Methods
2.1. Materials
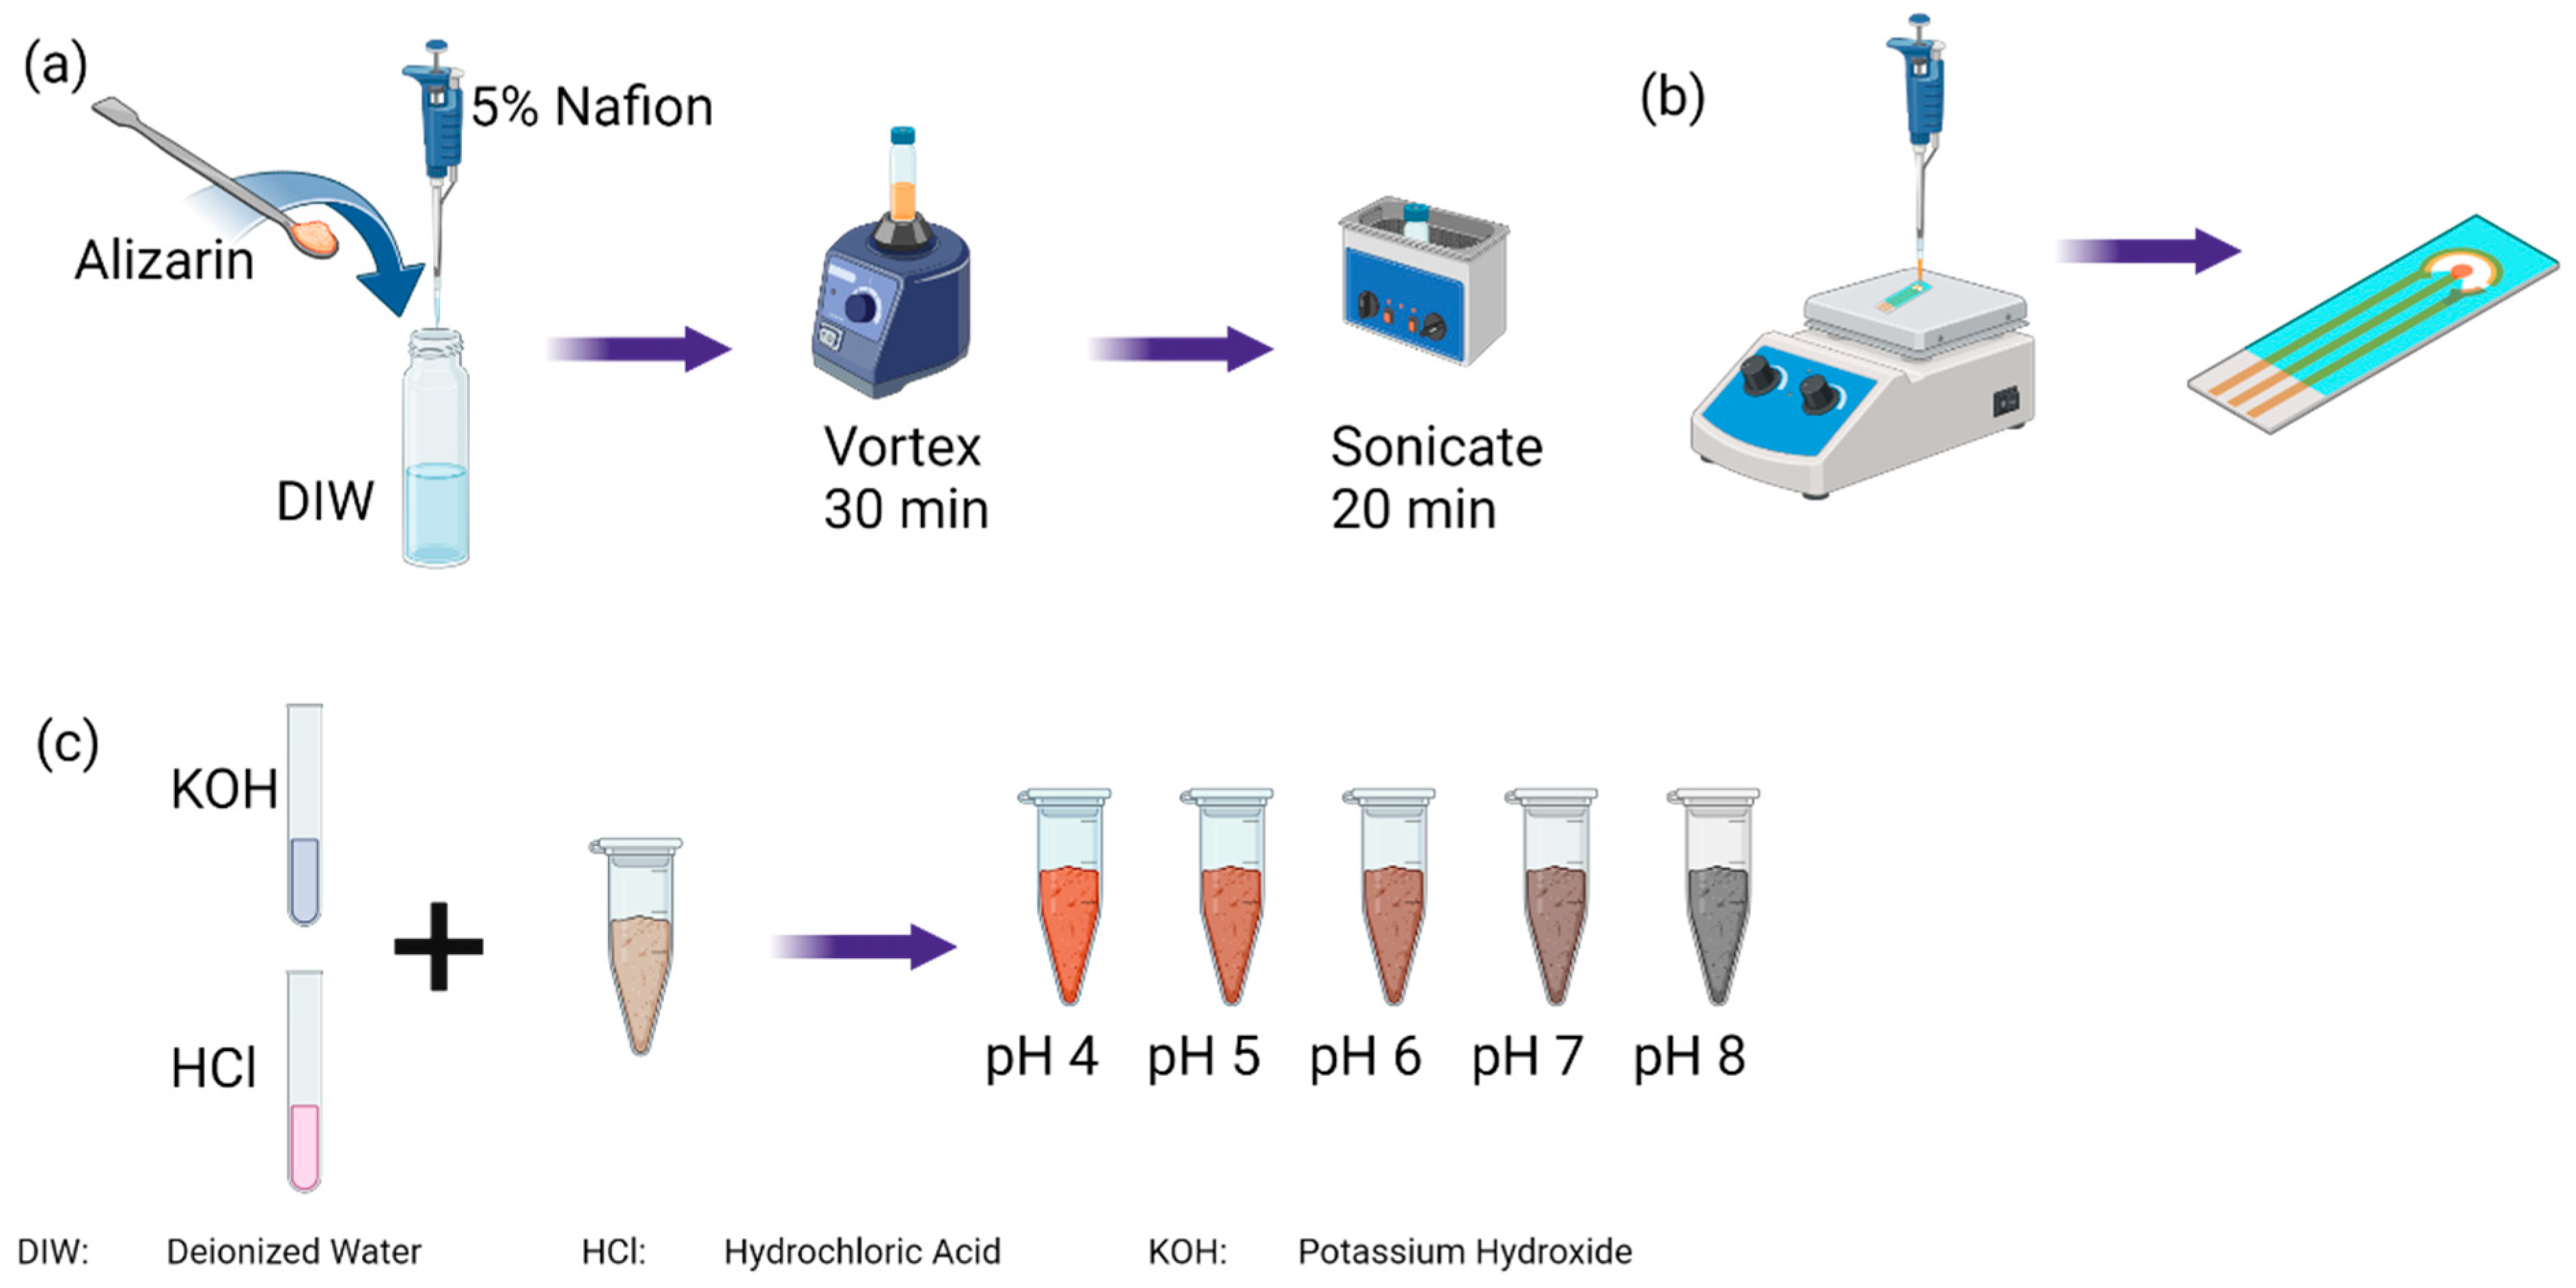
2.2. Soil Sample Preparation
2.3. Electrode Preparation
2.4. Hardware Development
2.5. Experimental Design
3. Results and Discussion
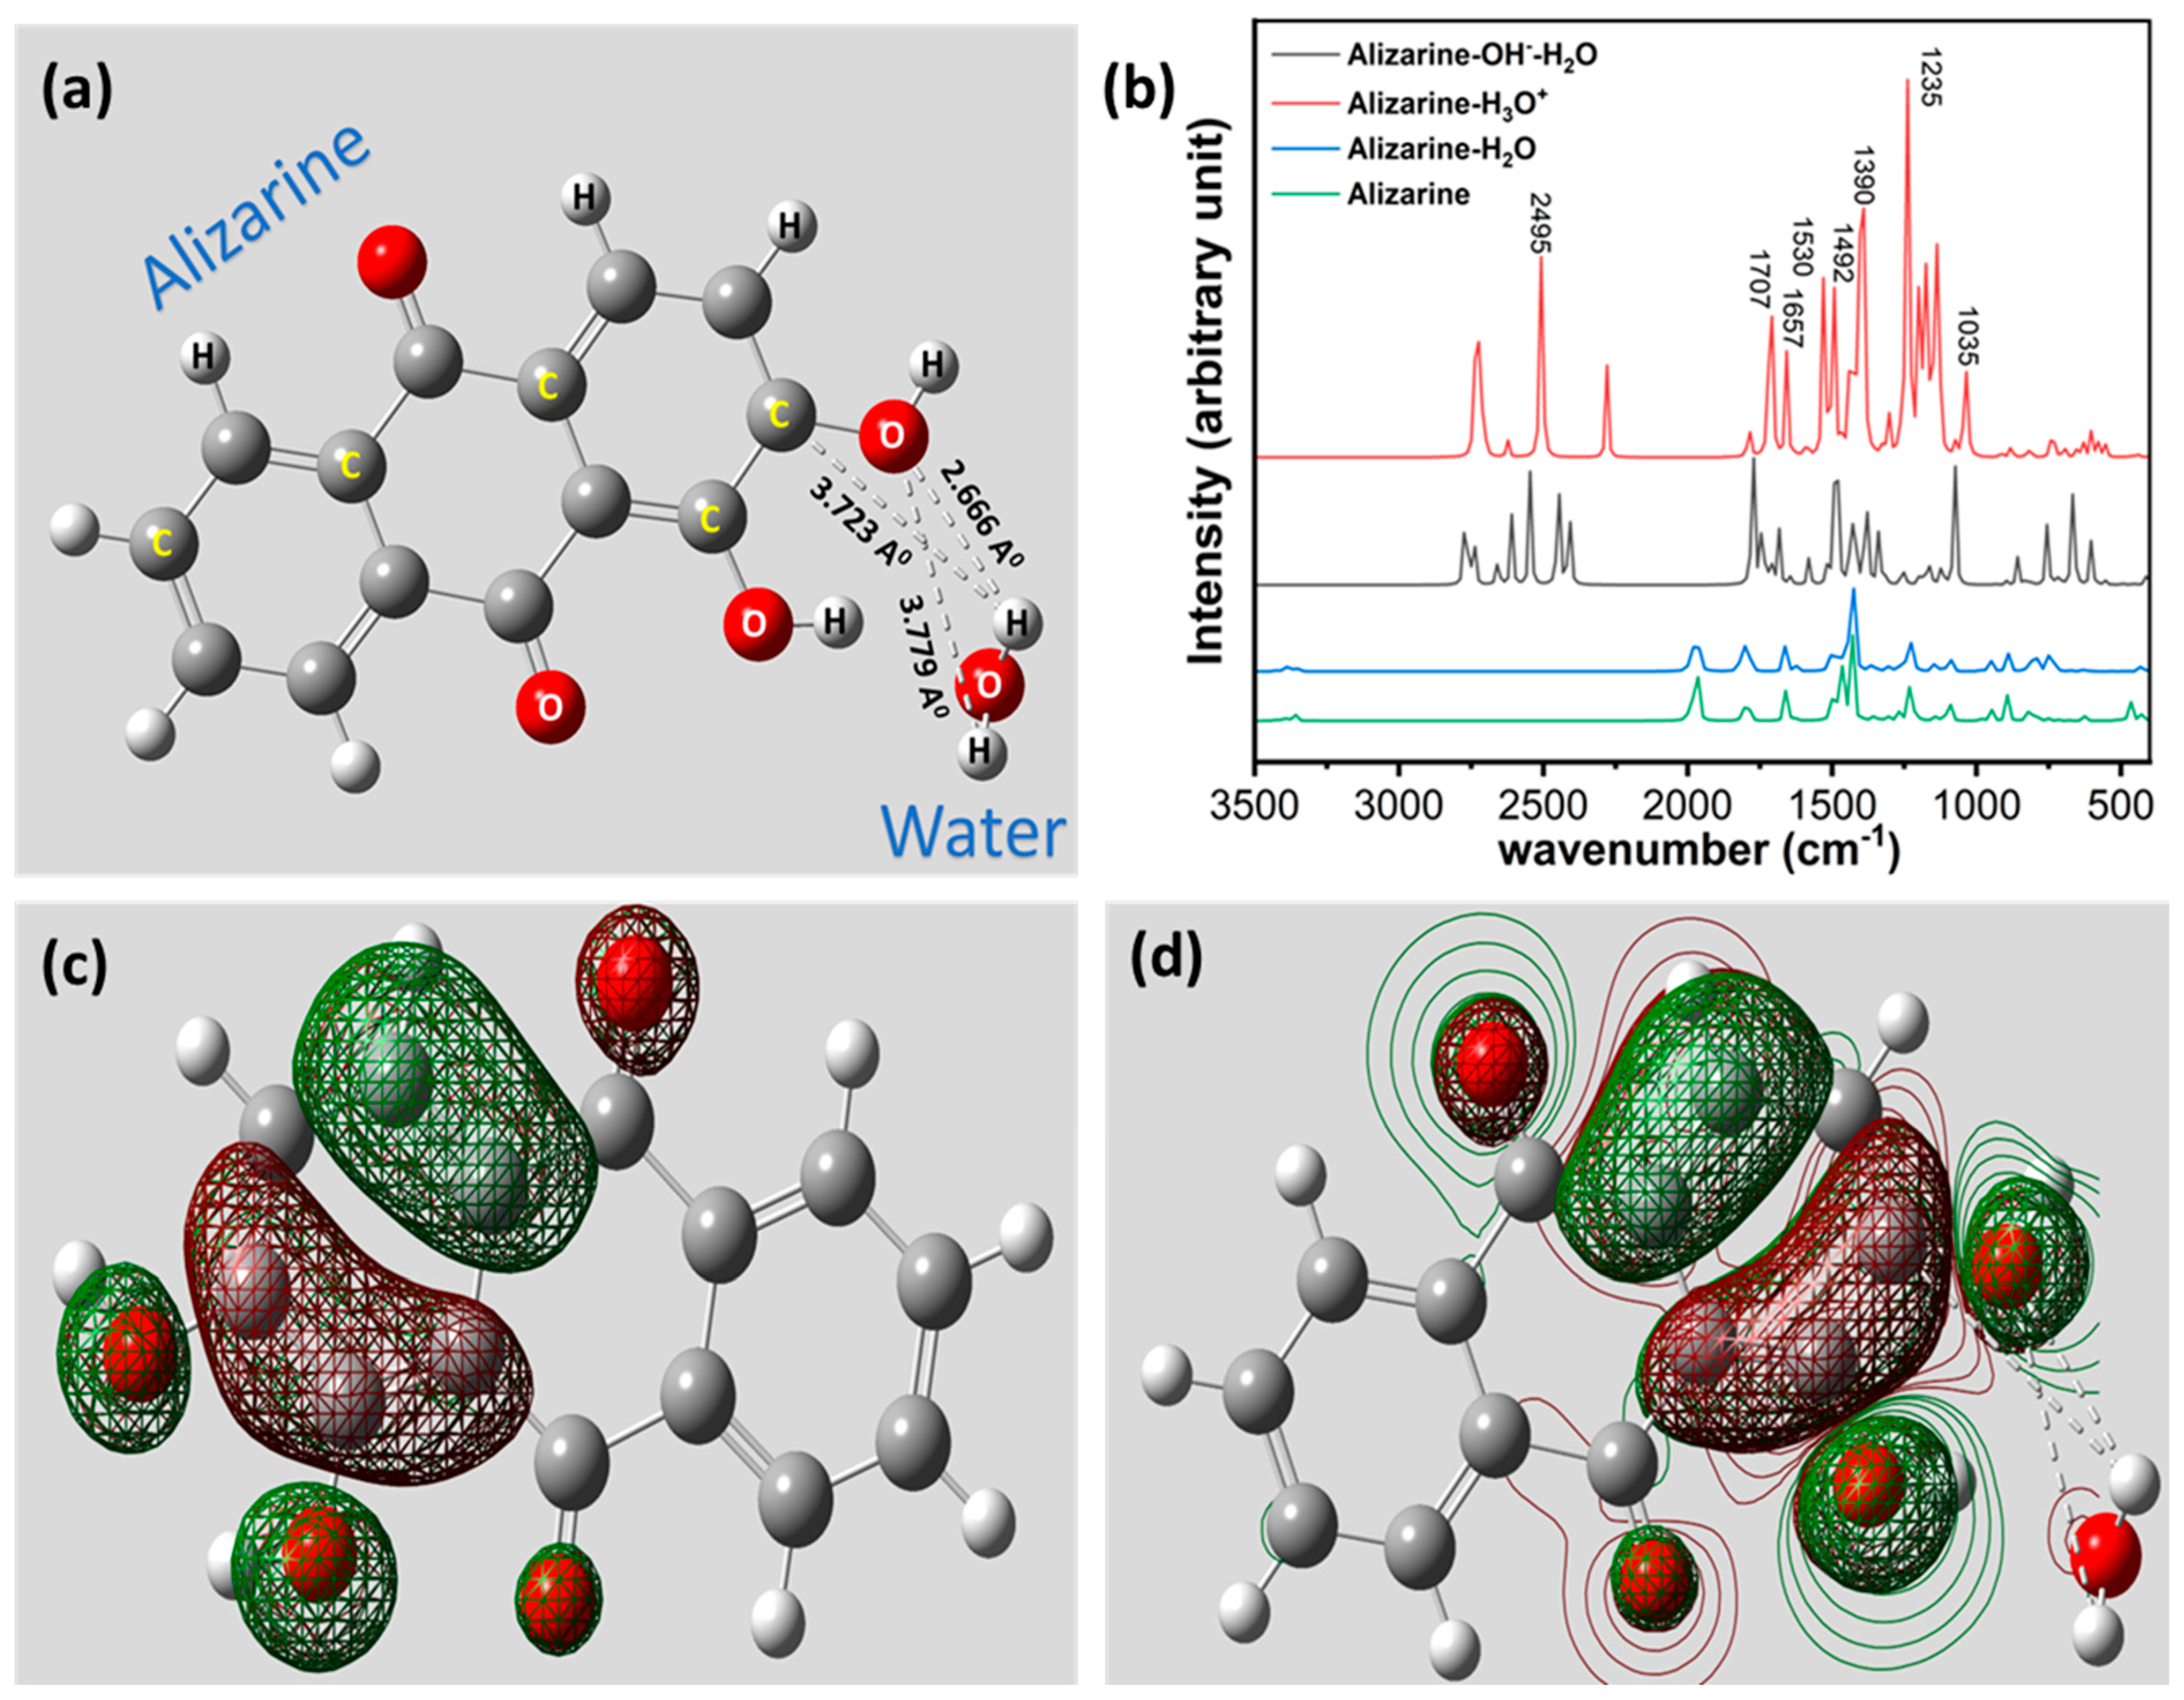
3.1. Computational Study of Alizarin and Its Interaction with Water Molecules
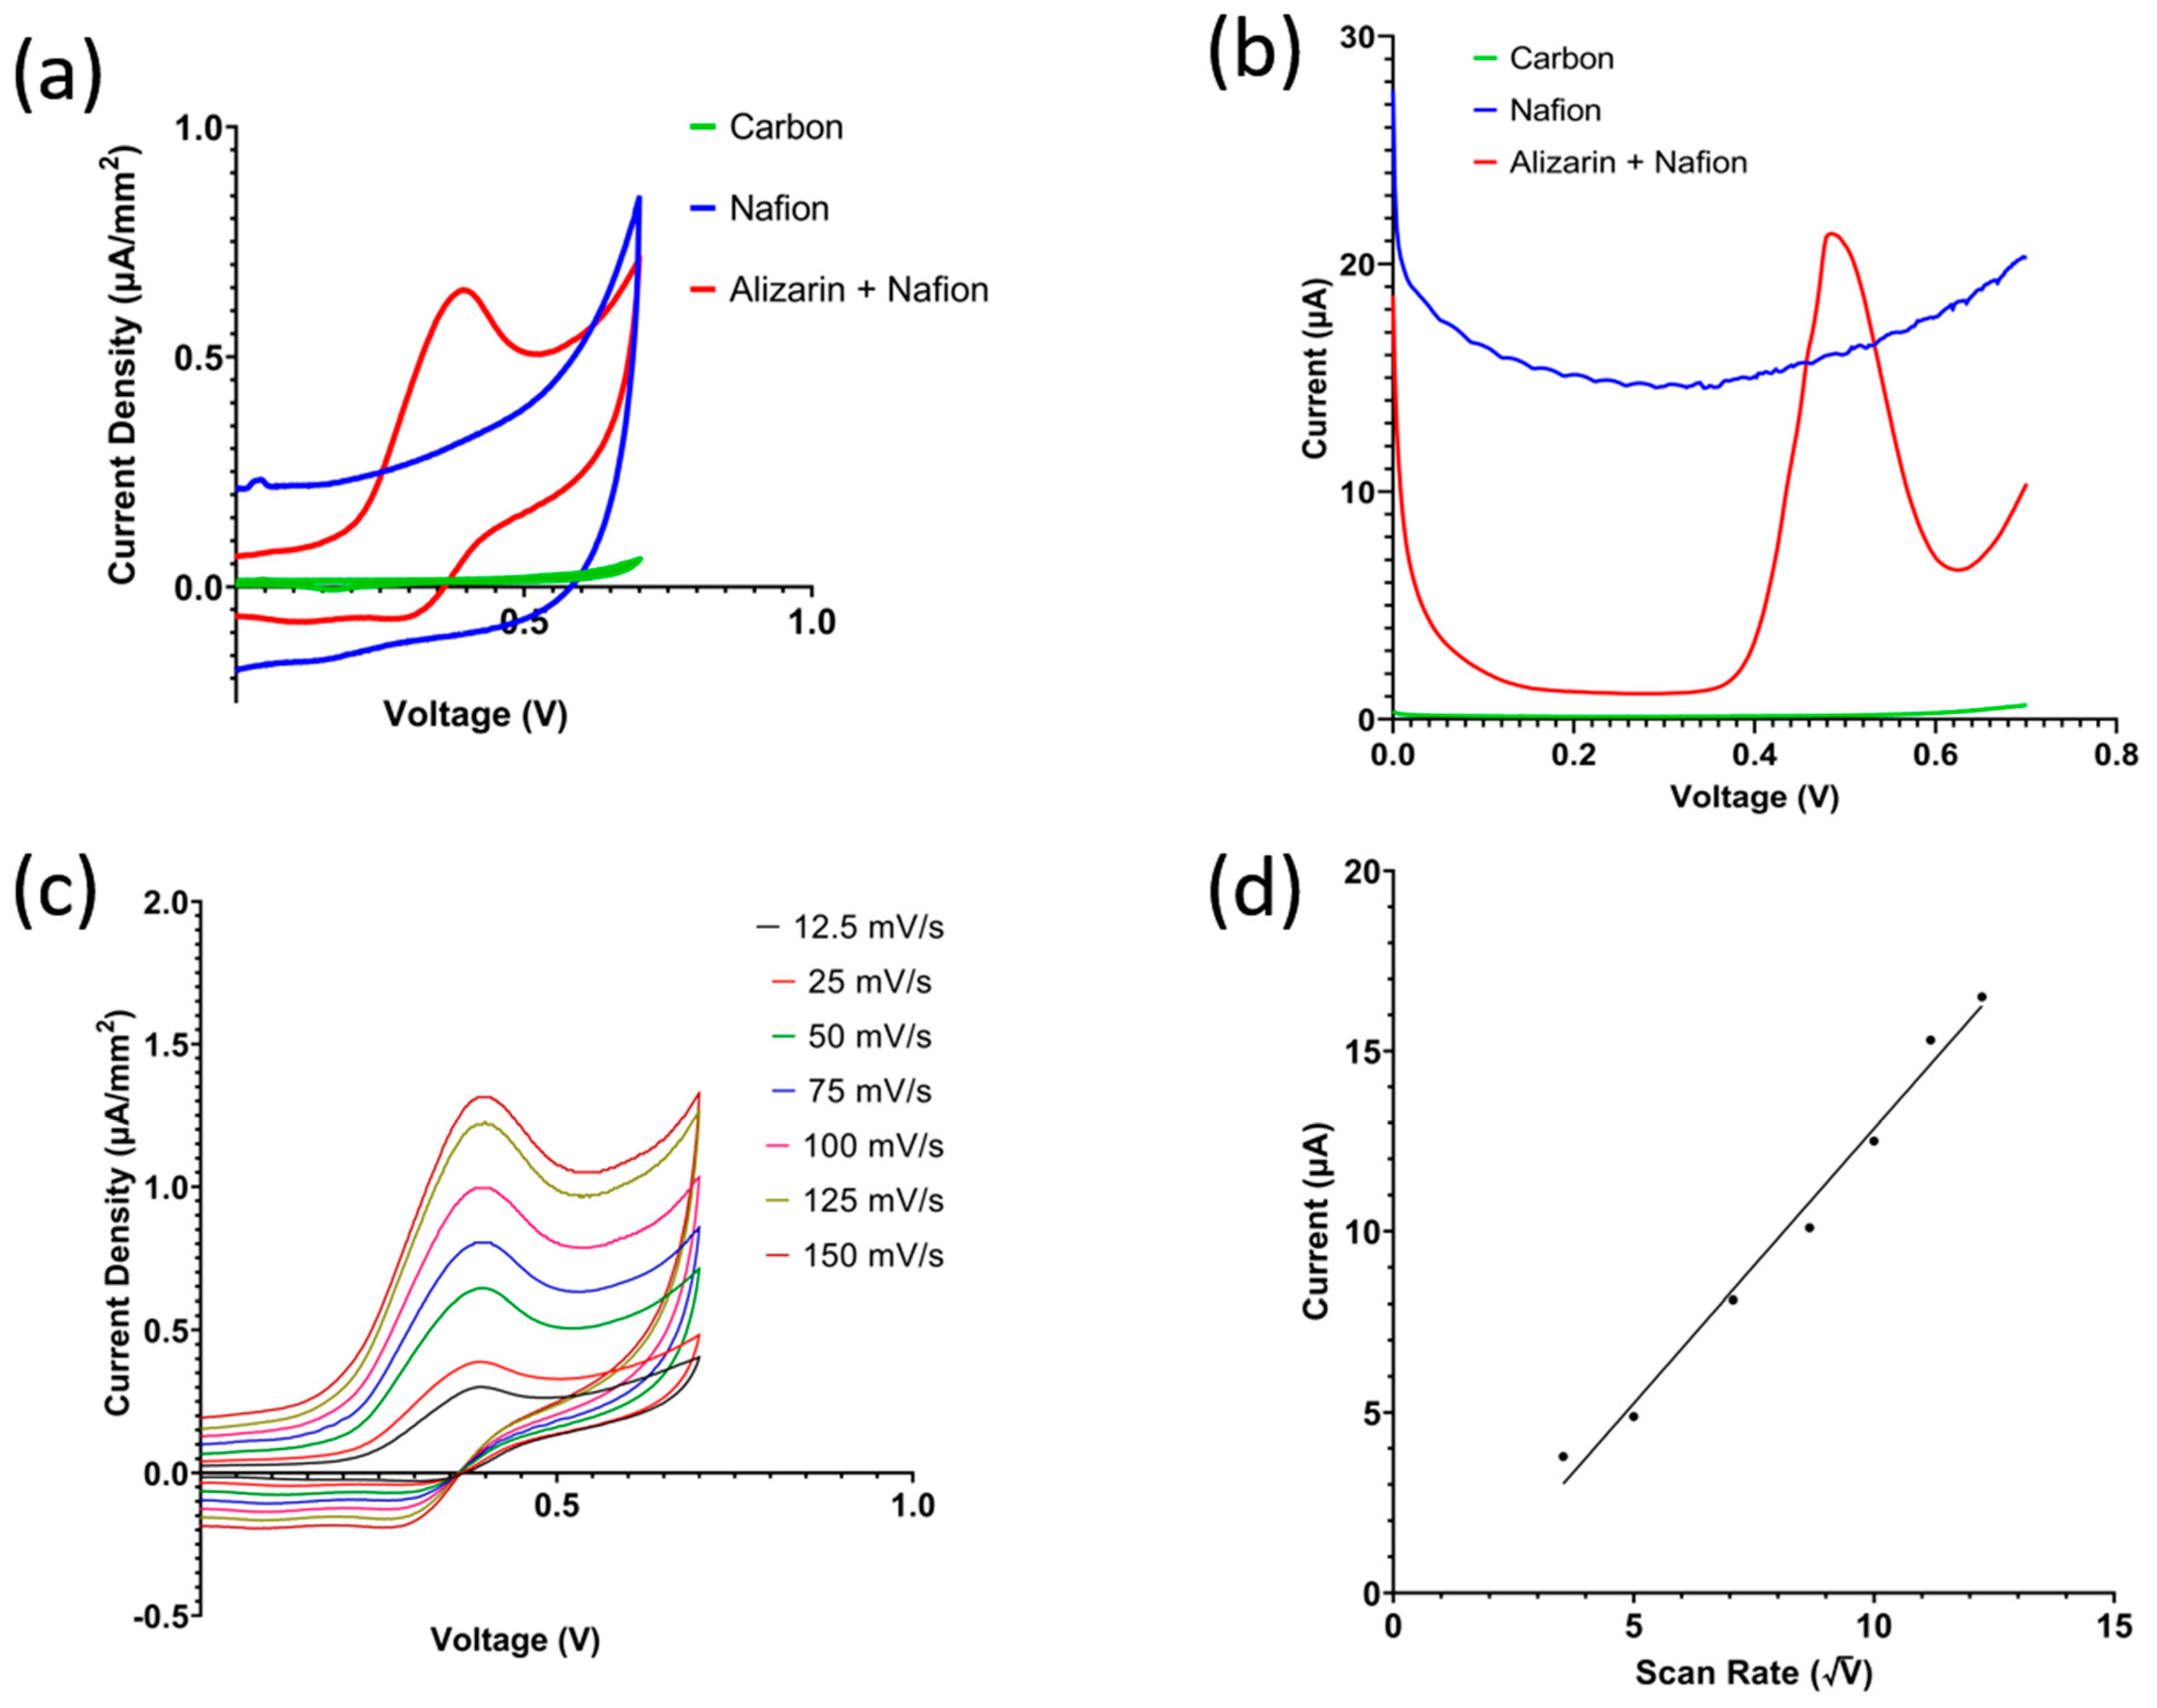
3.2. Electrochemical Characterization
3.3. Electrochemical Impedance Spectroscopy
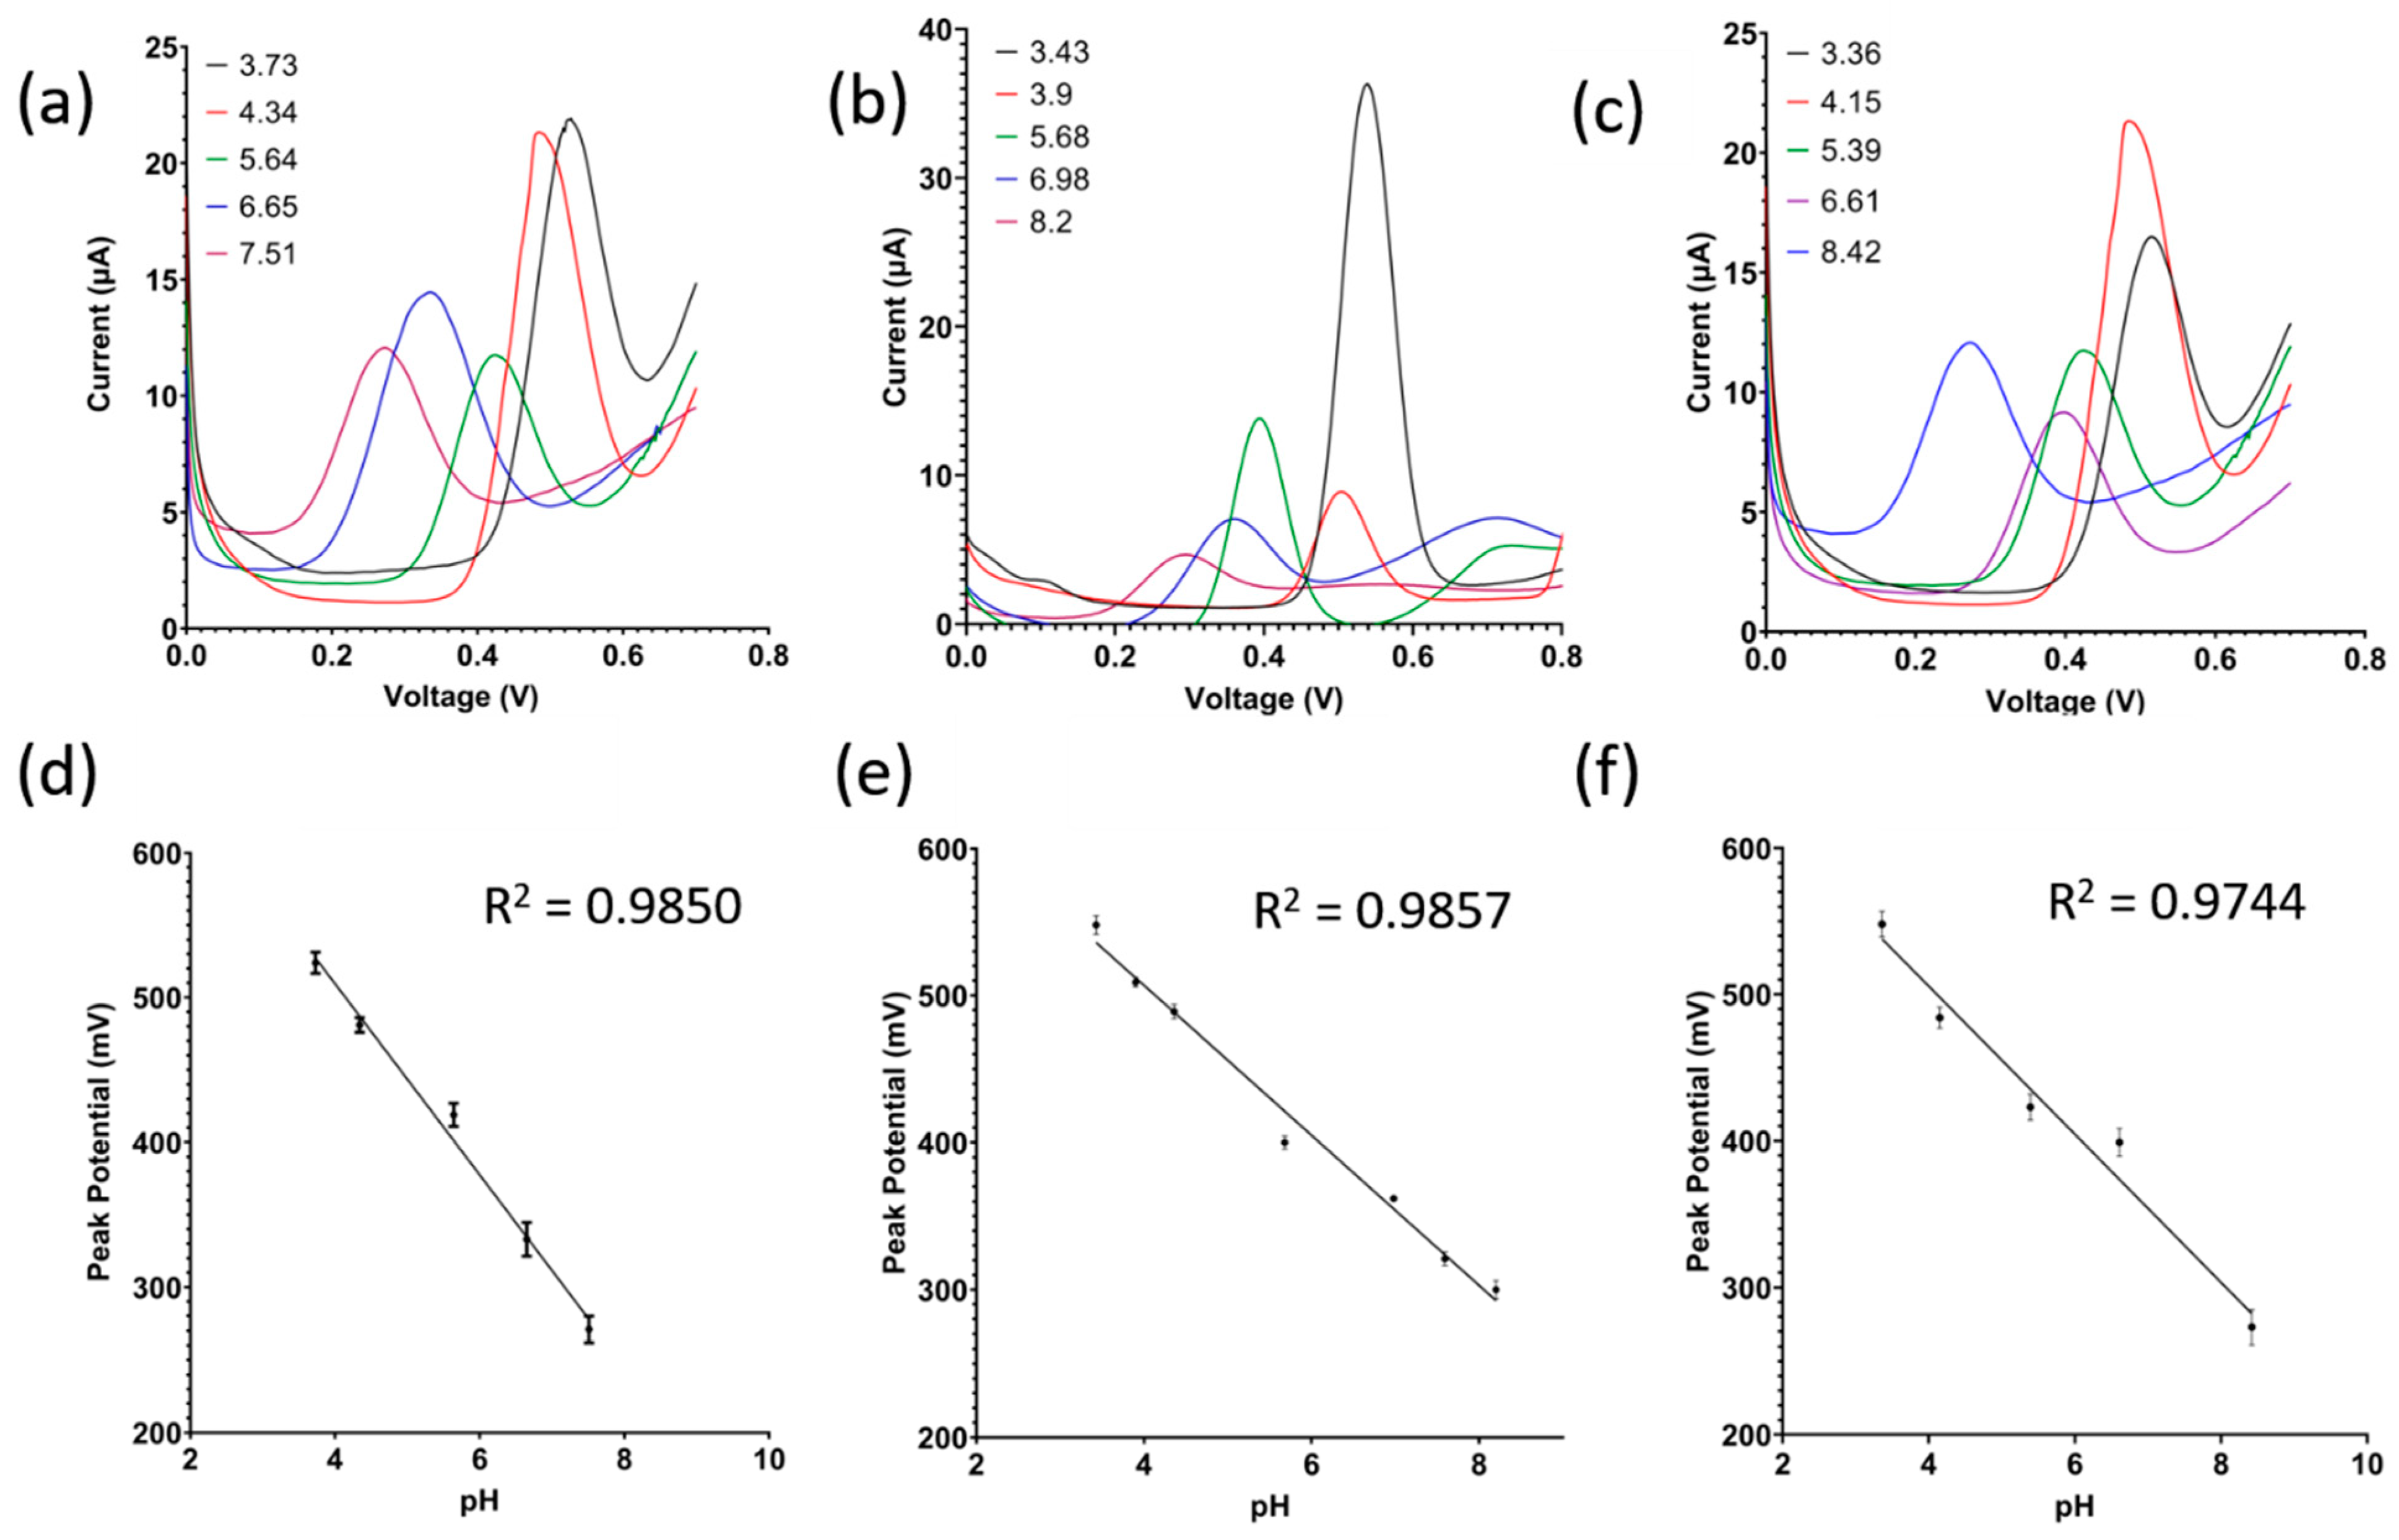
3.4. Squarewave Voltammetry Study
3.5. Validation
3.6. Real-Time Continuous In Situ Soil pH Monitoring
4. Conclusions
Supplementary Materials
Author Contributions
Funding
Data Availability Statement
Conflicts of Interest
References
- United Nations. SDG Indicators; UN: New York, NY, USA, 2021; p. 1095. [Google Scholar] [CrossRef]
- United Nations. The Sustainable Development Goals Report. 2022. Available online: https://unstats.un.org/sdgs/report/2022/The-Sustainable-Development-Goals-Report-2022.pdf (accessed on 6 January 2023).
- Sonderegger, T.; Pfister, S. Global Assessment of Agricultural Productivity Losses from Soil Compaction and Water Erosion. Environ. Sci. Technol. 2021, 55, 12162–12171. [Google Scholar] [CrossRef]
- Fan, Y.; Wang, X.; Funk, T.; Rashid, I.; Herman, B.; Bompoti, N.; Mahmud, S.; Chrysochoou, M.; Yang, M.; Vadas, T.M.; et al. A Critical Review for Real-Time Continuous Soil Monitoring: Advantages, Challenges, and Perspectives. Environ. Sci. Technol. 2022, 56, 13546–13564. [Google Scholar] [CrossRef]
- Muangprathub, J.; Boonnam, N.; Kajornkasirat, S.; Lekbangpong, N.; Wanichsombat, A.; Nillaor, P. IoT and agriculture data analysis for smart farm. Comput. Comput. Electron. Agric. 2019, 156, 467–474. [Google Scholar] [CrossRef]
- Deng, F.; Zuo, P.; Wen, K.; Wu, X. Novel soil environment monitoring system based on RFID sensor and LoRa. Electron. Agric. 2020, 169, 105169. [Google Scholar] [CrossRef]
- Joly, M.; Marlet, M.; Durieu, C.; Bene, C.; Launay, J.; Temple-Boyer, P. Study of chemical field effect transistors for the detection of ammonium and nitrate ions in liquid and soil phases. Sens. Actuators B Chem. 2022, 351, 130949. [Google Scholar] [CrossRef]
- Patil, S.; Ghadi, H.; Ramgir, N.; Adhikari, A.; Rao, V.R. Monitoring soil pH variation using Polyaniline/SU-8 composite film based conductometric microsensor. Sens. Actuators B Chem. 2019, 286, 583–590. [Google Scholar] [CrossRef]
- Lu, Q.; Tian, S.; Wei, L. Digital mapping of soil pH and carbonates at the European scale using environmental variables and machine learning. Sci. Total Environ. 2023, 856, 159171. [Google Scholar] [CrossRef] [PubMed]
- Shi, Y.; Li, Y.; Yang, T.; Chu, H. Threshold effects of soil pH on microbial co-occurrence structure in acidic and alkaline arable lands. Sci. Total Environ. 2021, 800, 149592. [Google Scholar] [CrossRef]
- Sumner, D.R. Soil pH and Plant Productivity. In Handbook of Agricultural Productivity; CRC Press: Boca Raton, FL, USA, 2018; Volume I, pp. 71–84. [Google Scholar] [CrossRef]
- Gao, X.; Rodrigues, S.M.; Spielman-Sun, E.; Lopes, S.P.; Rodrigues, S.; Zhang, Y.; Avellan, A.; Duarte, R.M.; Duarte, A.C.; Casman, E.A.; et al. Effect of Soil Organic Matter, Soil pH, and Moisture Content on Solubility and Dissolution Rate of CuO NPs in Soil. Environ. Sci. Technol. 2019, 53, 4959–4967. [Google Scholar] [CrossRef]
- Shakoor, A.; Arif, M.S.; Shahzad, S.M.; Farooq, T.H.; Ashraf, F.; Altaf, M.M.; Ahmed, W.; Tufail, M.A.; Ashraf, M. Does biochar accelerate the mitigation of greenhouse gaseous emissions from agricultural soil?—A global meta-analysis. Environ. Res. 2021, 202, 111789. [Google Scholar] [CrossRef]
- C.D. National Institute of Standards and Technology (NIST). NBS Standard Reference Materials Catalog 1986–1987. govinfo.gov; Jan. 1986. Available online: https://nvlpubs.nist.gov/nistpubs/Legacy/SP/nbsspecialpublication260e1986.pdf (accessed on 17 November 2022).
- Khan, M.I.; Mukherjee, K.; Shoukat, R.; Dong, H. A review on pH sensitive materials for sensors and detection methods. Microsyst. Technol. 2017, 23, 4391–4404. [Google Scholar] [CrossRef]
- Palaparthy, V.S.; Baghini, M.S.; Singh, D.N. Review of polymer-based sensors for agriculture-related applications. Emerg. Mater. Res. 2013, 2, 166–180. [Google Scholar] [CrossRef]
- Ohmura, K.; Thürlimann, C.M.; Kipf, M.; Carbajal, J.P.; Villez, K. Characterizing long-term wear and tear of ion-selective pH sensors. Water Sci. Technol. 2019, 80, 541–550. [Google Scholar] [CrossRef] [PubMed]
- Khanal, S.; Fulton, J.; Klopfenstein, A.; Douridas, N.; Shearer, S. Integration of high resolution remotely sensed data and machine learning techniques for spatial prediction of soil properties and corn yield. Comput. Electron. Agric. 2018, 153, 213–225. [Google Scholar] [CrossRef]
- Dai, C.; Song, P.; Wadhawan, J.D.; Fisher, A.C.; Lawrence, N.S. Screen Printed Alizarin-Based Carbon Electrodes: Monitoring pH in Unbuffered Media. Electroanalysis 2015, 27, 917–923. [Google Scholar] [CrossRef]
- Singh, M.; Patkar, R.S.; Vinchurkar, M.; Baghini, M.S. Cost Effective Soil pH Sensor Using Carbon-Based Screen-Printed Electrodes. IEEE Sens. J. 2020, 20, 47–54. [Google Scholar] [CrossRef]
- Yoon, J.H.; Hong, S.B.; Yun, S.-O.; Lee, S.J.; Lee, T.J.; Lee, K.G.; Choi, B.G. High performance flexible pH sensor based on polyaniline nanopillar array electrode. J. Colloid Interface Sci. 2017, 490, 53–58. [Google Scholar] [CrossRef] [PubMed]
- Srinivas, S.; Ashokkumar, K.; Sriraghavan, K.; Kumar, A.S. A prototype device of microliter volume voltammetric pH sensor based on carbazole–quinone redox-probe tethered MWCNT modified three-in-one screen-printed electrode. Sci. Rep. 2021, 11, 13905. [Google Scholar] [CrossRef]
- Dhamu, V.N.; Paul, A.; Muthukumar, S.; Prasad, S. DENSE: DiElectric Novel Soil Evaluation System to Electrochemically Profile Soil Matrices. J. Electrochem. Soc. 2022, 169, 067511. [Google Scholar] [CrossRef]
- Dai, C.; Chan, C.-W.I.; Barrow, W.; Smith, A.; Song, P.; Potier, F.; Wadhawan, J.D.; Fisher, A.C.; Lawrence, N.S. A Route to Unbuffered pH Monitoring: A Novel Electrochemical Approach. Electrochim. Acta 2016, 190, 879–886. [Google Scholar] [CrossRef]
- Eldeeb, M.A.; Dhamu, V.N.; Paul, A.; Muthukumar, S.; Prasad, S. Electrochemical Soil Nitrate Sensor for In Situ Real-Time Monitoring. Micromachines 2023, 14, 1314. [Google Scholar] [CrossRef] [PubMed]
- Bard, A.J.; Faulkner, L.R.; White, H.S. Electrochemical Methods: Fundamentals and Applications, 2nd ed.; Wiley: New York, NY, USA, 2008. [Google Scholar]


| Compound | EHOMO (Hartree) | ELUMO (Hartree) |
|---|---|---|
| Alizarin | −0.31812 | +0.04172 |
| Water | −0.43743 | +0.14940 |
| Alizarin–water | −0.31002 | +0.04603 |
| Sample # | Soil Type | Calibration Curve | Reference pH (01.12.22) | Measured pH (06.09.22) | Std. Dev. | Error (%) |
| 1S1 | Sandy Loam | Sandy Loam | 6.15 | 6.48 | 0.43 | 5.43 |
| 1S2 | Clay Loam | Clay | 8.28 | 7.62 | 0.32 | 7.94 |
| 1S4 | Sandy Clay Loam | Clay | 7.54 | 7.59 | 0.11 | 0.63 |
| 1S3 | Sandy Clay Loam | Clay | 8.17 | 7.39 | 0.02 | 9.60 |
| Sample # | Soil Type | Calibration Curve | Reference pH (03.19.22) | Measured pH (06.09.22) | Std. Dev. | Error (%) |
| 2S2 | Clay | Clay | 6.48 | 6.15 | 0.21 | 5.11 |
| 2S1 | Sandy Clay | Sandy Loam | 8.34 | 7.93 | 0.09 | 4.94 |
| 2S4 | Sandy Loam | Sandy Loam | 7.53 | 7.61 | 0.29 | 1.03 |
| Descriptive Statistics | Bucket 1 | Bucket 2 | ||
| Number of values | 42 | 42 | ||
| Mean | 8.976 | 4.746 | ||
| Std. Deviation | 0.169 | 0.045 | ||
| Std. Error of Mean | 0.0261 | 0.0069 | ||
| Coefficient of variation | 1.885% | 0.945% | ||
| Validation | Measured | Reference | Measured | Reference |
| Mean | 8.976 | 8.36 | 4.746 | 5.05 |
| Std. Deviation | 0.169 | 0.08 | 0.045 | 0.03 |
| Error rate | 7.37% | 6.02% | ||
Disclaimer/Publisher’s Note: The statements, opinions and data contained in all publications are solely those of the individual author(s) and contributor(s) and not of MDPI and/or the editor(s). MDPI and/or the editor(s) disclaim responsibility for any injury to people or property resulting from any ideas, methods, instructions or products referred to in the content. |
© 2023 by the authors. Licensee MDPI, Basel, Switzerland. This article is an open access article distributed under the terms and conditions of the Creative Commons Attribution (CC BY) license (https://creativecommons.org/licenses/by/4.0/).
Share and Cite
Eldeeb, M.A.; Dhamu, V.N.; Paul, A.; Muthukumar, S.; Prasad, S. Espial: Electrochemical Soil pH Sensor for In Situ Real-Time Monitoring. Micromachines 2023, 14, 2188. https://doi.org/10.3390/mi14122188
Eldeeb MA, Dhamu VN, Paul A, Muthukumar S, Prasad S. Espial: Electrochemical Soil pH Sensor for In Situ Real-Time Monitoring. Micromachines. 2023; 14(12):2188. https://doi.org/10.3390/mi14122188
Chicago/Turabian StyleEldeeb, Mohammed A., Vikram Narayanan Dhamu, Anirban Paul, Sriram Muthukumar, and Shalini Prasad. 2023. "Espial: Electrochemical Soil pH Sensor for In Situ Real-Time Monitoring" Micromachines 14, no. 12: 2188. https://doi.org/10.3390/mi14122188
APA StyleEldeeb, M. A., Dhamu, V. N., Paul, A., Muthukumar, S., & Prasad, S. (2023). Espial: Electrochemical Soil pH Sensor for In Situ Real-Time Monitoring. Micromachines, 14(12), 2188. https://doi.org/10.3390/mi14122188