

Temperature Compensation of SAW Winding Tension Sensor Based on PSO-LSSVM Algorithm


Abstract
:1. Introduction
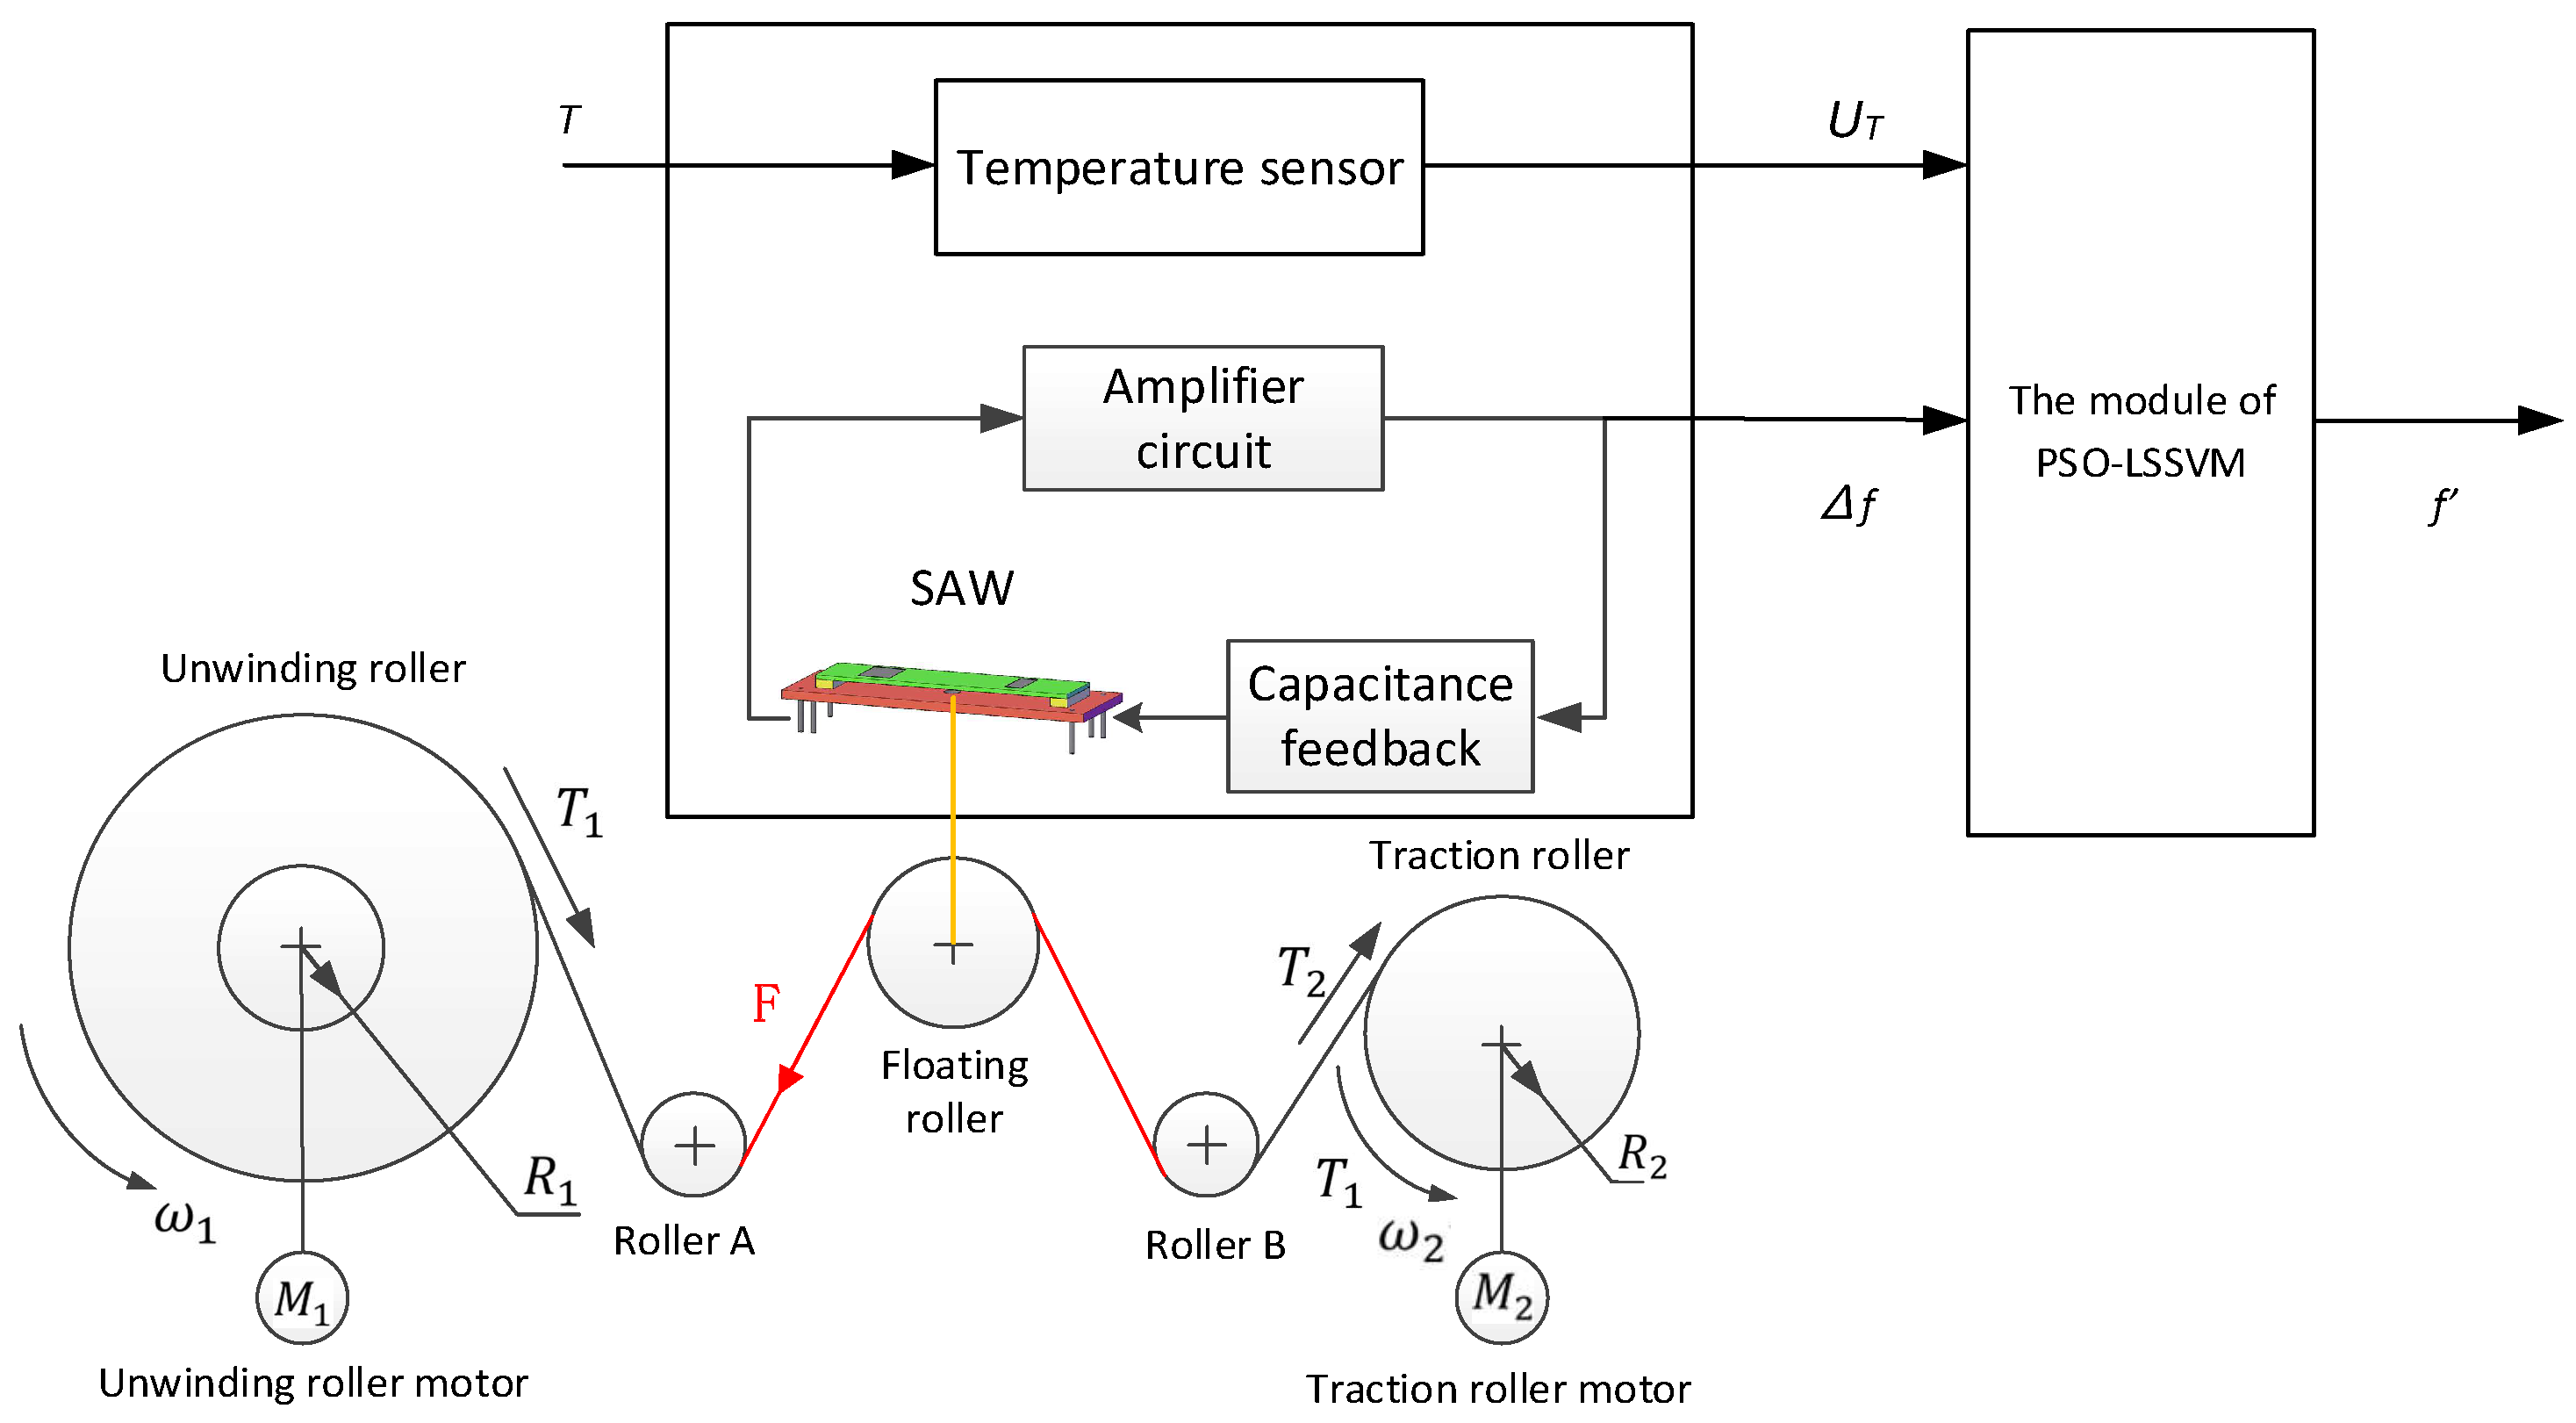
2. Principle of Temperature Compensation for SAW Winding Tension Sensor by Using PSO-LSSVM
- (1)
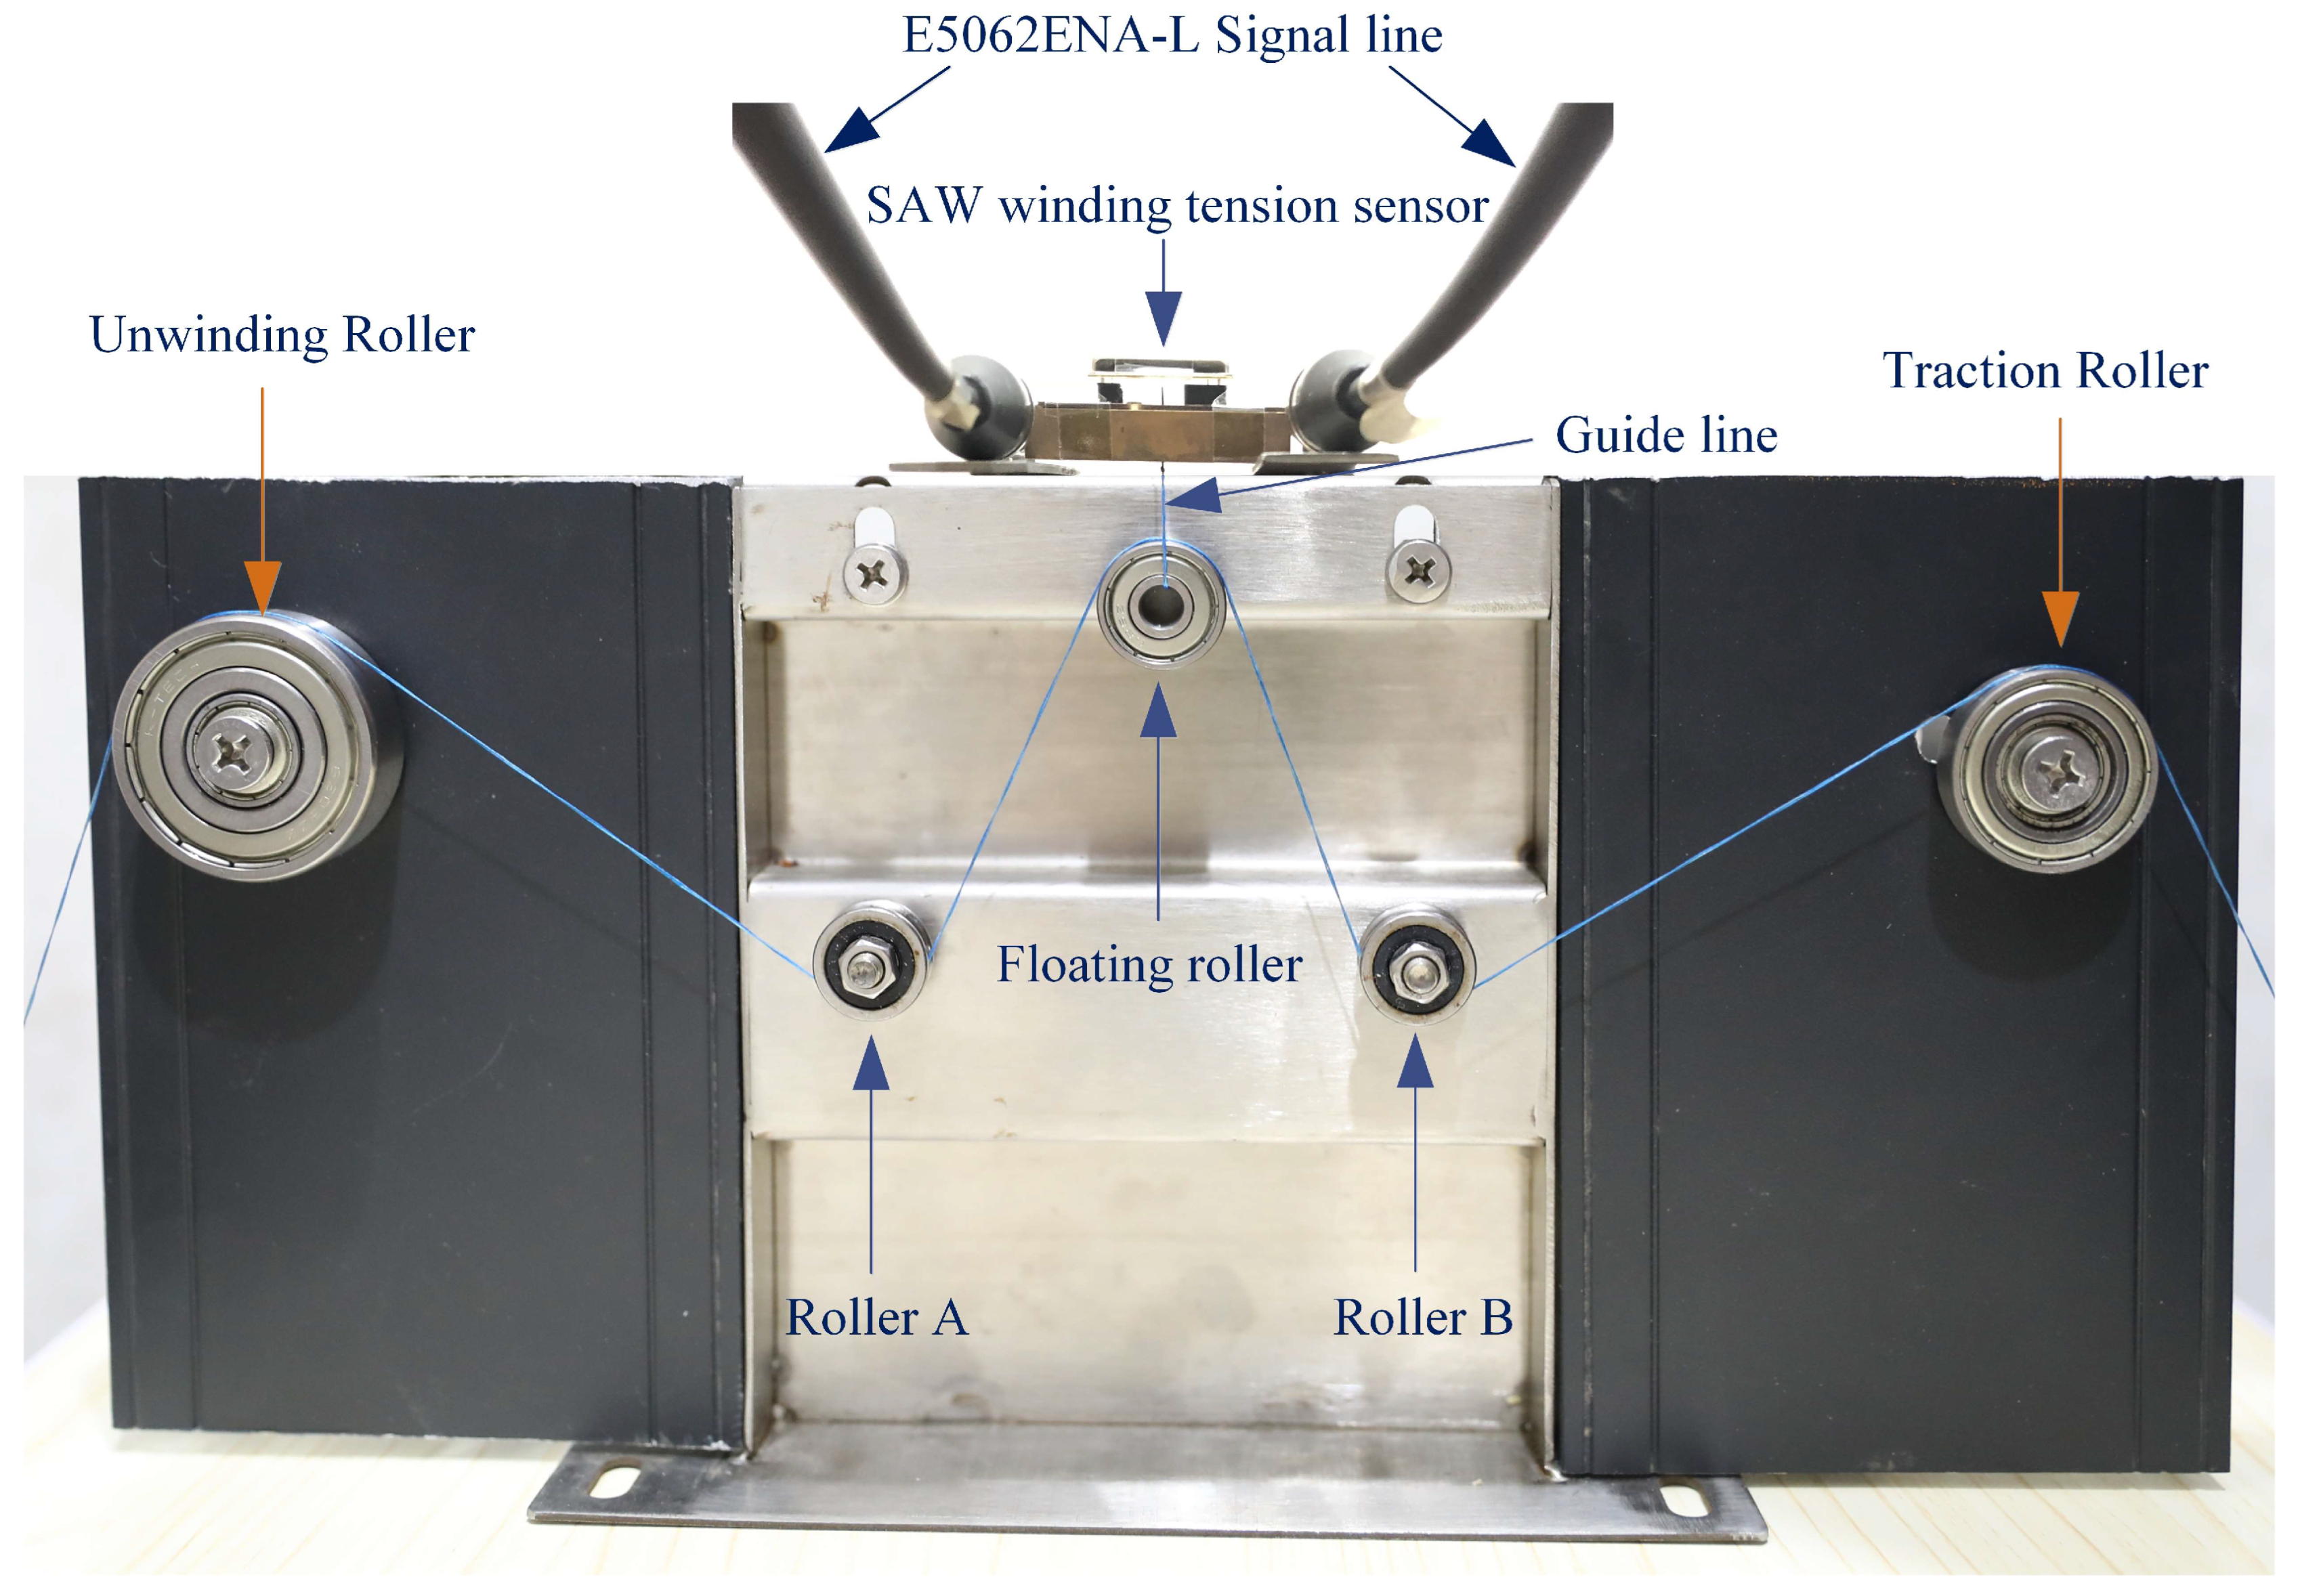
- The unwinding roller motor drives the unwinding roller, and the traction roller motor drives the traction roller to work, causing the tension change of the coil. Finally, the surface acoustic wave device changes through the floating roller;
- (2)
- The surface acoustic wave winding tension sensor is a delay device composed of an amplifier and feedback circuit. The working environment temperature should be detected by a temperature sensor, which is installed beside the SAW winding tension sensor;
- (3)
- The model of eliminating temperature interference of the surface acoustic wave winding tension sensor is based on the data fusion of the PSO-LSSVM model, which finally achieves the purpose of temperature compensation of the sensor.
3. Design of SAW Winding Tension Sensor
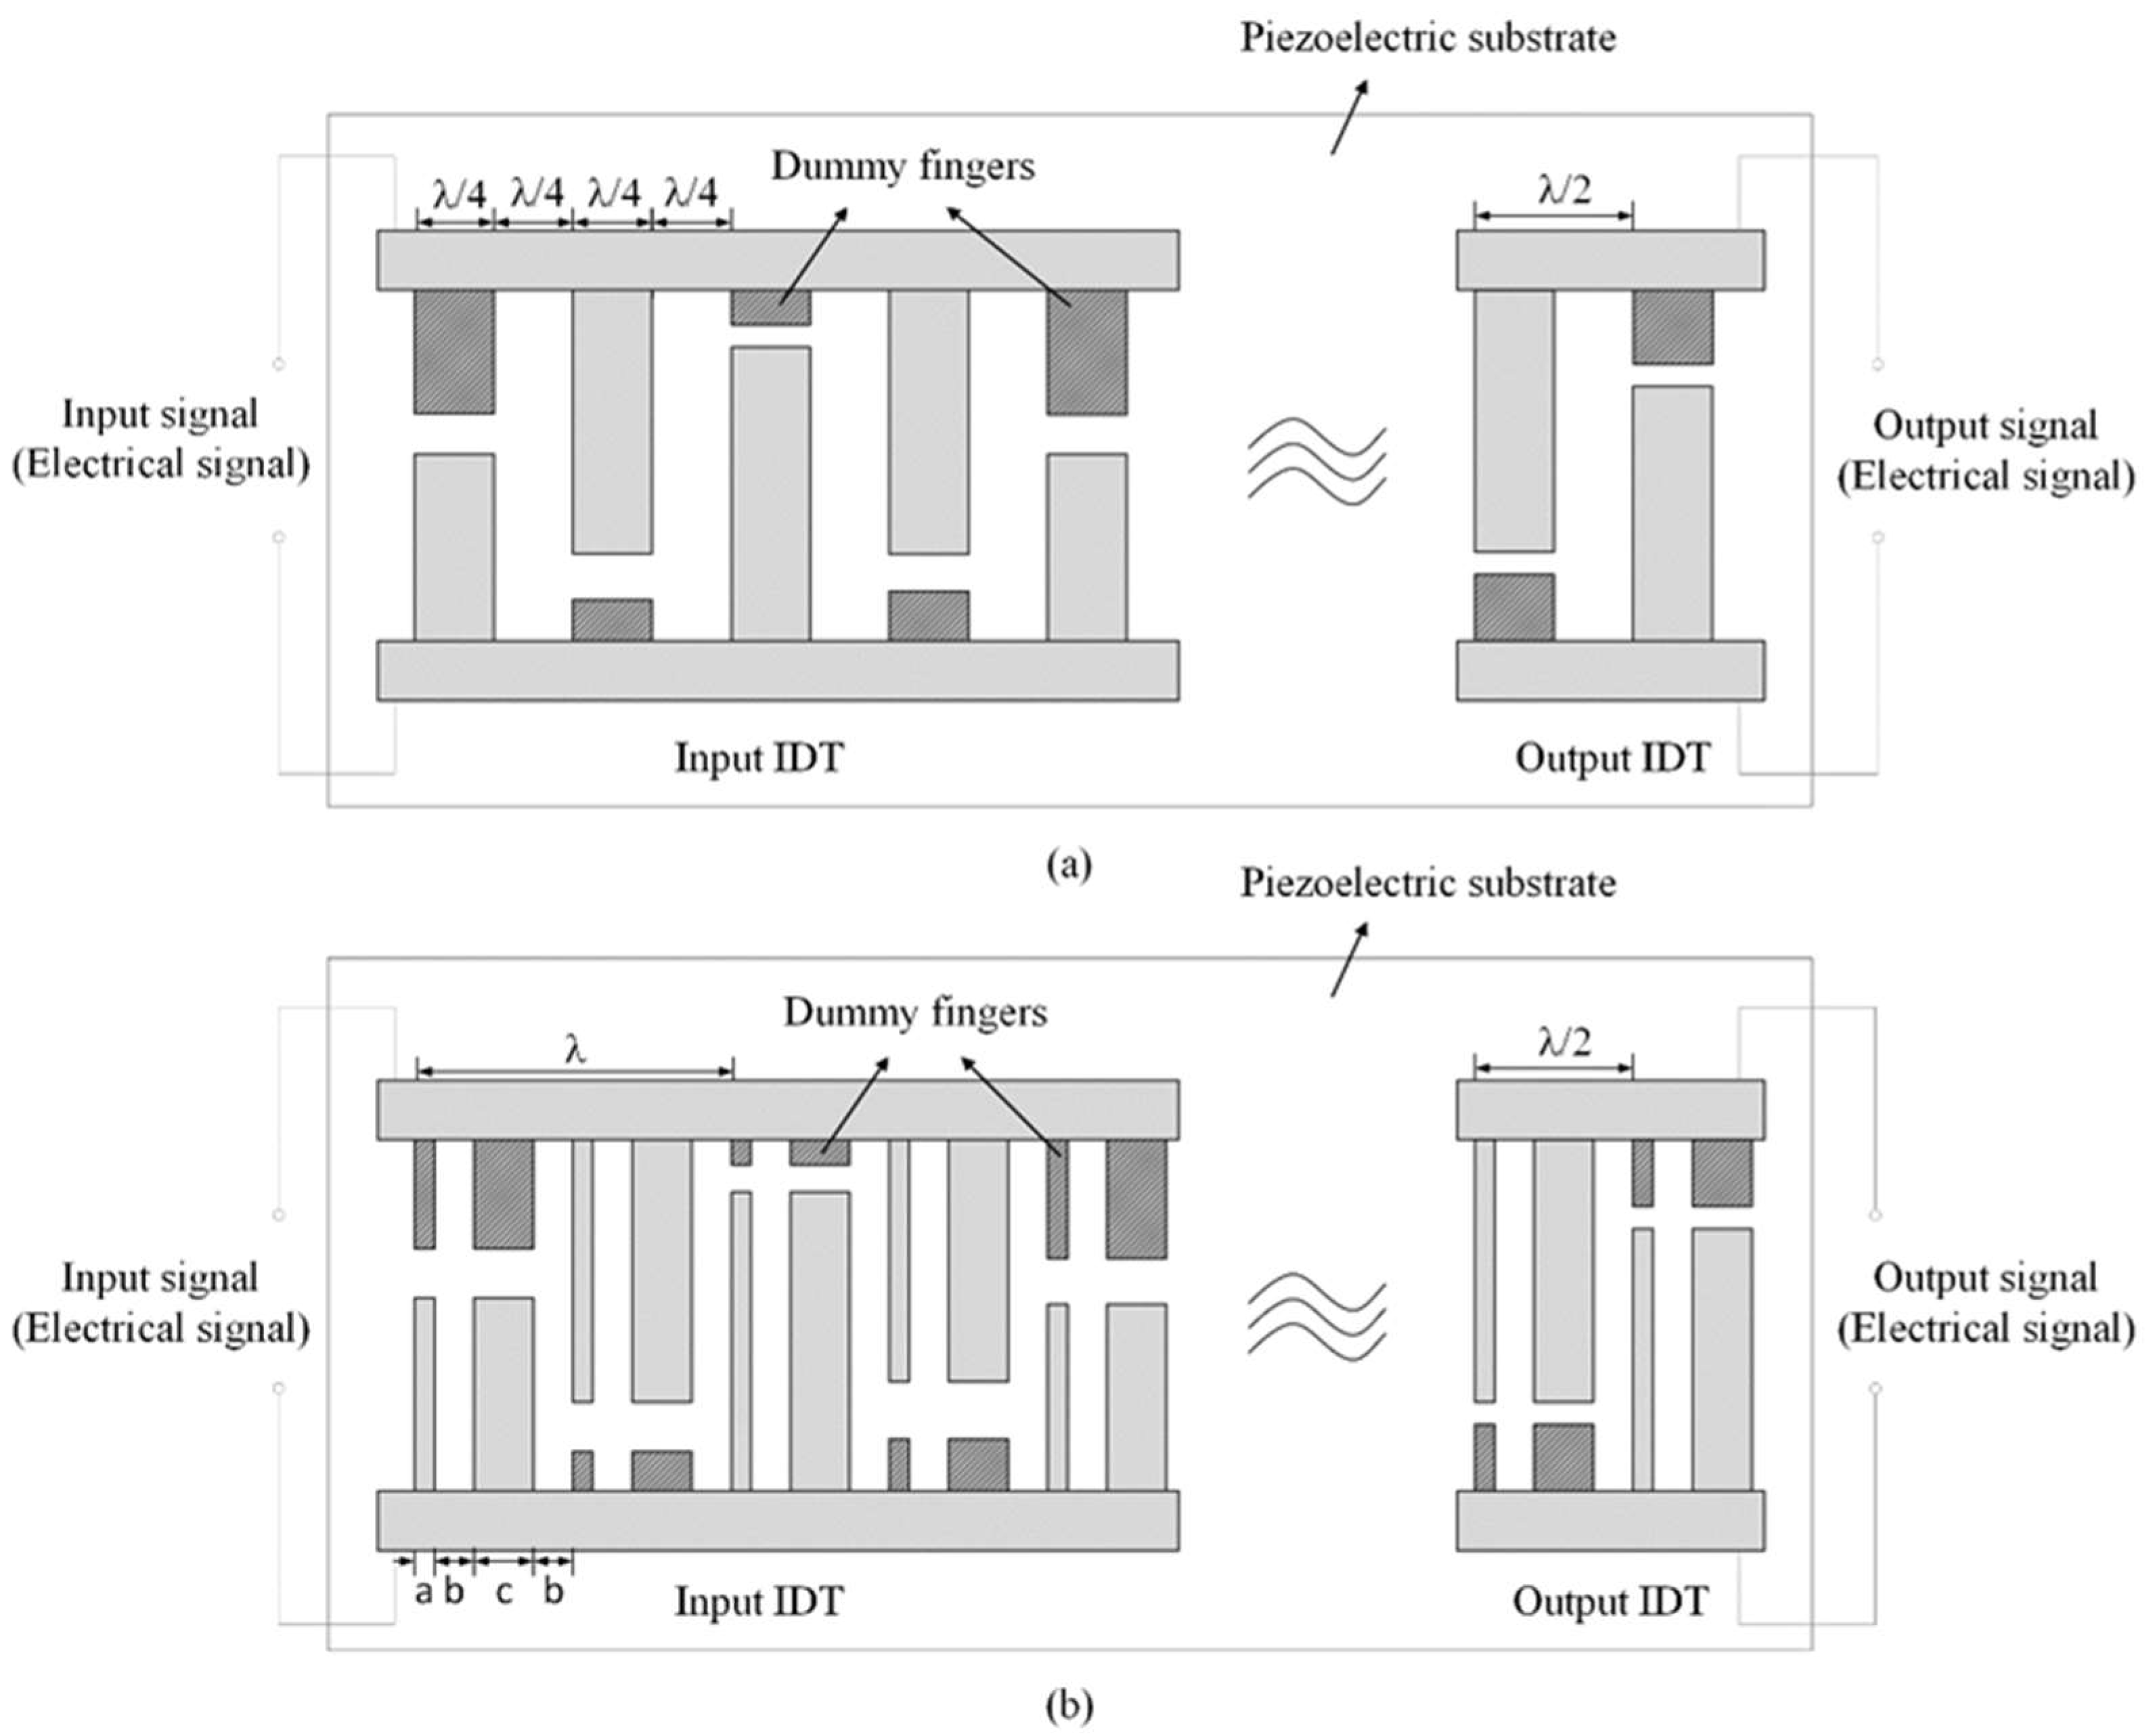
3.1. Design of the Input and Output IDT Using Unbalanced Split-Electrode Interdigital Transducers
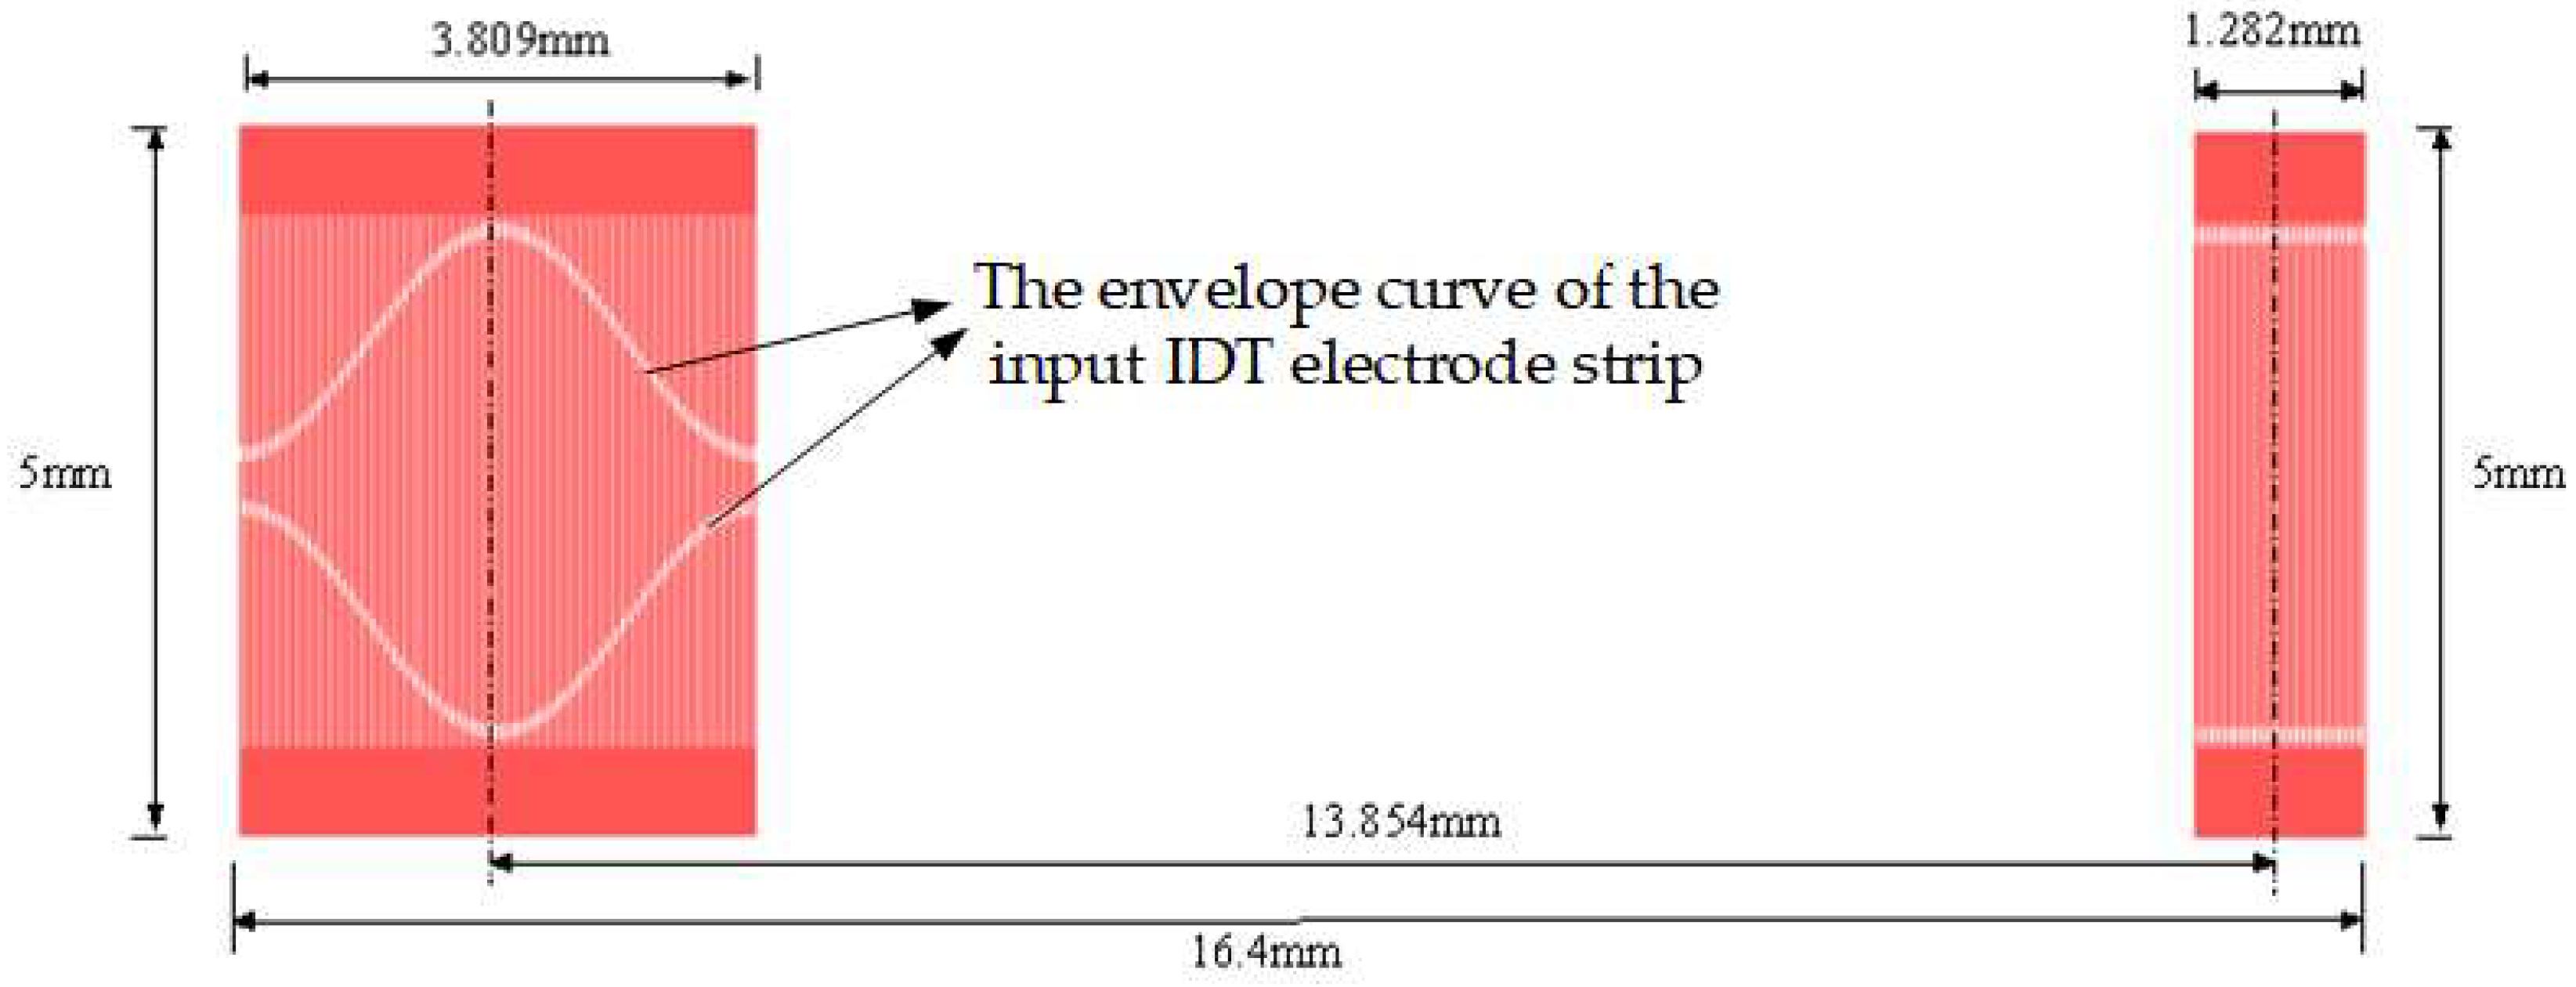
3.2. Design of the Electrode-Overlap Envelope of the Input IDT
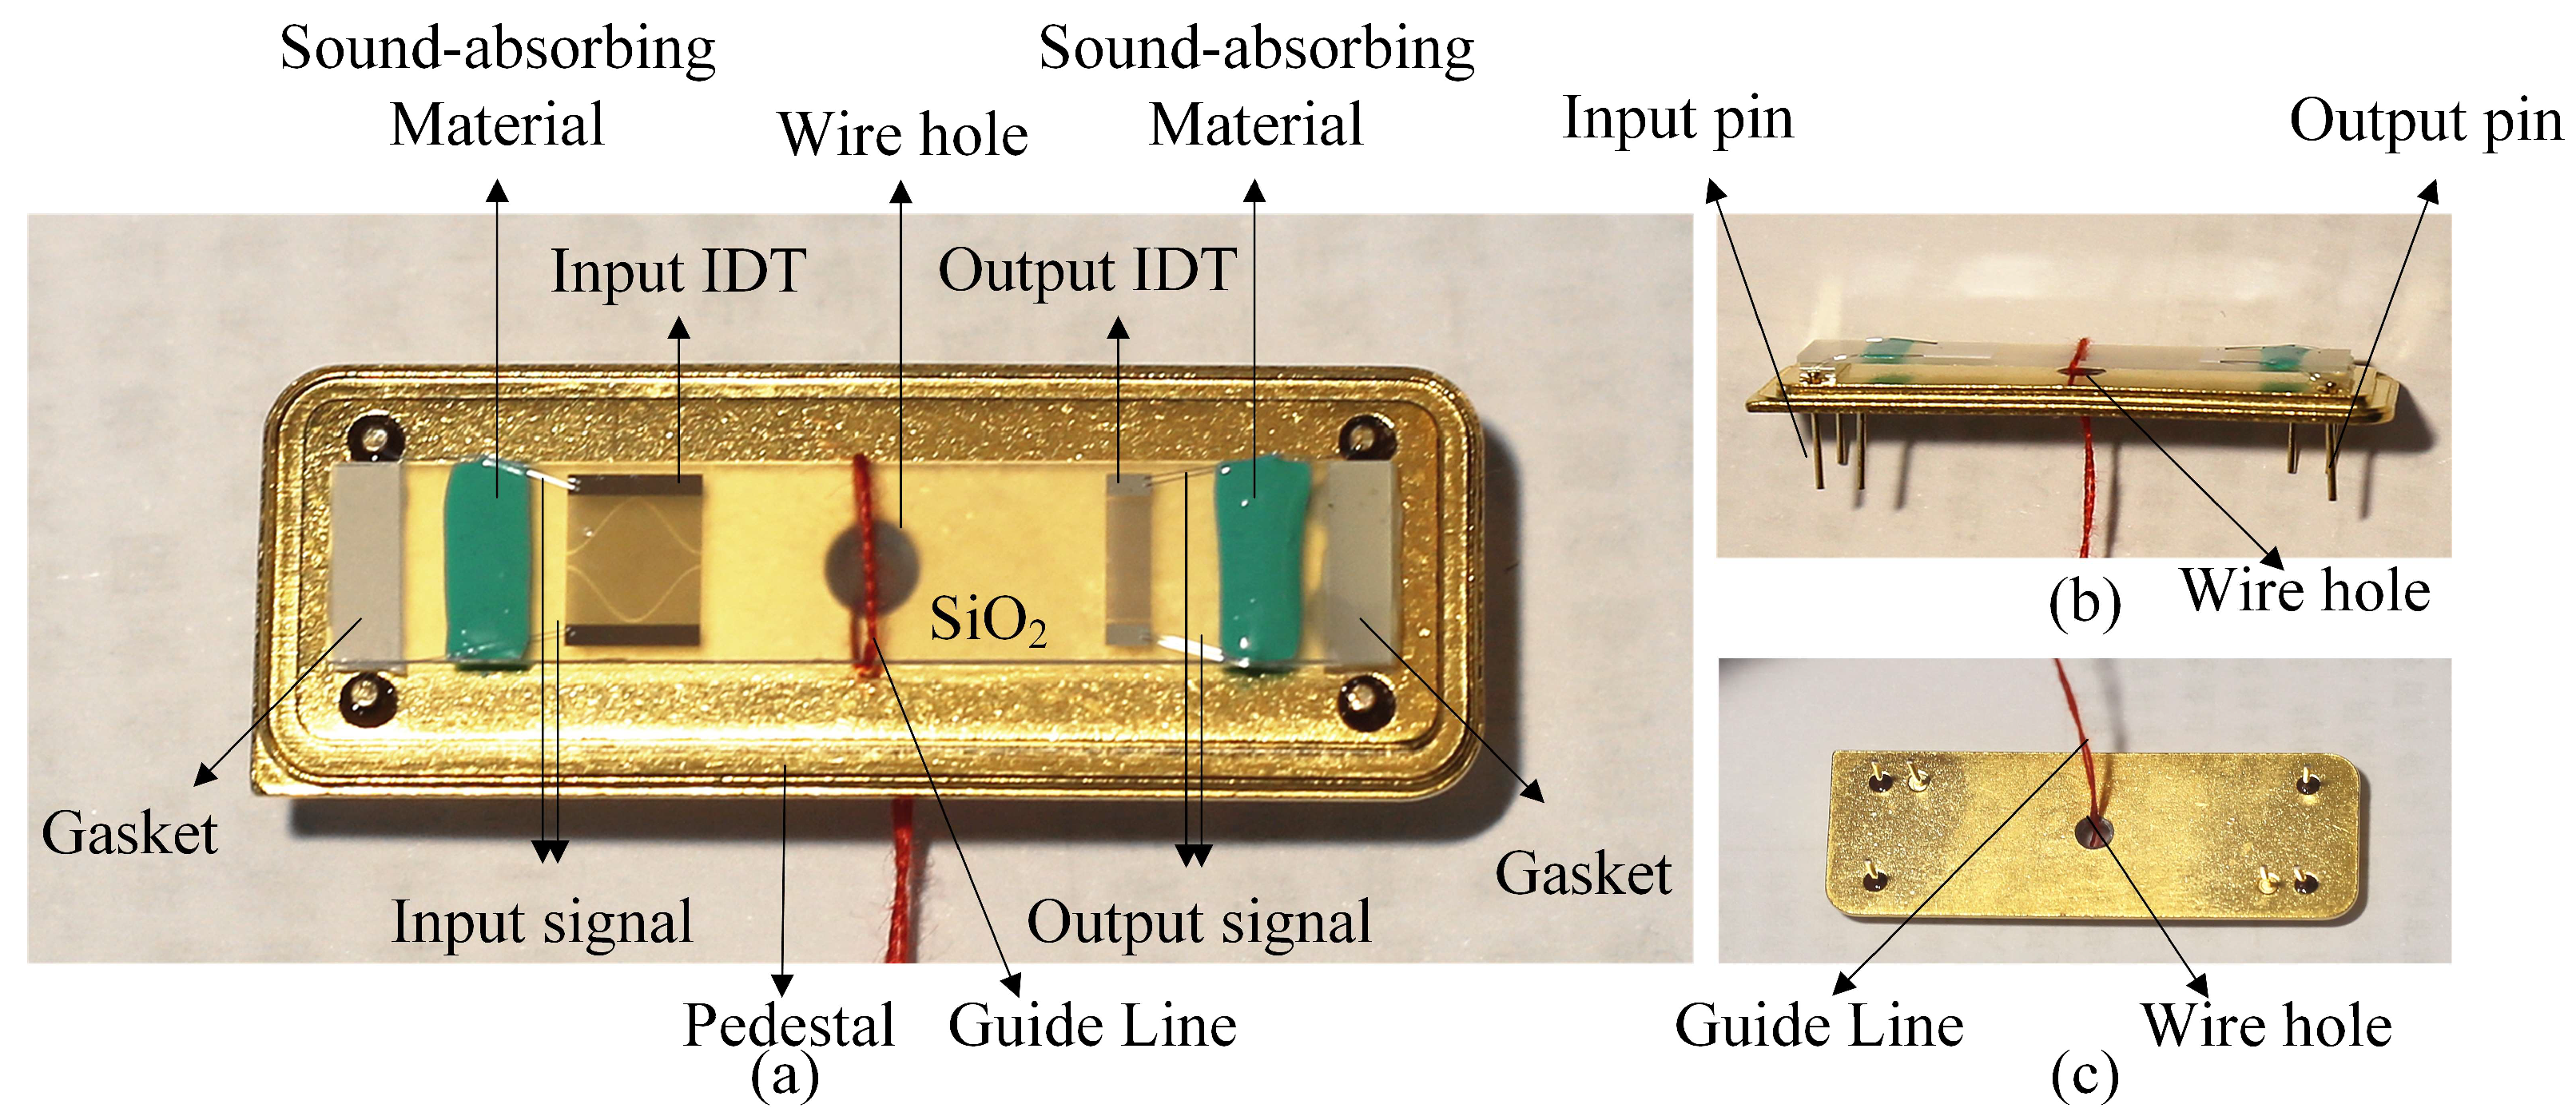
4. Measurement of the SAW Winding Tension Sensor
5. Temperature Compensation Results and Analysis
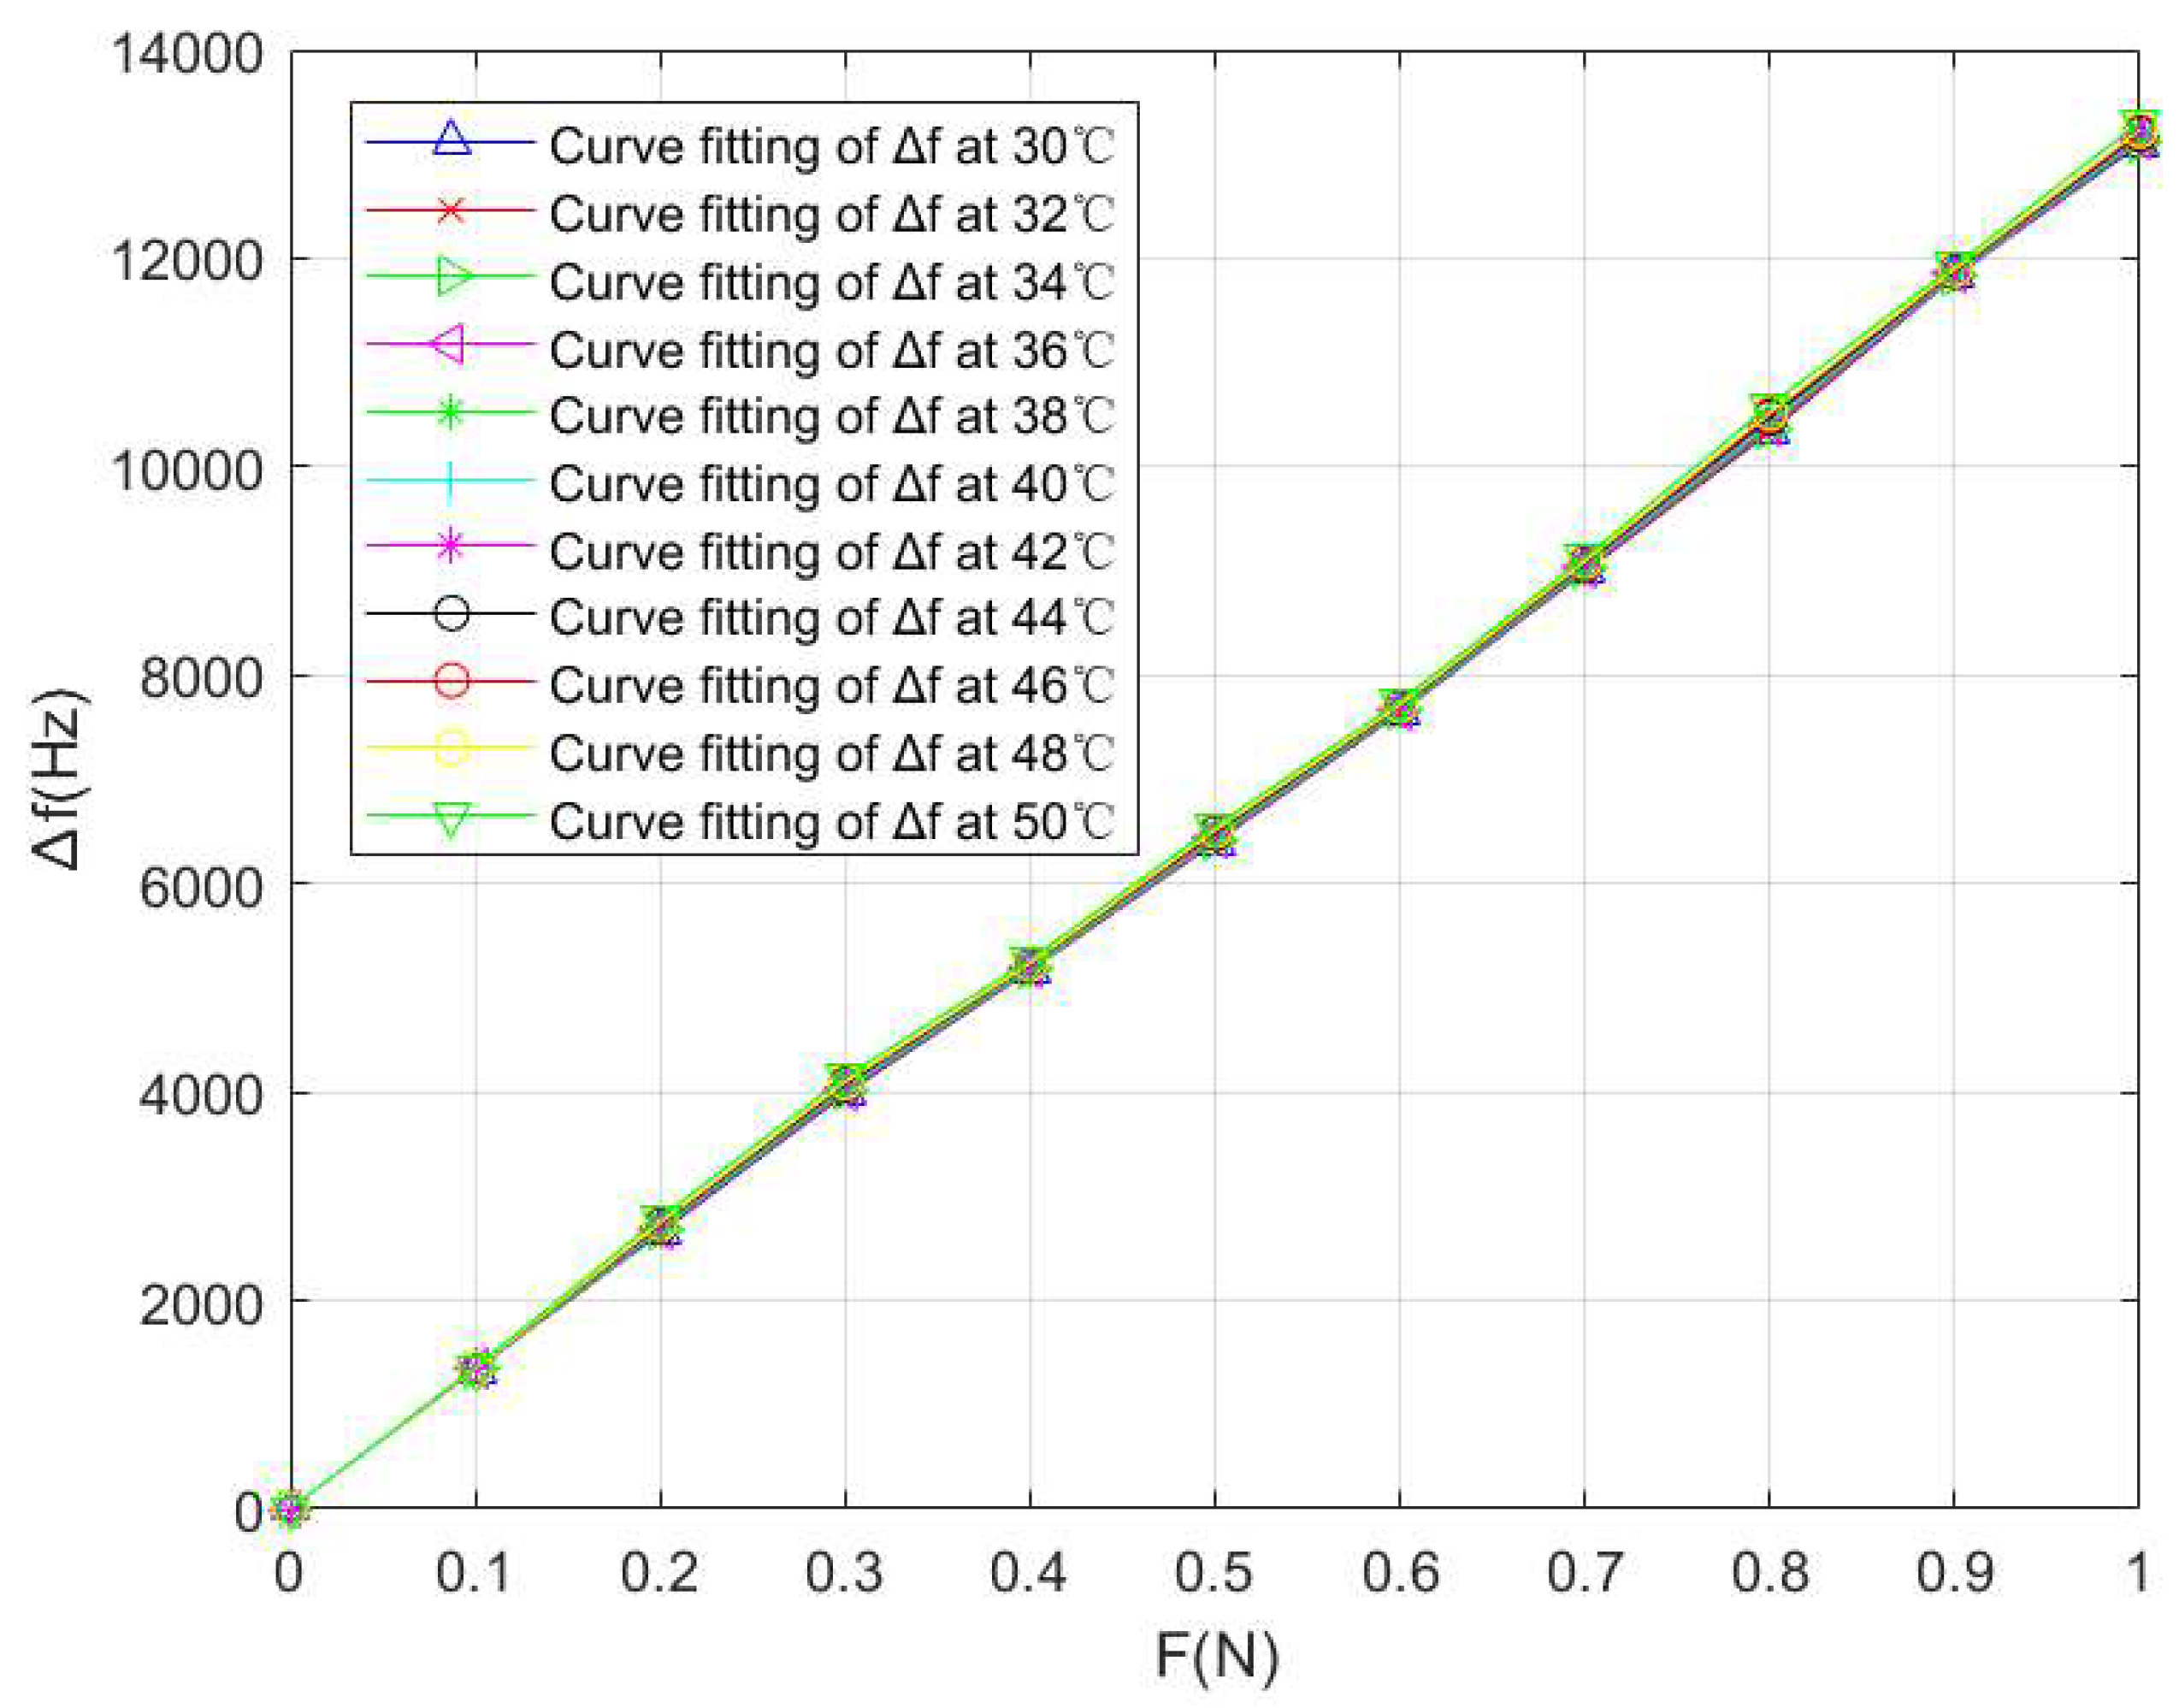
5.1. Training and Prediction of the LSSVM Model
5.2. Principle and Training of the PSO-LSSVM Model
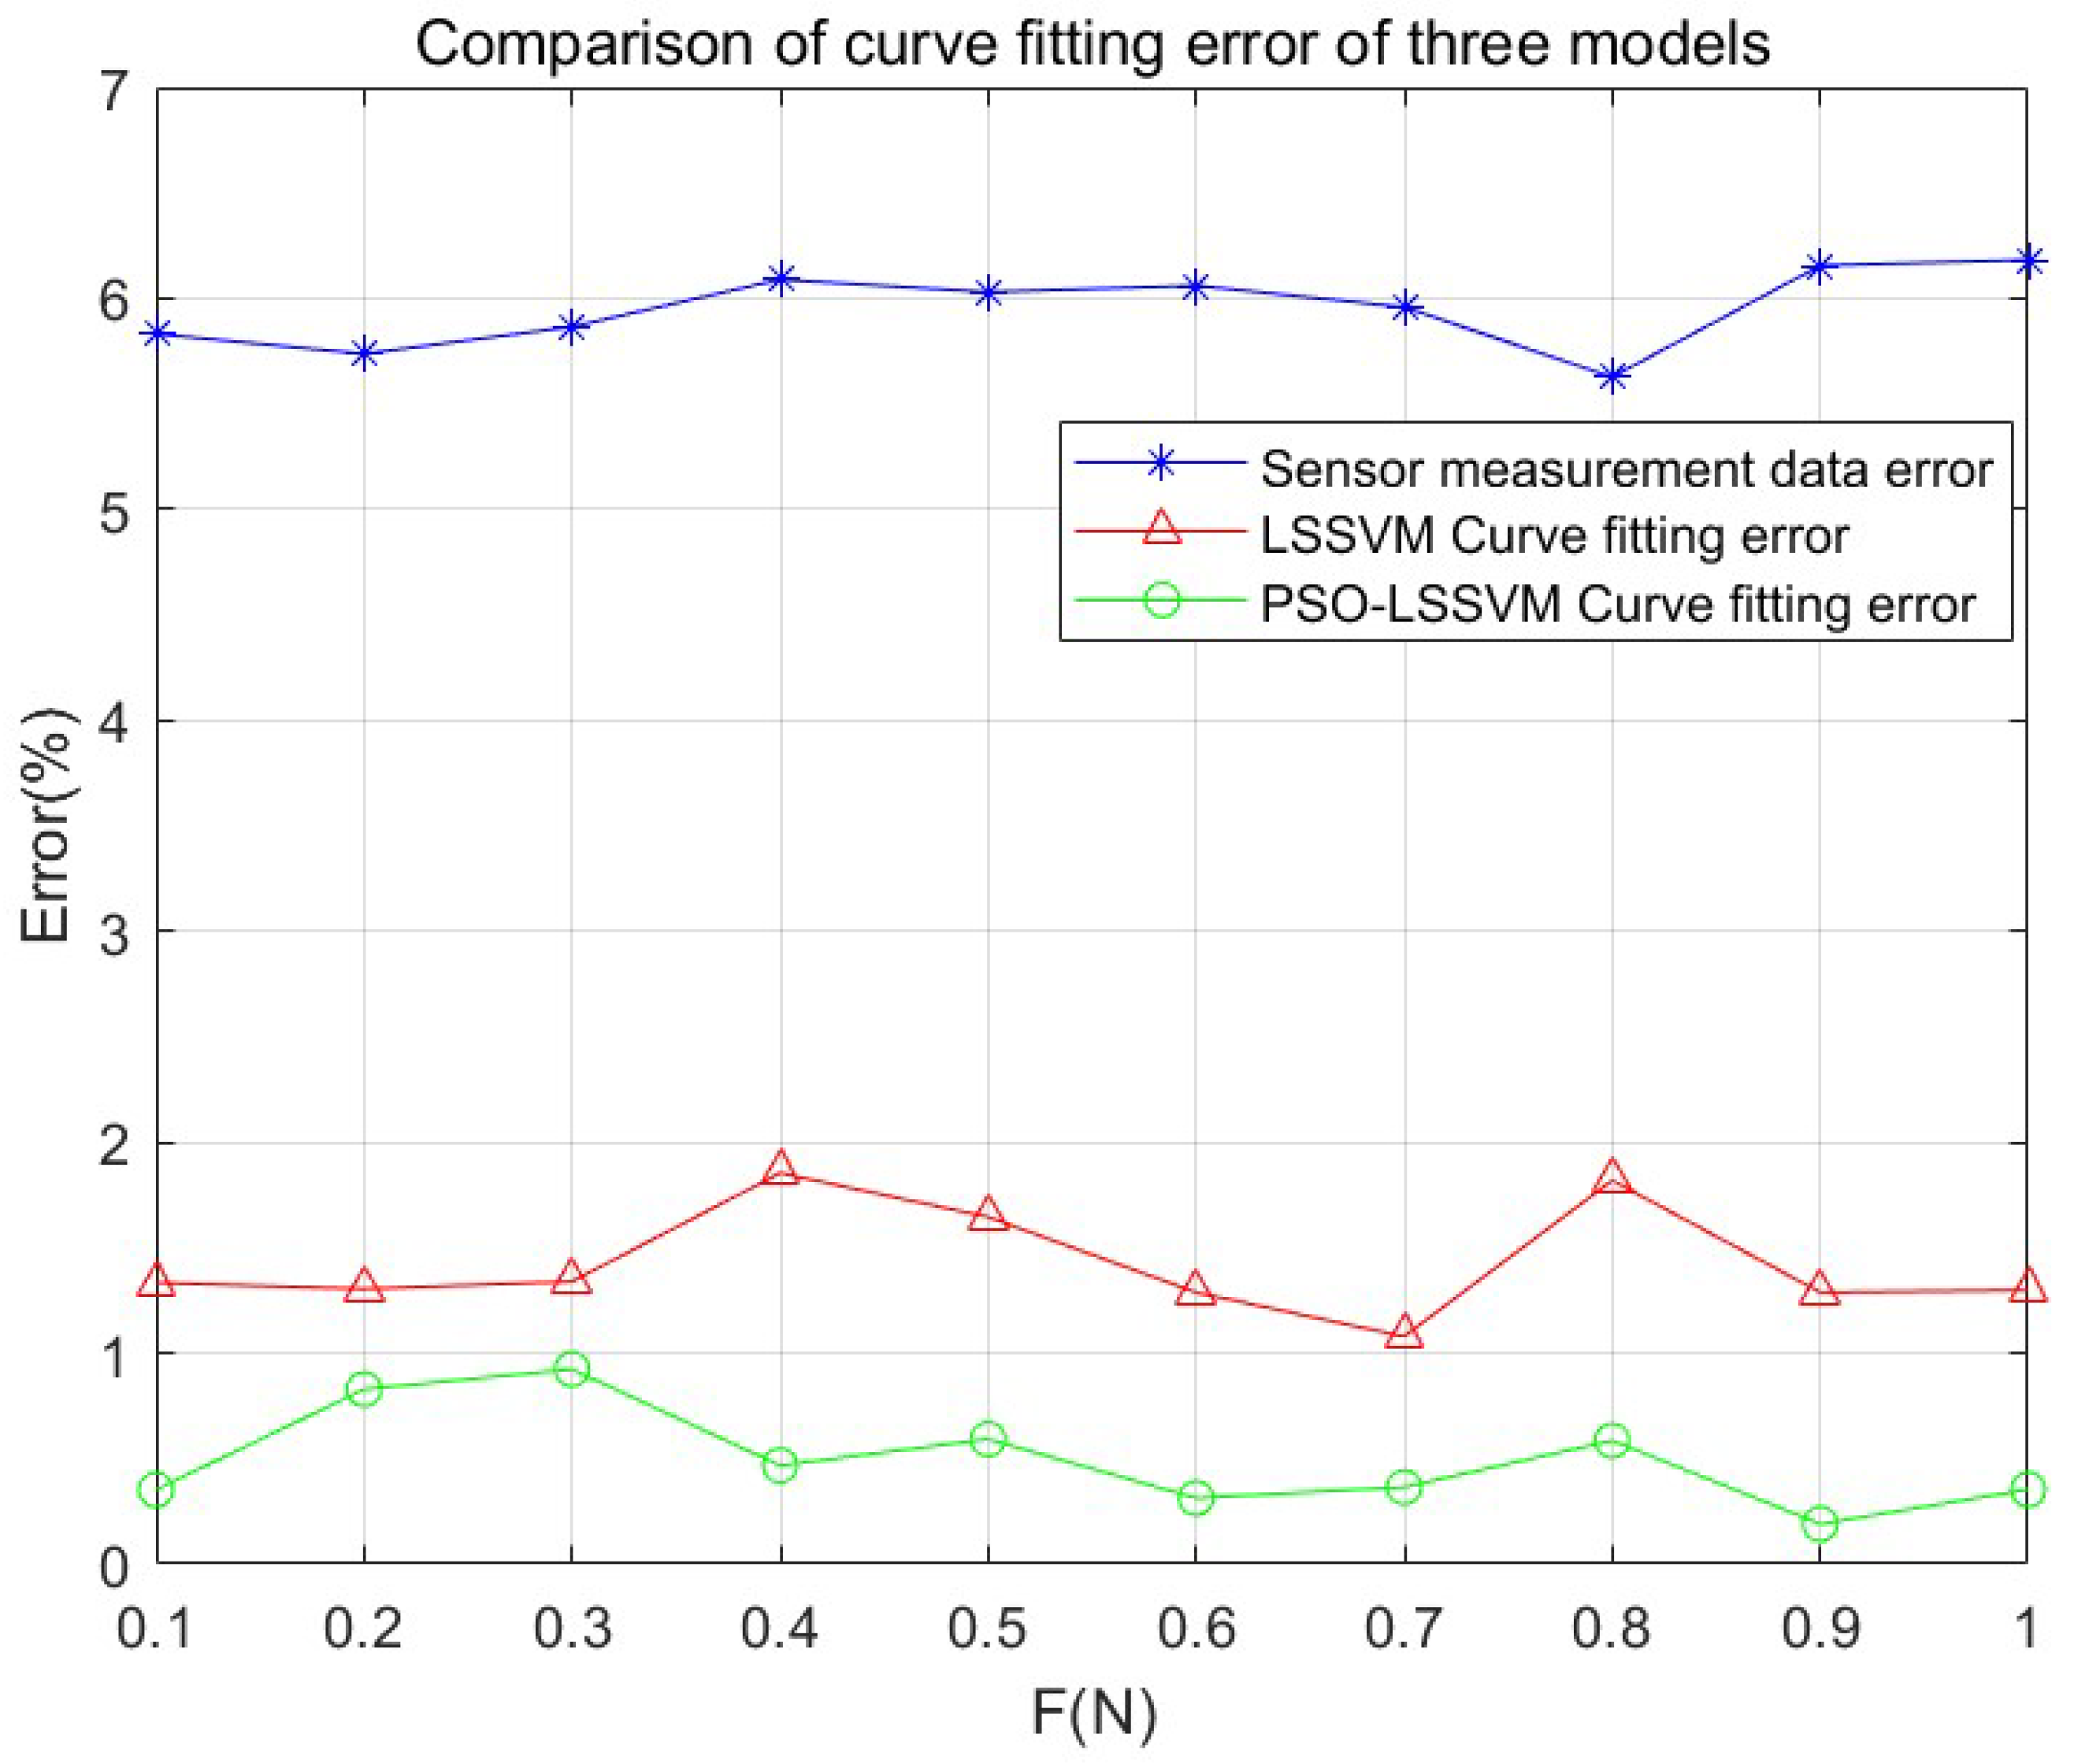
5.3. Numerical Comparison
6. Conclusions
- (1)
- By using the LSSVM and PSO-LSSVM model, the temperature sensitivity coefficient αs of the SAW winding tension sensor was decreased from to and , which was reduced by an order of magnitude. Thus, data fusion technology can significantly improve the anti-temperature interference performance of the SAW winding tension sensor, thereby further improving its measurement accuracy;
- (2)
- The average output error of the unoptimized test data is 5.95%. For the LSSVM network, the average fitting output error reaches more than 1.42%, while in the PSO-LSSVM model, the average fitting output error can reach 0.50% or even better. Thus, the PSO-LSSVM model for the temperature compensation of the SAW winding tension sensor is better.
Author Contributions
Funding
Data Availability Statement
Conflicts of Interest
References
- Lee, J.; Lee, C. Model-Based Winding Tension Profile to Minimize Radial Stress in a Flexible Substrate in a Roll-to-Roll Web Transporting System. IEEE ASME Trans. Mechatron. 2018, 23, 2928–2939. [Google Scholar] [CrossRef]
- Zhang, H.; Xia, H.; Lu, Y.; Wu, J.; Zhang, X.; Wei, Y. Tension control of a yarn winding system based on the nonlinear active disturbance-rejection control algorithm. Text. Res. J. 2022, 92, 5049–5065. [Google Scholar] [CrossRef]
- Pereira, F.; Oliveira, E.L.; Ferreira, G.G.; Sousa, F.; Caldas, P. Textile yarn winding and unwinding system. In Lecture Notes in Mechanical Engineering; Springer: Berlin/Heidelberg, Germany, 2021; pp. 347–358. [Google Scholar]
- Chen, X.; Zhu, Z.; Shen, G.; Li, W. Tension coordination control of double-rope winding hoisting system using hybrid learning control scheme. Proc. Inst. Mech. Eng. 2019, 233, 1265–1281. [Google Scholar] [CrossRef]
- Lee, C.W.; Shin, K.H. A Study on Taper-Tension Control Considering Telescoping in the Winding System. IEEE Trans. Ind. Appl. 2010, 46, 687–693. [Google Scholar]
- Ali, M.; Ahmed, R.; Amer, M. Yarn tension control technique for improving polyester soft winding process. Sci. Rep. 2021, 11, 1060. [Google Scholar] [CrossRef]
- Wen, L.; Zhu, T.; Qin, L. Deviation-rectifying control of carbon fiber prepreg slitting and winding machine. Trans. Nanjing Univ. Aeronaut. Astronaut. 2018, 35, 547–555. [Google Scholar]
- Xiao, Y.; Yu, A.; Qi, H. Research on the tension control method of lithium battery electrode mill based on GA optimized Fuzzy PID. J. Intell. Fuzzy Syst. 2021, 40, 10211–10234. [Google Scholar] [CrossRef]
- Jiang, C.; Wang, H.S.; Hou, L.W. Sliding mode compensation control for diaphragm tension in unwinding process of lithium battery diaphragm slitting machine. IEEE Access 2019, 8, 21302–21313. [Google Scholar] [CrossRef]
- Jo, I.; Park, S.; Kim, D. Tension-controlled single-crystallization of copper foils for roll-to-roll synthesis of high-quality graphene films. 2D Mater. 2018, 5, 024002. [Google Scholar] [CrossRef]
- Burak, Ç.; Barış, M.; Güngör, D. Innovative Research and Applications in Yarn Winding/Dyeing. Ann. Univ. OradeaFascicle Text. Leatherwork 2022, 23, 9–12. [Google Scholar]
- Hwang, H.; Lee, J.; Eum, S. Kalman-Filter-Based Tension Control Design for Industrial Roll-to-Roll System. Algorithms 2019, 12, 86. [Google Scholar] [CrossRef]
- Bhattacharjee, P.; Mishra, H.; Iyer, P.; Nemade, H.B. Efficient Monolithic SAW Convolver Using Poly(3-Hexylthiophene). IEEE Trans. Instrum. Meas. 2023, 72, 7501807. [Google Scholar] [CrossRef]
- Mandal, D.; Banerjee, S. Surface Acoustic Wave (SAW) Sensors: Physics, Materials, and Applications. Sensors 2022, 22, 820. [Google Scholar] [CrossRef] [PubMed]
- Lei, B.; Lu, W.; Mian, Z.; Bao, W. Effect of IDT position parameters on SAW yarn tension sensor sensitivity. Meas. Control 2020, 53, 2055–2062. [Google Scholar] [CrossRef]
- Wei, M.; Liu, Y.; Qu, Y.; Gu, X.; Wang, Y.; Liu, W.; Cai, Y.; Guo, S.; Sun, C. Development of Temperature Sensor Based on AlN/ScAlN SAW Resonators. Electronics 2023, 12, 3863. [Google Scholar] [CrossRef]
- Kumar, J.; Nimal, A.T.; Mittal, U.; Kumar, V.; Singh, V.K. Effect of Carrier Gas on Sensitivity of Surface Acoustic Wave Detector. IEEE Sens. J. 2022, 22, 8394–8401. [Google Scholar] [CrossRef]
- Aleksandrova, M.; Kolev, G.; Brigadin, A.; Lukin, A. Gas-Sensing Properties of a Carbyne-Enriched Nanocoating Deposited onto Surface Acoustic Wave Composite Substrates with Various Electrode Topologies. Crystals 2022, 12, 501. [Google Scholar] [CrossRef]
- Feng, Y.; Li, J.; Bai, R.; Qian, Z. Methods of solving in-band ripples and out-of-band suppression for yarn tension sensor based on surface acoustic wave. IET Circuits Devices Syst. 2022, 16, 483–490. [Google Scholar] [CrossRef]
- Li, Y.; Lu, W.; Zhu, C.; Liu, Q.; Zhang, H.; Lei, B. Finite element analysis of surface acoustic wave based on a micro force sensor. Measurement 2015, 65, 112–119. [Google Scholar] [CrossRef]
- Ding, Y.; Lu, W.; Zhang, Y.; Feng, Y.; Zhou, Y. Study on the Practical Application of Surface Acoustic Wave Yarn Tension Sensor 2022. IEEE Trans. Ind. Electron. 2022, 69, 13781–13790. [Google Scholar] [CrossRef]
- Lu, W.; Zhu, C. Solving three key problems of wavelet transform processor using surface acoustic wave devices. IEEE Trans. Ind. Electron. 2010, 57, 3801–3806. [Google Scholar] [CrossRef]
- Campbell, C. Surface Acoustic Wave Devices and Their Signal Processing Applications; Elsevier: Amsterdam, The Netherlands, 1989; pp. 59–65. [Google Scholar]
- Feng, Y.; Lu, Z.; Lu, W.; Zhu, C.; Liu, Q.; Zhang, H. Study of the Doubly-clamped Beam Yarn Tension Sensor Based on the Surface Acoustic Wave. IEEE Trans. Ind. Electron. 2019, 66, 3256–3264. [Google Scholar] [CrossRef]
- Lu, W.; Lu, X.; Zhu, C.; Liu, Q.; Zhang, H. Solving Three Key Problems of the SAW Yarn Tension Sensor. IEEE Trans. Electron Devices 2012, 59, 2853–2855. [Google Scholar] [CrossRef]
- Feng, Y.; Liu, W.; Wang, B. Enhanced Frequency Stability of SAW Yarn Tension Sensor by Using the Dual Differential Channel Surface Acoustic Wave Oscillator. Sensors 2023, 23, 464. [Google Scholar] [CrossRef] [PubMed]
- Song, X.; Zhao, J.; Song, J.; Dong, F.; Xu, L.; Zhao, J. Local Demagnetization Fault Recognition of Permanent Magnet Synchronous Linear Motor Based on S-Transform and PSO–LSSVM. IEEE Trans. Power Electron. 2020, 35, 7816–7825. [Google Scholar] [CrossRef]
- Yang, D.; Peng, Y.; Zhou, T.; Wang, T.; Lu, G. Percussion and PSO-SVM-Based Damage Detection for Refractory Materials. Micromachines 2023, 14, 135. [Google Scholar] [CrossRef]
- Gorjaei, R.G.; Songolzadeh, R.; Torkaman, M.; Safari, M.; Zargar, G. A novel PSO-LSSVM model for predicting liquid rate of two phase flow through wellhead chokes. J. Nat. Gas Sci. Eng. 2015, 24, 228–237. [Google Scholar] [CrossRef]
- Chen, W.; Li, J.; Wang, Q.; Han, K. Fault Feature Extraction and Diagnosis of Rolling Bearings Based on Wavelet Thresholding Denoising with CEEMDAN Energy Entropy and PSO-LSSVM. Measurement 2020, 172, 108901. [Google Scholar] [CrossRef]
- Suykens, J.A.K.; Vandewalle, J. Least Squares Support Vector Machine Classifiers. Neural Process. Lett. 1999, 9, 293–300. [Google Scholar] [CrossRef]
- Yang, T.; Lu, W.; Zuo, F. Temperature Compensation for Diffused-silicon Pressure Sensor Based on PSO-LSSVM. Instrum. Tech. Sens. 2017, 12, 25–29. [Google Scholar]
- Ge, Q.; Guo, C.; Jiang, H.; Lu, Z.; Yao, G.; Zhang, J.; Hua, Q. Industrial power load forecasting method based on reinforcement learning and PSO-LSSVM. IEEE Trans. Cybern. 2020, 52, 1112–1124. [Google Scholar] [CrossRef] [PubMed]
- Bemani, A.; Xiong, Q.; Baghban, A.; Habibzadeh, S.; Mohammadi, A.H.; Doranehgard, M.H. Modeling of cetane number of biodiesel from fatty acid methyl ester (FAME) information using GA-, PSO-, and HGAPSO-LSSVM models. Renew. Energy 2020, 150, 924–934. [Google Scholar] [CrossRef]
- Zeng, B.; Guo, J.; Zhang, F.; Zhu, W.; Xiao, Z.; Huang, S.; Fan, P. Prediction model for dissolved gas concentration in transformer oil based on modified grey wolf optimizer and LSSVM with grey relational analysis and empirical mode decomposition. Energies 2020, 13, 422. [Google Scholar] [CrossRef]

| Piezoelectric Substrate | Material | ST-X Quartz |
| Size | L = 30 mm, W = 6 mm, H = 0.5 mm | |
| IDT | Structure | Delay line |
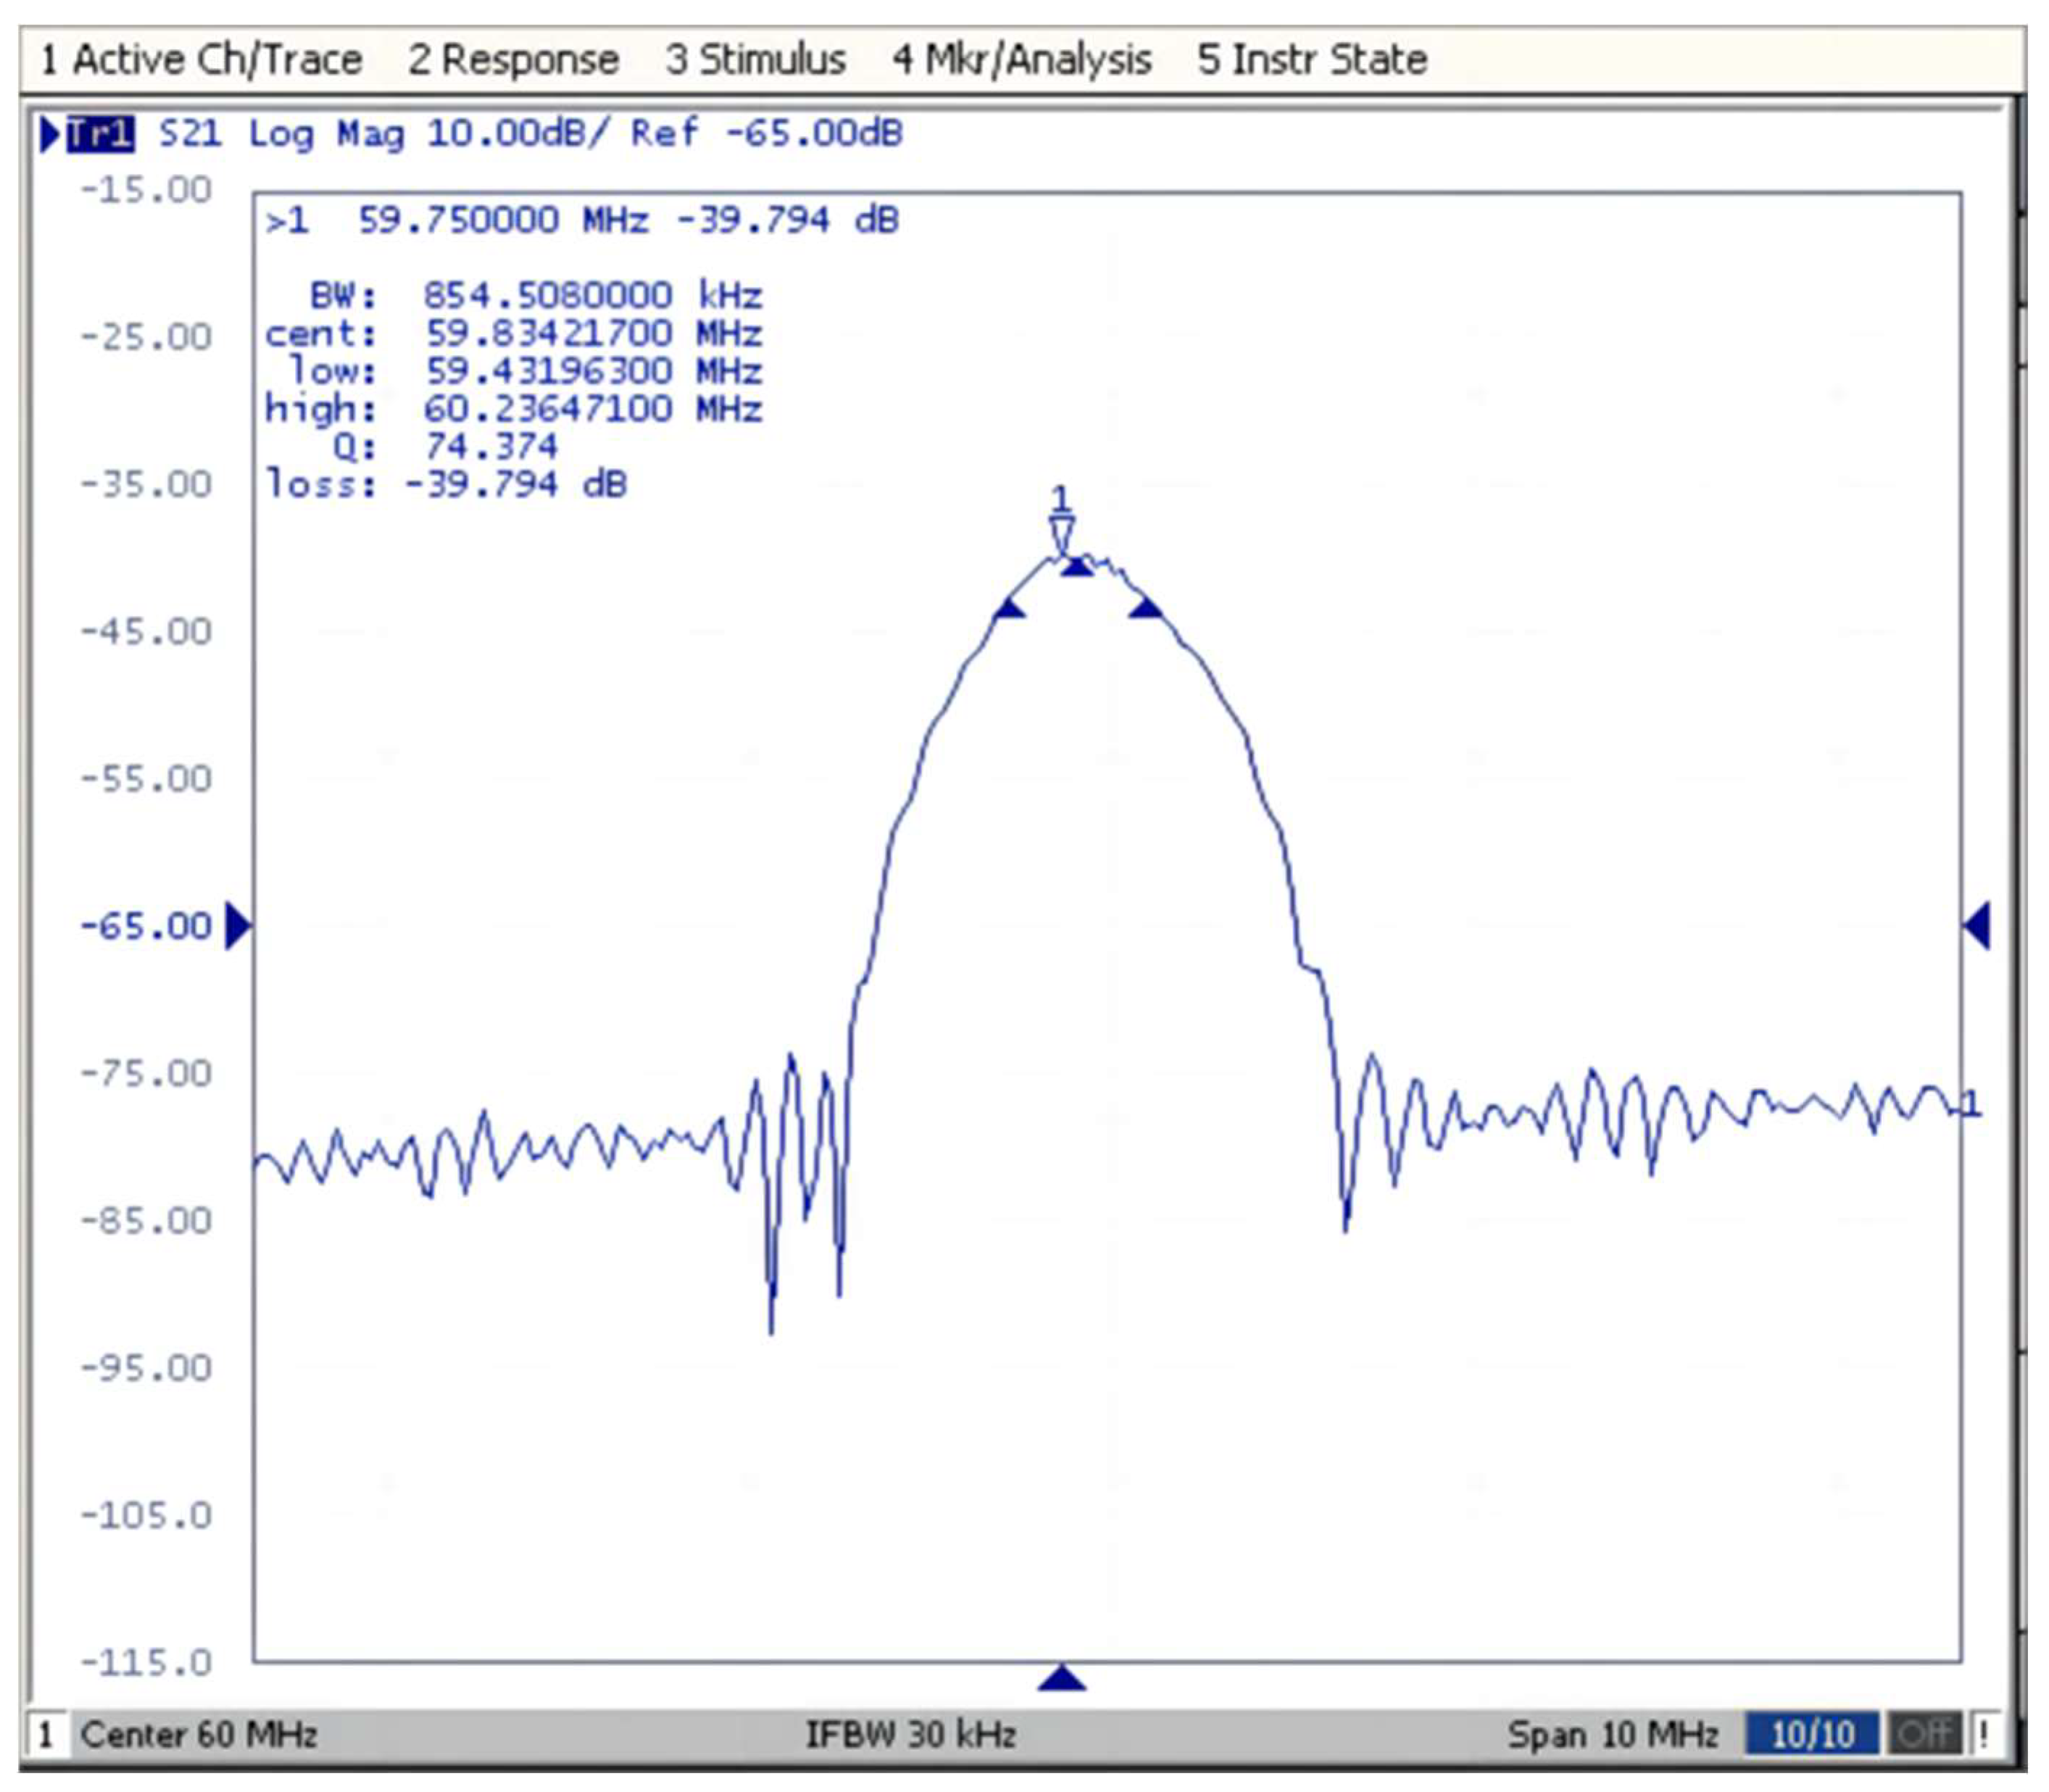
| Frequency of center | 60 MHz | |
| −3 dB bandwidth | 1.43% (854.5 Mhz) | |
| Wavelength Aperture width | ||
| Number of input IDT | 145 | |
| Number of output IDT | 49 | |
| Distance between input and output IDT center | ) |
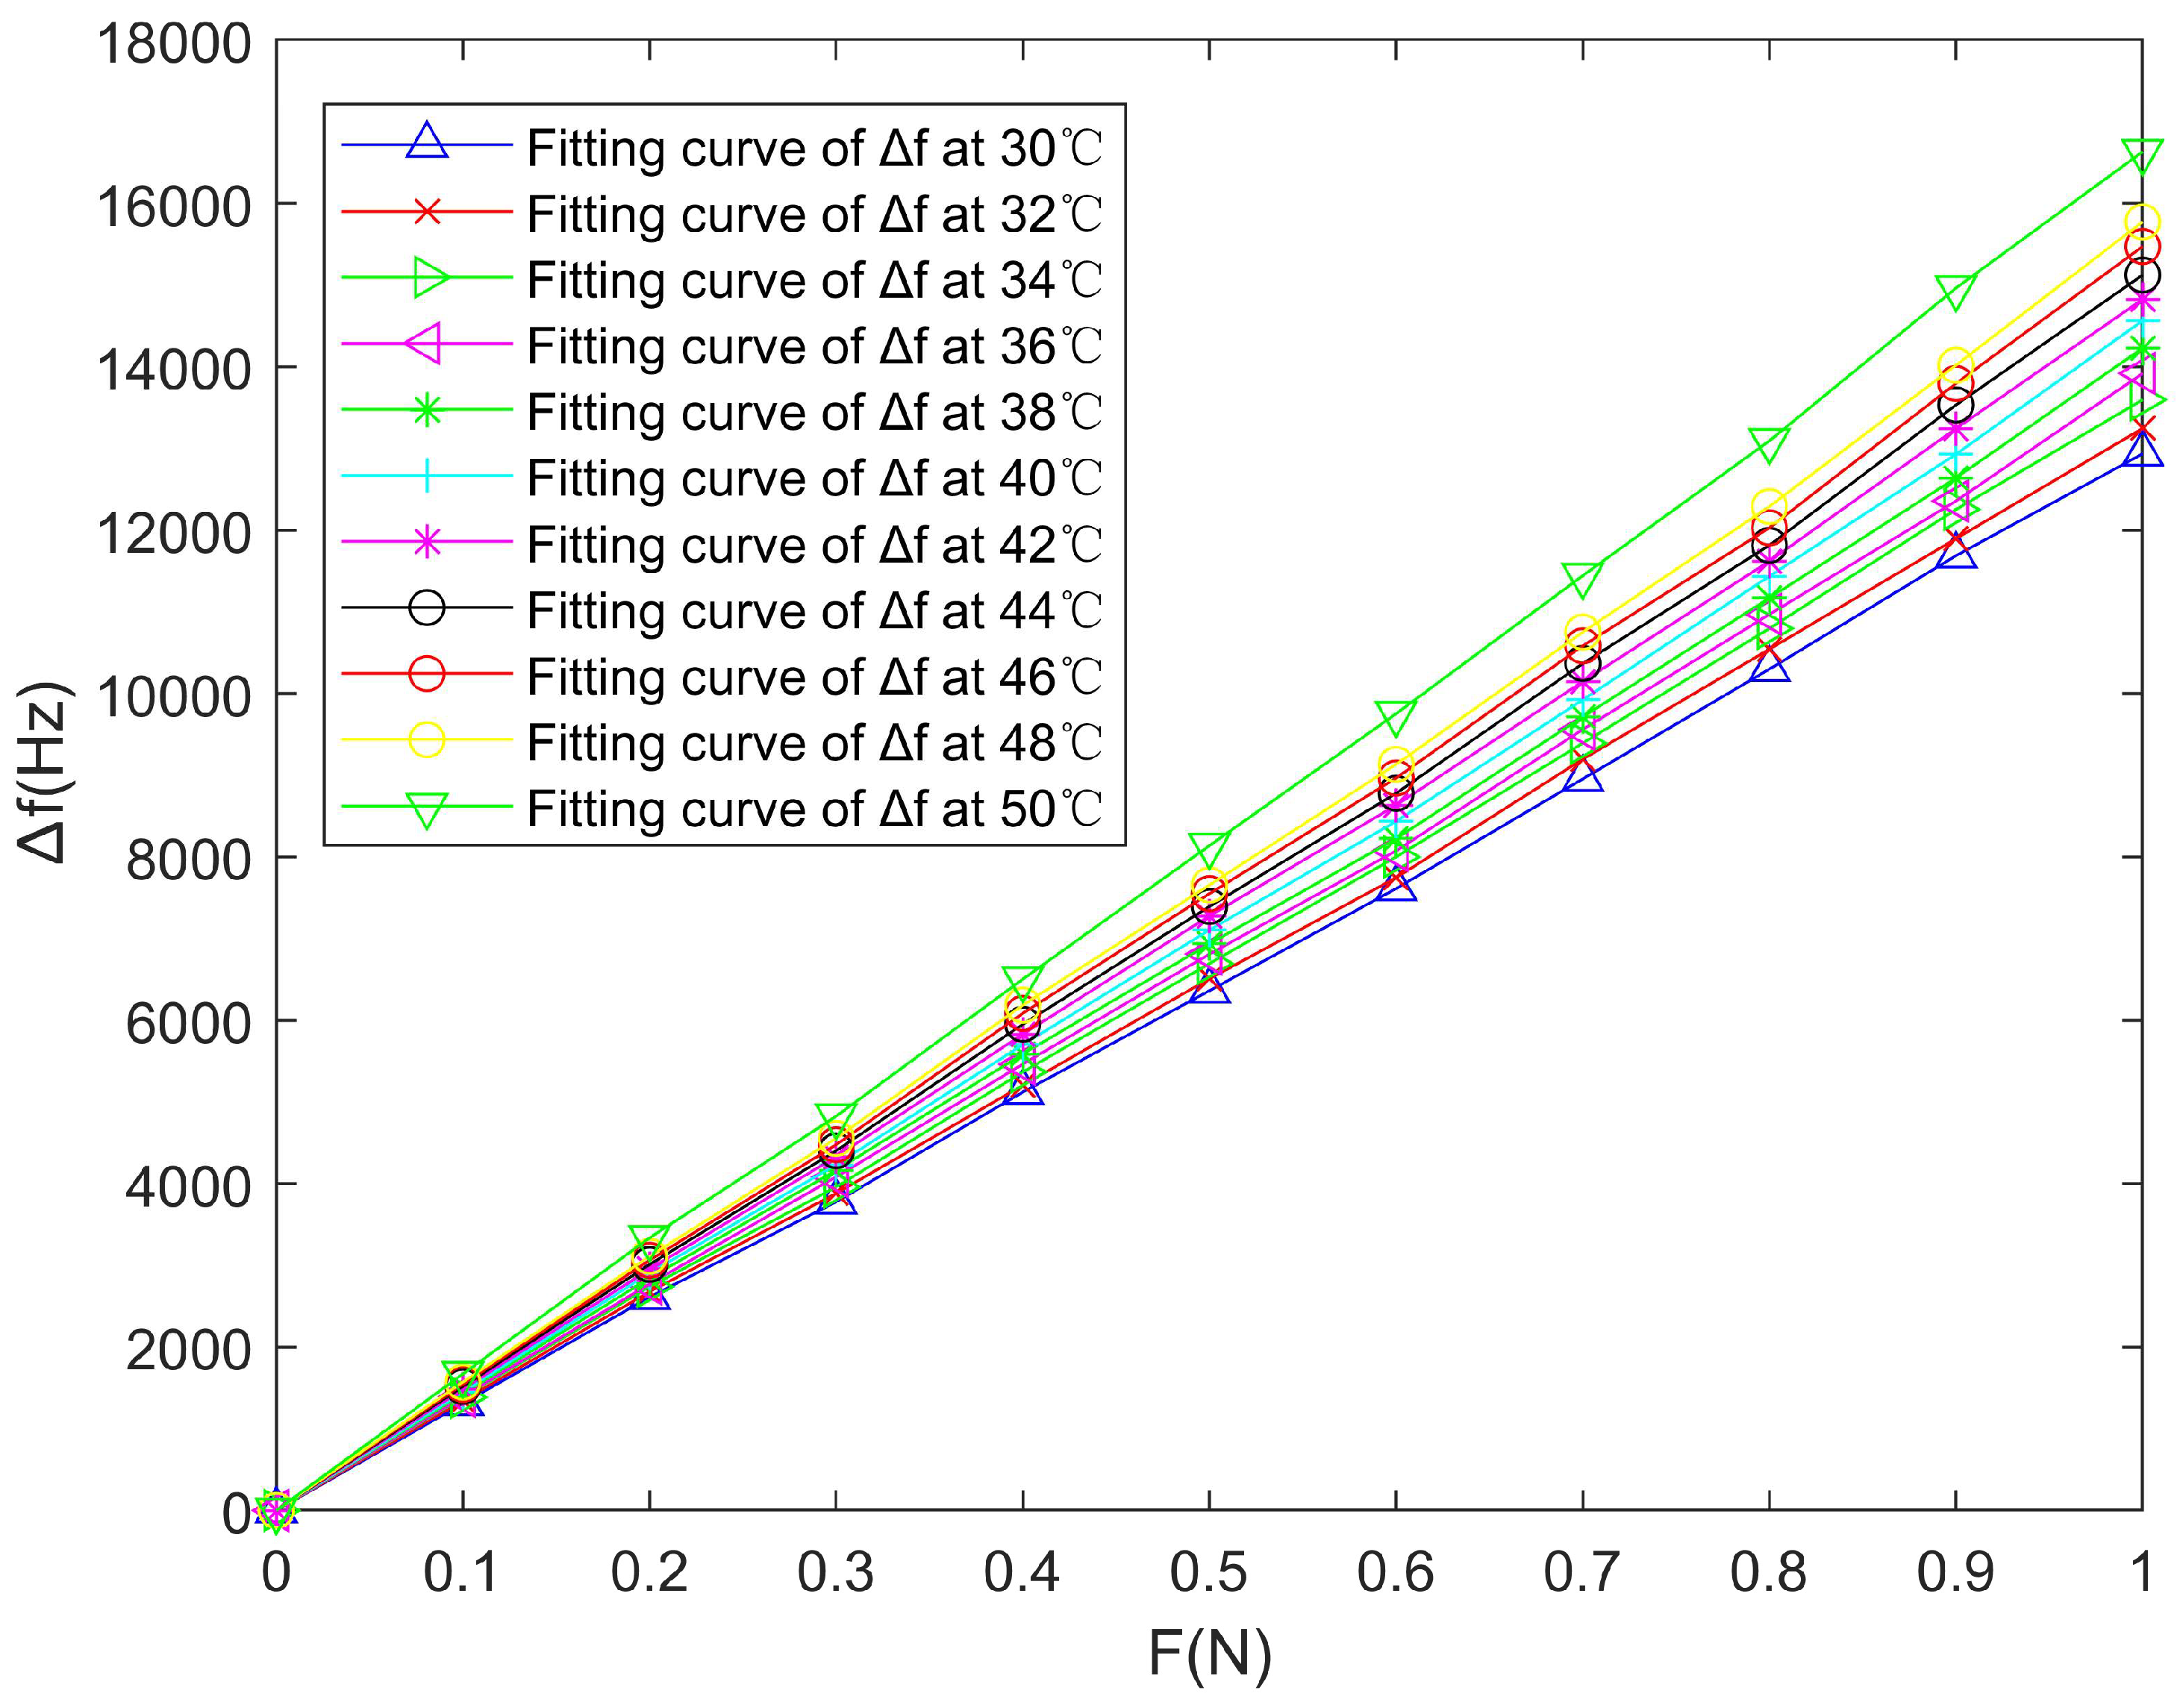
| T/°C | F (N) | ||||||||||
|---|---|---|---|---|---|---|---|---|---|---|---|
| 0 | 0.1 | 0.2 | 0.3 | 0.4 | 0.5 | 0.6 | 0.7 | 0.8 | 0.9 | 1.0 | |
| (Hz) | |||||||||||
| 30 | 0 | 1310 | 2611 | 3778 | 5121 | 6362 | 7612 | 8954 | 10,298 | 11,687 | 12,934 |
| 32 | 0 | 1345 | 2677 | 3881 | 5205 | 6508 | 7745 | 9196 | 10,542 | 11,895 | 13,246 |
| 34 | 0 | 1385 | 2738 | 3960 | 5367 | 6694 | 7999 | 9391 | 10,796 | 12,252 | 13,595 |
| 36 | 0 | 1396 | 2773 | 4083 | 5463 | 6810 | 8074 | 9559 | 10,968 | 12,356 | 13,918 |
| 38 | 0 | 1428 | 2844 | 4163 | 5587 | 6936 | 8223 | 9714 | 11,168 | 12,639 | 14,228 |
| 40 | 0 | 1451 | 2905 | 4232 | 5701 | 7105 | 8435 | 9922 | 11,435 | 12,929 | 14,564 |
| 42 | 0 | 1485 | 2954 | 4330 | 5829 | 7277 | 8632 | 10,146 | 11,619 | 13,243 | 14,825 |
| 44 | 0 | 1518 | 3011 | 4403 | 5951 | 7393 | 8778 | 10,367 | 11,814 | 13,532 | 15,122 |
| 46 | 0 | 1544 | 3062 | 4477 | 6085 | 7550 | 8965 | 10,583 | 12,028 | 13,795 | 15,471 |
| 48 | 0 | 1572 | 3111 | 4555 | 6185 | 7656 | 9132 | 10,751 | 12,288 | 14,018 | 15,773 |
| 50 | 0 | 1671 | 3336 | 4826 | 6503 | 8138 | 9752 | 11,442 | 13,092 | 14,963 | 16,631 |
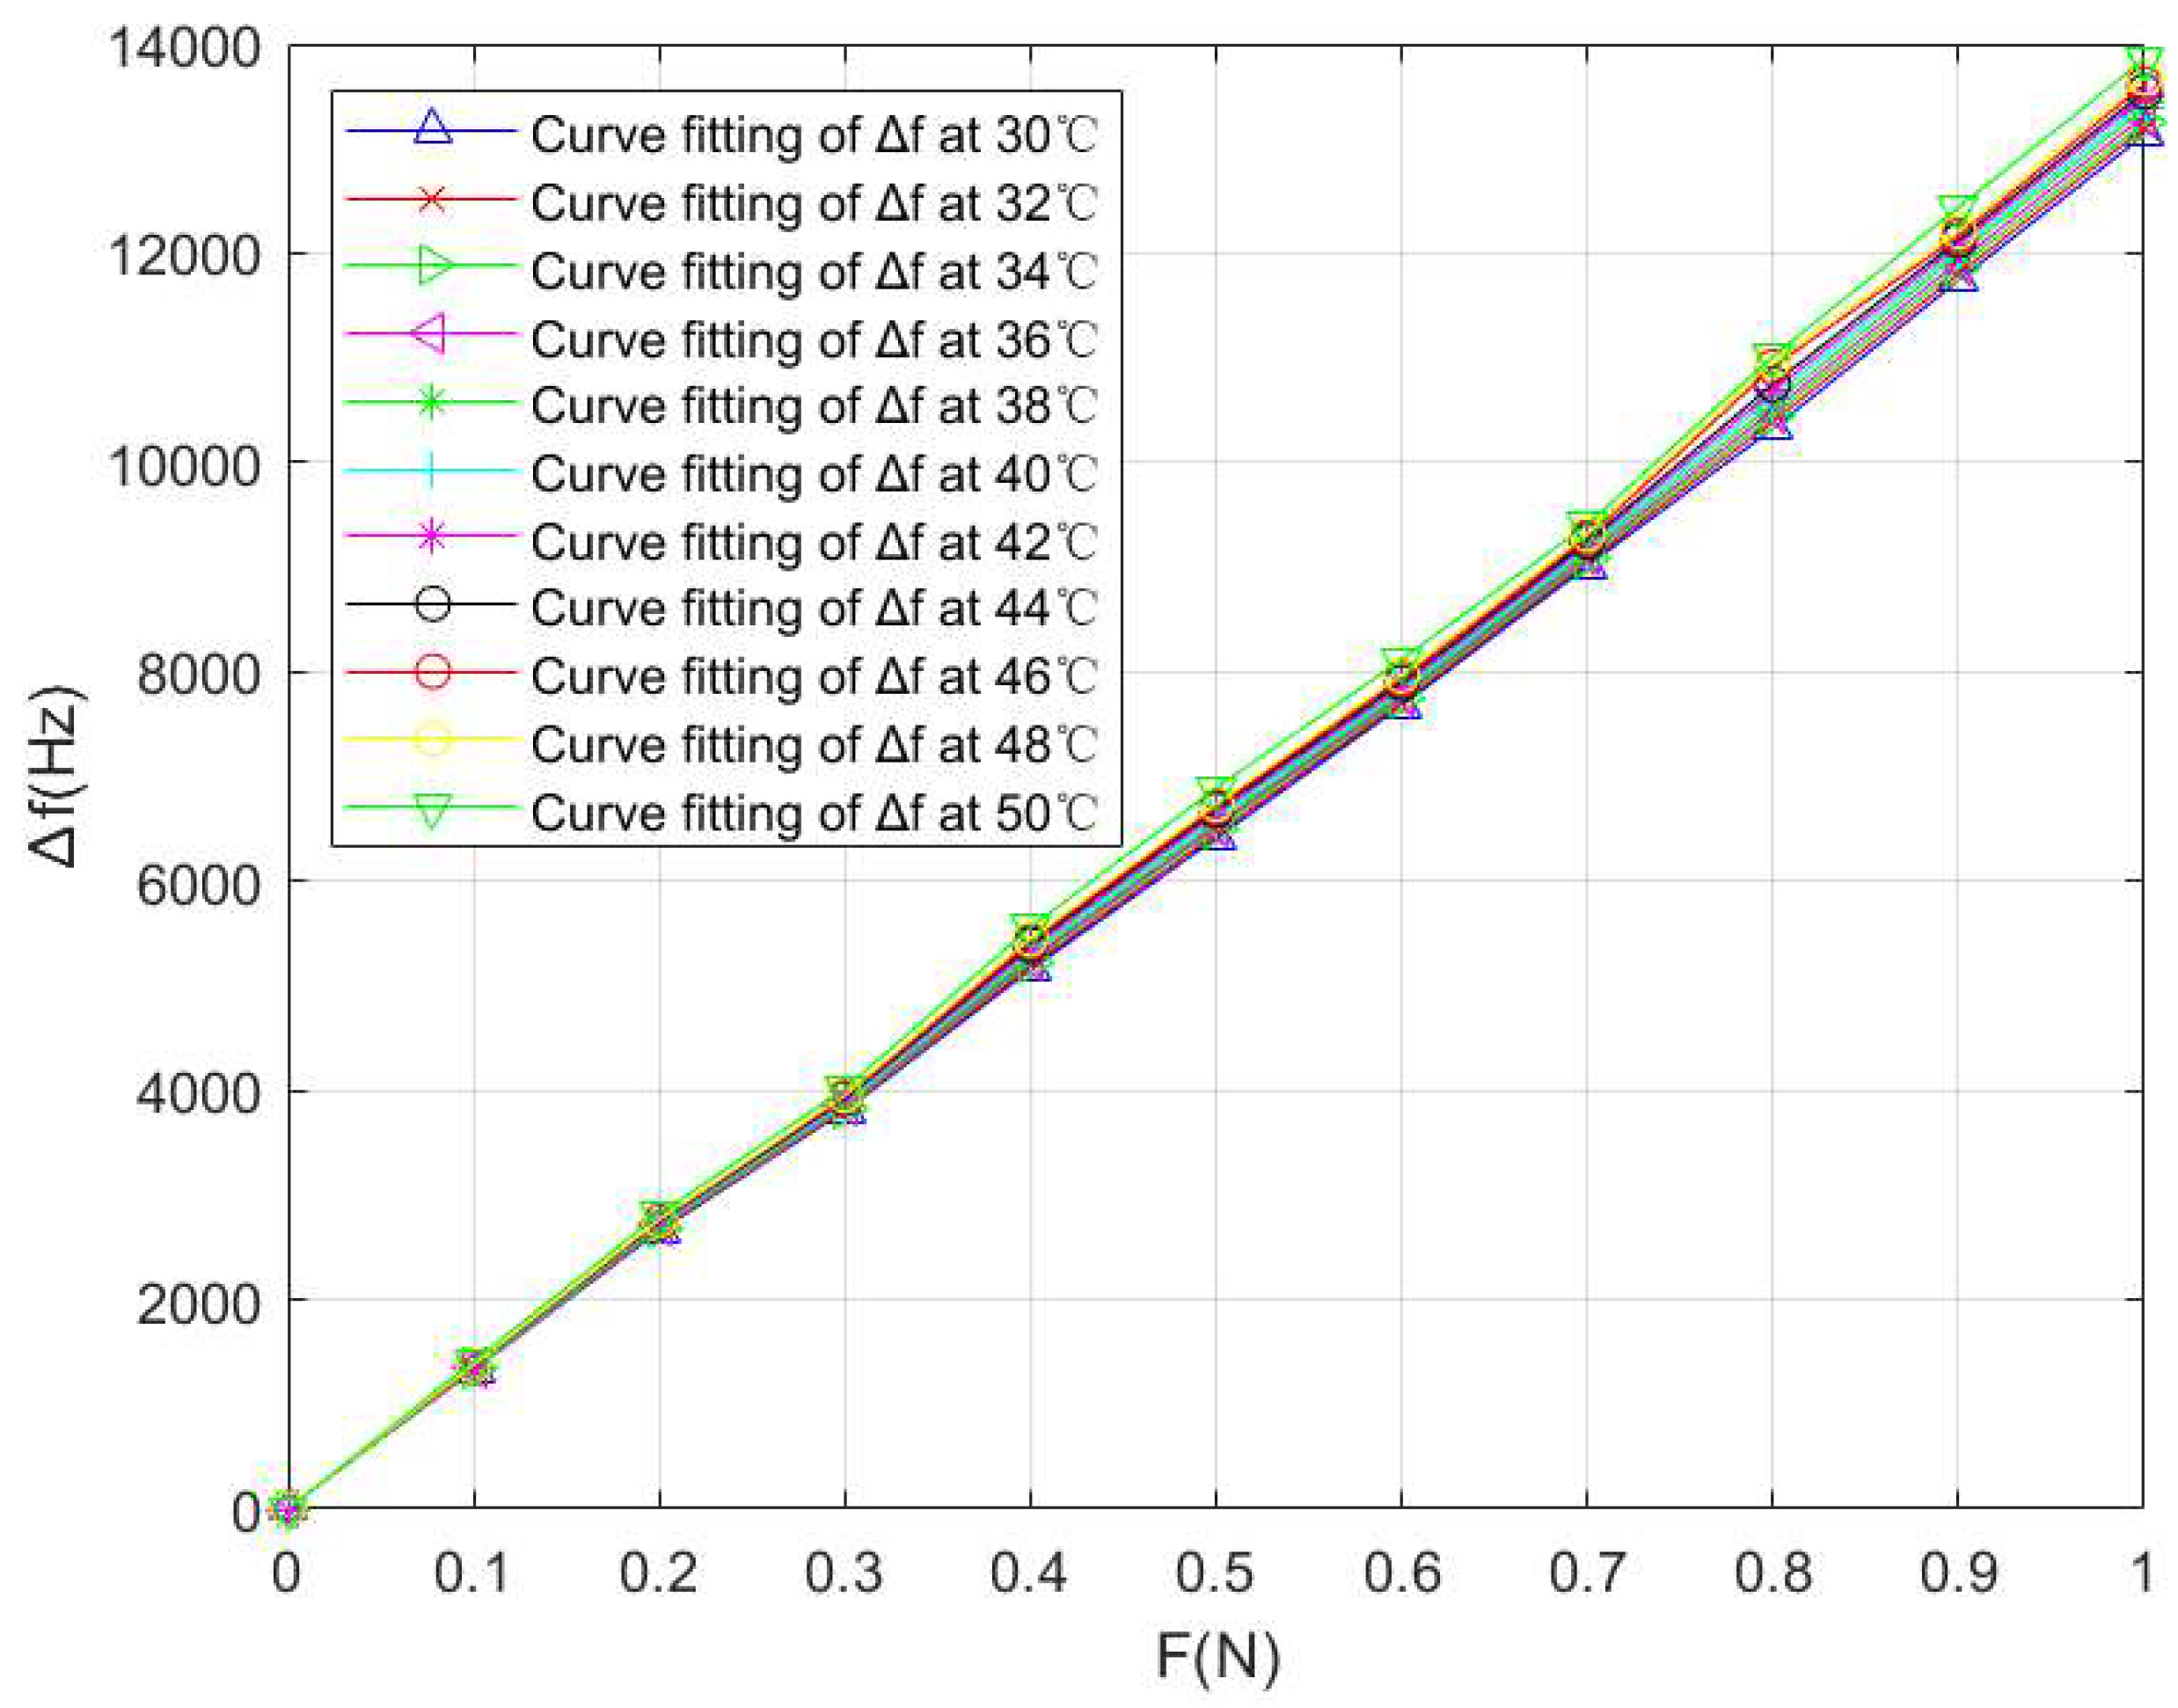
| T/°C | F (N) | ||||||||||
|---|---|---|---|---|---|---|---|---|---|---|---|
| 0 | 0.1 | 0.2 | 0.3 | 0.4 | 0.5 | 0.6 | 0.7 | 0.8 | 0.9 | 1.0 | |
| (Hz) | |||||||||||
| 30 | 0 | 1326 | 2657 | 3804 | 5152 | 6411 | 7677 | 9012 | 10,326 | 11,742 | 13,132 |
| 32 | 0 | 1331 | 2671 | 3817 | 5183 | 6453 | 7705 | 9044 | 10,393 | 11,801 | 13,199 |
| 34 | 0 | 1337 | 2684 | 3832 | 5220 | 6497 | 7736 | 9073 | 10,449 | 11,864 | 13,247 |
| 36 | 0 | 1342 | 2698 | 3845 | 5246 | 6529 | 7765 | 9109 | 10,500 | 11,920 | 13,313 |
| 38 | 0 | 1347 | 2711 | 3861 | 5280 | 6567 | 7792 | 9147 | 10,558 | 11,988 | 13,381 |
| 40 | 0 | 1353 | 2724 | 3882 | 5318 | 6609 | 7822 | 9175 | 10,632 | 12,031 | 13,438 |
| 42 | 0 | 1358 | 2734 | 3900 | 5349 | 6642 | 7855 | 9212 | 10,688 | 12,079 | 13,497 |
| 44 | 0 | 1364 | 2744 | 3921 | 5387 | 6678 | 7894 | 9244 | 10,749 | 12,123 | 13,542 |
| 46 | 0 | 1370 | 2754 | 3935 | 5414 | 6706 | 7933 | 9281 | 10,912 | 12,166 | 13,612 |
| 48 | 0 | 1375 | 2763 | 3953 | 5453 | 6736 | 7968 | 9320 | 10,970 | 12,211 | 13,679 |
| 50 | 0 | 1412 | 2816 | 4017 | 5558 | 6890 | 8116 | 9409 | 11,017 | 12,439 | 13,855 |
| T/°C | F (N) | ||||||||||
|---|---|---|---|---|---|---|---|---|---|---|---|
| 0 | 0.1 | 0.2 | 0.3 | 0.4 | 0.5 | 0.6 | 0.7 | 0.8 | 0.9 | 1.0 | |
| (Hz) | |||||||||||
| 30 | 0 | 1334 | 2648 | 3986 | 5166 | 6397 | 7641 | 8996 | 10,334 | 11,828 | 13,096 |
| 32 | 0 | 1335 | 2670 | 4000 | 5172 | 6406 | 7651 | 9004 | 10,350 | 11,836 | 13,114 |
| 34 | 0 | 1336 | 2675 | 4011 | 5178 | 6421 | 7659 | 9017 | 10,375 | 11,843 | 13,126 |
| 36 | 0 | 1337 | 2684 | 4023 | 5187 | 6434 | 7668 | 9026 | 10,392 | 11,850 | 13,138 |
| 38 | 0 | 1338 | 2690 | 4035 | 5194 | 6447 | 7674 | 9037 | 10,412 | 11,856 | 13,152 |
| 40 | 0 | 1340 | 2700 | 4049 | 5204 | 6458 | 7682 | 9047 | 10,432 | 11,862 | 13,165 |
| 42 | 0 | 1342 | 2714 | 4063 | 5213 | 6472 | 7691 | 9059 | 10,456 | 11,869 | 13,180 |
| 44 | 0 | 1343 | 2719 | 40 72 | 5220 | 6486 | 7697 | 9072 | 10,471 | 11,877 | 13,196 |
| 46 | 0 | 1344 | 2721 | 4086 | 5226 | 6500 | 7705 | 9084 | 10,494 | 11,886 | 13,215 |
| 48 | 0 | 1345 | 2727 | 4097 | 5233 | 6512 | 7712 | 9094 | 10,518 | 11,895 | 13,229 |
| 50 | 0 | 1357 | 2730 | 4146 | 5271 | 6552 | 7750 | 9130 | 10,590 | 11,930 | 13,309 |
| Error (%) | F (N) | ||||||||||
| 0.1 | 0.2 | 0.3 | 0.4 | 0.5 | 0.6 | 0.7 | 0.8 | 0.9 | 1 | Avg | |
| Sensor measurement data error | 5.83 | 5.74 | 5.87 | 6.09 | 6.03 | 6.06 | 5.96 | 5.63 | 6.16 | 6.18 | 5.95 |
| LSSVM Curve fitting error | 1.33 | 1.30 | 1.34 | 1.85 | 1.65 | 1.29 | 1.08 | 1.82 | 1.29 | 1.30 | 1.42 |
| PSO-LSSVM Curve fitting error | 0.35 | 0.83 | 0.92 | 0.47 | 0.59 | 0.31 | 0.37 | 0.59 | 0.19 | 0.35 | 0.50 |
Disclaimer/Publisher’s Note: The statements, opinions and data contained in all publications are solely those of the individual author(s) and contributor(s) and not of MDPI and/or the editor(s). MDPI and/or the editor(s) disclaim responsibility for any injury to people or property resulting from any ideas, methods, instructions or products referred to in the content. |
© 2023 by the authors. Licensee MDPI, Basel, Switzerland. This article is an open access article distributed under the terms and conditions of the Creative Commons Attribution (CC BY) license (https://creativecommons.org/licenses/by/4.0/).
Share and Cite
Feng, Y.; Liu, W.; Yu, H.; Hu, K.; Sun, S.; Wang, B. Temperature Compensation of SAW Winding Tension Sensor Based on PSO-LSSVM Algorithm. Micromachines 2023, 14, 2093. https://doi.org/10.3390/mi14112093
Feng Y, Liu W, Yu H, Hu K, Sun S, Wang B. Temperature Compensation of SAW Winding Tension Sensor Based on PSO-LSSVM Algorithm. Micromachines. 2023; 14(11):2093. https://doi.org/10.3390/mi14112093
Chicago/Turabian StyleFeng, Yang, Wenbo Liu, Haoda Yu, Keyong Hu, Shuifa Sun, and Ben Wang. 2023. "Temperature Compensation of SAW Winding Tension Sensor Based on PSO-LSSVM Algorithm" Micromachines 14, no. 11: 2093. https://doi.org/10.3390/mi14112093
APA StyleFeng, Y., Liu, W., Yu, H., Hu, K., Sun, S., & Wang, B. (2023). Temperature Compensation of SAW Winding Tension Sensor Based on PSO-LSSVM Algorithm. Micromachines, 14(11), 2093. https://doi.org/10.3390/mi14112093