


Model-Based Feedback Control for an Automated Micro Liquid Dispensing System Based on Contacting Droplet Generation through Image Sensing
 , , and
Abstract
:1. Introduction
2. Materials and Methods
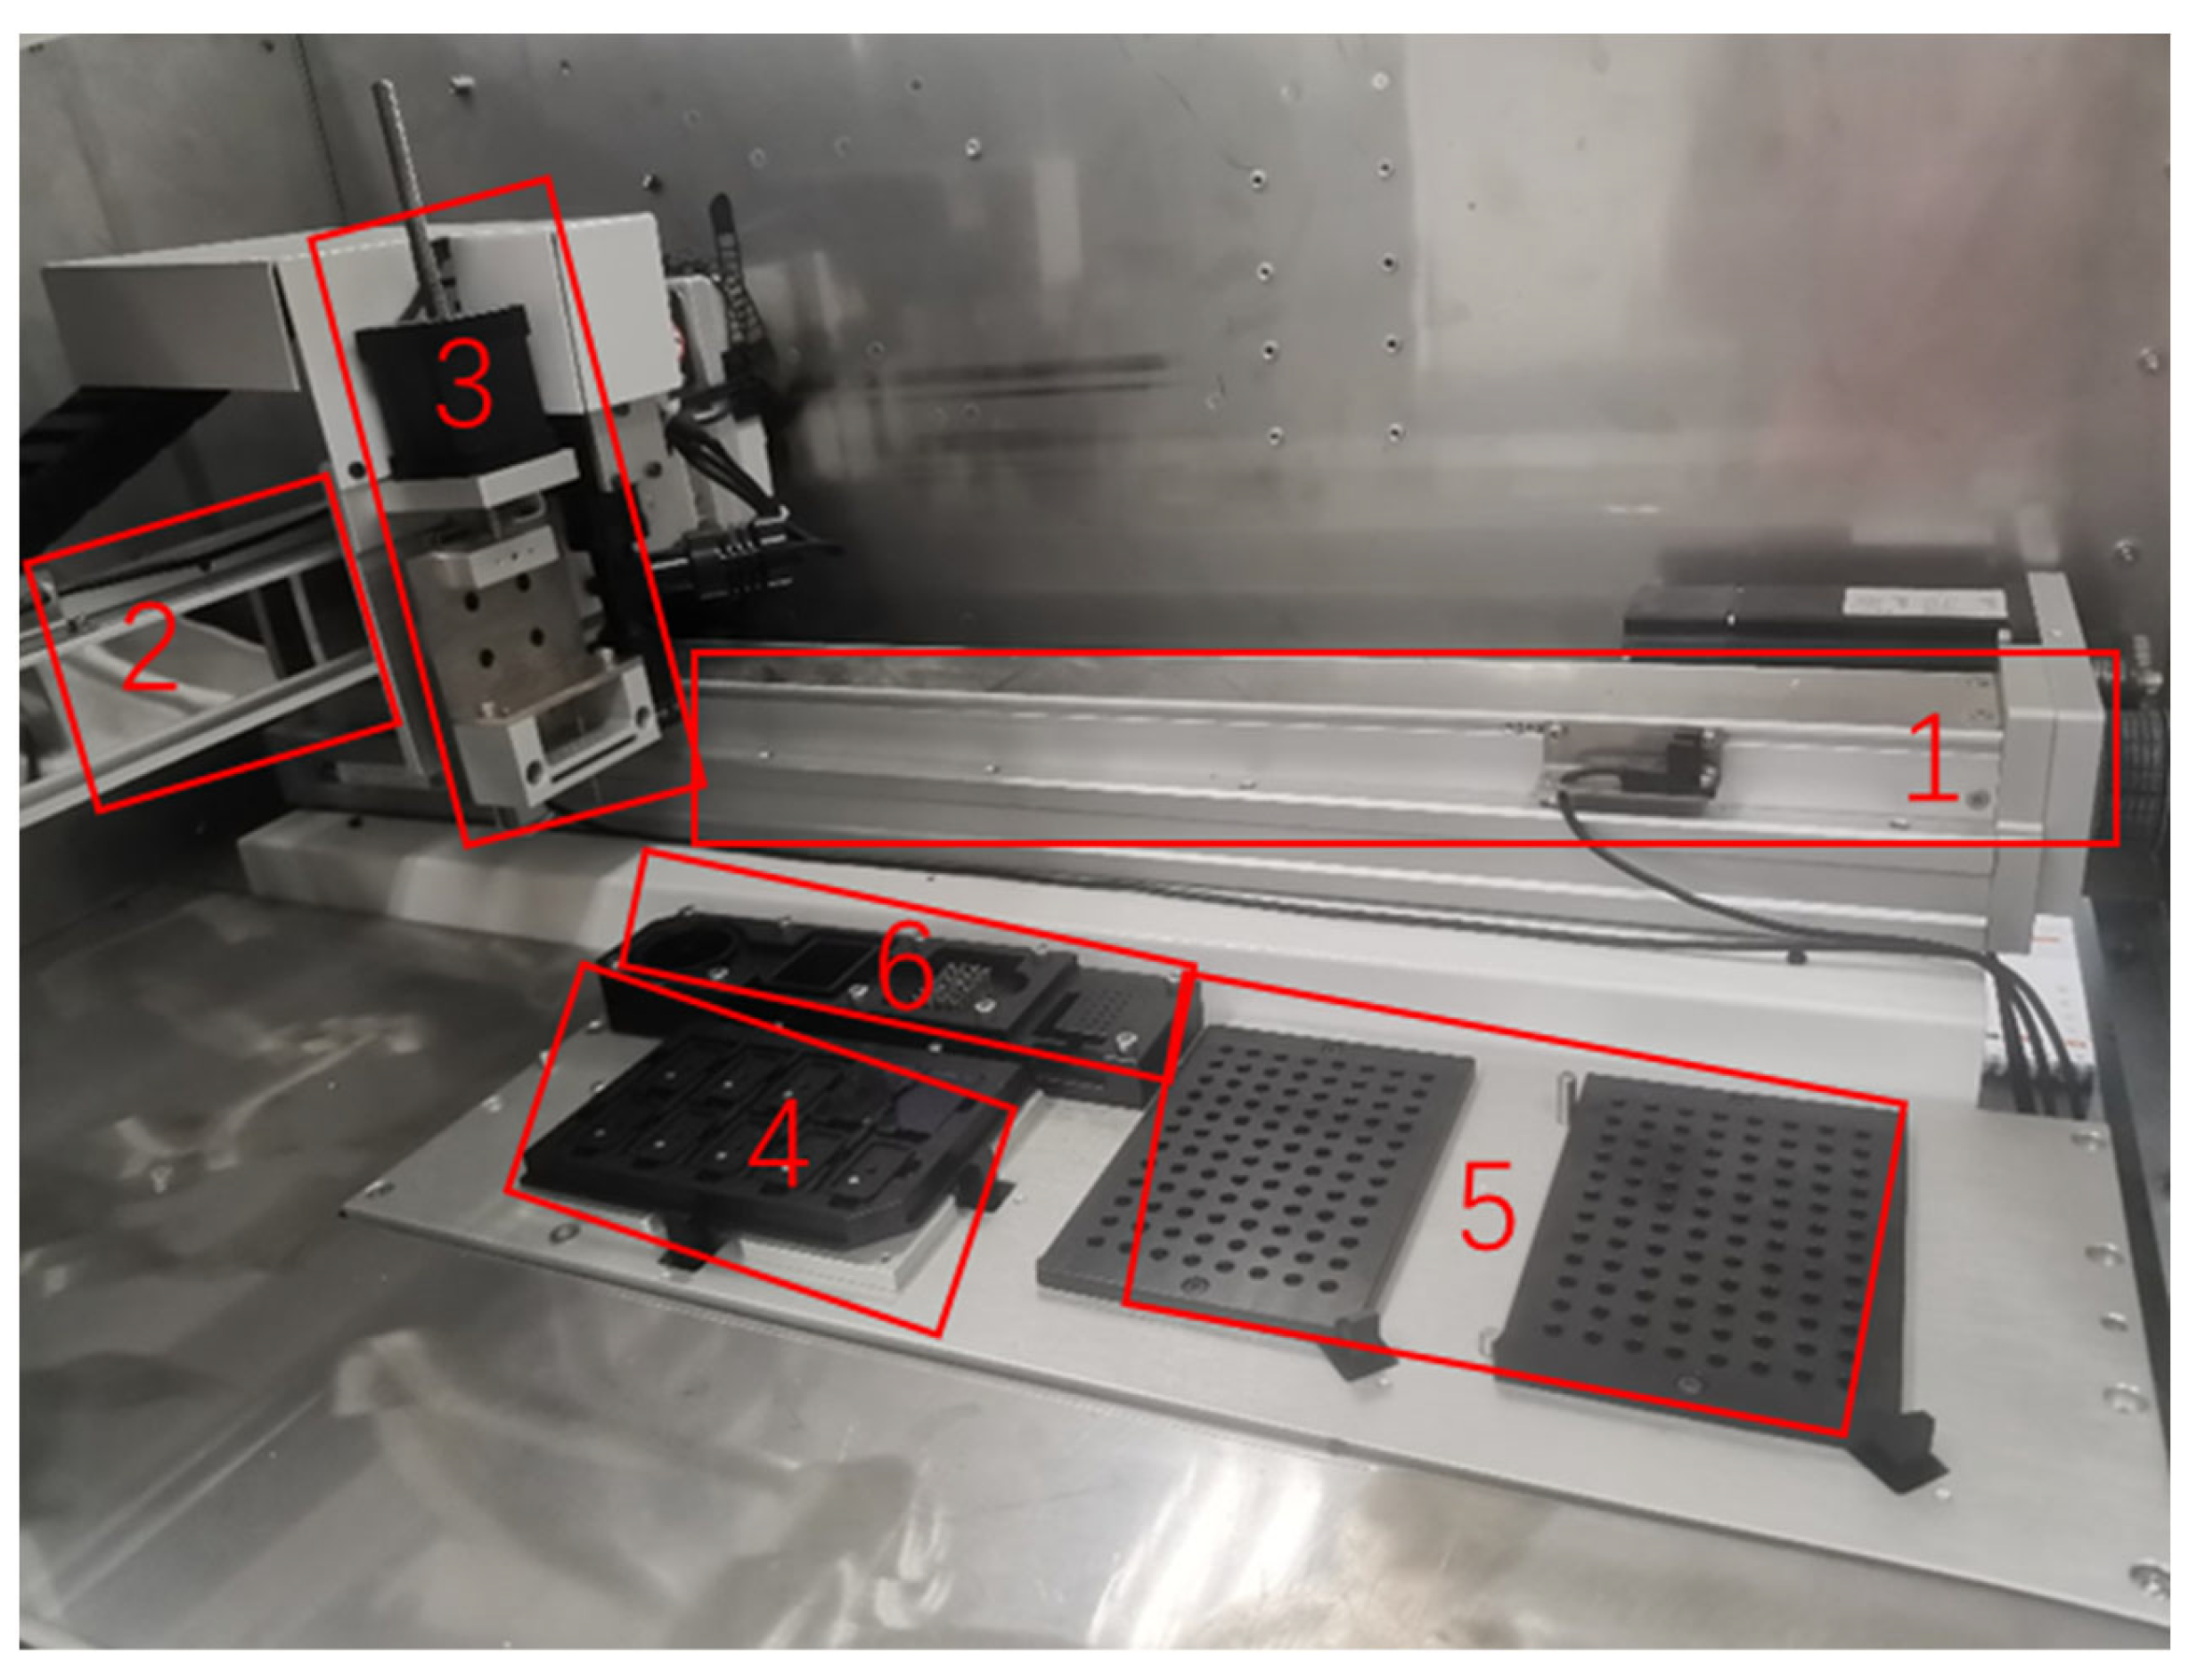
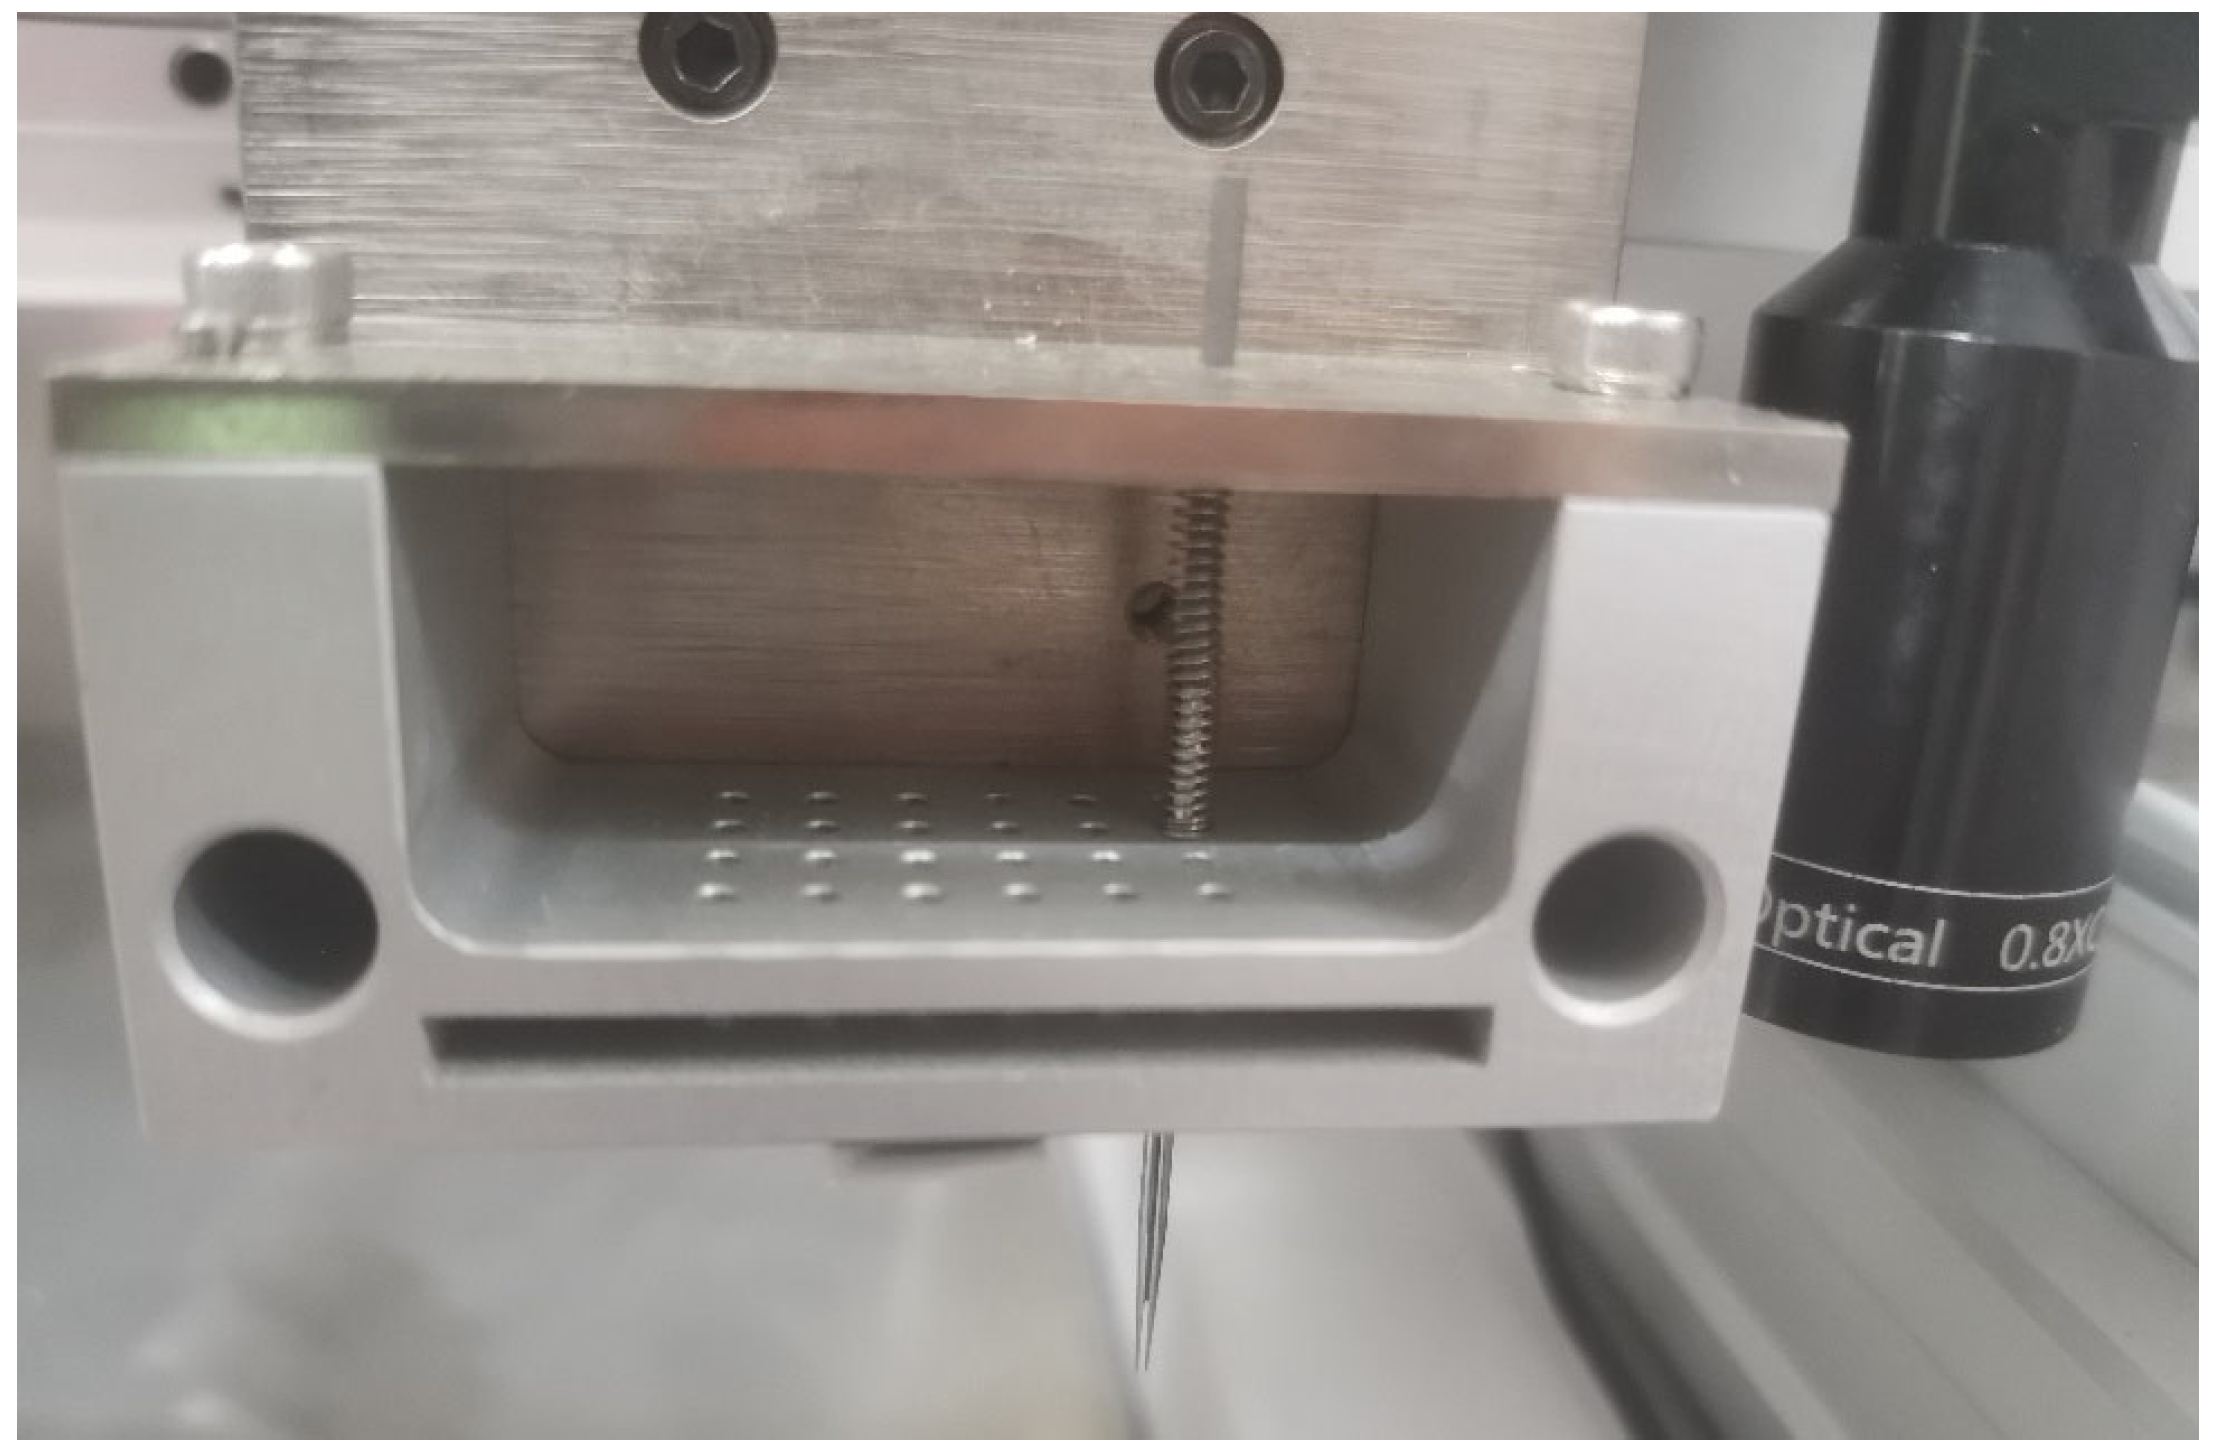
2.1. Momentum-Driven Droplet Image Acquisition
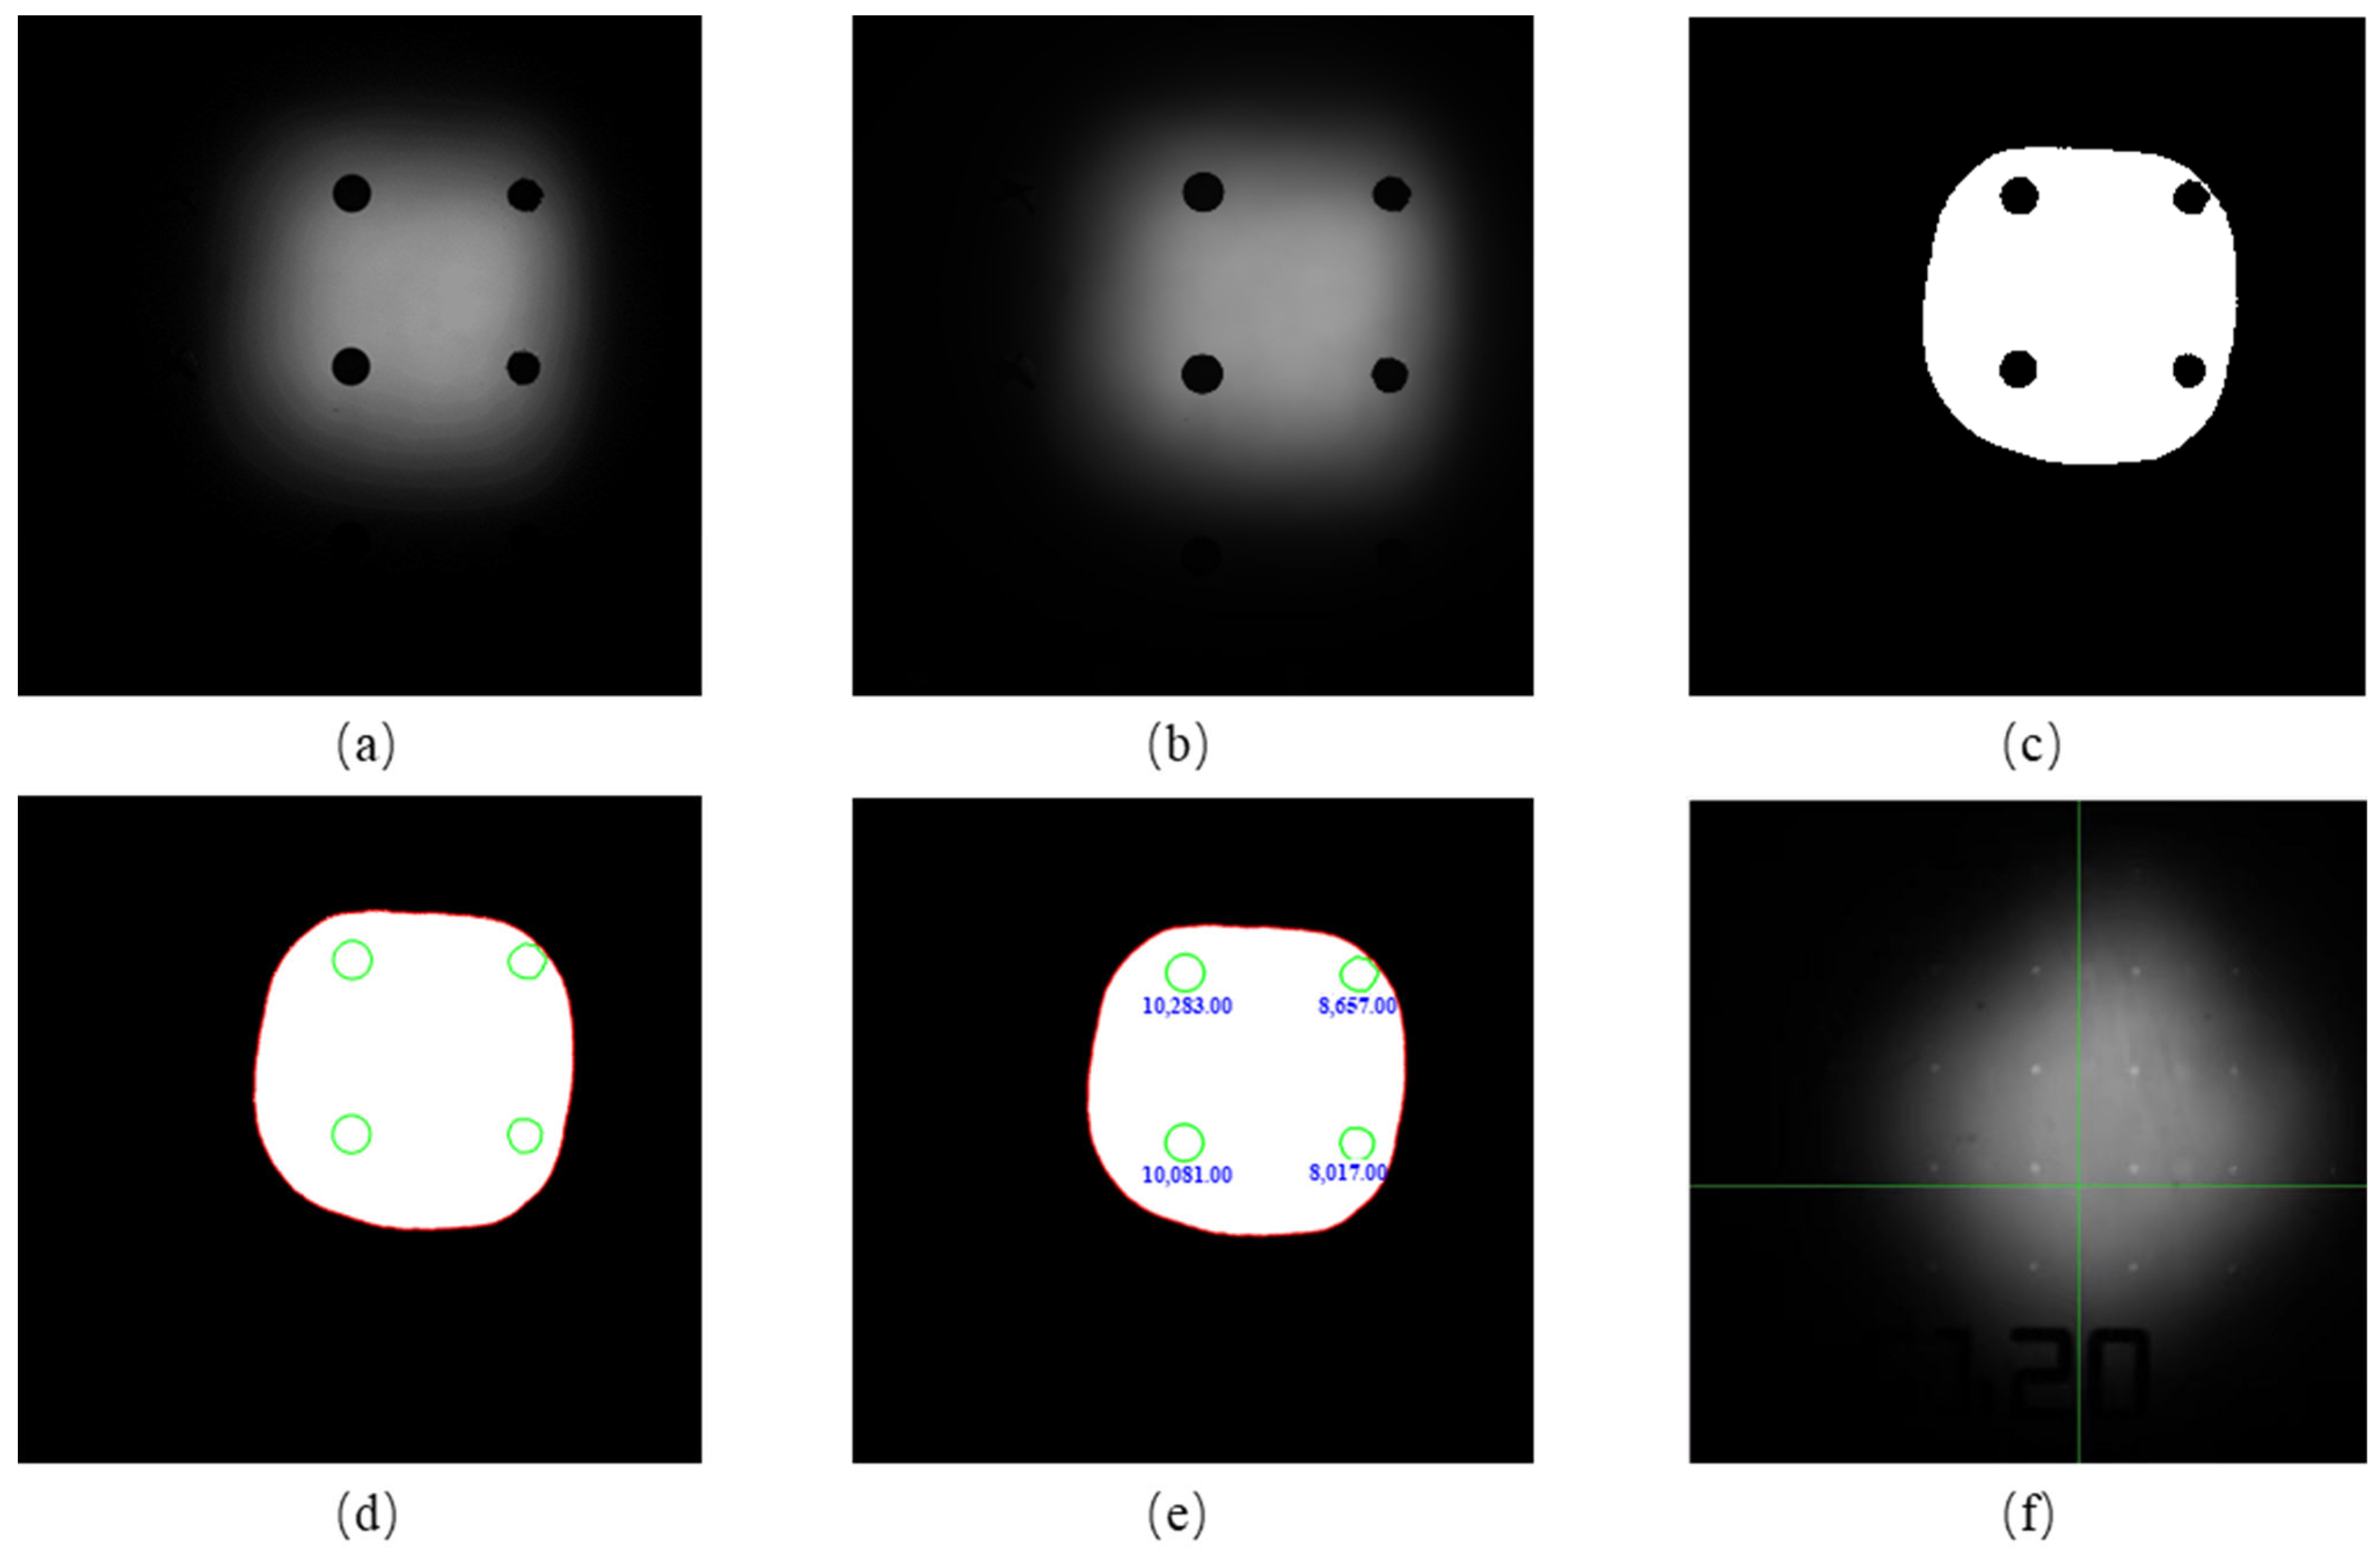
2.2. Image Pre-Processing
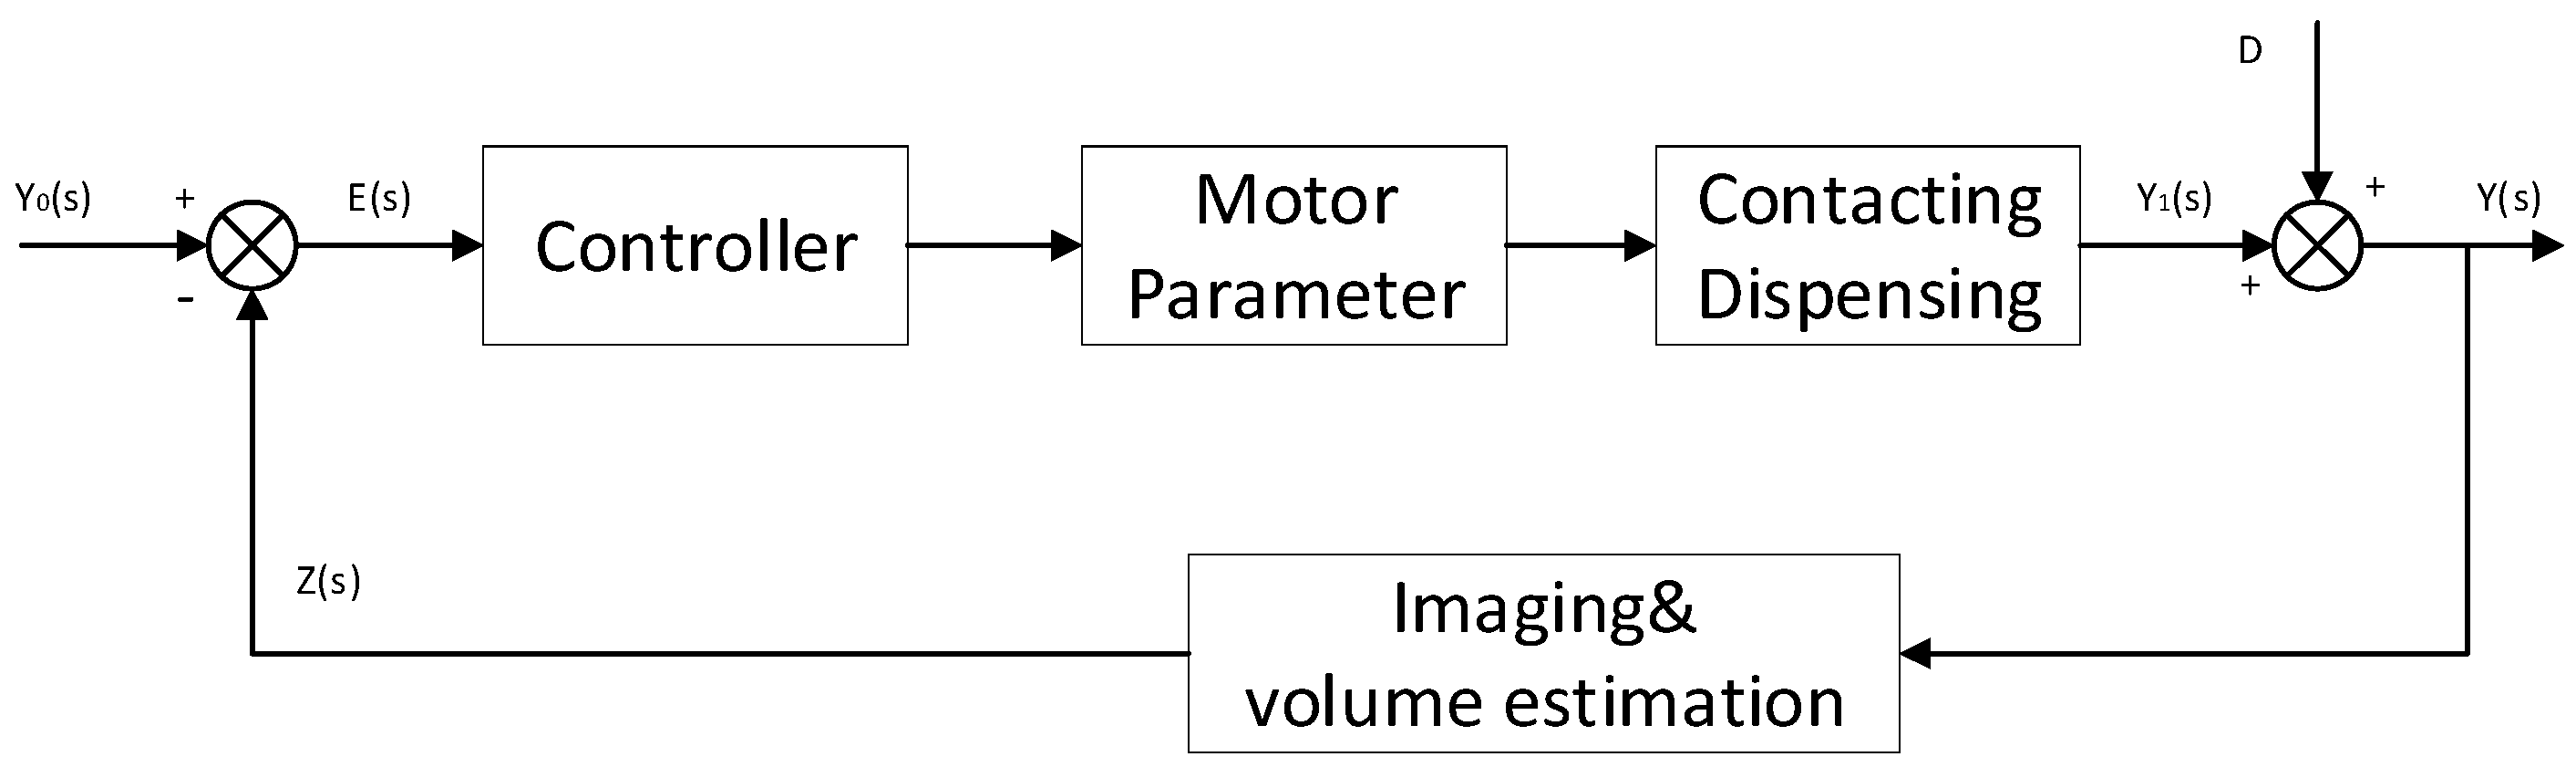
2.3. Incorporation with Feedback Control
3. Results
4. Discussion
5. Conclusions
Author Contributions
Funding
Data Availability Statement
Conflicts of Interest
References
- Bijarchi, M.A.; Favakeh, A.; Alborzi, S.; Shafii, M.B. Experimental investigation of on-demand ferrofluid droplet generation in microfluidics using a Pulse-Width Modulation magnetic field with proposed correlation. Sens. Actuators B Chem. 2020, 329, 129274. [Google Scholar] [CrossRef]
- Zeng, W.; Yang, S.; Liu, Y.; Yang, T.; Tong, Z.; Shan, X.; Fu, H. Precise monodisperse droplet generation by pressure-driven microfluidic flows. Chem. Eng. Sci. 2022, 248 Part B, 117206. [Google Scholar] [CrossRef]
- Fadaei, M.; Majidi, S.; Mojaddam, M. Droplet generation in a co-flowing microchannel influenced by magnetic fields applied in parallel and perpendicular to flow directions. J. Magn. Magn. Mater. 2023, 570, 170528. [Google Scholar] [CrossRef]
- Thaysen, J.; Marie, R.; Boisen, A. Cantilever-based bio-chemical sensor integrated in a microliquid handling system. In Proceedings of the 14th IEEE International Conference on Micro Electro Mechanical Systems, Interlaken, Switzerland, 25 January 2001. [Google Scholar]
- Coelho, B.J.; Neto, J.P.; Sieira, B.; Moura, A.T.; Fortunato, E.; Martins, R.; Baptista, P.V.; Igreja, R.; Águas, H. Hybrid Digital-Droplet Microfluidic Chip for Applications in Droplet Digital Nucleic Acid Amplification: Design, Fabrication and Characterization. Sensors 2023, 23, 4927. [Google Scholar] [CrossRef]
- Mcdowall, R.D. SAMPLE HANDLING. Automated Sample Preparation. Encycl. Anal. Sci. 2005, 7, 177–183. [Google Scholar]
- Noparatayaporn, P.; Sakulbumrungsil, R.; Thaweethamcharoen, T.; Sangseenil, W. Comparison on Human Resource Requirement between Manual and Automated Dispensing Systems. Value Health Reg. Issues 2017, 12, 107–111. [Google Scholar] [CrossRef]
- Takken, M.; Wille, R. Simulation of Pressure-Driven and Channel-Based Microfluidics on Different Abstract Levels: A Case Study. Sensors 2022, 22, 5392. [Google Scholar] [CrossRef]
- Torres-Acosta, M.A.; Lye, G.J.; Dikicioglu, D. Automated liquid-handling operations for robust, resilient, and efficient bio-based laboratory practices. Biochem. Eng. J. 2022, 188, 108713. [Google Scholar] [CrossRef]
- Lee, J.; Koen, V.; Gooris, G.; O’Mahony, C.; Jiskoot, W.; Bouwstra, J. Engineering of an automated nano-droplet dispensing system for fabrication of antigen-loaded dissolving microneedle arrays. Int. J. Pharm. 2021, 600, 120473. [Google Scholar] [CrossRef]
- Jia, M.; Wu, M.; Li, Y.; Xiong, B.; Wang, L.; Ling, X.; Cheng, W.; Dong, W.-F. Quantitative Method for Liquid Chromatography–Mass Spectrometry Based on Multi-Sliding Window and Noise Estimation. Processes 2022, 10, 1098. [Google Scholar] [CrossRef]
- Das, C.; Wang, G.; Nguyen, C. A Low-Cost, Accurate, and High-Precision Fluid Dispensing System for Microscale Application. J. Lab Autom. 2017, 22, 144. [Google Scholar] [CrossRef]
- Wu, Y.; Chen, H.; Wang, W.; He, N.; Liu, B. Development and Validation of an Automated Liquid Handling System for Sample Preparation Based on Multichannel Air Displacement Pipetting Technology. J. Nanosci. Nanotechnol. 2016, 16, 6867–6871. [Google Scholar] [CrossRef]
- ISO 8655:2022; Piston-Operated Volumetric Apparatus. ISO: Geneva, Switzerland, 2022.
- JJG 646-2006; Verification Regulation of Locomotive Pipette. AQSIQ: Beijing, China, 2006.
- Lin, T.T.; Wang, J.W.; Shi, Q.N.; Wang, H.F.; Pan, J.Z.; Fang, Q. An automated, fully-integrated nucleic acid analyzer based on microfluidic liquid handling robot technique. Anal. Chim. Acta 2023, 1239, 340698. [Google Scholar] [CrossRef]
- Wu, A.; French, D. Implementation of liquid chromatography/mass spectrometry into the clinical laboratory. Clin. Chim. Acta 2013, 420, 4–10. [Google Scholar] [CrossRef]
- Luo, Y.; Zheng, Z.; Zheng, X.; Li, Y.; Che, Z.; Fang, J.; Xi, L.; Nguyen, N.T.; Song, C. Model-based feedback control for on-demand droplet dispensing system with precise real-time phase imaging. Sens. Actuators B Chem. 2022, 365, 131936. [Google Scholar] [CrossRef]
- Wiley, W.C.; Mclaren, I.H. Time-of-Flight Mass Spectrometer with Improved Resolution. Rev. Sci. Instrum. 1955, 26, 1150. [Google Scholar] [CrossRef]
- Strupat, K.; Karas, M.; Hillenkamp, F. 2,5-Dihydroxybenzoic acid: A new matrix for laser desorption—Ionization mass spectrometry. Int. J. Mass Spectrom. Ion Process. 1991, 111, 89–102. [Google Scholar] [CrossRef]
- Nielen, M.; Hooijerink, H.; Zomer, P.; Mol, J. Desorption electrospray ionization mass spectrometry in the analysis of chemical food contaminants in food. Trends Anal. Chem. 2011, 30, 165–180. [Google Scholar] [CrossRef]
- Silbert, R.; Capella, R.; Cuzens, J. Integrated Robotic Sample Transfer Device. U.S. Patent 9068953B2, 30 June 2015. [Google Scholar]
- Niemitz, L.; van der Stel, S.D.; Sorensen, S.; Messina, W.; Venkata Sekar, S.K.; Sterenborg, H.J.C.M.; Andersson-Engels, S.; Ruers, T.J.M.; Burke, R. Microcamera Visualisation System to Overcome Specular Reflections for Tissue Imaging. Micromachines 2023, 14, 1062. [Google Scholar] [CrossRef]
- Khlynov, R.D.; Ryzhova, V.A.; Yarishev, S.N.; Konyakhin, I.A.; Korotaev, V.V.; Shelepin, Y.E.; Djamiykov, T.S.; Marinov, M.B. Analysis of Polarization Images in the Microphysical Blood Parameters Research for the Hematocrit Diagnostics. Micromachines 2022, 13, 2241. [Google Scholar] [CrossRef]
- Wang, Y.; Jia, H.; Jia, P.; Chen, K. An Automatic Detection Method for Cutting Path of Chips in Wafer. Micromachines 2023, 14, 59. [Google Scholar] [CrossRef]
- Li, K.; Kinoshita, Y.; Sakai, D.; Kawano, Y. Recent Progress in Development of Carbon-Nanotube-Based Photo-Thermoelectric Sensors and Their Applications in Ubiquitous Non-Destructive Inspections. Micromachines 2023, 14, 61. [Google Scholar] [CrossRef]
- Chien, C.-Y.; Yang, Y.; Gong, Y.; Yue, Y.; Chen, H. Blood-brain barrier opening by individualized closed-loop feedback control of focused ultrasound. BME Front. 2022, 2022, 9867230. [Google Scholar] [CrossRef]
- Soto, M.G.; Adeli, H. Recent advances in control algorithms for smart structures and machines. Expert Syst. 2017, 34, e12205. [Google Scholar] [CrossRef]
- Tukey, J.W. Exploratory Data Analysis; Addison-Wesley: Reading, MA, USA, 1977. [Google Scholar]
- Appiah, O.; Asante, M.; Hayfron-Acquah, J.B. Improved approximated median filter algorithm for real-time computer vision applications. J. King Saud Univ.Comput. Inf. Sci. 2022, 34, 782–792. [Google Scholar] [CrossRef]
- Otsu, N. A Threshold Selection Method from Gray-Level Histograms. IEEE Trans. Syst. Man Cybern. 1979, 9, 62–66. [Google Scholar] [CrossRef]
- Morton, C.C. Genetics, genomics and gene discovery in the auditory system. Hum. Mol. Genet. 2002, 11, 1229–1240. [Google Scholar] [CrossRef]
- Jacobs, H.T.; Hutchin, T.P.; Kappi, T.; Gillies, G.; Minkkinen, K.; Walker, J.; Thompson, K.; Rovio, A.T.; Carella, M.; Melchionda, S. Mitochondrial DNA mutations in patients with postlingual, nonsyndromic hearing impairment. Eur. J. Hum. Genet. EJHG 2005, 1, 13. [Google Scholar] [CrossRef]


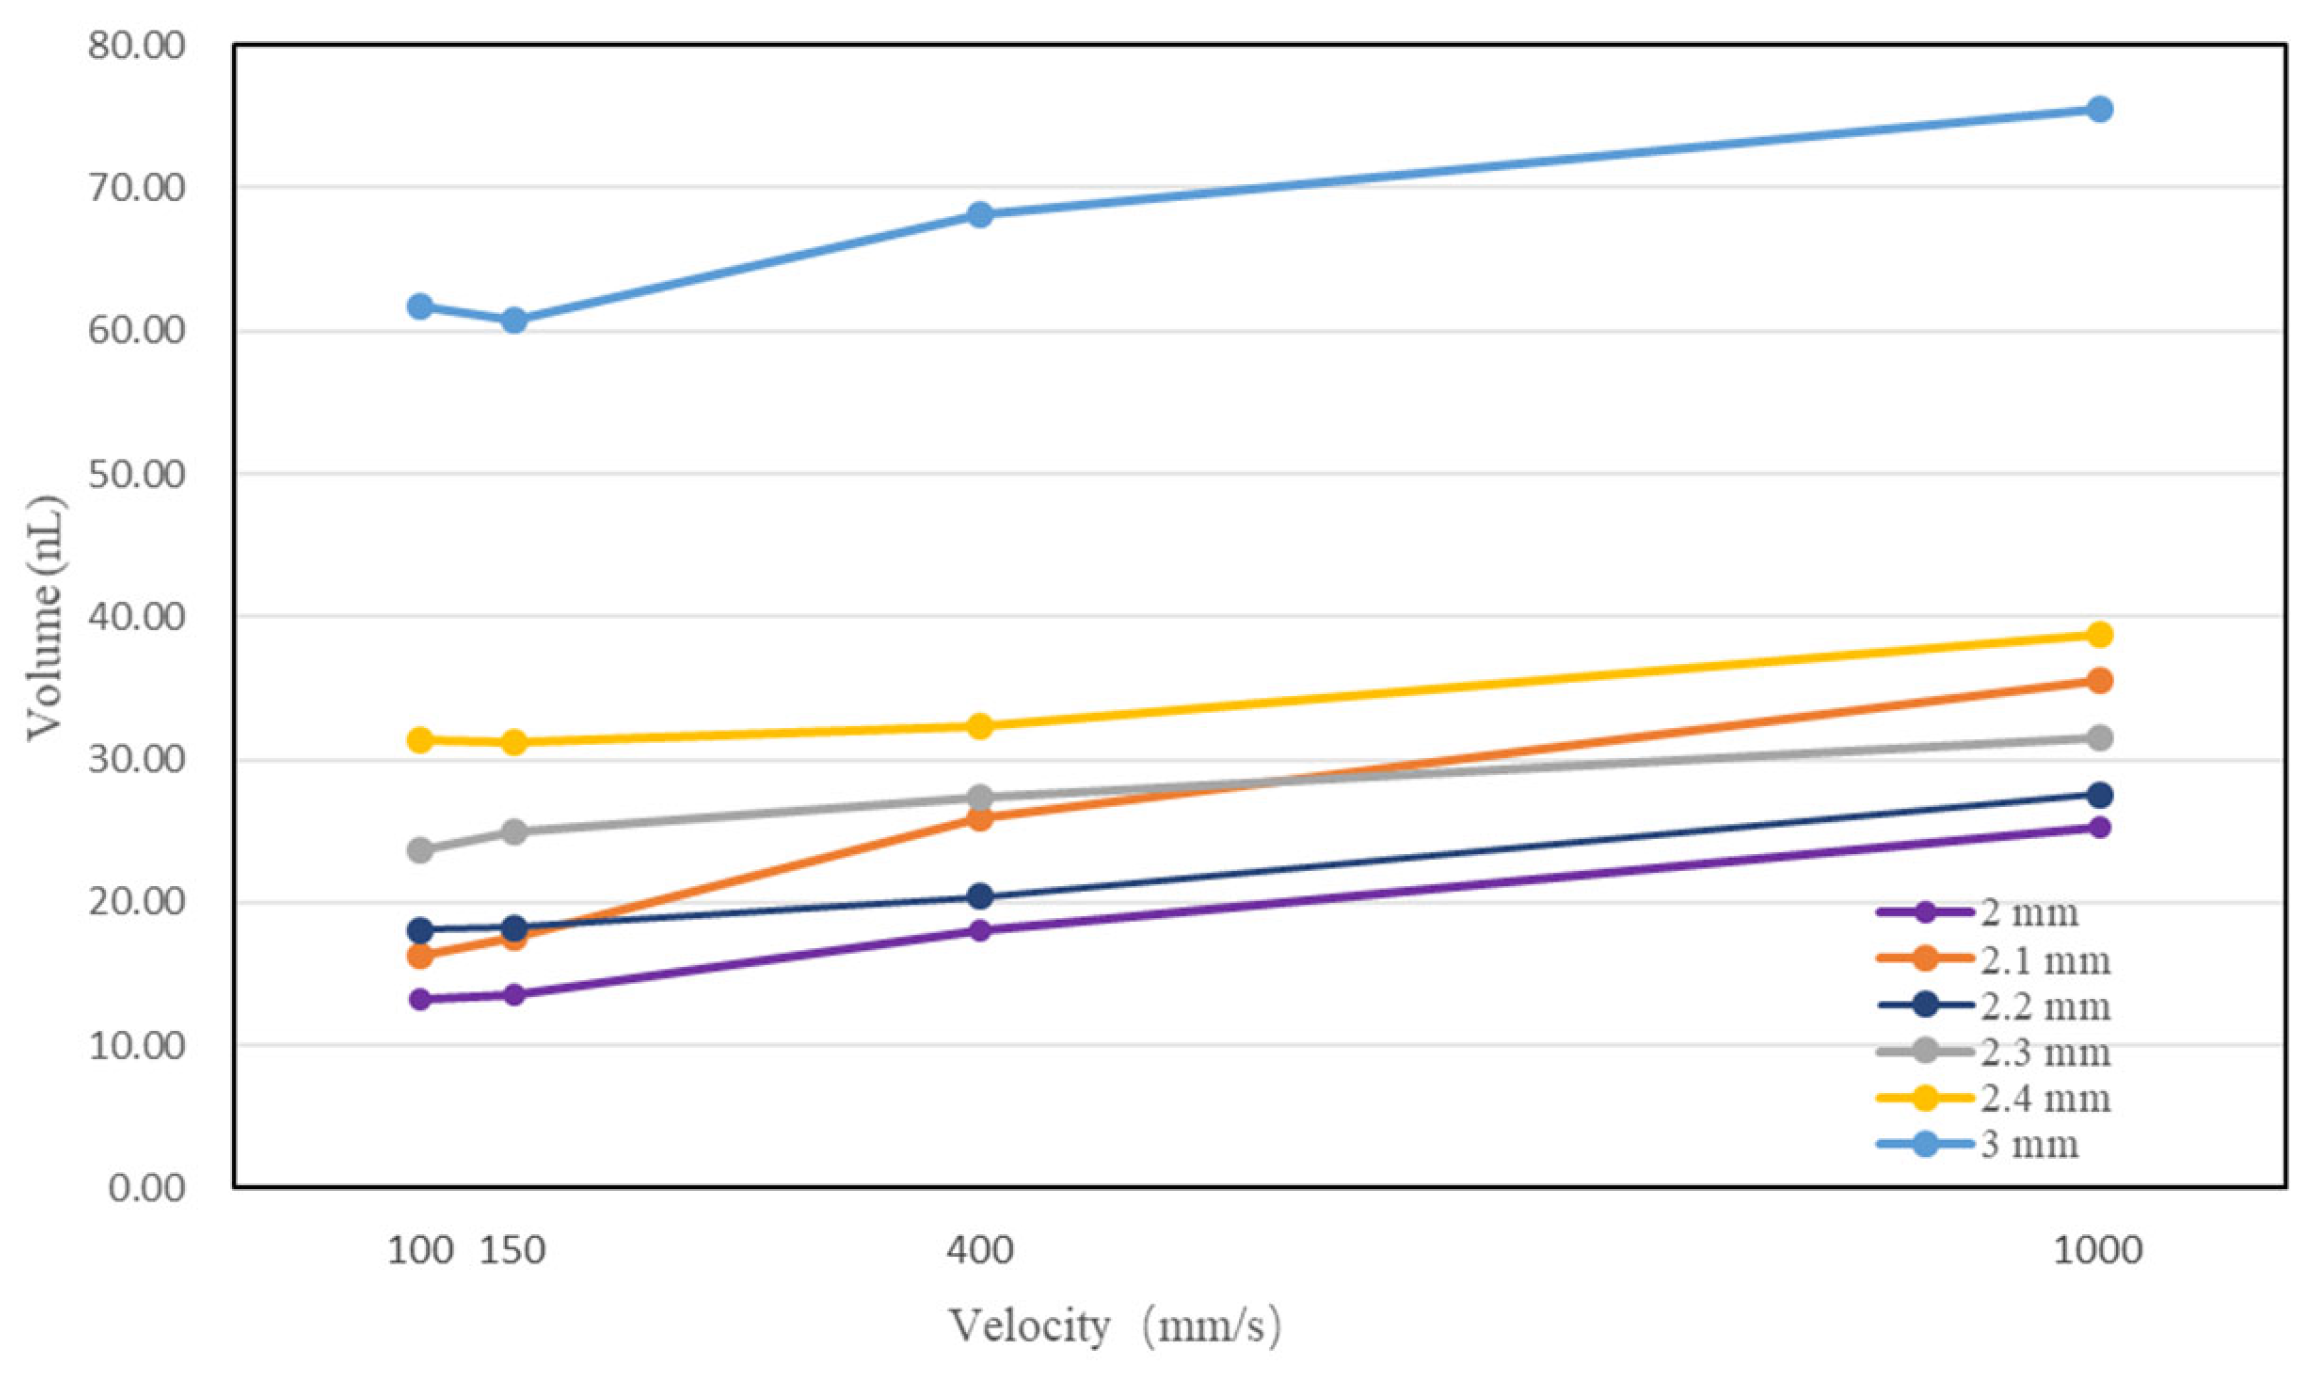
| Velocity (mm/s) | Volume (nL) | |||||
|---|---|---|---|---|---|---|
| Dipping Depth 2 mm | Dipping Depth 2.1 mm | Dipping Depth 2.2 mm | Dipping Depth 2.3 mm | Dipping Depth 2.4 mm | Dipping Depth 3 mm | |
| 100 | 13.27 | 16.26 | 18.10 | 23.75 | 31.42 | 61.72 |
| 150 | 13.53 | 17.52 | 18.25 | 25.00 | 31.26 | 60.79 |
| 400 | 18.09 | 25.89 | 20.45 | 27.31 | 32.27 | 68.18 |
| 1000 | 25.25 | 35.57 | 27.57 | 31.57 | 38.75 | 75.53 |
| Volume (nL) | ||||||
|---|---|---|---|---|---|---|
| Dipping Depth 2 mm | Dipping Depth 2.1 mm | Dipping Depth 2.2 mm | Dipping Depth 2.3 mm | Dipping Depth 2.4 mm | Dipping Depth 3 mm | |
| 1 | 13.15 | 16.42 | 18.11 | 23.64 | 31.45 | 61.79 |
| 2 | 12.89 | 16.27 | 17.94 | 23.75 | 31.51 | 61.91 |
| 3 | 13.12 | 16.33 | 18.24 | 23.91 | 31.27 | 61.58 |
| 4 | 13.21 | 16.24 | 17.91 | 23.77 | 31.36 | 61.66 |
| 5 | 13.23 | 15.99 | 18.06 | 23.52 | 31.23 | 61.73 |
| 6 | 12.94 | 16.04 | 18.25 | 23.73 | 31.35 | 61.89 |
| 7 | 13.29 | 16.15 | 18.04 | 23.89 | 31.57 | 61.70 |
| 8 | 12.77 | 16.29 | 18.27 | 23.66 | 31.47 | 61.69 |
| 9 | 13.36 | 16.18 | 18.16 | 23.93 | 31.39 | 61.52 |
| 10 | 13.45 | 16.36 | 18.33 | 23.55 | 31.55 | 61.61 |
| Average | 13.14 | 16.23 | 18.13 | 23.74 | 31.42 | 61.71 |
| SD | 0.22 | 0.14 | 0.14 | 0.15 | 0.11 | 0.13 |
| Fluid | Density (Kg/m3) | Viscosity (Pa·s) |
|---|---|---|
| Water | 997.04 | 0.0009 |
| Calibrator | 996.81 | 0.0009 |
| Sample 1 | 1134.91 | 0.0013 |
| Sample 2 | 1467.62 | 0.0024 |
| Volume (nL) | ||||
|---|---|---|---|---|
| Pure Water (Pixels) | Calibrator (Pixels) | Sample 1 (Pixels) | Sample 2 (Pixels) | |
| 1 | 15,831 | 16,403 | 16,144 | 16,308 |
| 2 | 15,869 | 16,164 | 15,757 | 16,205 |
| 3 | 15,912 | 15,922 | 16,417 | 15,838 |
| 4 | 16,006 | 16,193 | 15,792 | 16,035 |
| 5 | 15,918 | 16,404 | 16,080 | 16,173 |
| 6 | 16,298 | 16,016 | 16,292 | 16,227 |
| 7 | 16,431 | 16,167 | 16,242 | 15,923 |
| 8 | 15,869 | 16,084 | 15,883 | 16,367 |
| 9 | 15,933 | 15,979 | 16,344 | 15,827 |
| 10 | 15,957 | 16,127 | 15,899 | 16,061 |
| SD | 199.5083958 | 161.5057275 | 239.7086194 | 190.6580418 |
| Volume (nL) | ||||
|---|---|---|---|---|
| Pure Water (Pixels) | Calibrator (Pixels) | Sample 1 (Pixels) | Sample 2 (Pixels) | |
| 1 | 71.32 | 70.07 | 35.25 | 20.03 |
| 2 | 70.27 | 69.77 | 35.40 | 20.10 |
| 3 | 70.18 | 69.75 | 35.31 | 19.98 |
| 4 | 70.23 | 69.83 | 35.40 | 20.24 |
| 5 | 70.12 | 69.91 | 35.38 | 20.08 |
| 6 | 70.24 | 70.02 | 35.29 | 20.16 |
| 7 | 70.39 | 69.71 | 35.52 | 20.09 |
| 8 | 70.08 | 69.91 | 35.14 | 20.12 |
| 9 | 70.37 | 69.76 | 35.21 | 19.96 |
| 10 | 70.07 | 69.87 | 35.45 | 20.27 |
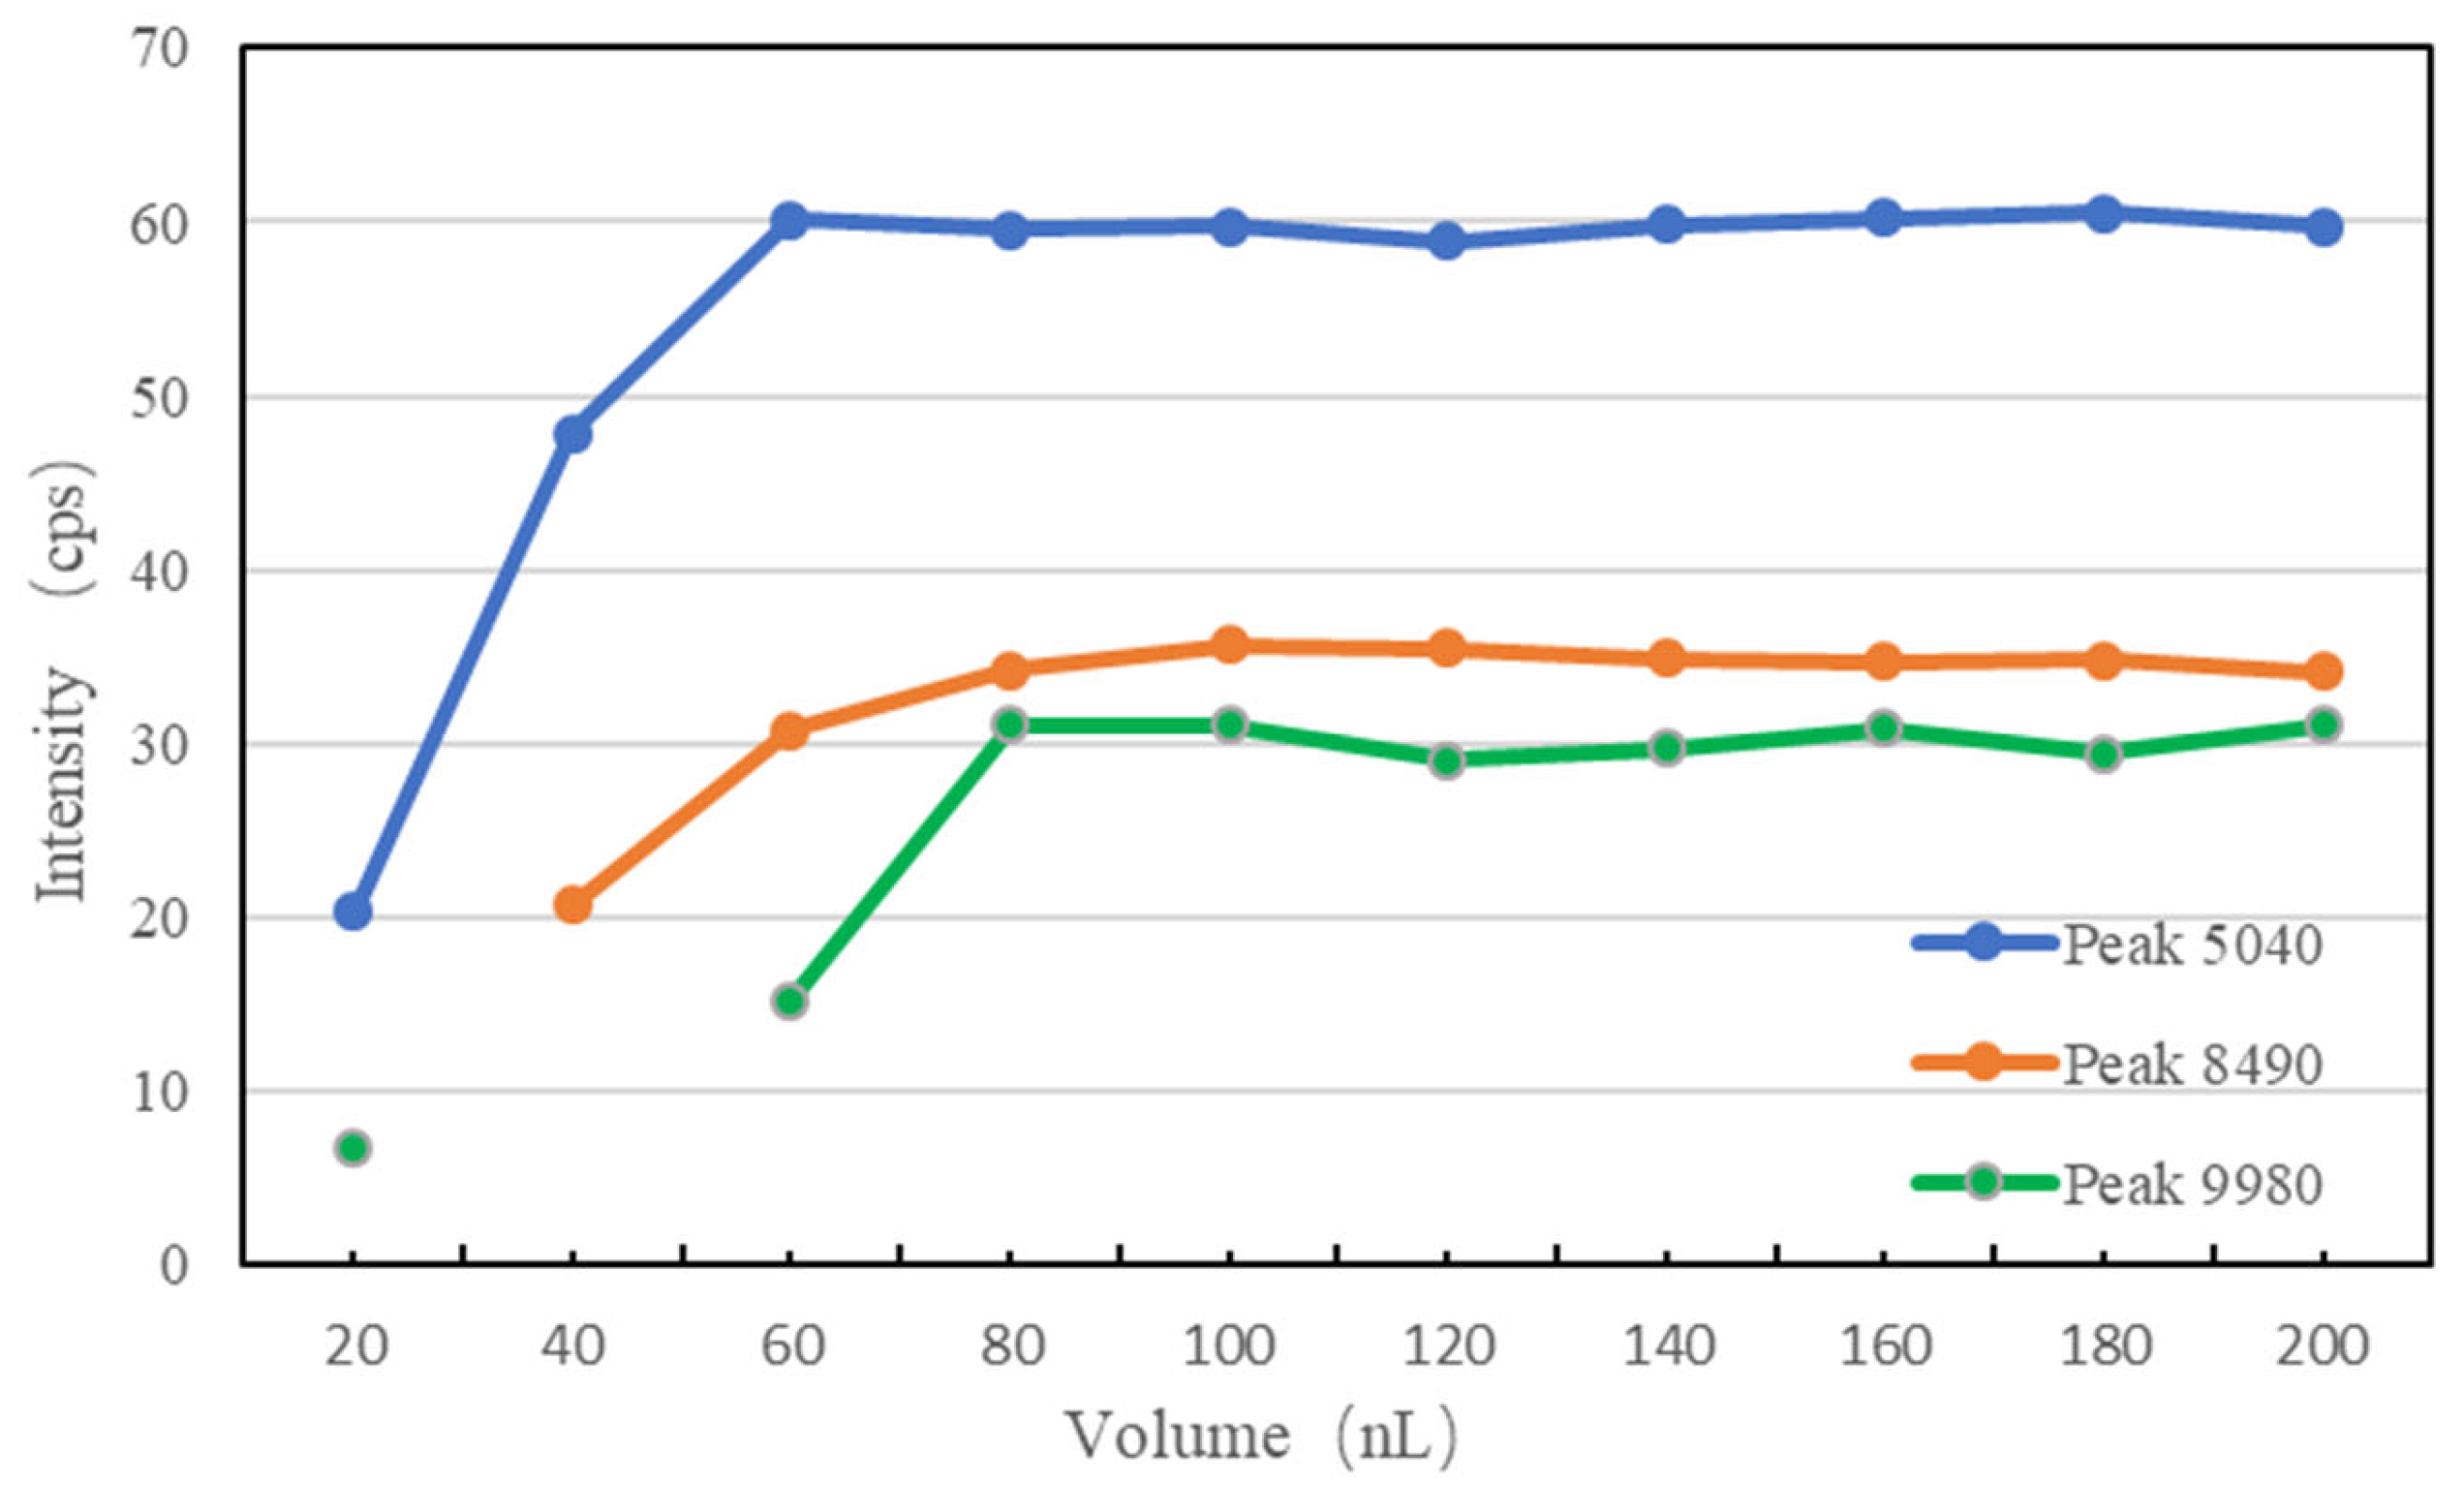
| Volume (nL) | Intensity (cps) | ||
|---|---|---|---|
| Mass 5040 (m/z) | Mass 8490 (m/z) | Mass 9980 (m/z) | |
| 20 | 20.32 | NULL | 6.77 |
| 40 | 47.89 | 20.68 | NULL |
| 60 | 60.15 | 30.76 | 15.24 |
| 80 | 59.56 | 34.26 | 31.06 |
| 100 | 59.71 | 35.64 | 31.10 |
| 120 | 58.92 | 35.46 | 29.08 |
| 140 | 59.85 | 34.87 | 29.69 |
| 160 | 60.18 | 34.73 | 30.87 |
| 180 | 60.52 | 34.84 | 29.38 |
| 200 | 59.73 | 34.12 | 31.04 |
| Sample No. | Intensity (m/z) | Volume (nL) | ||
|---|---|---|---|---|
| Mass 5040 (m/z) | Mass 8490 (m/z) | Mass 9980 (m/z) | ||
| 1 | 58.88 | 34.57 | 29.45 | 101.97 |
| 2 | 57.63 | 35.52 | 30.21 | 101.57 |
| 3 | 60.15 | 35.02 | 30.17 | 99.78 |
| 4 | 59.56 | 34.32 | 29.91 | 101.73 |
| 5 | 59.71 | 35.29 | 30.89 | 102.87 |
| 6 | 58.92 | 35.97 | 30.98 | 100.04 |
| 7 | 59.85 | 35.20 | 29.63 | 103.71 |
| 8 | 60.18 | 34.45 | 29.72 | 100.65 |
| 9 | 60.52 | 34.42 | 30.82 | 101.52 |
| 10 | 59.73 | 35.16 | 29.31 | 103.01 |
| CV (%) | 1.41 | 1.14 | 2.24 | 1.26 |
| Sample No. | Intensity (cps) | Volume (nL) | |||
|---|---|---|---|---|---|
| Mass 6875 (m/z) | Mass 6960 (m/z) | Mass 7105 (m/z) | Mass 7068 (m/z) | ||
| 1 | 43.21 | 49.23 | 23.38 | NULL | 101.42 |
| 2 | 49.42 | 42.48 | 29.41 | NULL | 102.55 |
| 3 | 43.41 | 40.66 | 29.67 | NULL | 99.72 |
| 4 | 40.15 | 42.11 | 30.92 | NULL | 100.52 |
| 5 | 45.67 | 46.77 | 29.48 | 28.68 | 100.23 |
| 6 | 45.55 | 42.06 | 31.03 | NULL | 100.04 |
| 7 | 44.35 | 46.43 | 31.10 | NULL | 100.6 |
| 8 | 47.87 | 49.52 | 29.13 | NULL | 102.38 |
| 9 | 49.53 | 49.78 | 30.58 | NULL | 102.86 |
| 10 | 40.32 | 48.07 | 30.09 | NULL | 100.99 |
| 11 | 47.08 | 44.23 | 29.45 | NULL | 100.12 |
| 12 | 41.23 | 43.77 | 29.19 | NULL | 100.51 |
| 13 | 48.98 | 42.91 | 30.74 | 25.33 | 101.68 |
| 14 | 48.76 | 47.74 | 29.90 | NULL | 99.72 |
| 15 | 49.48 | 41.35 | 30.30 | NULL | 101.81 |
| CV (%) | 1.41 | 1.14 | 2.24 | 1.26 | |
Disclaimer/Publisher’s Note: The statements, opinions and data contained in all publications are solely those of the individual author(s) and contributor(s) and not of MDPI and/or the editor(s). MDPI and/or the editor(s) disclaim responsibility for any injury to people or property resulting from any ideas, methods, instructions or products referred to in the content. |
© 2023 by the authors. Licensee MDPI, Basel, Switzerland. This article is an open access article distributed under the terms and conditions of the Creative Commons Attribution (CC BY) license (https://creativecommons.org/licenses/by/4.0/).
Share and Cite
Qian, Q.; Xu, W.; Tian, H.; Cheng, W.; Zhou, L.; Wang, J. Model-Based Feedback Control for an Automated Micro Liquid Dispensing System Based on Contacting Droplet Generation through Image Sensing. Micromachines 2023, 14, 1938. https://doi.org/10.3390/mi14101938
Qian Q, Xu W, Tian H, Cheng W, Zhou L, Wang J. Model-Based Feedback Control for an Automated Micro Liquid Dispensing System Based on Contacting Droplet Generation through Image Sensing. Micromachines. 2023; 14(10):1938. https://doi.org/10.3390/mi14101938
Chicago/Turabian StyleQian, Qing, Wenchang Xu, Haoran Tian, Wenbo Cheng, Lianqun Zhou, and Jishuai Wang. 2023. "Model-Based Feedback Control for an Automated Micro Liquid Dispensing System Based on Contacting Droplet Generation through Image Sensing" Micromachines 14, no. 10: 1938. https://doi.org/10.3390/mi14101938
APA StyleQian, Q., Xu, W., Tian, H., Cheng, W., Zhou, L., & Wang, J. (2023). Model-Based Feedback Control for an Automated Micro Liquid Dispensing System Based on Contacting Droplet Generation through Image Sensing. Micromachines, 14(10), 1938. https://doi.org/10.3390/mi14101938