
An Arterial Compliance Sensor for Cuffless Blood Pressure Estimation Based on Piezoelectric and Optical Signals


Abstract
:1. Introduction
Our Contribution
2. Materials and Methods
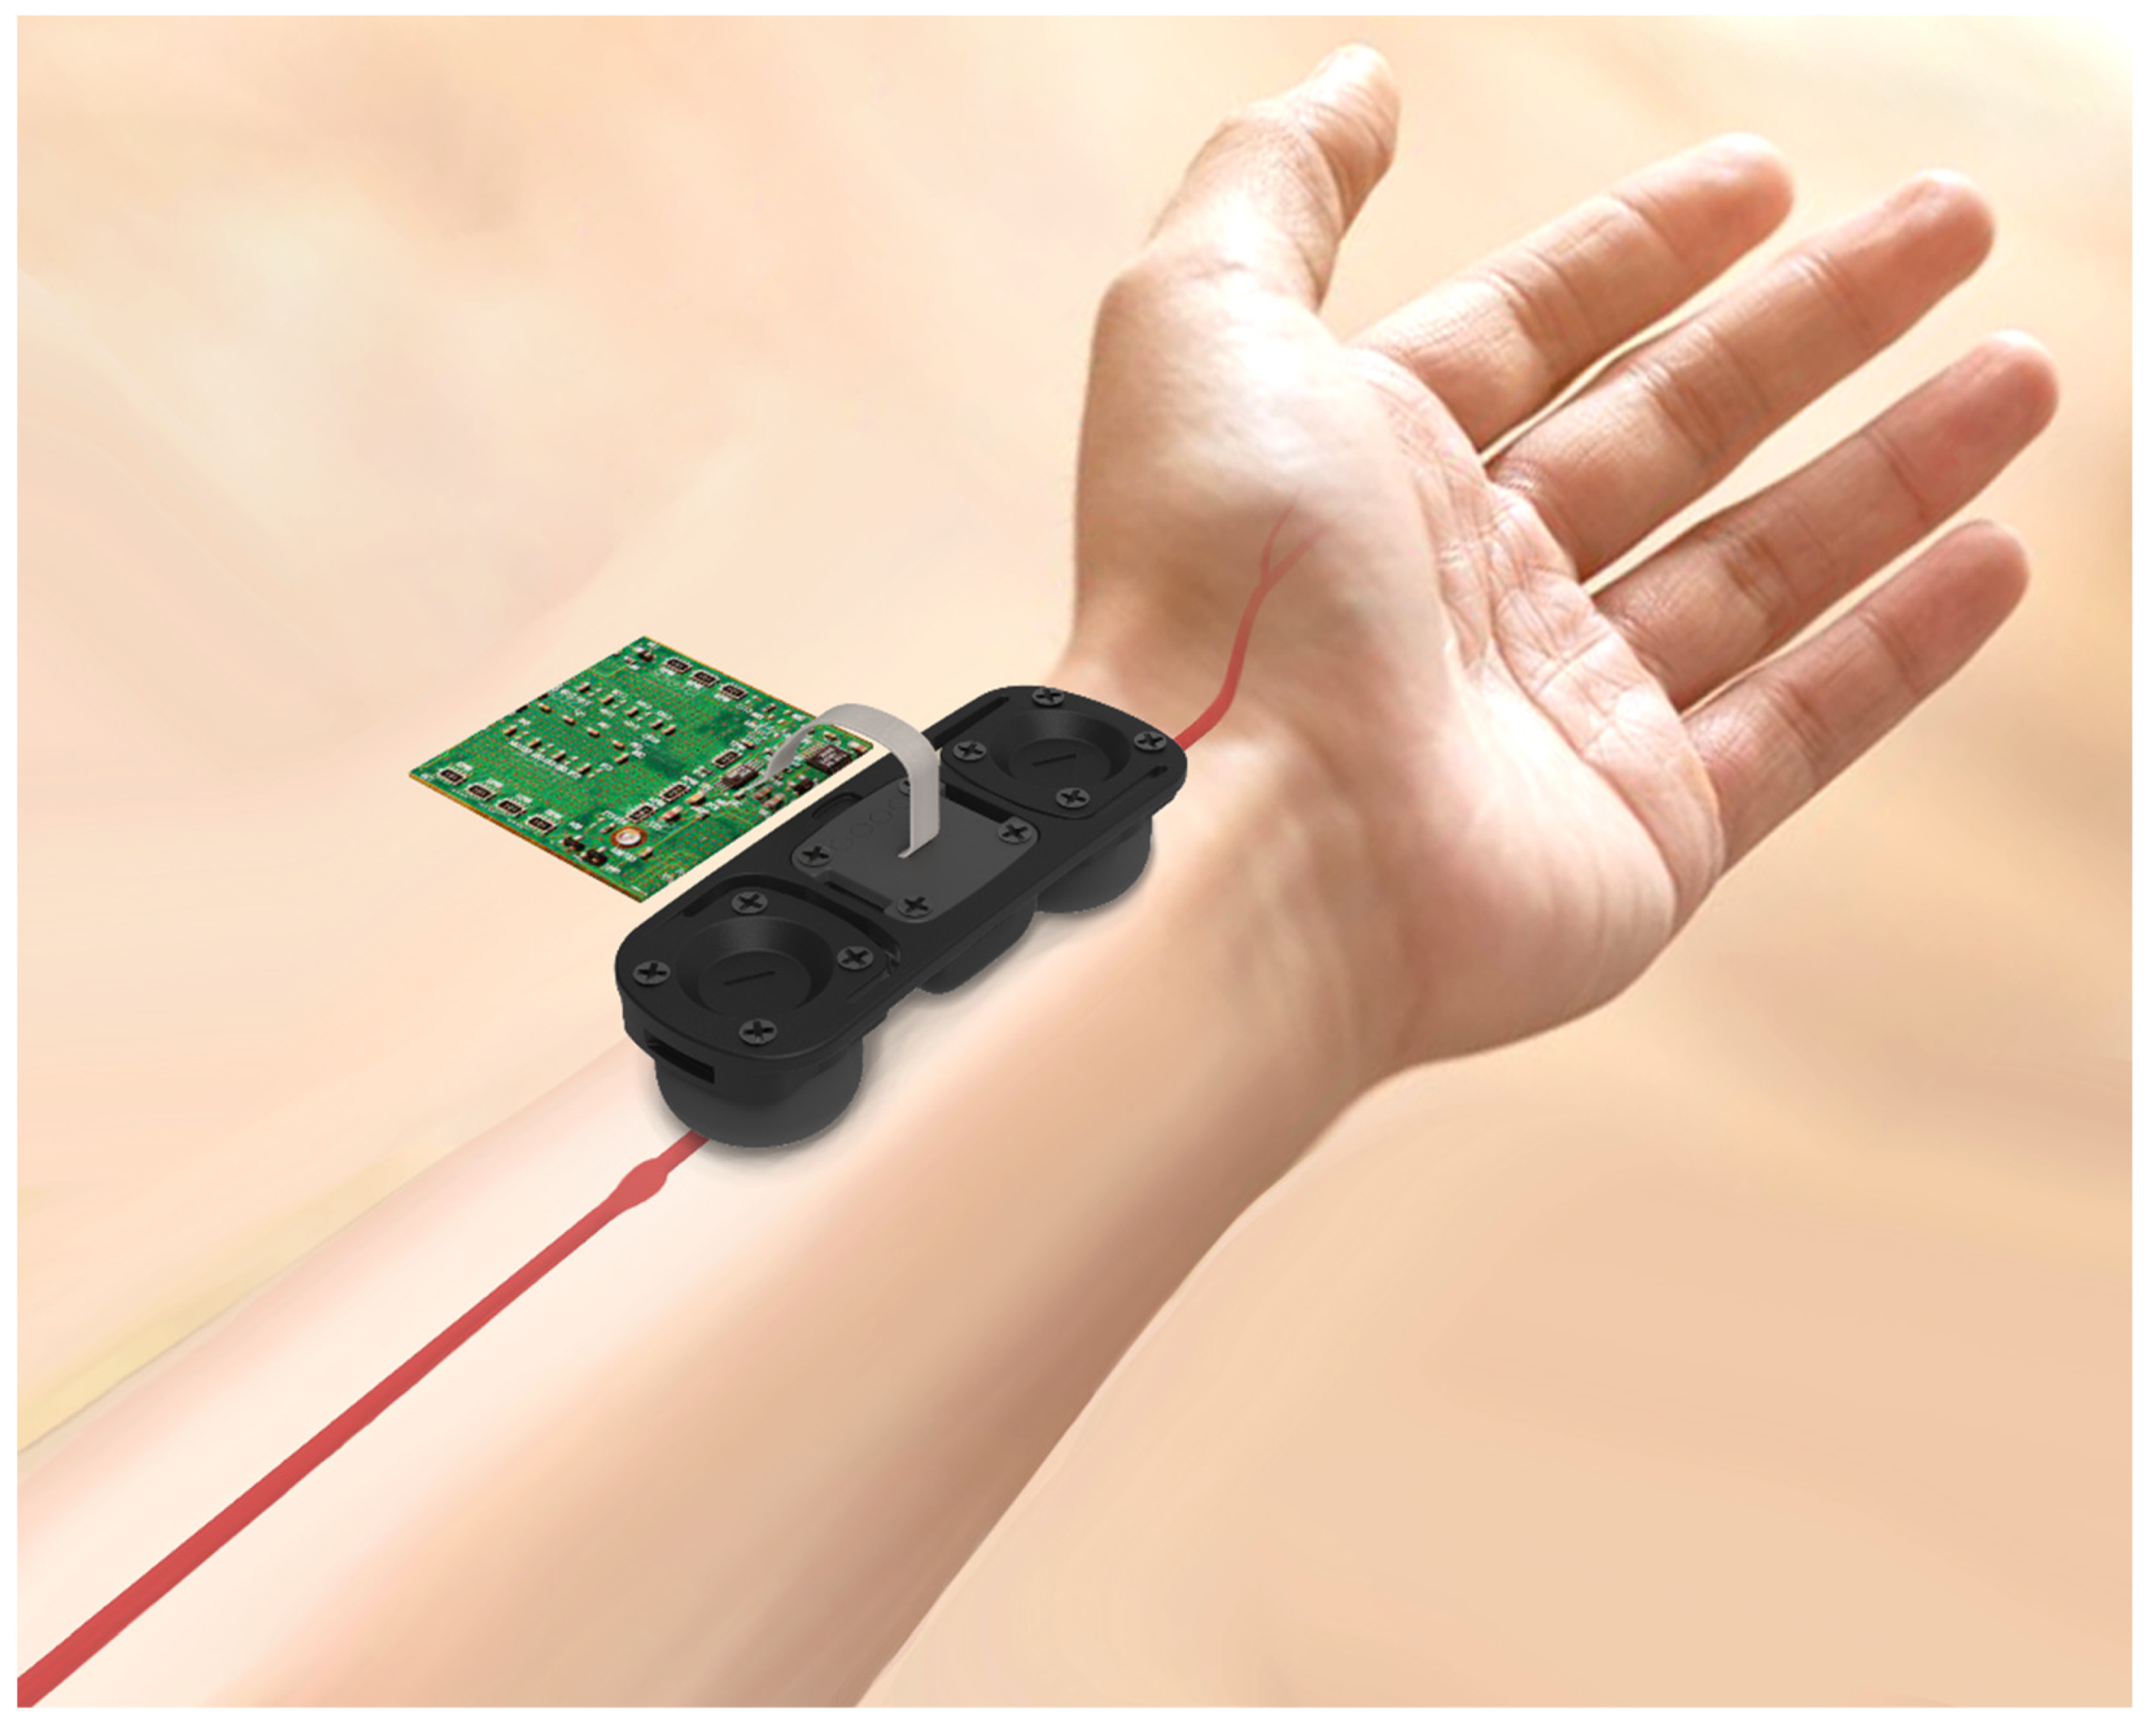
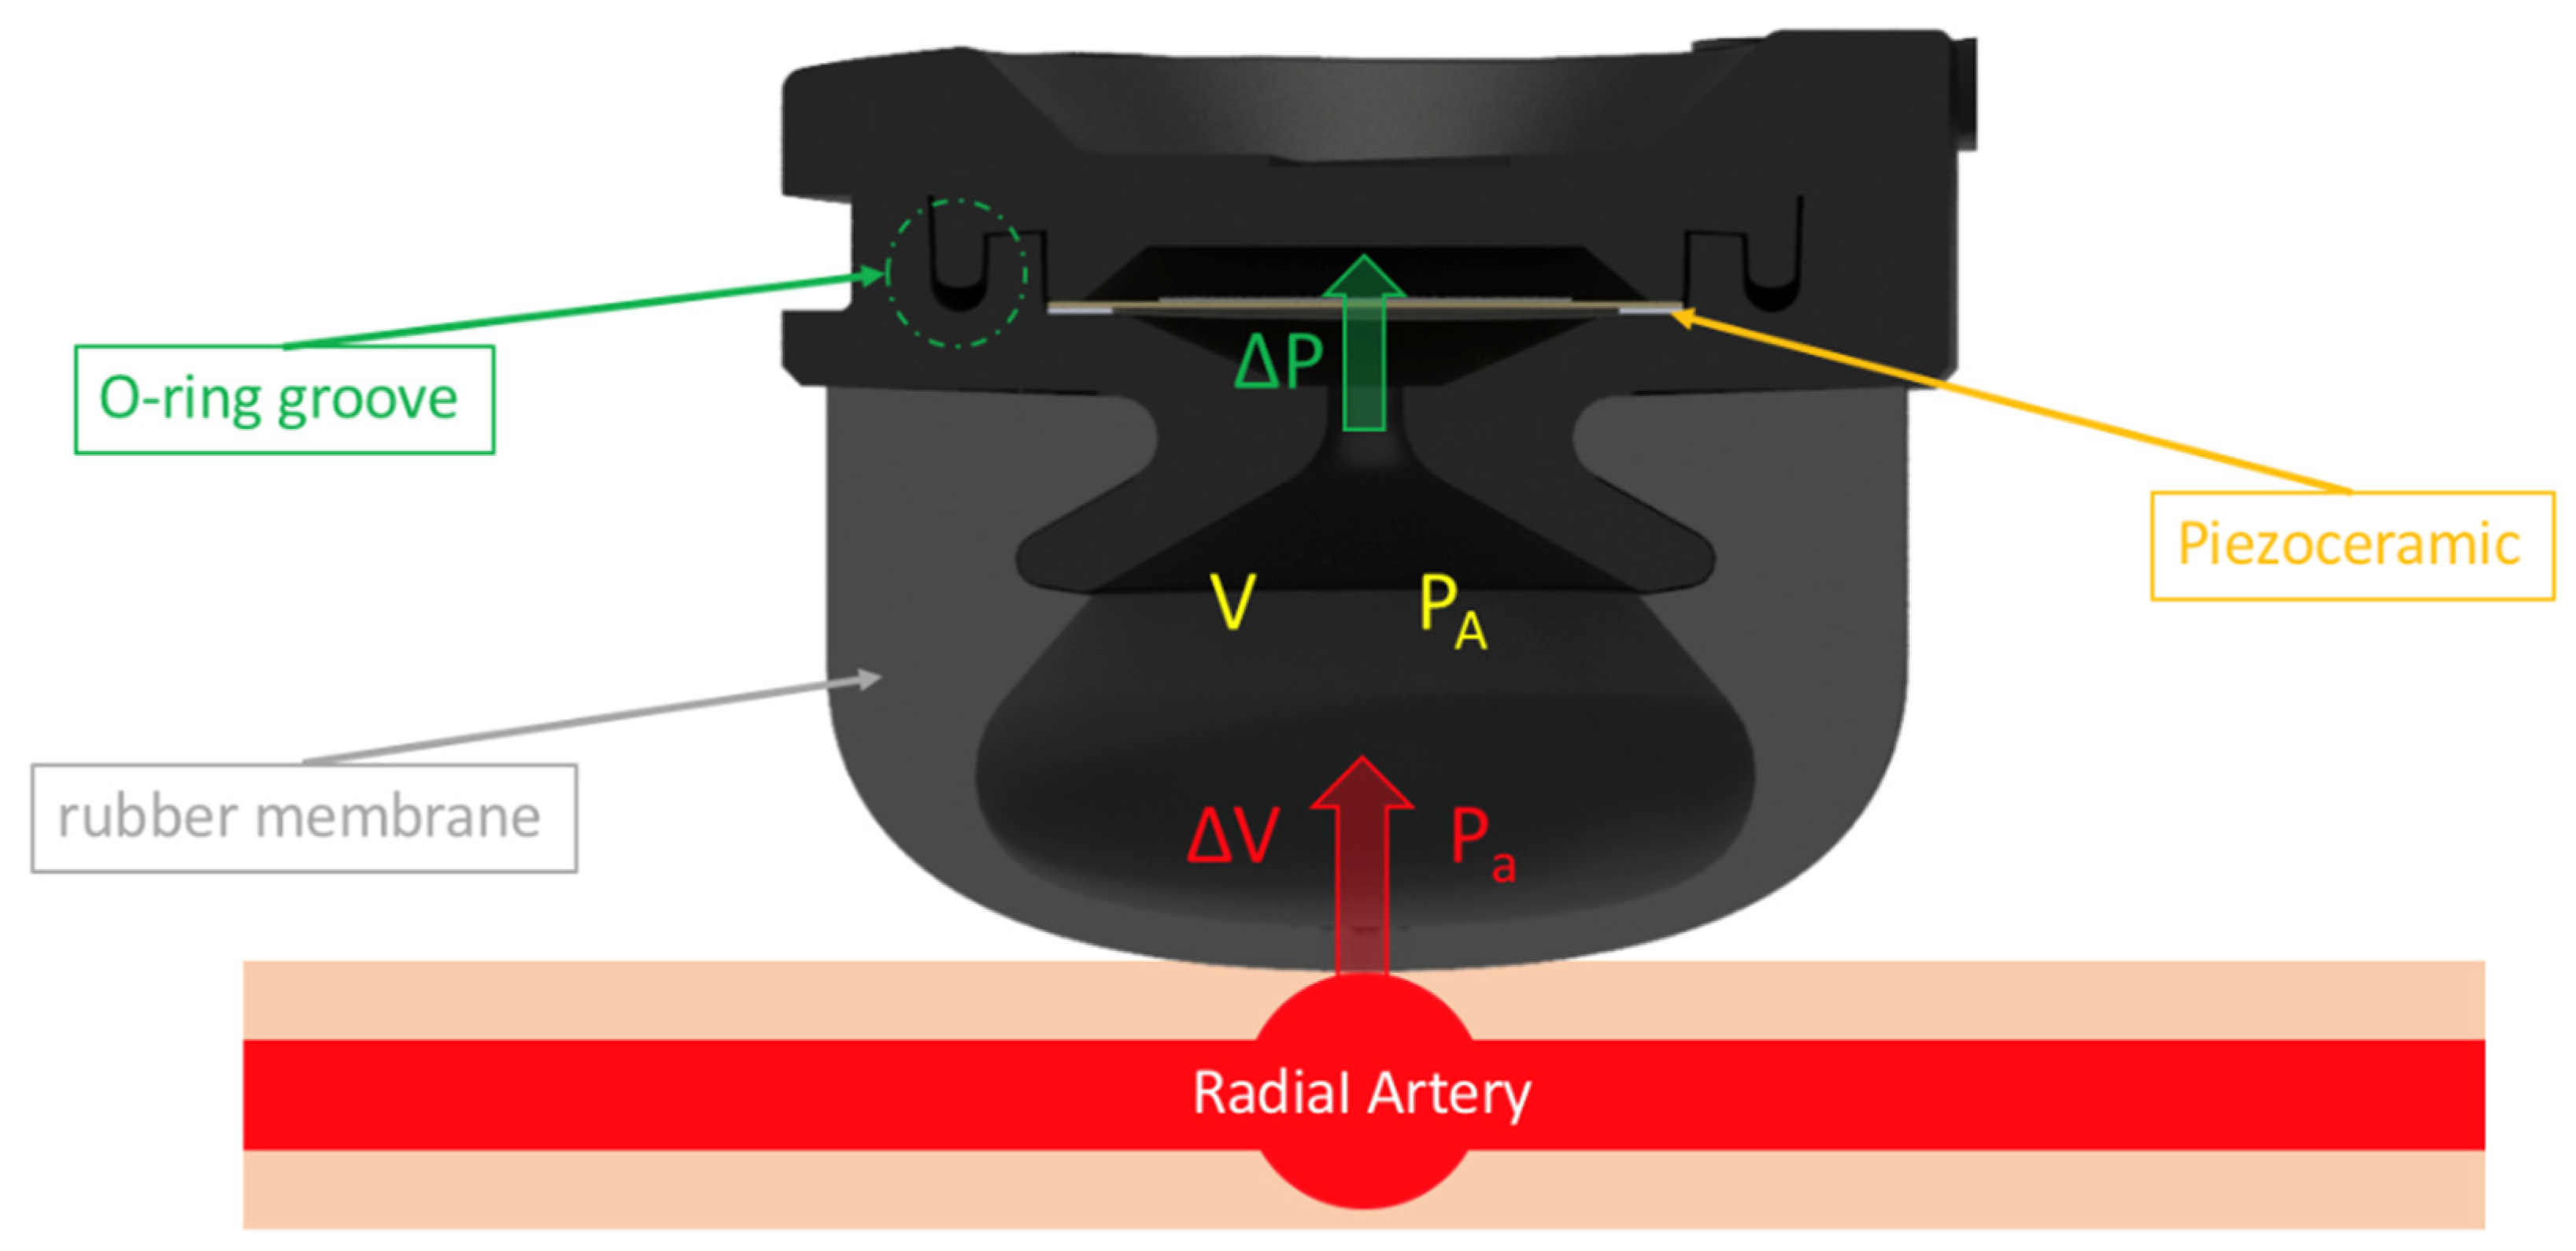
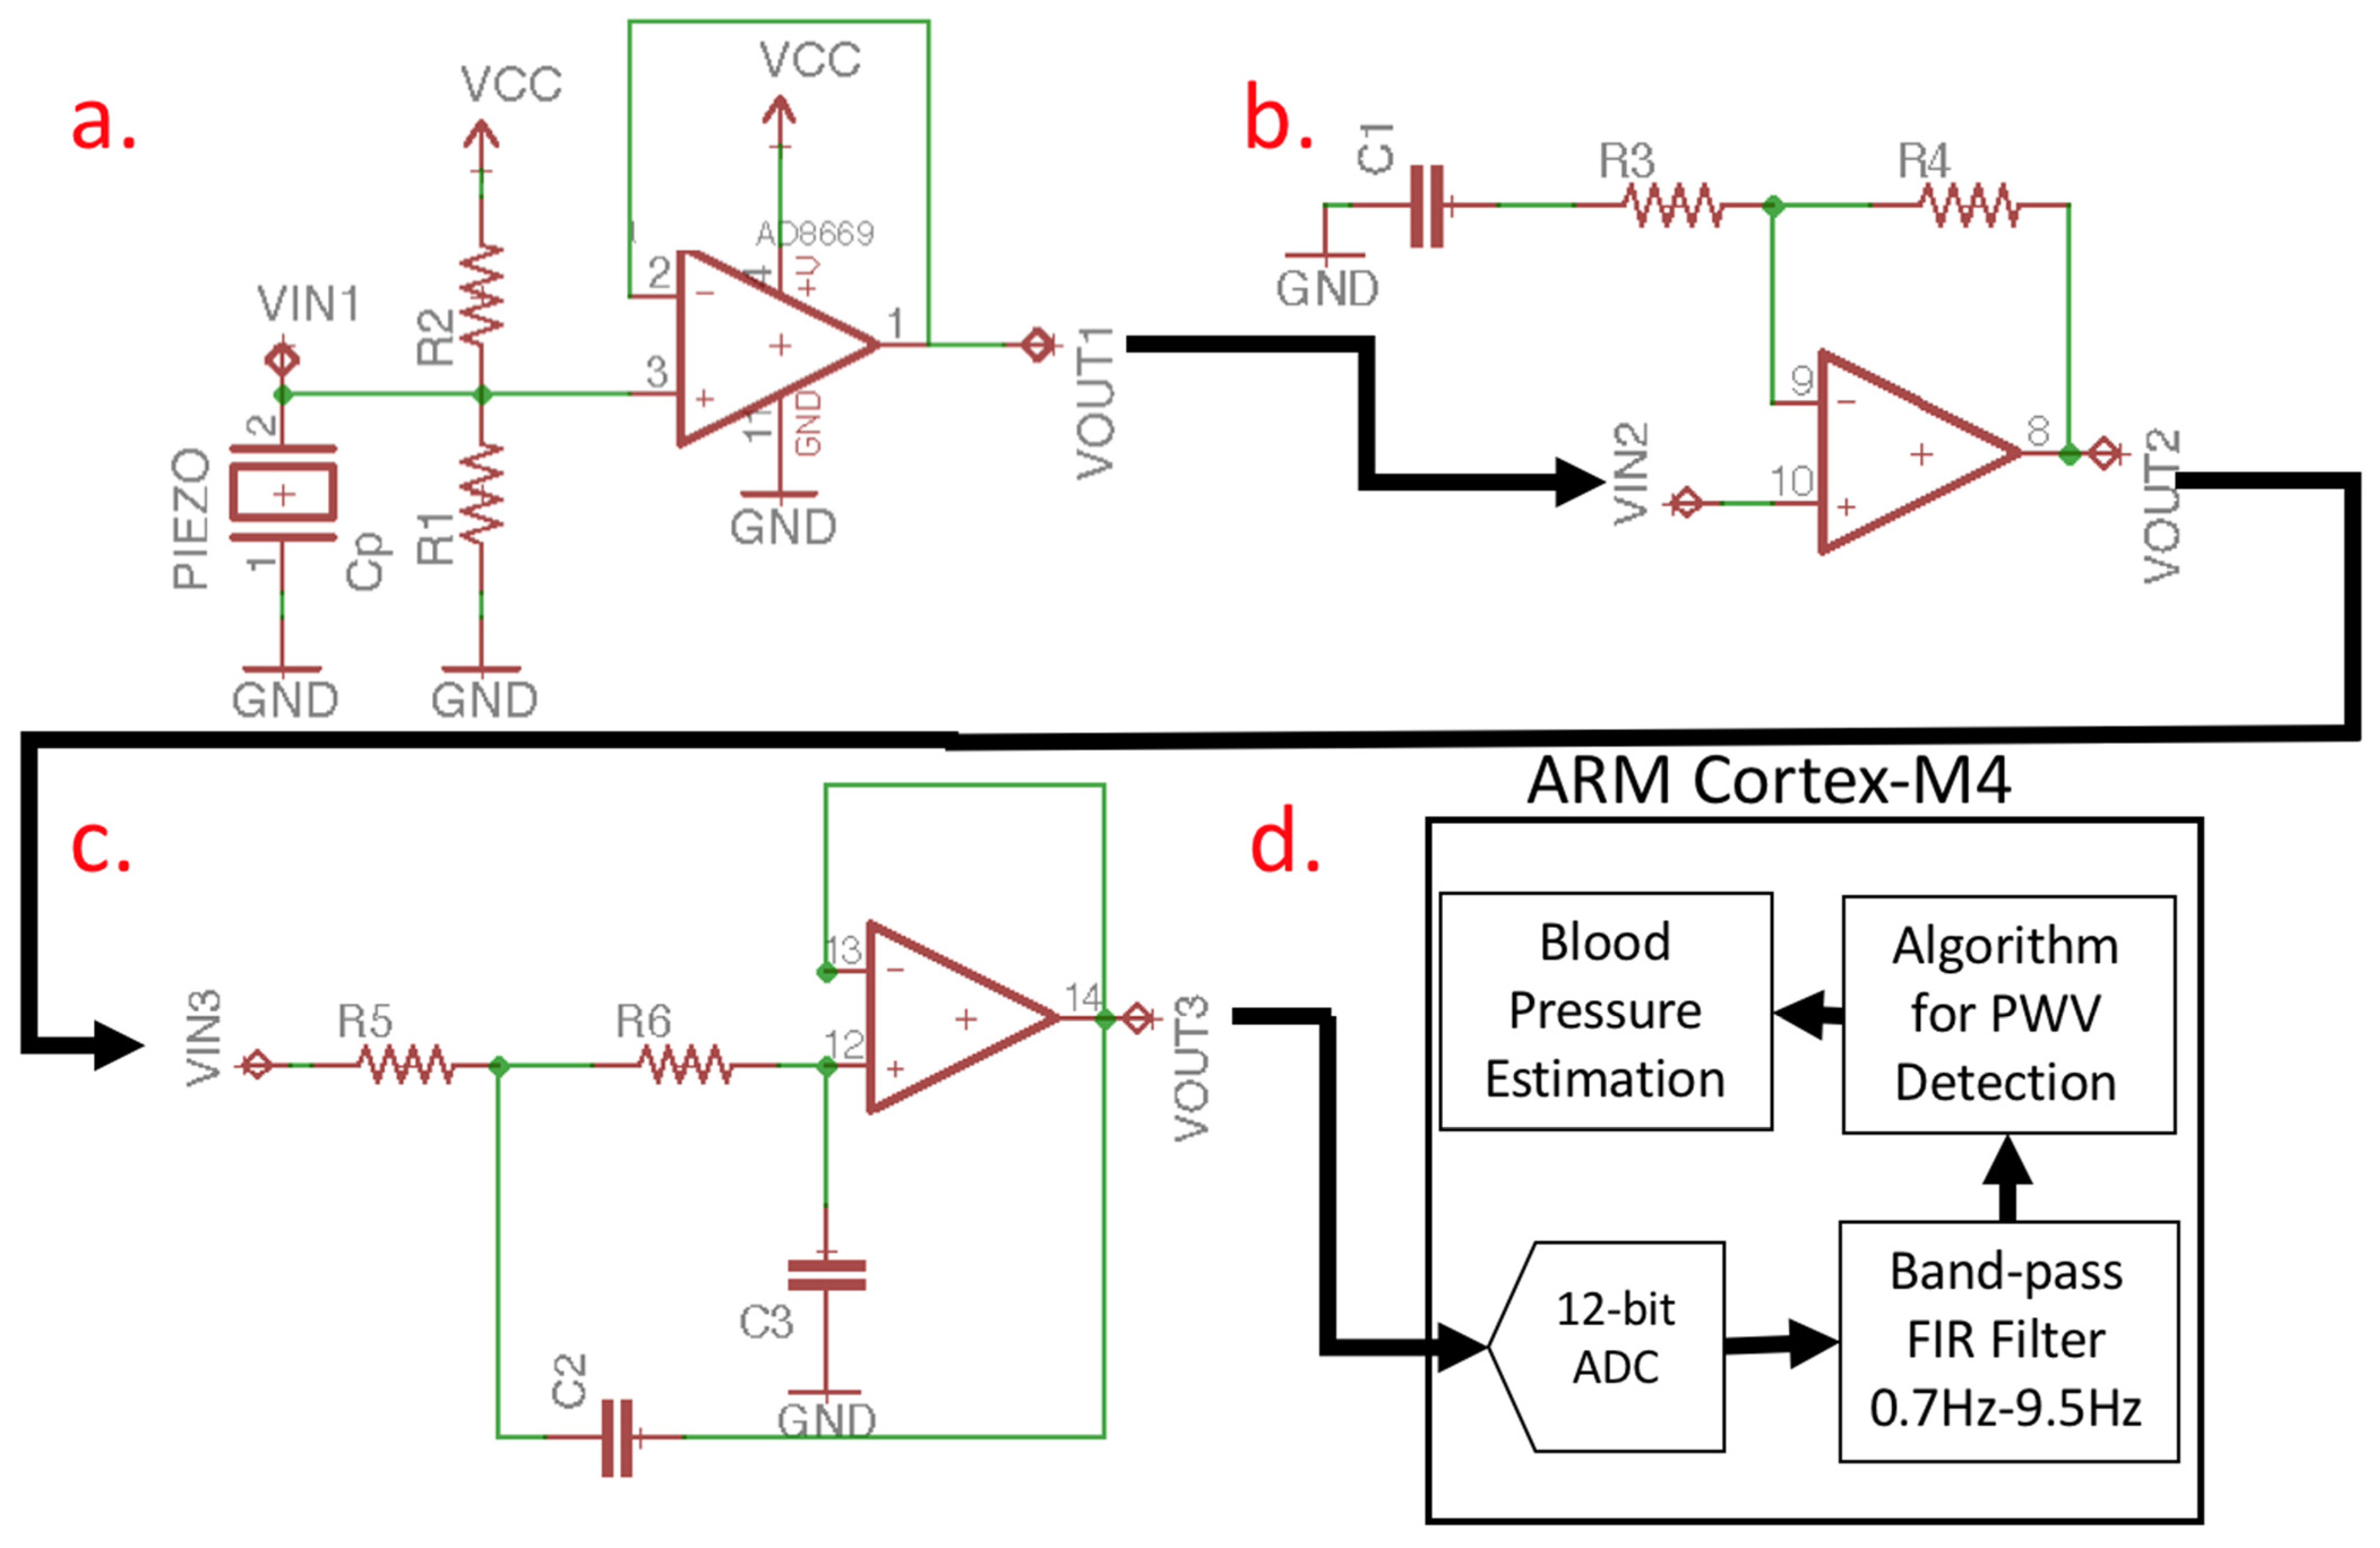
2.1. Pulse Wave Detection Sensor
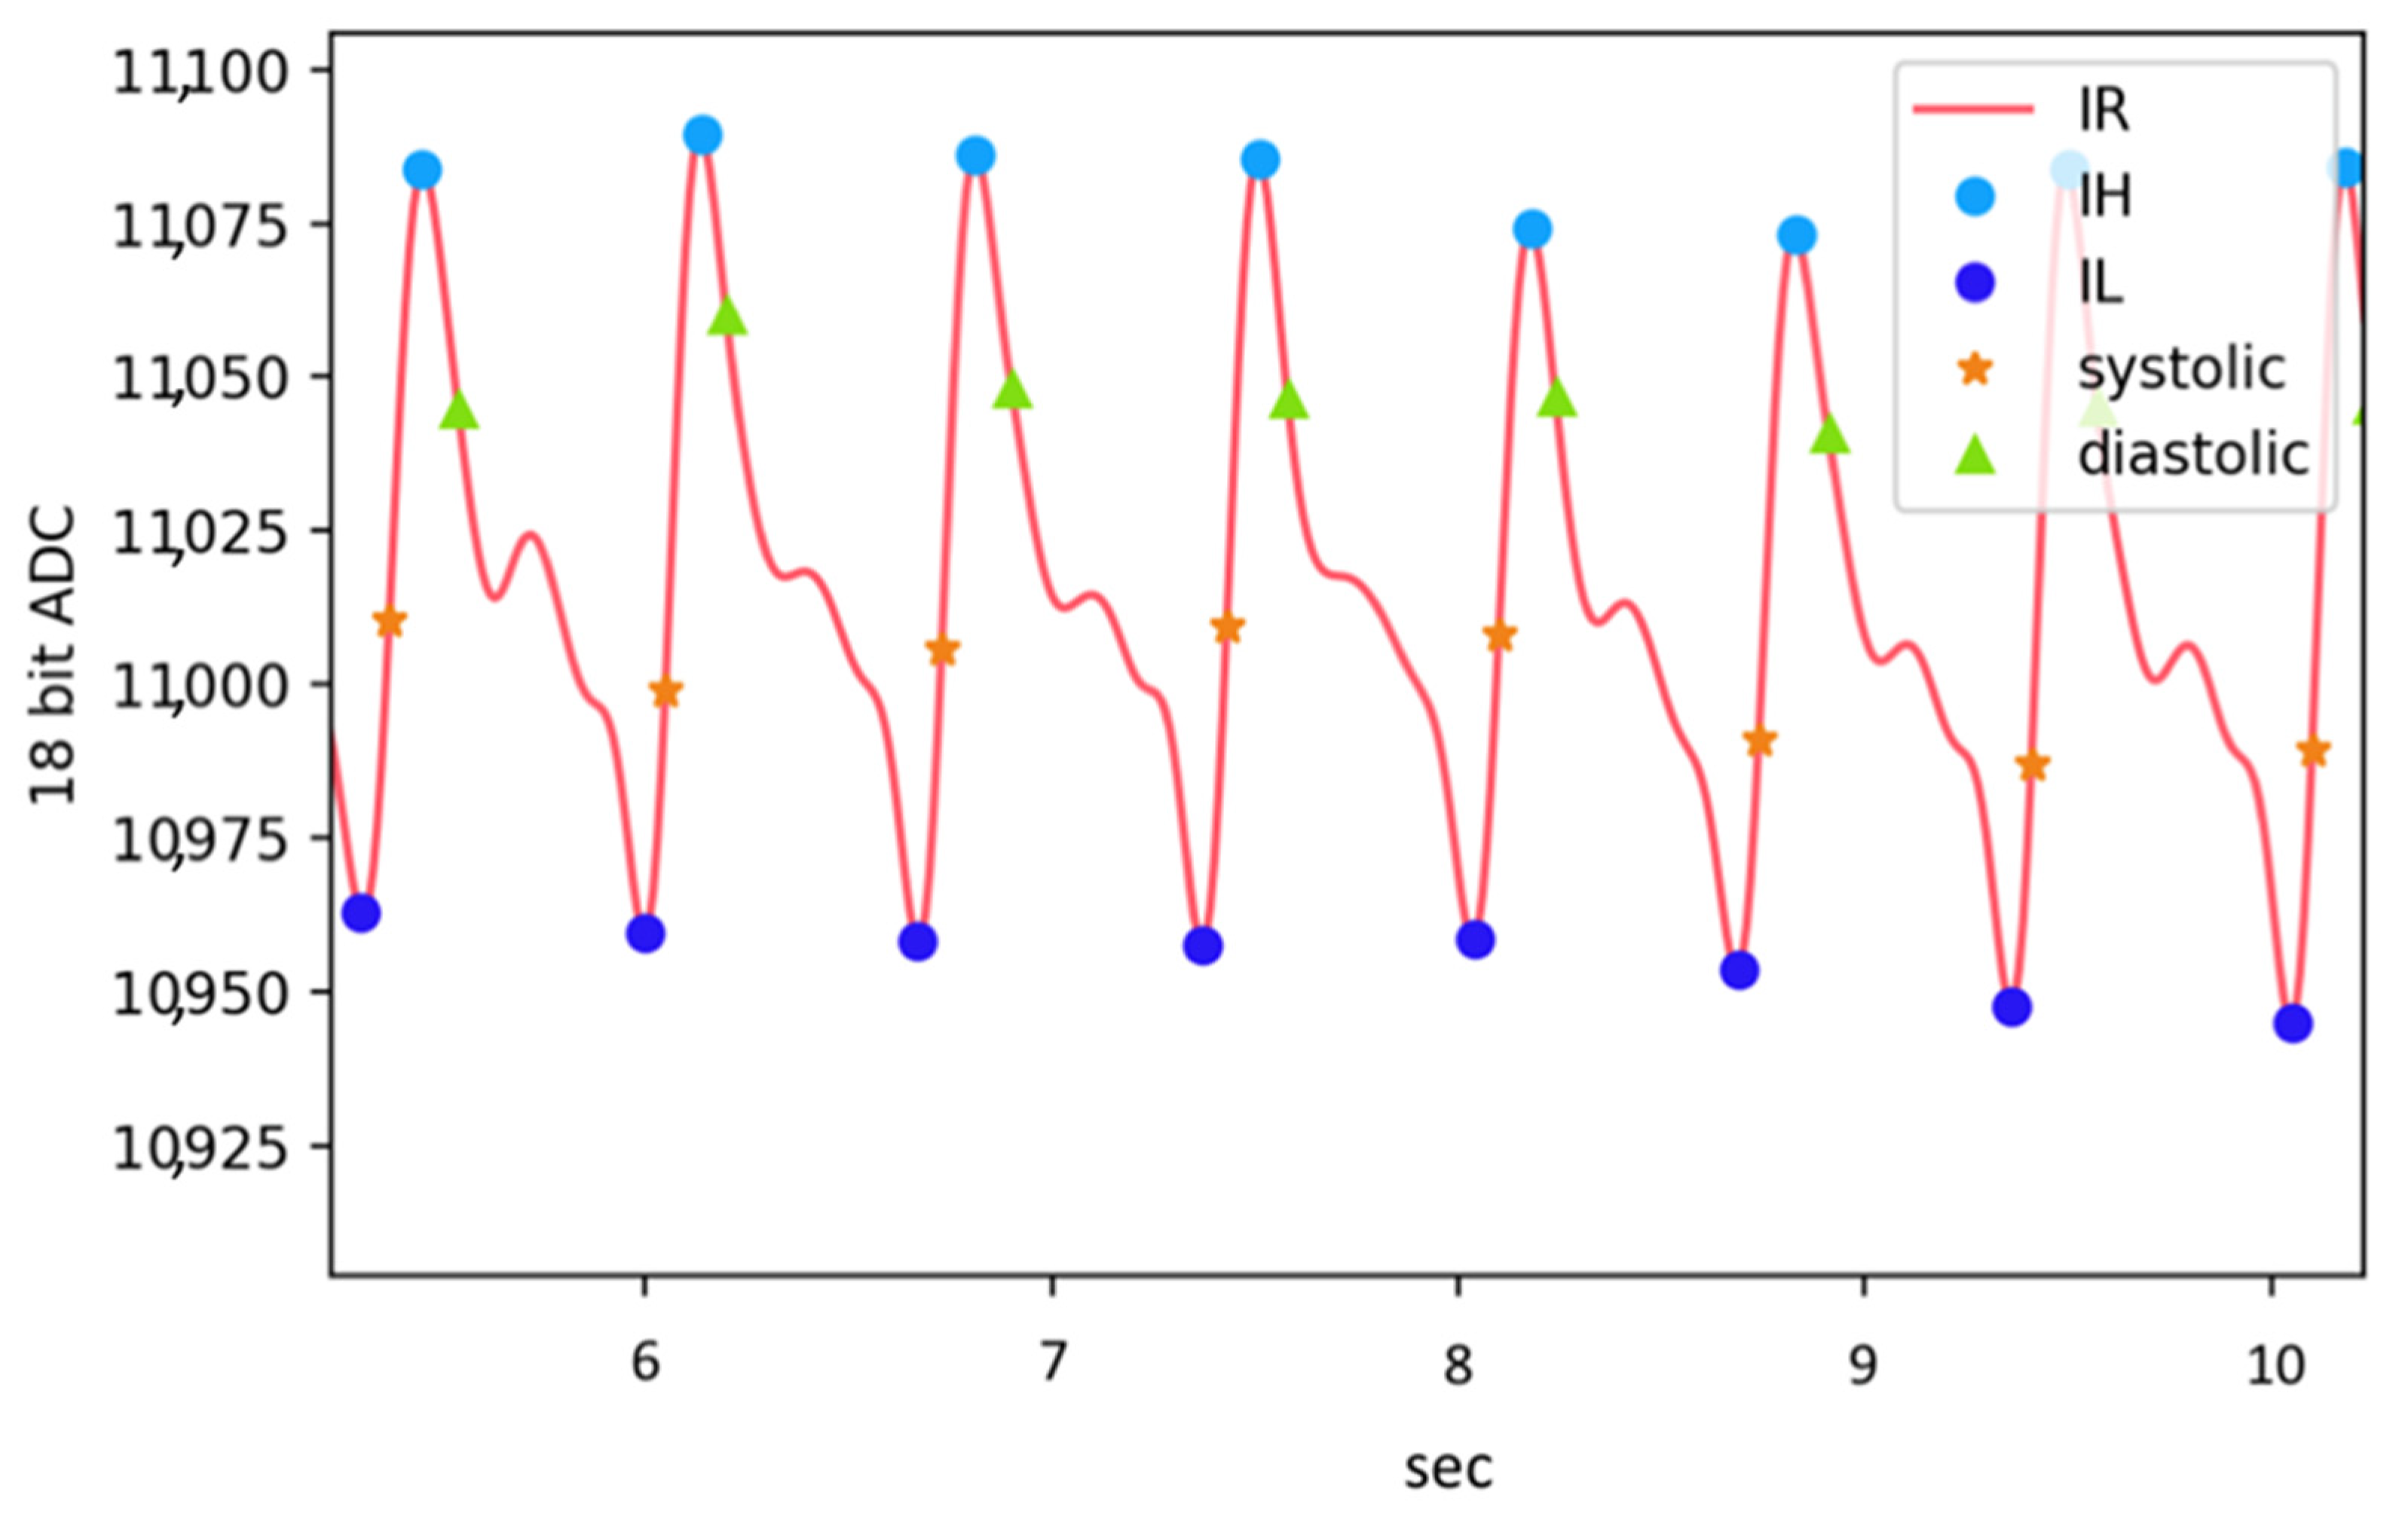
2.2. PPG Signal Process and Arterial Parameter Estimates
2.3. Cuffless BP Model
3. Results and Discussion
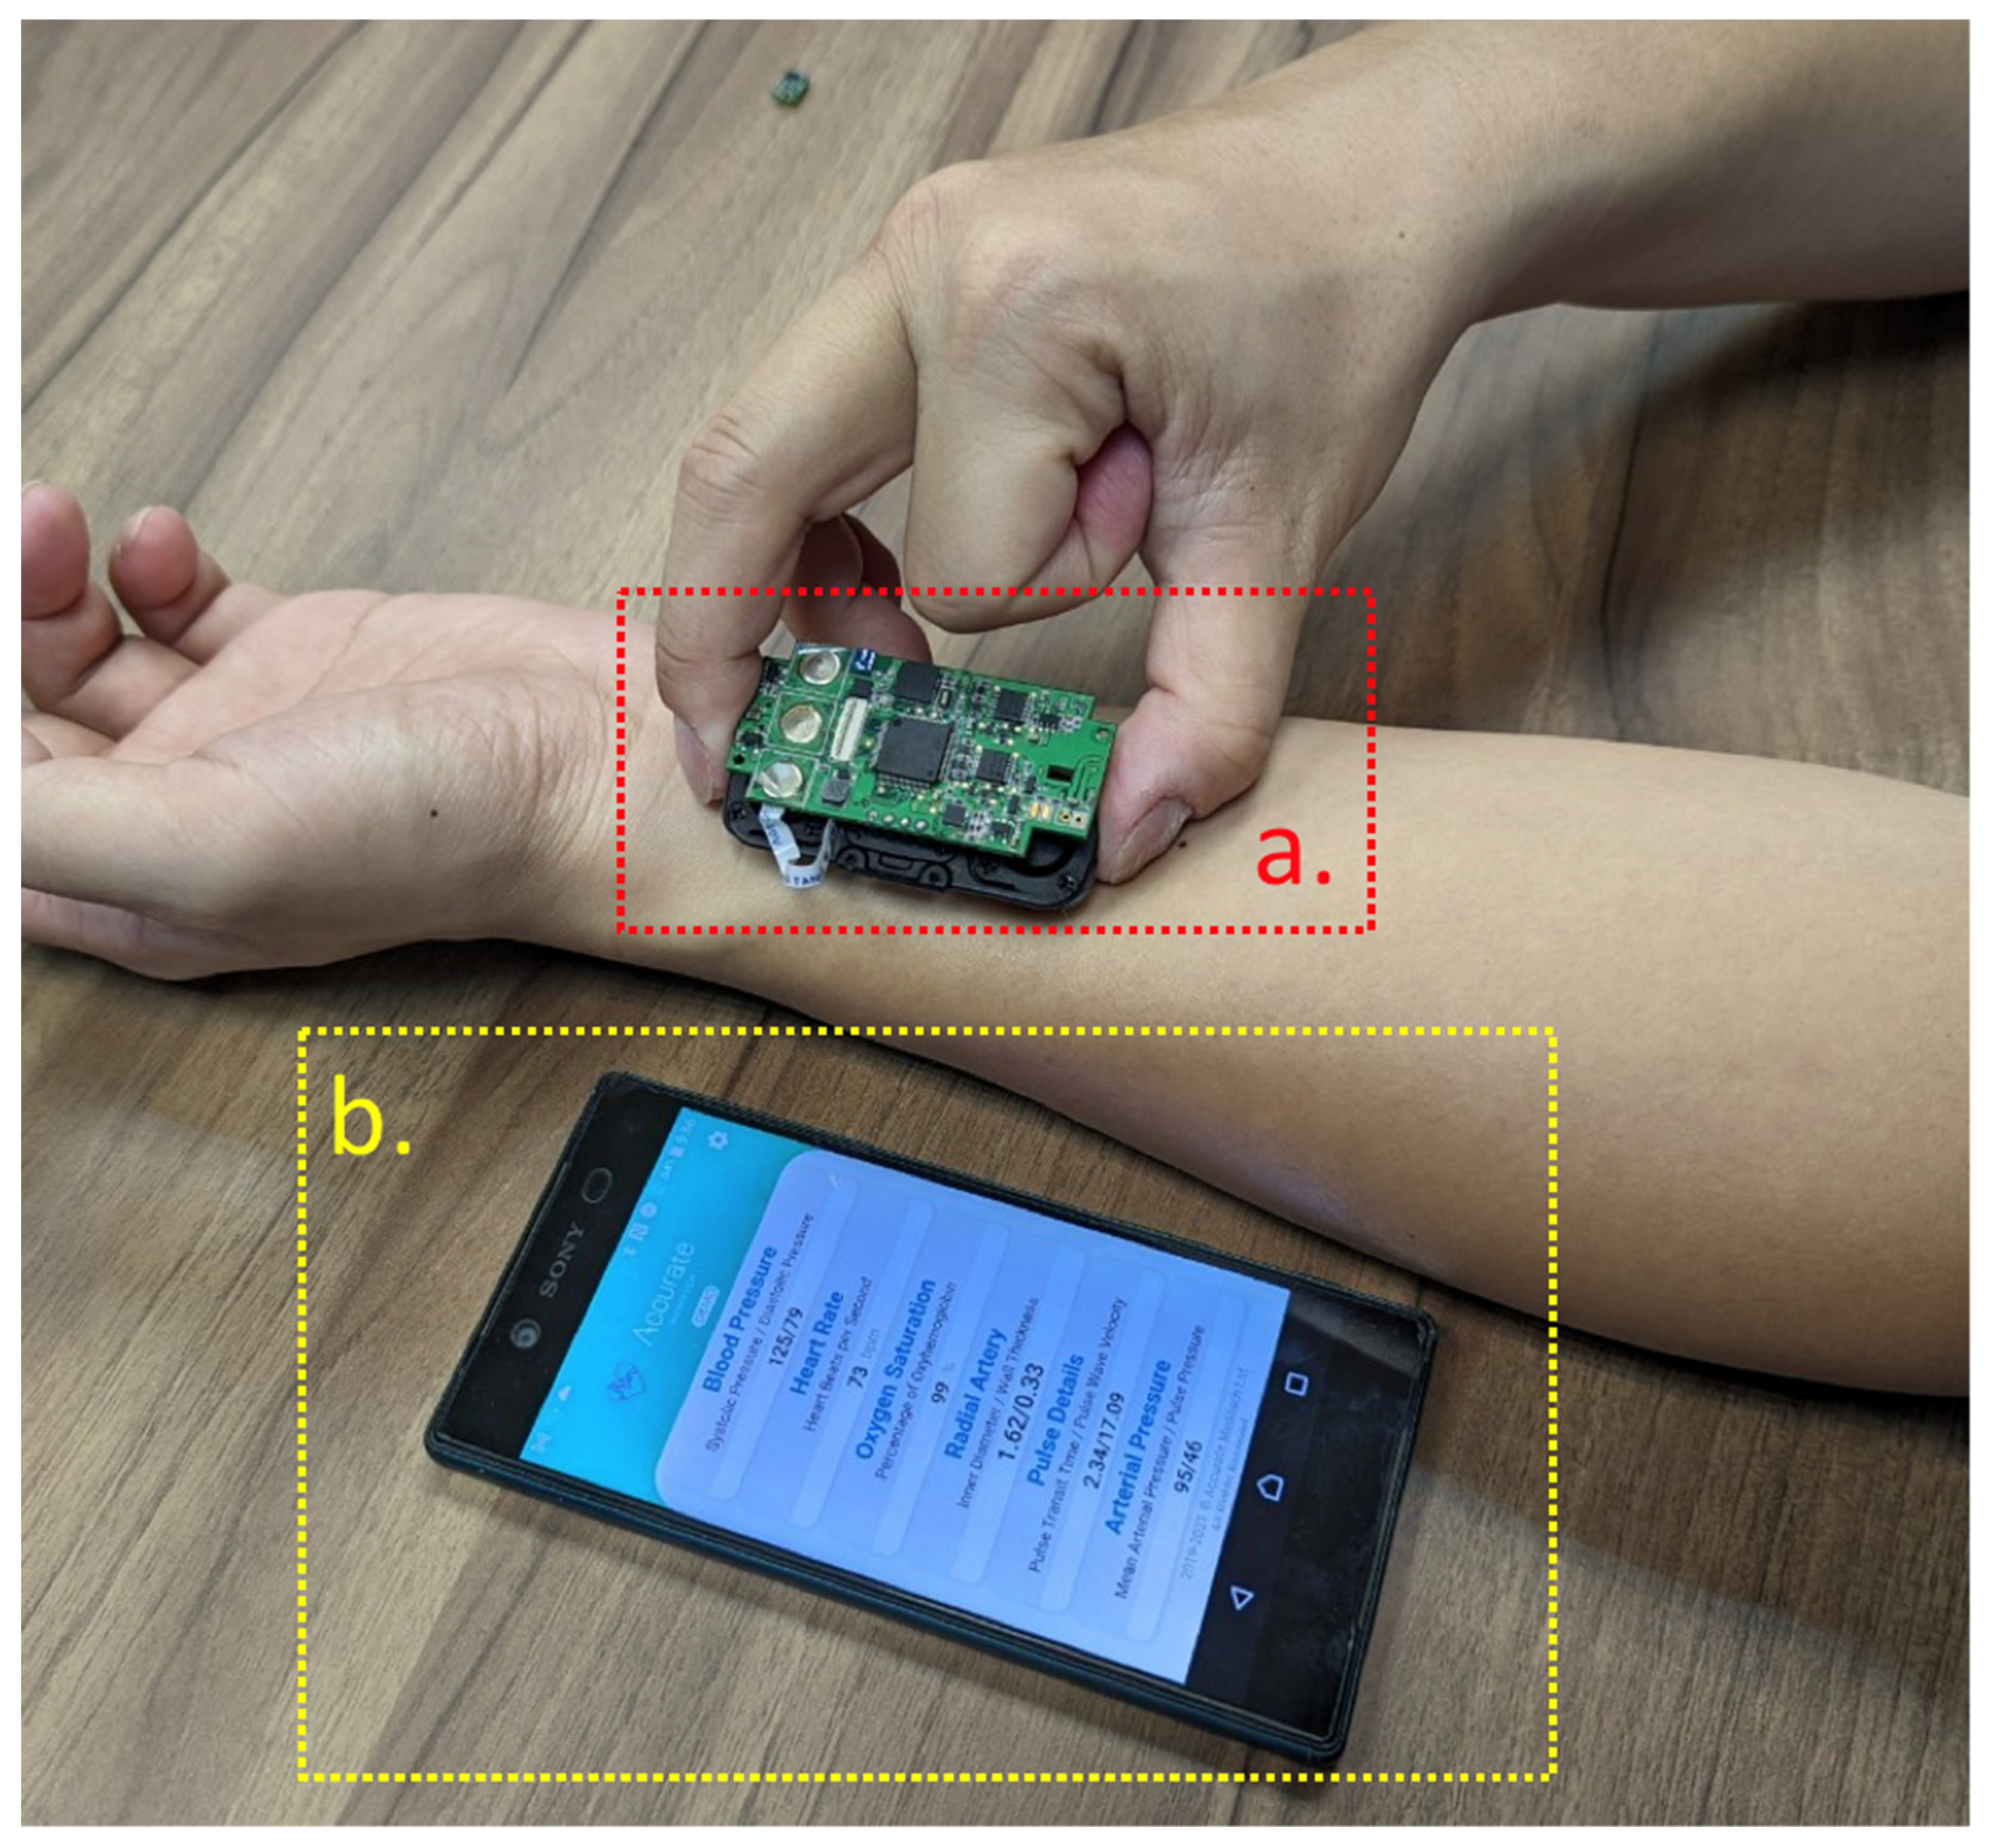
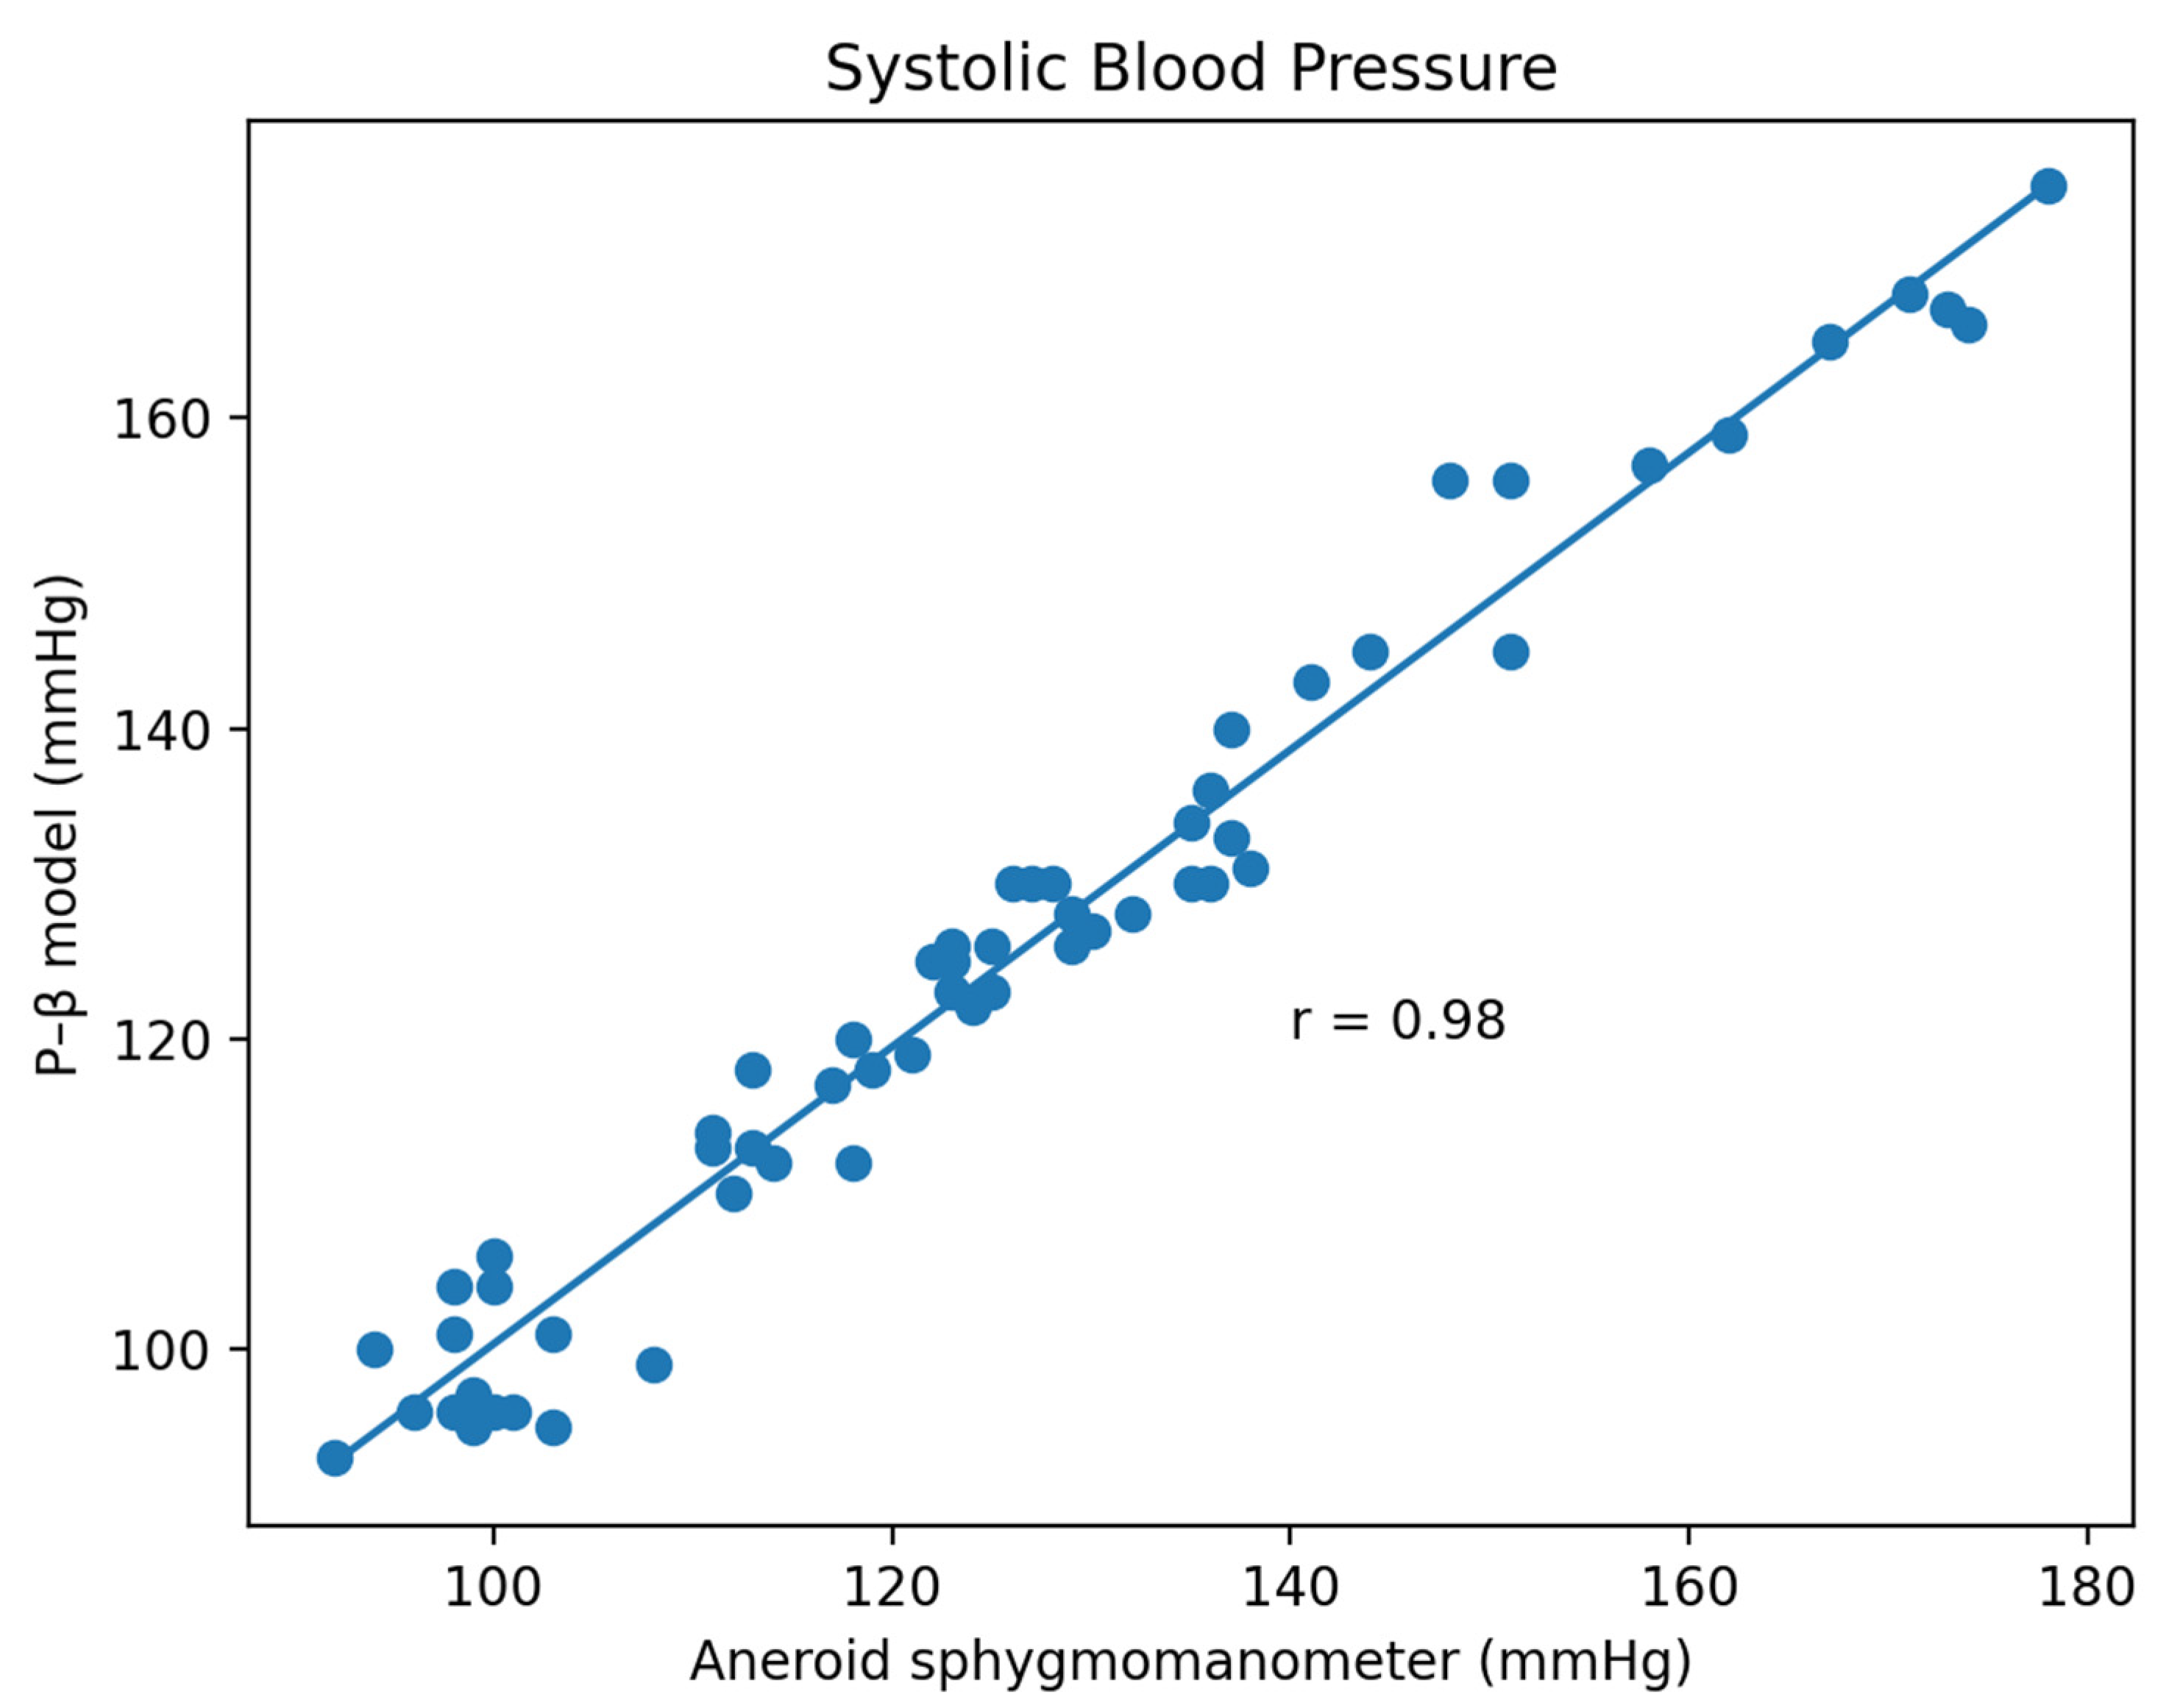
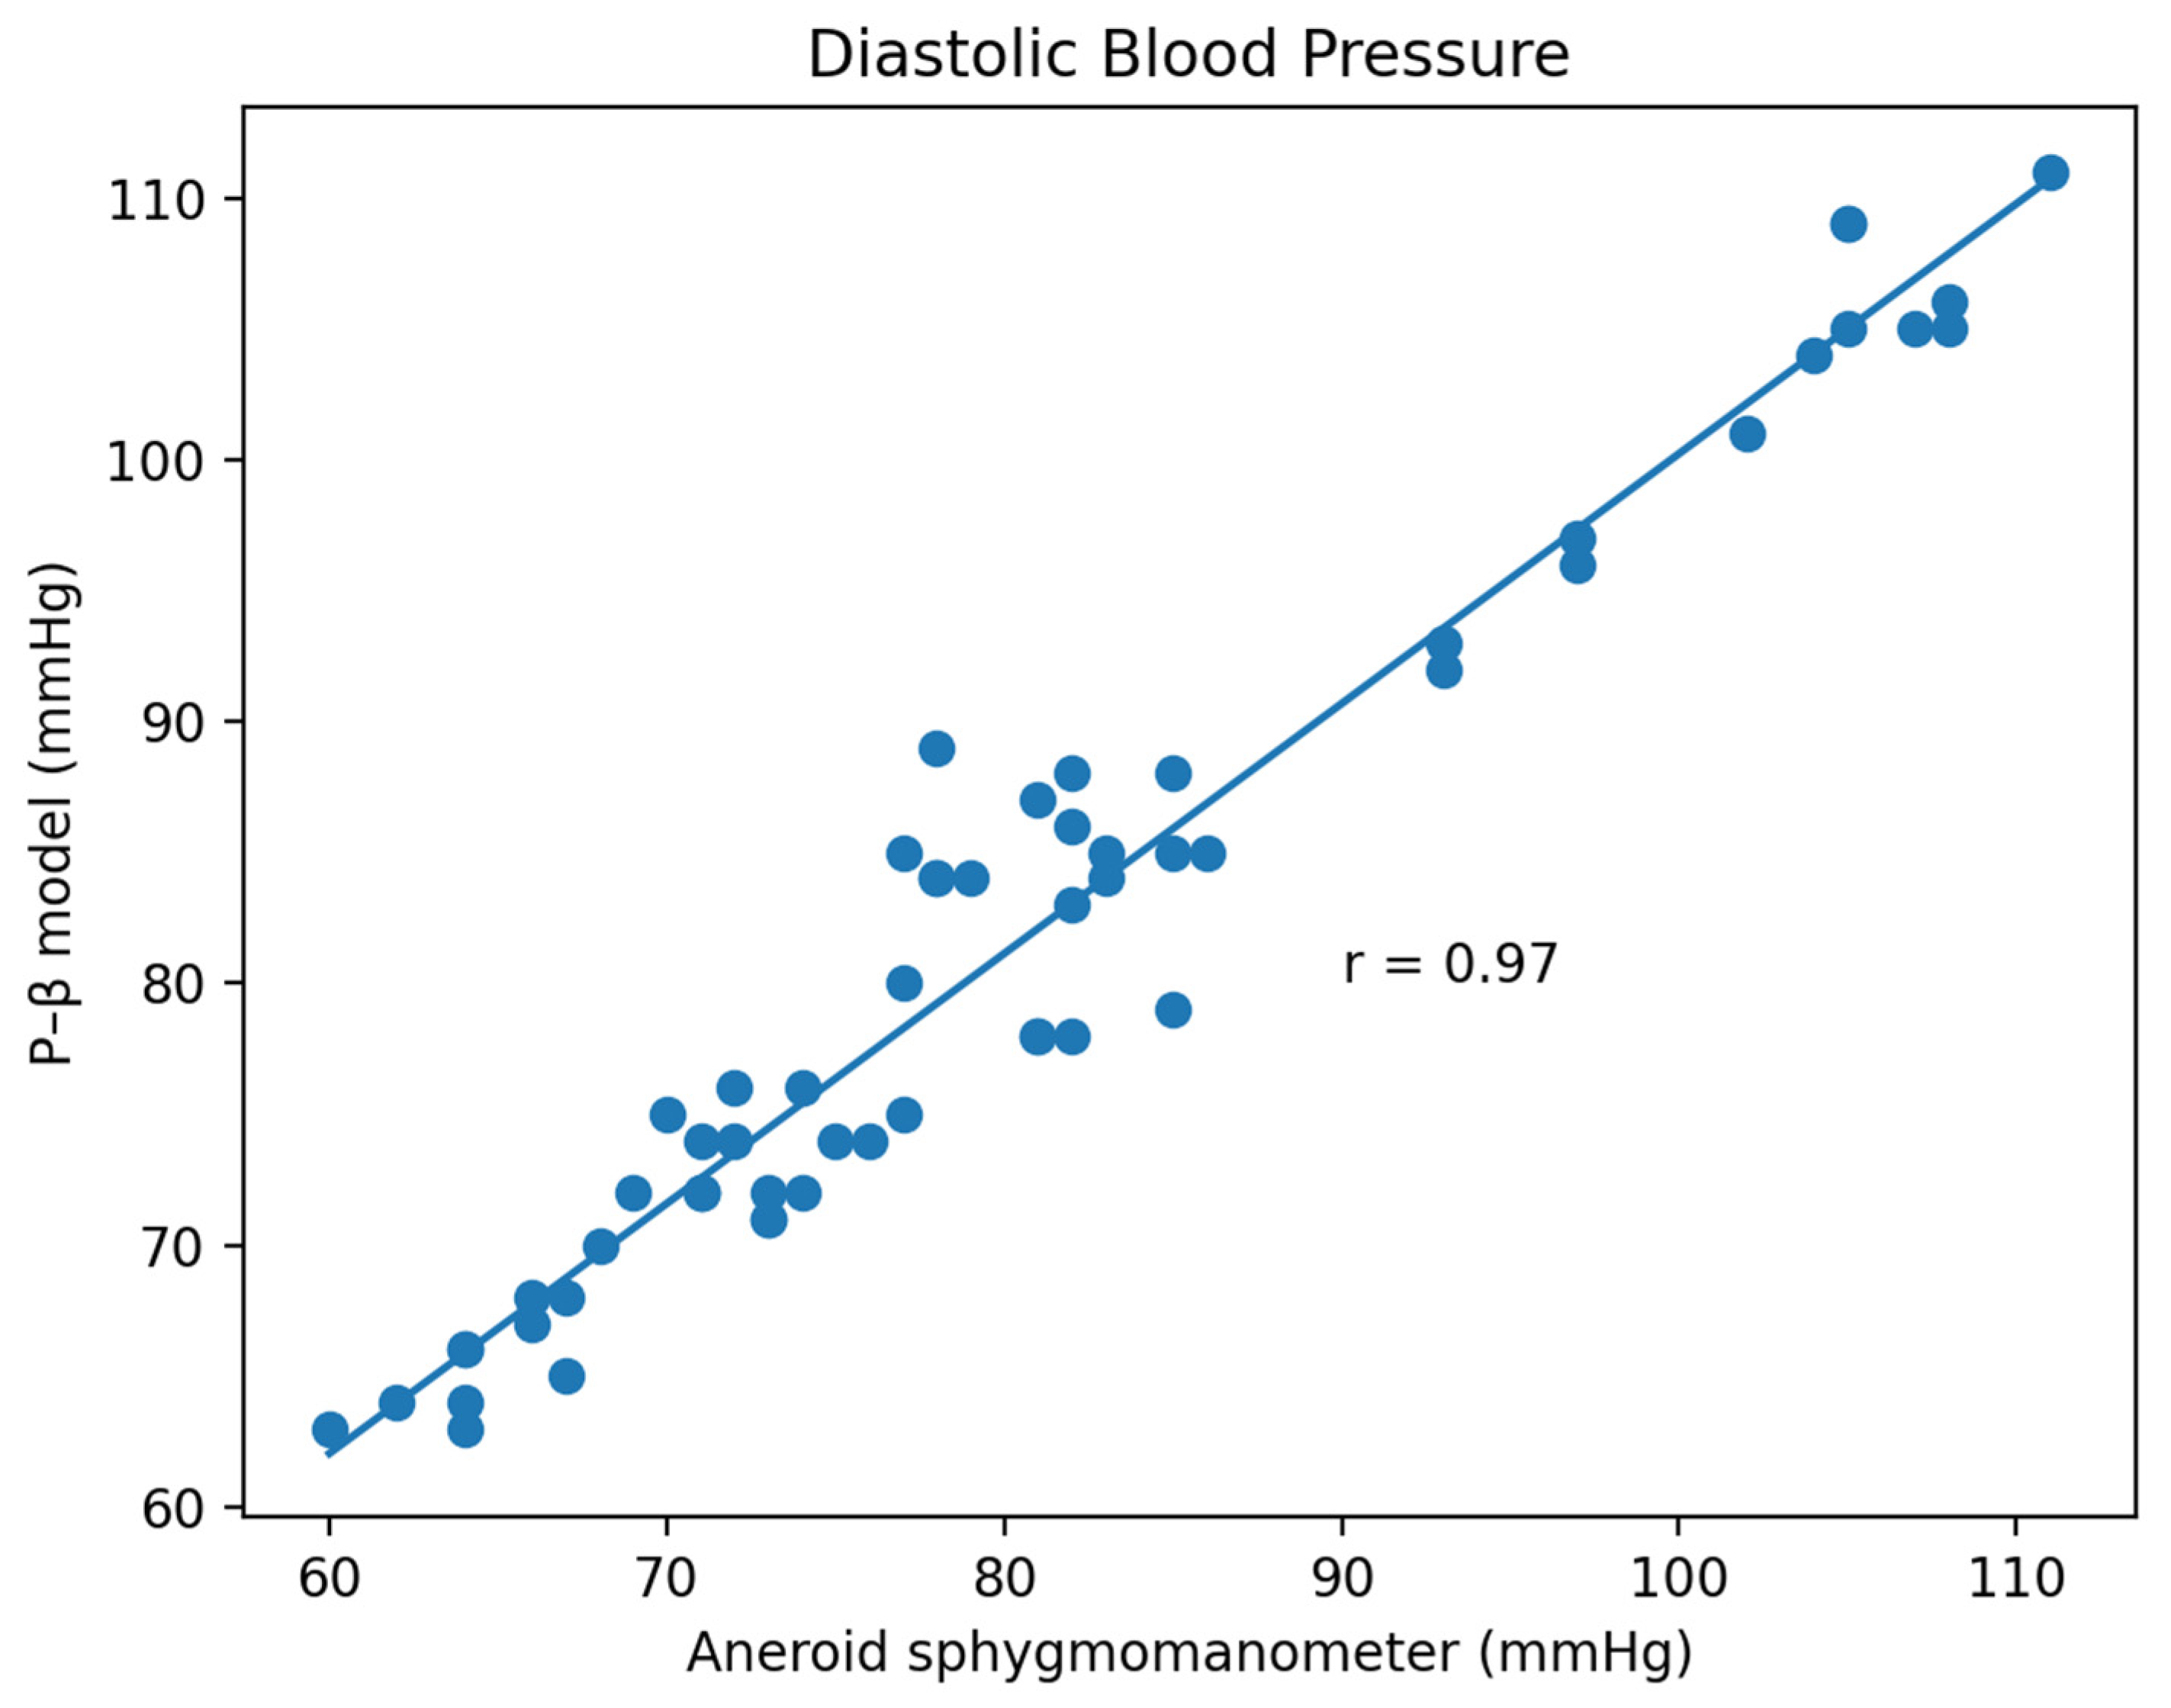
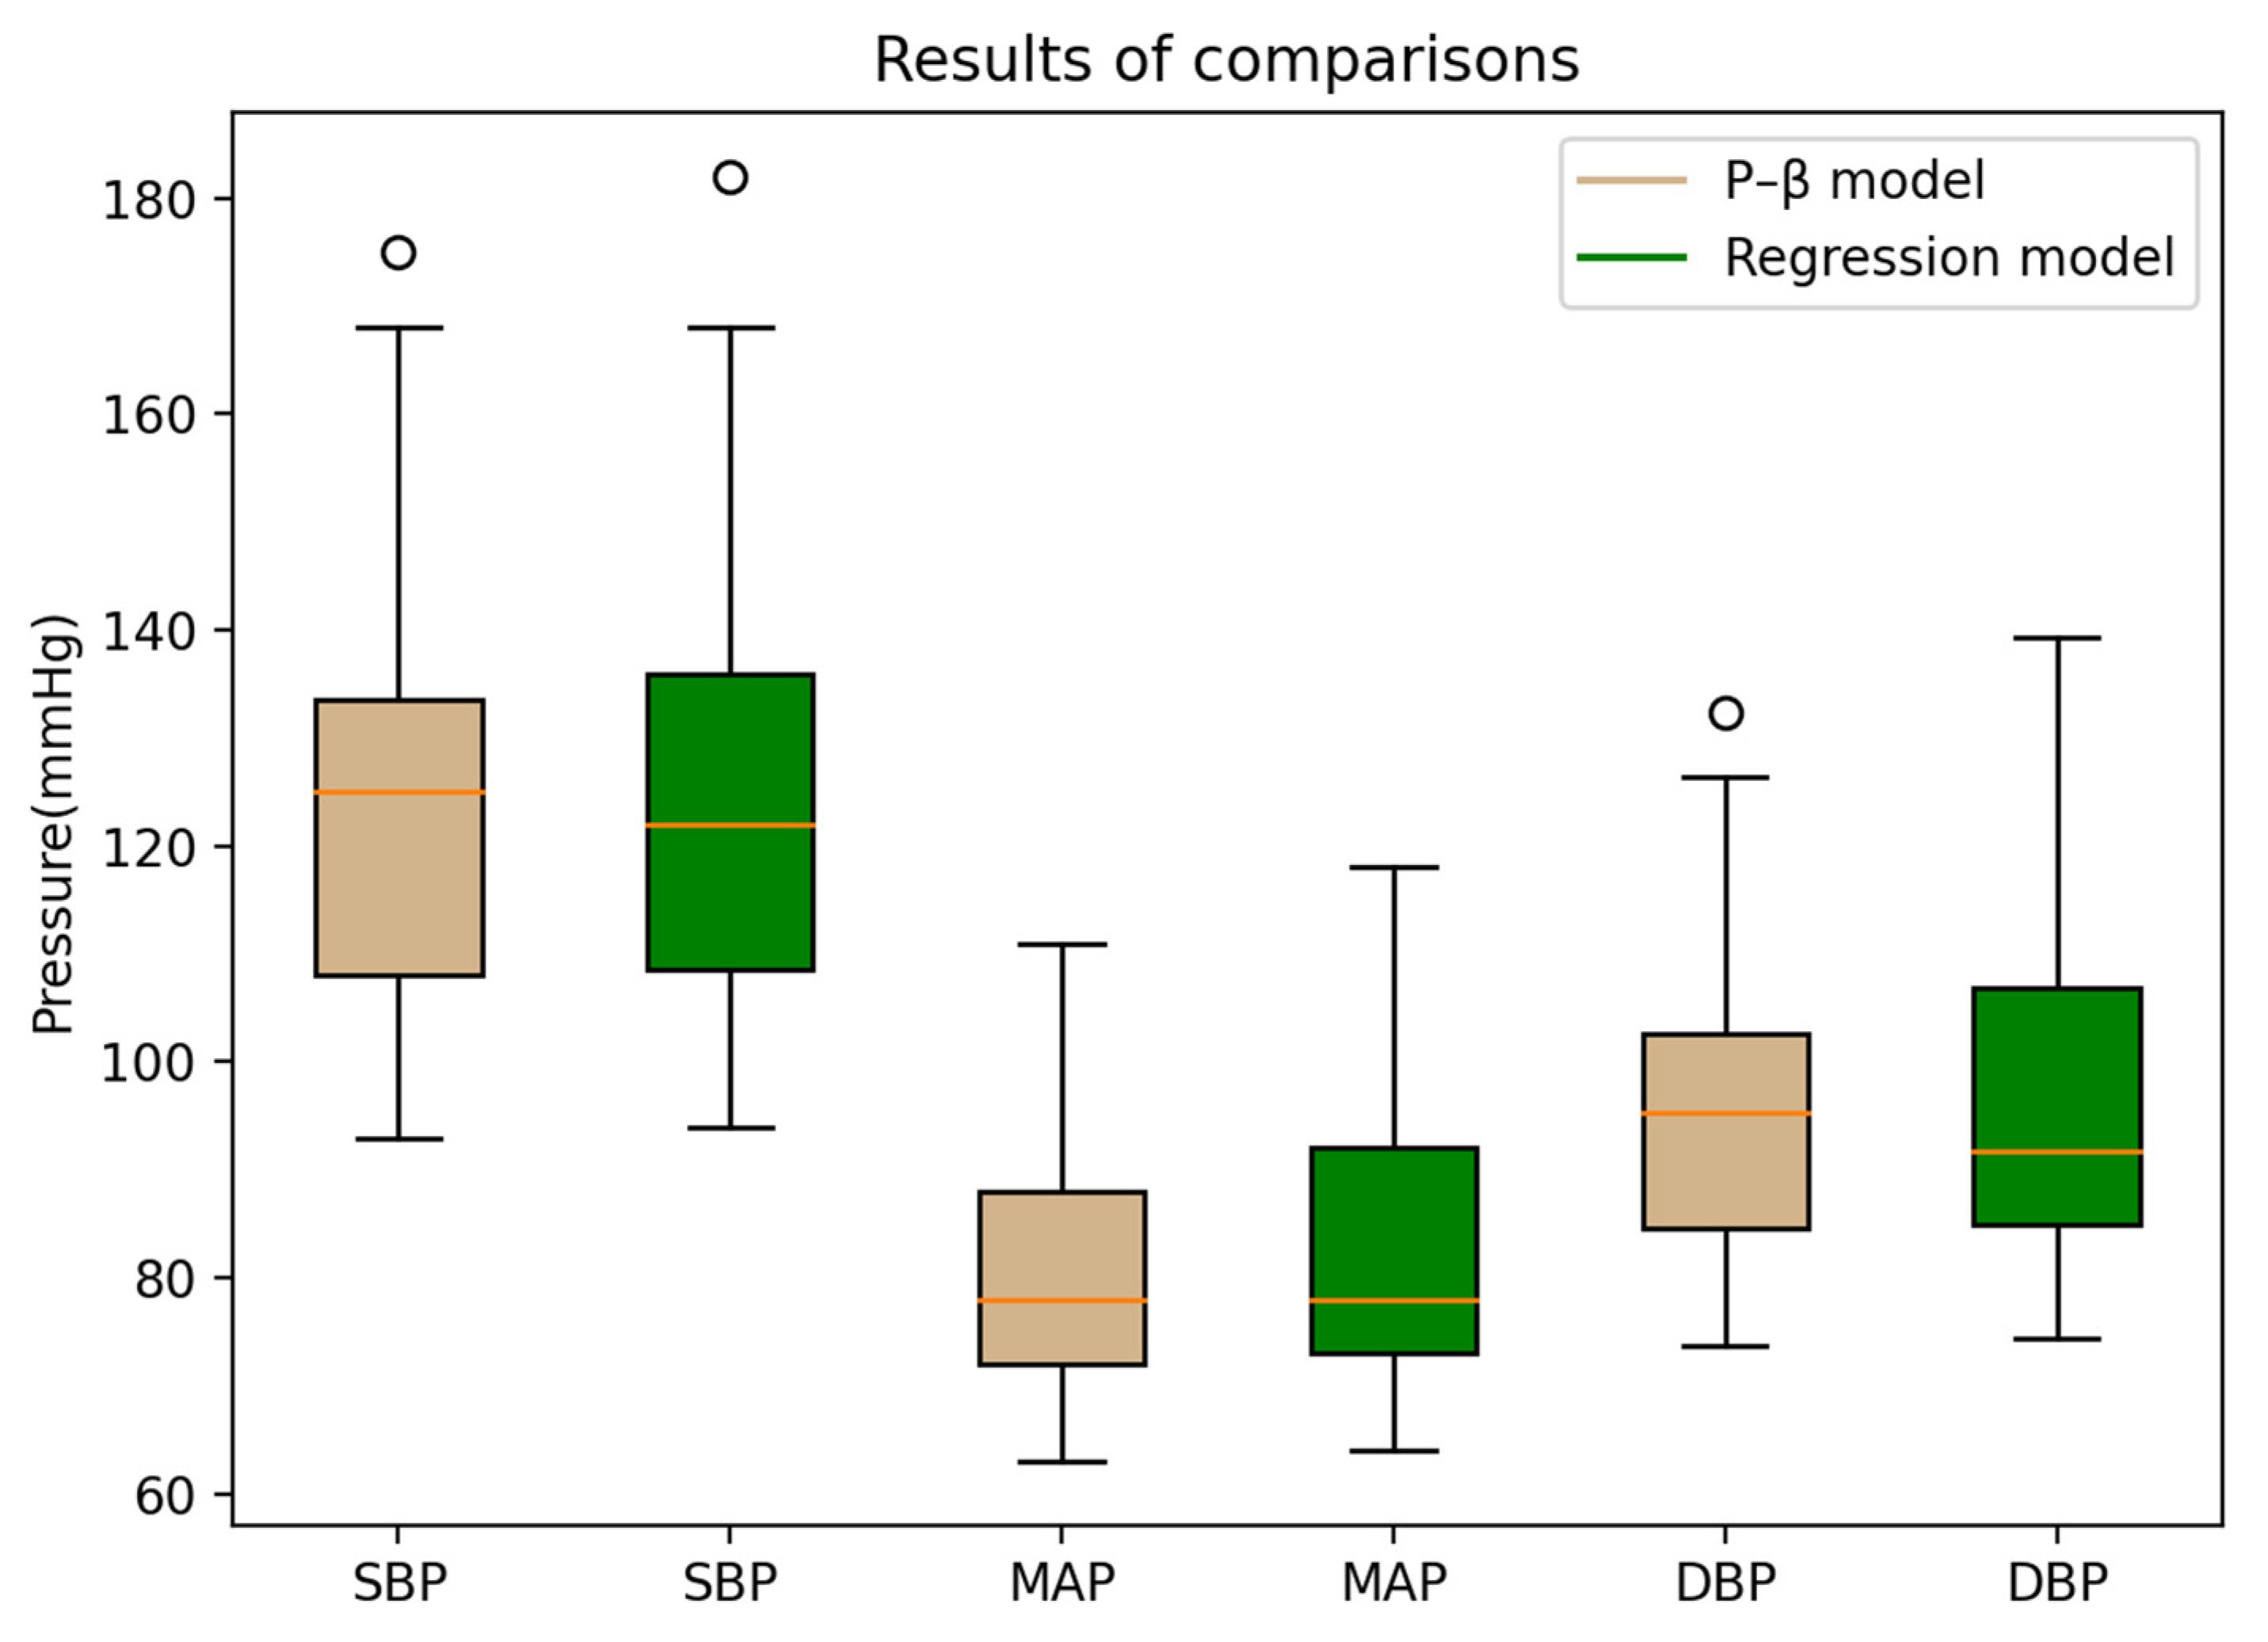
3.1. Experiment Result
3.2. Limitations and Future Works
4. Conclusions
Author Contributions
Funding
Institutional Review Board Statement
Informed Consent Statement
Data Availability Statement
Conflicts of Interest
References
- Wang, H.; Naghavi, M.; Allen, C.; Barber, R.M.; Bhutta, Z.A.; Carter, A.; Bell, M.L. Global, regional, and national life expectancy, all-cause mortality, and cause-specific mortality for 249 causes of death, 1980–2015: A systematic analysis for the Global Burden of Disease Study 2015. Lancet 2016, 388, 1459–1544. [Google Scholar] [CrossRef]
- Staessen, J.A.; Asmar, R.; De Buyzere, M.; Imai, Y.; Parati, G.; Shimada, K.; Verdecchia, P. Task Force II: Blood pressure measurement and cardiovascular outcome. Blood Press. Monit. 2001, 6, 355–370. [Google Scholar] [CrossRef] [PubMed]
- Lee, S.; Dajani, H.R.; Rajan, S.; Lee, G.; Groza, V.Z. Uncertainty in blood pressure measurement estimated using ensem-ble-based recursive methodology. Sensors 2020, 20, 2108. [Google Scholar] [CrossRef]
- IEEE Standard Association. IEEE Standard for Wearable Cuffless Blood Pressure Measuring Devices; IEEE Standard Association: Piscataway, NJ, USA, 2014; pp. 1708–2014. [Google Scholar]
- Boubouchairopoulou, N.; Kollias, A.; Chiu, B.; Chen, B.; Lagou, S.; Anestis, P.; Stergiou, G.S. A novel cuffless device for self-measurement of blood pressure: Concept, performance and clinical validation. J. Hum. Hypertens. 2017, 31, 479–482. [Google Scholar] [CrossRef]
- Zhang, G.; McCombie, S.A.; Greenstein, R.; McCombie, D.B. Assessing the challenges of a pulse wave velocity based blood pressure measurement in surgical patients. In Proceedings of the 36th Annual International Conference of the IEEE Engineering in Medicine and Biology Society, Chicago, IL, USA, 26–30 August 2014; pp. 574–577. [Google Scholar]
- Sharifi, I.; Goudarzi, S.; Khodabakhshi, M.B. A novel dynamical approach in continuous cuffless blood pressure estimation based on ECG and PPG signals. Artif. Intell. Med. 2019, 97, 143–151. [Google Scholar] [CrossRef]
- Mühlsteff, J.; Aubert, X.L.; Schuett, M. Cuffless estimation of systolic blood pressure for short effort bicycle tests: The prominent role of the pre-ejection period. In Proceedings of the International Conference of the IEEE Engineering in Medicine and Biology Society, New York, NY, USA, 30 August–3 September 2006; pp. 5088–5092. [Google Scholar]
- Mukkamala, R.; Hahn, J.O.; Inan, O.T.; Mestha, L.K.; Kim, C.S.; Töreyin, H.; Kyal, S. Toward Ubiquitous Blood Pressure Monitoring via Pulse Transit Time: Theory and Practice. IEEE Trans. Biomed. Eng. 2015, 62, 1879–1901. [Google Scholar] [CrossRef]
- Foo, J.Y.A.; Lim, C.S. Pulse Transit Time Based on Piezoelectric Technique at the Radial Artery. J. Clin. Monit. Comput. 2006, 20, 185–192. [Google Scholar] [CrossRef]
- Kim, S.-C.; Cho, S.-H. Blood Pressure Estimation Algorithm Based on Photoplethysmography Pulse Analyses. Appl. Sci. 2020, 10, 4068. [Google Scholar] [CrossRef]
- Luo, N.; Dai, W.; Li, C.; Zhou, Z.; Lu, L.; Poon, C.C.; Zhao, N. Flexible Piezoresistive Sensor Patch Enabling Ultralow Power Cuffless Blood Pressure Measurement. Adv. Funct. Materials. Appl. Sci. 2016, 26, 1178–1187. [Google Scholar] [CrossRef]
- Geraci, G.; Mulè, G.; Geraci, C.; Mogavero, M.; D’Ignoto, F.; Morreale, M.; Foraci, A.C.; Cottone, S. Association of renal resistive index with aortic pulse wave velocity in hypertensive patients. Eur J Prev Cardiol. 2015, 22, 415–422. [Google Scholar] [CrossRef]
- Nabeel, P.M.; Joseph, J.; Shah, M.I.; Sivaprakasam, M. Evaluation of local pulse wave velocity using an image free ultra-sound technique. In Proceedings of the IEEE International Symposium on Medical Measurements and Applications, Rome, Italy, 11–13 June 2018; pp. 1–6. [Google Scholar]
- Hatamie, A.; Angizi, S.; Kumar, S.; Pandey, C.M.; Simchi, A.; Willander, M.; Malhotra, B.D. Textile Based Chemical and Physical Sensors for Healthcare Monitoring. J. Electrochem. Soc. 2021, 167, 037546. [Google Scholar] [CrossRef]
- Ghosh, S.K.; Park, J.; Na, S.; Kim, M.P.; Ko, H. A Fully Biodegradable Ferroelectric Skin Sensor from Edible Porcine Skin Gelatine. Adv. Sci. 2020, 8, 2005010. [Google Scholar] [CrossRef]
- Shi, X.; Luo, J.; Luo, J.; Li, X.; Han, K.; Li, D.; Wang, Z.L. Flexible Wood-Based Triboelectric Self-Powered Smart Home System. ACS Nano 2022, 16, 3341–3350. [Google Scholar] [CrossRef]
- Li, S.; Ma, Z.; Cao, Z.; Pan, L.; Shi, Y. Advanced Wearable Microfluidic Sensors for Healthcare Monitoring. Small 2020, 16, e1903822. [Google Scholar] [CrossRef]
- Ibrahim, B.; Akbari, A.; Jafari, R. A novel method for pulse transit time estimation using wrist bio-impedance sensing based on a regression model. In Proceedings of the IEEE Biomedical Circuits and Systems Conference, Turin, Italy, 19–21 October 2017; pp. 1–4. [Google Scholar]
- Ibrahim, B.; Jafari, R. Cuffless blood pressure monitoring from a wristband with calibration-free algorithms for sensing location based on bio-impedance sensor array and autoencoder. Sci. Rep. 2022, 12, 319. [Google Scholar] [CrossRef]
- Mukkamala, R.; Yavarimanesh, M.; Natarajan, K.; Hahn, J.-O.; Kyriakoulis, K.G.; Avolio, A.P.; Stergiou, G.S. Evaluation of the Accuracy of Cuffless Blood Pressure Measurement Devices: Challenges and Proposals. Hypertension 2021, 78, 1161–1167. [Google Scholar] [CrossRef]
- Ganti, V.G.; Carek, A.M.; Nevius, B.N.; Heller, J.A.; Etemadi, M.; Inan, O.T. Wearable Cuff-Less Blood Pressure Estimation at Home via Pulse Transit Time. IEEE J. Biomed. Health Inform. 2020, 25, 1926–1937. [Google Scholar] [CrossRef]
- Gaddum, N.R.; Keehn, L.; Guilcher, A.; Gomez, A.; Brett, S.; Beerbaum, P.; Chowienczyk, P. Altered Dependence of Aortic Pulse Wave Velocity on Transmural Pressure in Hypertension Revealing Structural Change in the Aortic Wall. Hypertension 2015, 65, 362–369. [Google Scholar] [CrossRef]
- Pereira, T.; Cabeleira, M.; Matos, P.; Borges, E.; Almeida, V.; Cardoso, J.M.; Pereira, H.C. Optical methods for local pulse wave velocity assessment. In Proceedings of the International Conference on Bio-Inspired Systems and Signal Processing, Rome, Italy, 26–29 January 2011; pp. 74–81. [Google Scholar]
- Nabeshima, T.; Nguyen, T.-V.; Takahashi, H. Frequency Characteristics of Pulse Wave Sensor Using MEMS Piezoresistive Cantilever Element. Micromachines 2022, 13, 645. [Google Scholar] [CrossRef]
- Shoev, G.V.; Ivanov, M.S. Numerical study of shock wave interaction in steady flows of a viscous heat-conducting gas with a low ratio of specific heats. Thermophys. Aeromechanics 2016, 23, 343–354. [Google Scholar] [CrossRef]
- Nukaya, S.; Shino, T.; Kurihara, Y.; Watanabe, K.; Tanaka, H. Noninvasive bed sensing of human biosignals via pie-zoceramic devices sandwiched between the floor and bed. IEEE Sens. J. 2010, 12, 431–438. [Google Scholar] [CrossRef]
- Bartolome, E. Signal conditioning for piezoelectric sensors. Tex. Instrum. Analog. Appl. J. 2010, 10, 24–31. [Google Scholar]
- Starecki, T. Analog Front-End Circuitry in Piezoelectric and Microphone Detection of Photoacoustic Signals. Int. J. Thermophys. 2014, 35, 2124–2139. [Google Scholar] [CrossRef]
- Sinha, A.K.; Caviglia, D.D.; Gaur, P. Design of an advanced signal conditioning unit for sensor with reduced off-the-shelf components. In Proceedings of the International Conference on Devices, Circuits and Systems, Coimbatore, India, 15–16 March 2012; pp. 316–319. [Google Scholar]
- James, K. Analysis of the Sallen-Key Architecture; Application Report; Texas Instruments: Dallas, TX, USA, 2002. [Google Scholar]
- Guo, C.-Y.; Wang, K.-J.; Hsieh, T.-L. Piezoelectric Sensor for the Monitoring of Arterial Pulse Wave: Detection of Arrhythmia Occurring in PAC/PVC Patients. Sensors 2021, 21, 6915. [Google Scholar] [CrossRef]
- Starecki, T. FIR filter design over a discrete powers-of-two coefficient space. IEEE Trans. Acoust. Speech Signal Processing 1983, 31, 583–591. [Google Scholar]
- Jinding, G.; Yubao, H.; Long, S. Design and FPGA Implementation of Linear FIR Low-pass Filter Based on Kaiser Window Function. In Proceedings of the IEEE Fourth International Conference on Intelligent Computation Technology and Automation, Shenzhen, China, 28–29 March 2011; Volume 2, pp. 496–498. [Google Scholar]
- Kerkhof, P.L.; Peace, R.A.; Heyndrickx, G.R.; Meijboom, L.J.; Sprengers, R.W.; Handly, N. Heart Function Analysis in Cardiac Patients with Focus on Sex-Specific Aspects. Sex-Specif. Anal. Cardiovasc. Funct. 2018, 1065, 361–377. [Google Scholar]
- Schönle, P.C. A Power Efficient Spectrophotometry & PPG Integrated Circuit for Mobile Medical Instruments. Ph.D. Thesis, ETH Zurich, Zürich, Switzerland, 2017. [Google Scholar]
- Rybynok, V.O.; Kyriacou, P.A. Beer-lambert law along non-linear mean light pathways for the rational analysis of pho-toplethysmography. J. Phys. Conf. Ser. 2010, 238, 012–061. [Google Scholar] [CrossRef]
- Chen, Y.; Zhu, Y.; Ma, H.T.; Huang, H. A study of photoplethysmography intensity ratio in hypertension. In Proceedings of the IEEE International Conference on Real-Time Computing and Robotics, Krong Siem Reap, Cambodia, 6–10 June 2016; pp. 317–320. [Google Scholar]
- Ray, D.; Collins, T.; Woolley, S.; Ponnapalli, P. A Review of Wearable Multi-wavelength Photoplethysmography. IEEE Rev. Biomed. Eng. 2021, 15, 1–17. [Google Scholar] [CrossRef]
- Shi, P.; Azorin-Peris, V.; Echiadis, A.S.; Zheng, J.; Zhu, Y.; Cheang, P.Y.; Hu, S. Non-contact reflection photoplethys-mography towards effective human physiological monitoring. J. Med. Biol. Eng. 2010, 30, 161–167. [Google Scholar]
- Boonya-Ananta, T.; Rodriguez, A.J.; Ajmal, A.; Du Le, V.N.; Hansen, A.K.; Hutcheson, J.D.; Ramella-Roman, J.C. Synthetic photoplethysmography (PPG) of the radial artery through parallelized Monte Carlo and its correlation to body mass index (BMI). Sci. Rep. 2021, 11, 2570. [Google Scholar]
- Min, S.W.; Cho, H.R.; Jeon, Y.T.; Oh, A.Y.; Park, H.P.; Yang, C.W.; Kim, B.G. Effect of bevel direction on the success rate of ultrasound-guided radial arterial catheterization. BMC Anesthesiol. 2015, 16, 34. [Google Scholar] [CrossRef] [PubMed]
- Oh, E.J.; Lee, J.H.; Kwon, E.J.; Min, J.J. Simulation-based training using a vessel phantom effectively improved first attempt success and dynamic needle-tip positioning ability for ultrasound-guided radial artery cannulation in real patients: An asses-sor-blinded randomized controlled study. PLoS ONE 2020, 15, e0234567. [Google Scholar] [CrossRef] [PubMed]
- Selvaraj, V.; Buhari, F.S. Ultrasound evaluation of effect of different degree of wrist extension on radial artery dimension at the wrist joint. Ann. Card. Anaesth. 2016, 19, 63–67. [Google Scholar] [CrossRef] [PubMed]
- Meglinski, I.V.; Matcher, S.J. Quantitative assessment of skin layers absorption and skin reflectance spectra simulation in the visible and near-infrared spectral regions. Physiol. Meas. 2002, 23, 741. [Google Scholar] [CrossRef]
- Nitzan, M.; Romem, A.; Koppel, R. Pulse oximetry: Fundamentals and technology update. Med. Devices 2014, 7, 231. [Google Scholar] [CrossRef]
- Chaturvedi, A.; Shukair, S.A.; Vijayvergia, M.; Le Rolland, P.; Gunn, J.W.; Subramanian, H. Intraoperative blood vessel detection and quantification: A Monte Carlo study. J. Biomed. Opt. 2018, 23, 067002. [Google Scholar] [CrossRef]
- Vriz, O.; Driussi, C.; La Carrubba, S.; Di Bello, V.; Zito, C.; Carerj, S.; Antonini-Canterin, F. Comparison of sequentially measured Aloka echo-tracking one-point pulse wave velocity with SphygmoCor carotid–femoral pulse wave velocity. SAGE Open Med. 2013, 1, 1–7. [Google Scholar] [CrossRef]
- Ding, X.-R.; Zhang, Y.-T. Photoplethysmogram intensity ratio: A potential indicator for improving the accuracy of PTT-based cuffless blood pressure estimation. In Proceedings of the 37th Annual International Conference of the IEEE Engineering in Medicine and Biology Society, Milan, Italy, 25–29 August 2015; pp. 398–401. [Google Scholar]
- Ding, X.; Yan, B.P.; Zhang, Y.T.; Liu, J.; Zhao, N.; Tsang, H.K. Pulse Transit Time Based Continuous Cuffless Blood Pressure Estimation: A New Extension and a Comprehensive Evaluation. Sci. Rep. 2017, 7, 11554. [Google Scholar] [CrossRef]
- Domagała, Z.; Grzelak, J.; Pospiech, N.; Hunter, N.; Klekowski, J.; Lach, A.; Trzaska, M. Ultrasound evaluation of the radial artery in young adults—A pilot study. Ann. Anat.-Anat. Anz. 2021, 238, 151763. [Google Scholar] [CrossRef]
- Bramwell, J.C.; Hill, A.V. The Velocity of Pulse Wave in Man. Proc. R. Soc. London. Ser. B Contain. Pap. A Biol. Character 1922, 93, 298–306. [Google Scholar]
- Grumann, M.; Steigert, J.; Riegger, L.; Moser, I.; Enderle, B.; Riebeseel, K.; Ducrée, J.J.B.M. Sensitivity enhancement for colorimetric glucose assays on whole blood by on-chip beam-guidance. Biomed. Microdevices 2006, 8, 209–214. [Google Scholar] [CrossRef] [PubMed]
- Vlachopoulos, C.; O’Rourke, M.; Nichols, W.W. McDonald’s Blood Flow in Arteries: Theoretical, Experimental and Clinical Principle; CRC Press: Boca Raton, FL, USA, 1998; Volume 9, pp. 456–553. [Google Scholar]
- Hughes, D.J.; Babbs, C.F.; Geddes, L.A.; Bourland, J.D. Measurements of Young’s modulus of elasticity of the canine aorta with ultrasound. Ultrason. Imaging 1979, 1, 356–367. [Google Scholar] [CrossRef]
- Solà, J.; Delgado-Gonzalo, R. The Handbook of Cuffless Blood Pressure Monitoring; Springer: Berlin/Heidelberg, Germany, 2019. [Google Scholar]
- Chen, Y.; Wen, C.; Tao, G.; Bi, M.; Li, G. Continuous and Noninvasive Blood Pressure Measurement: A Novel Modeling Methodology of the Relationship between Blood Pressure and Pulse Wave Velocity. Ann. Biomed. Eng. 2009, 37, 2222–2233. [Google Scholar] [CrossRef] [PubMed]
- Mukkamala, R.; Stergiou, G.S.; Avolio, A.P. Cuffless blood pressure measurement. Annu. Rev. Biomed. Eng. 2022, 24, 203–230. [Google Scholar] [CrossRef] [PubMed]
- Wibmer, T.; Doering, K.; Kropf-Sanchen, C.; Rüdiger, S.; Blanta, I.; Stoiber, K.M.; Schumann, C. Pulse Transit Time and Blood Pressure during Cardiopulmonary Exercise Tests. Physiol. Res. 2014, 63, 287–296. [Google Scholar] [CrossRef]
- Nabeel, P.M.; Jayaraj, J.; Srinivasa, K.; Mohanasankar, S.; Chenniappan, M. Bimodal arterial compliance probe for cali-bration-free cuffless blood pressure estimation. IEEE Trans. Biomed. Eng. 2018, 65, 2392–2404. [Google Scholar] [CrossRef] [PubMed]
- Joseph, J.; PM, N.; Shah, M.I.; Sivaprakasam, M. Arterial compliance probe for cuffless evaluation of carotid pulse pressure. PLoS ONE 2018, 13, e0202480. [Google Scholar] [CrossRef]
- Harada, A.; Okada, T.; Niki, K.; Chang, D.; Sugawara, M. On-line noninvasive one-point measurements of pulse wave velocity. Heart Vessel. 2002, 17, 61–68. [Google Scholar] [CrossRef] [PubMed]
- Saiki, A.; Sato, Y.; Watanabe, R.; Watanabe, Y.; Imamura, H.; Yamaguchi, T.; Tatsuno, I. The Role of a Novel Arterial Stiffness Parameter, Cardio-Ankle Vascular Index (CAVI), as a Surrogate Marker for Cardiovascular Diseases. J. Atheroscler. Thromb. 2015, 22, 1–14. [Google Scholar] [CrossRef]
- Christensen, K.L.; Mulvany, M.J.; Jespersen, L.T. Can mean arterial pressure be estimated from measurements of systolic and diastolic blood pressure, and vice versa? J. Hypertens. 1990, 8, 321–326. [Google Scholar] [CrossRef]
- Khan Mamun, M.M.R.; Alouani, A.T. Cuffless blood pressure measurement using linear and non-linear optimized feature selection. Diagnostics 2022, 12, 408. [Google Scholar] [CrossRef] [PubMed]


| Pass Requirements | Achieved | |||
|---|---|---|---|---|
| SBP | DBP | MAP | ||
| Criterion 1 | ||||
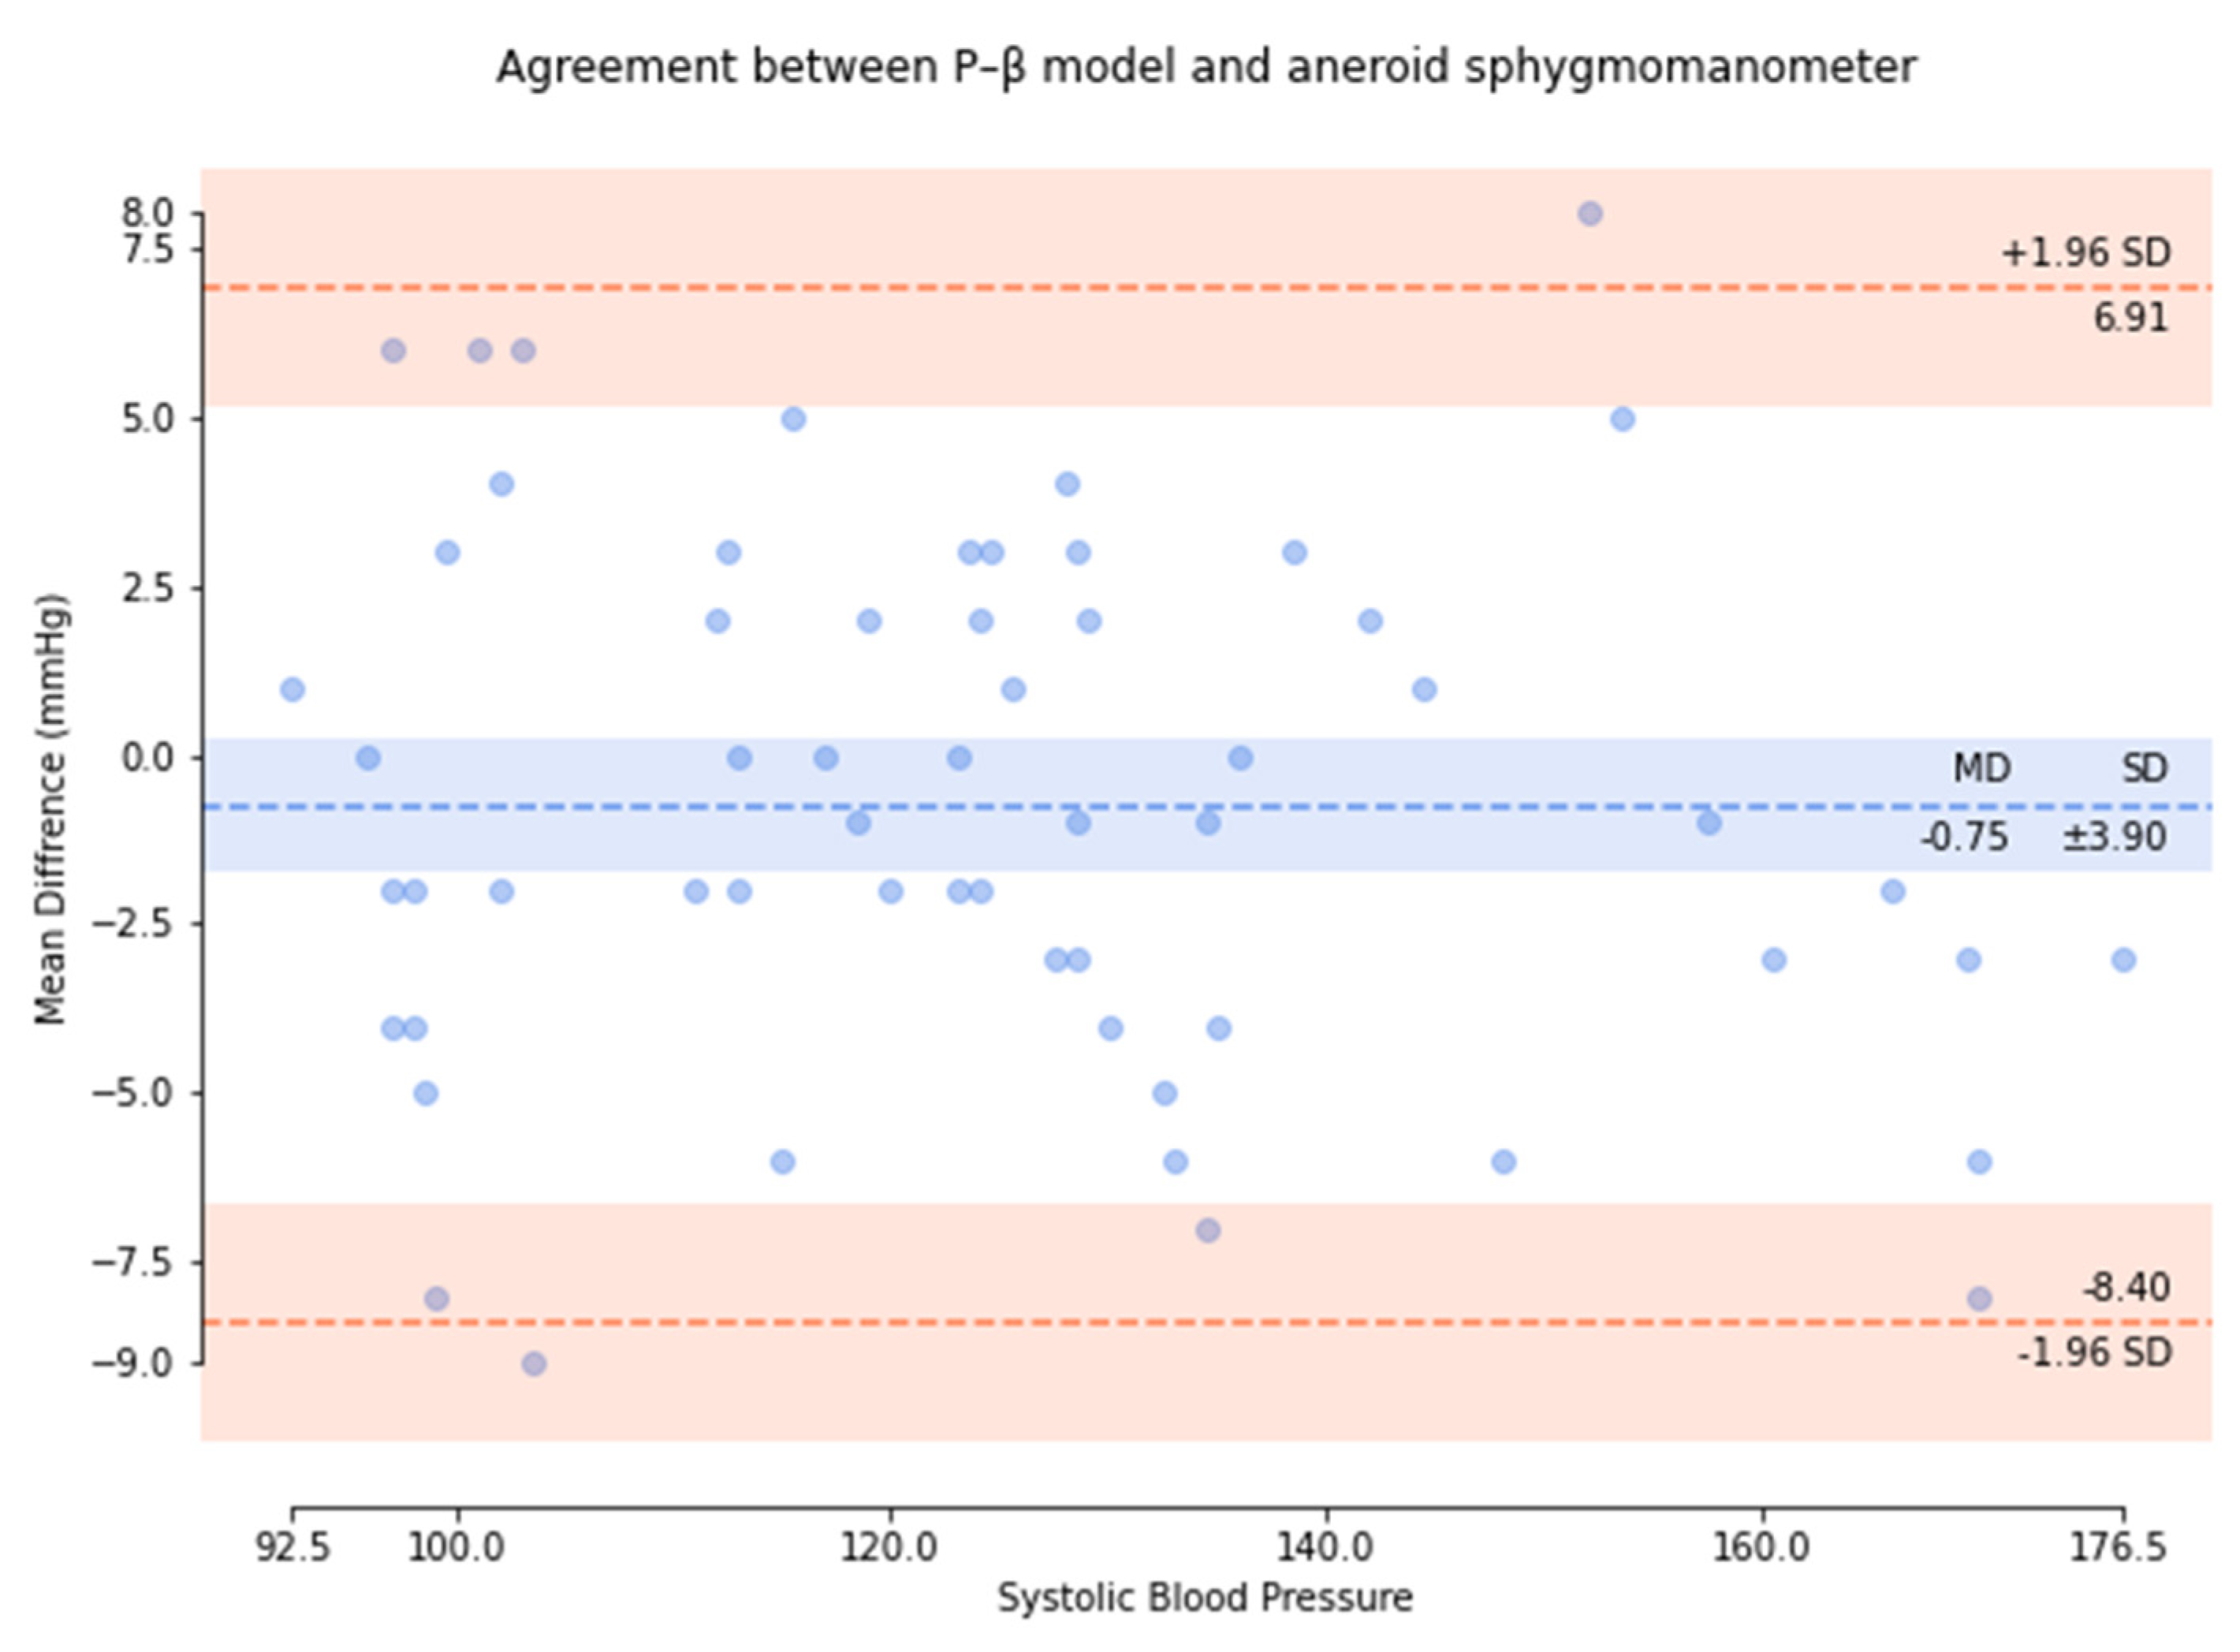
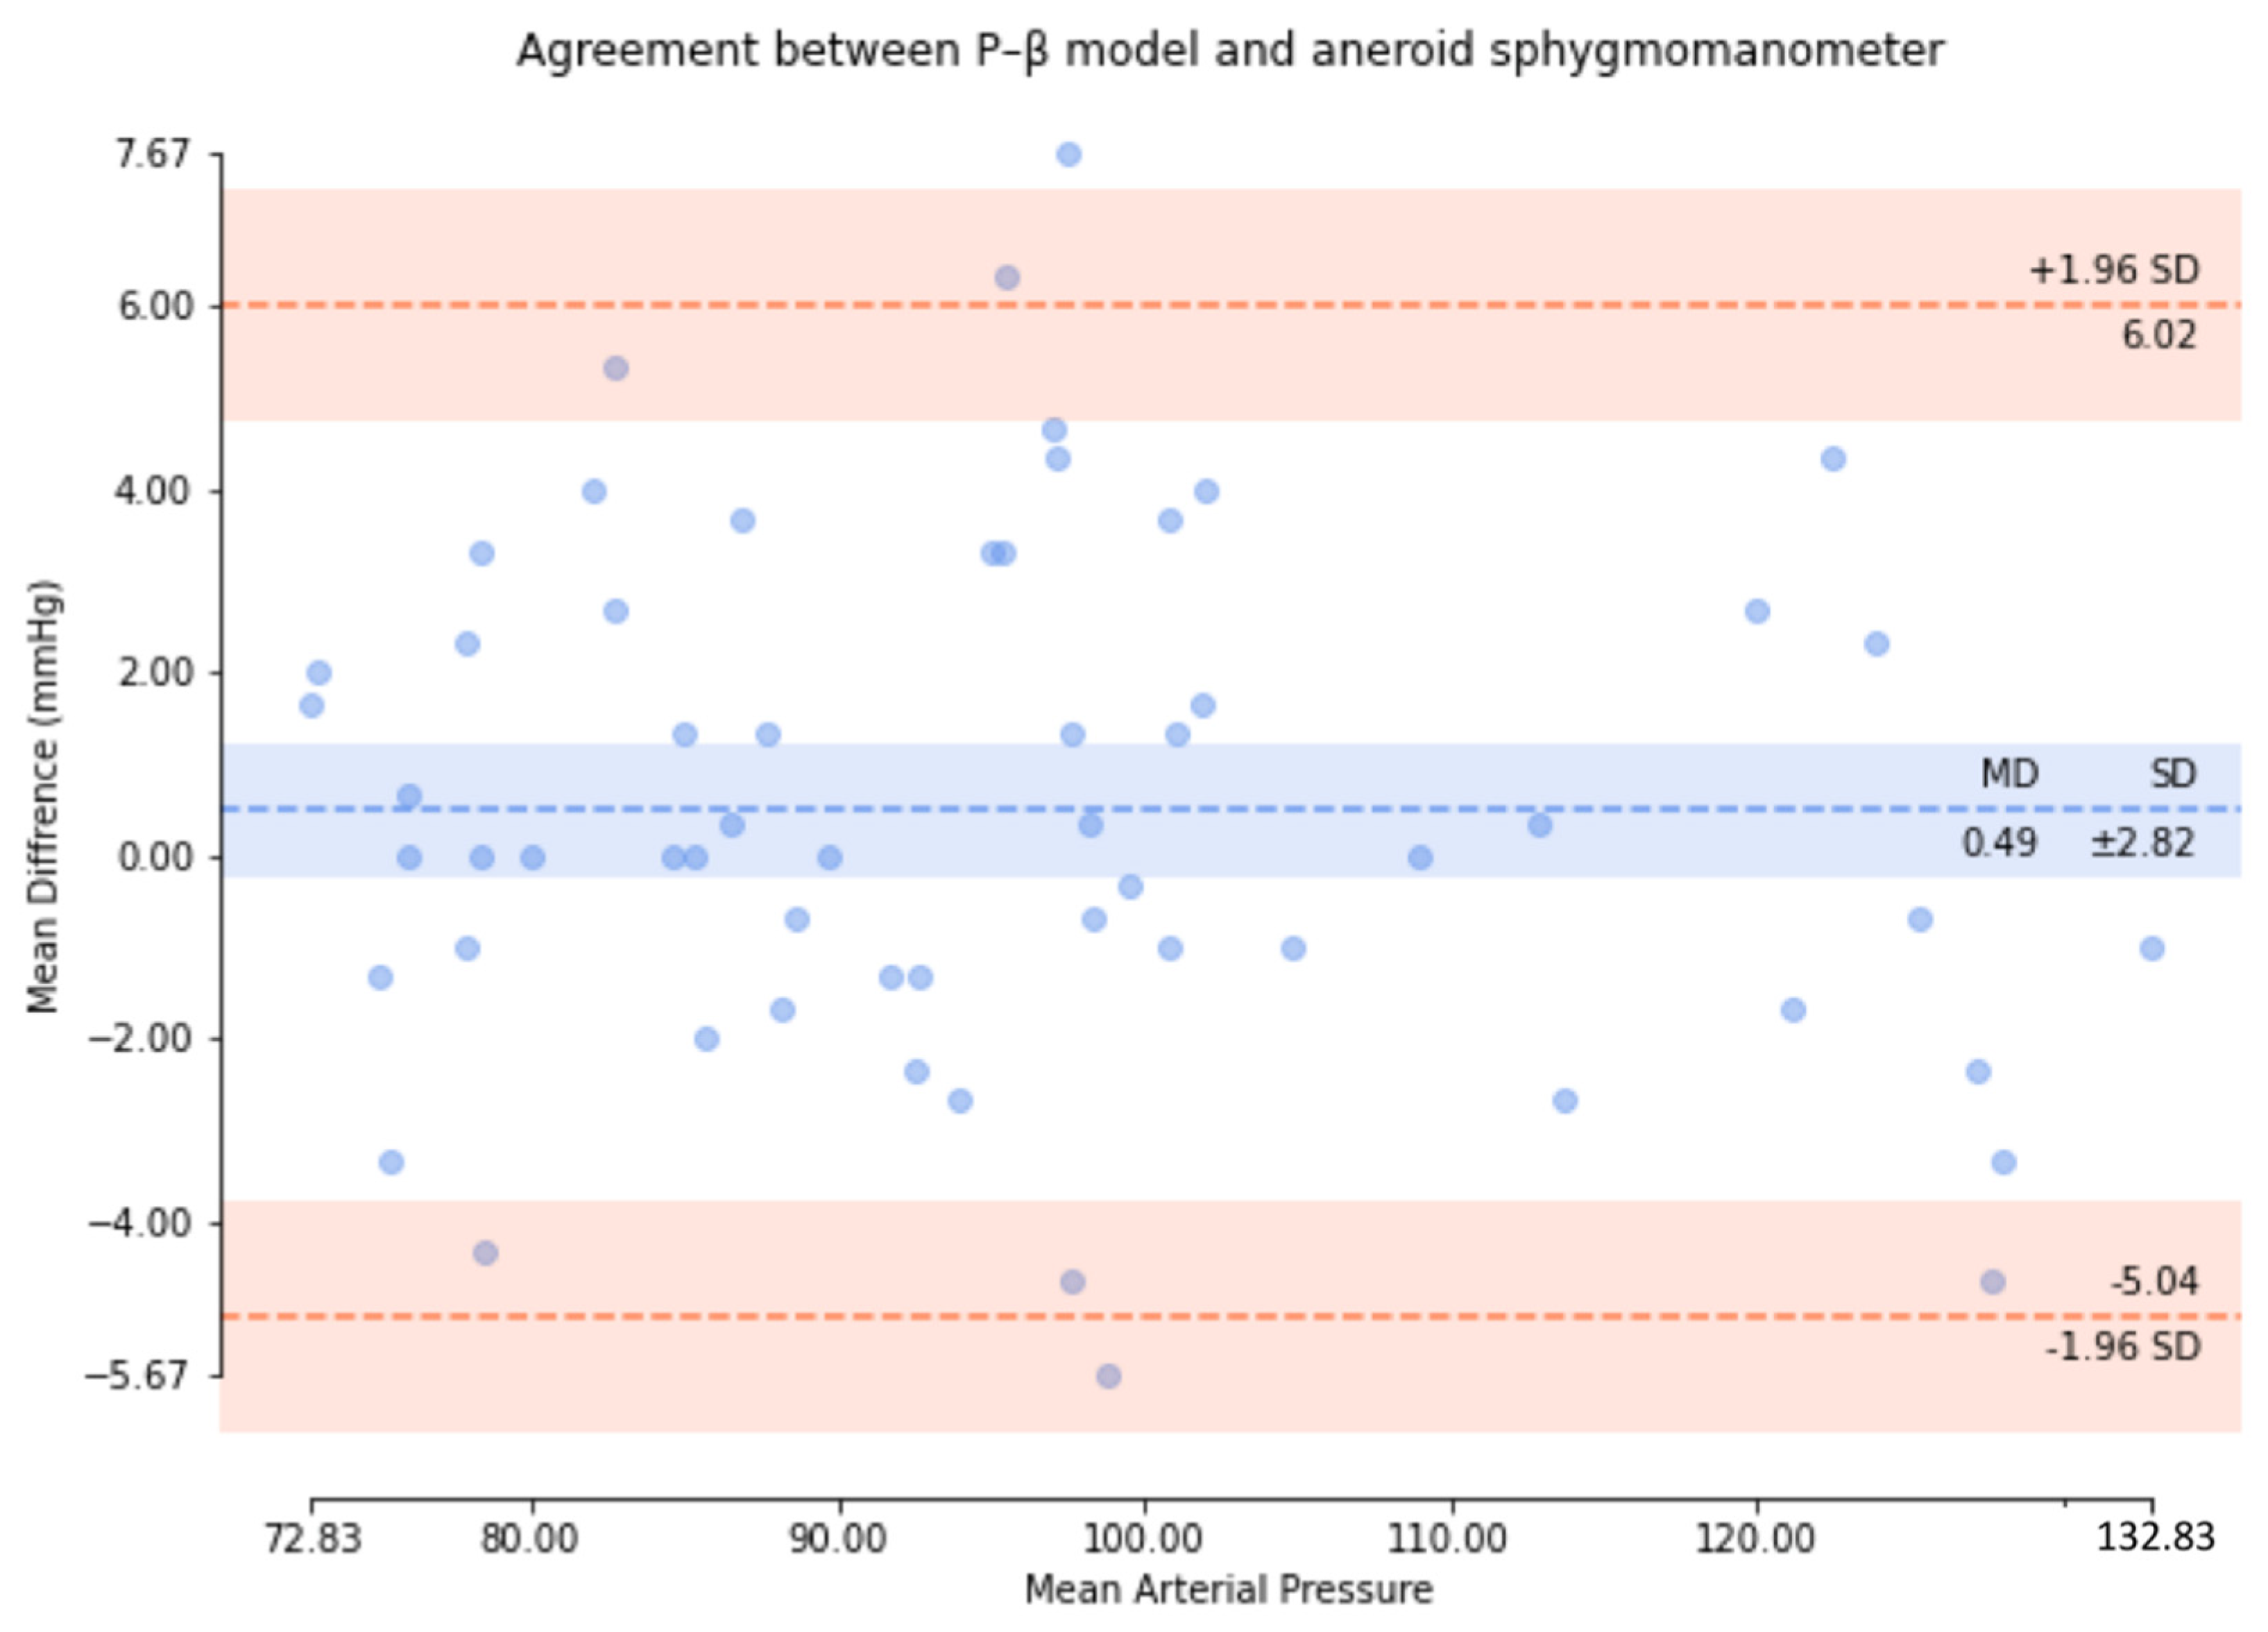
| Means (mmHg) | ≤5 | 0.75 | 0.49 | 1.10 |
| SD (mmHg) | ≤8 | 3.90 | 2.82 | 3.12 |
| Results | pass | pass | pass | |
| Criterion 2 | ||||
| SD (mmHg) | ≤6.89/6.92/6.86 | 3.71 | 2.67 | 2.91 |
| Results | pass | pass | pass | |
| Results | pass | |||
Publisher’s Note: MDPI stays neutral with regard to jurisdictional claims in published maps and institutional affiliations. |
© 2022 by the authors. Licensee MDPI, Basel, Switzerland. This article is an open access article distributed under the terms and conditions of the Creative Commons Attribution (CC BY) license (https://creativecommons.org/licenses/by/4.0/).
Share and Cite
Guo, C.-Y.; Chang, H.-C.; Wang, K.-J.; Hsieh, T.-L. An Arterial Compliance Sensor for Cuffless Blood Pressure Estimation Based on Piezoelectric and Optical Signals. Micromachines 2022, 13, 1327. https://doi.org/10.3390/mi13081327
Guo C-Y, Chang H-C, Wang K-J, Hsieh T-L. An Arterial Compliance Sensor for Cuffless Blood Pressure Estimation Based on Piezoelectric and Optical Signals. Micromachines. 2022; 13(8):1327. https://doi.org/10.3390/mi13081327
Chicago/Turabian StyleGuo, Cheng-Yan, Hao-Ching Chang, Kuan-Jen Wang, and Tung-Li Hsieh. 2022. "An Arterial Compliance Sensor for Cuffless Blood Pressure Estimation Based on Piezoelectric and Optical Signals" Micromachines 13, no. 8: 1327. https://doi.org/10.3390/mi13081327
APA StyleGuo, C.-Y., Chang, H.-C., Wang, K.-J., & Hsieh, T.-L. (2022). An Arterial Compliance Sensor for Cuffless Blood Pressure Estimation Based on Piezoelectric and Optical Signals. Micromachines, 13(8), 1327. https://doi.org/10.3390/mi13081327