
Renewable DNA Proportional-Integral Controller with Photoresponsive Molecules


Abstract
:
1. Introduction
2. Materials and Methods
2.1. Simulation Conditions
2.2. Experimental Environment
3. Preliminaries
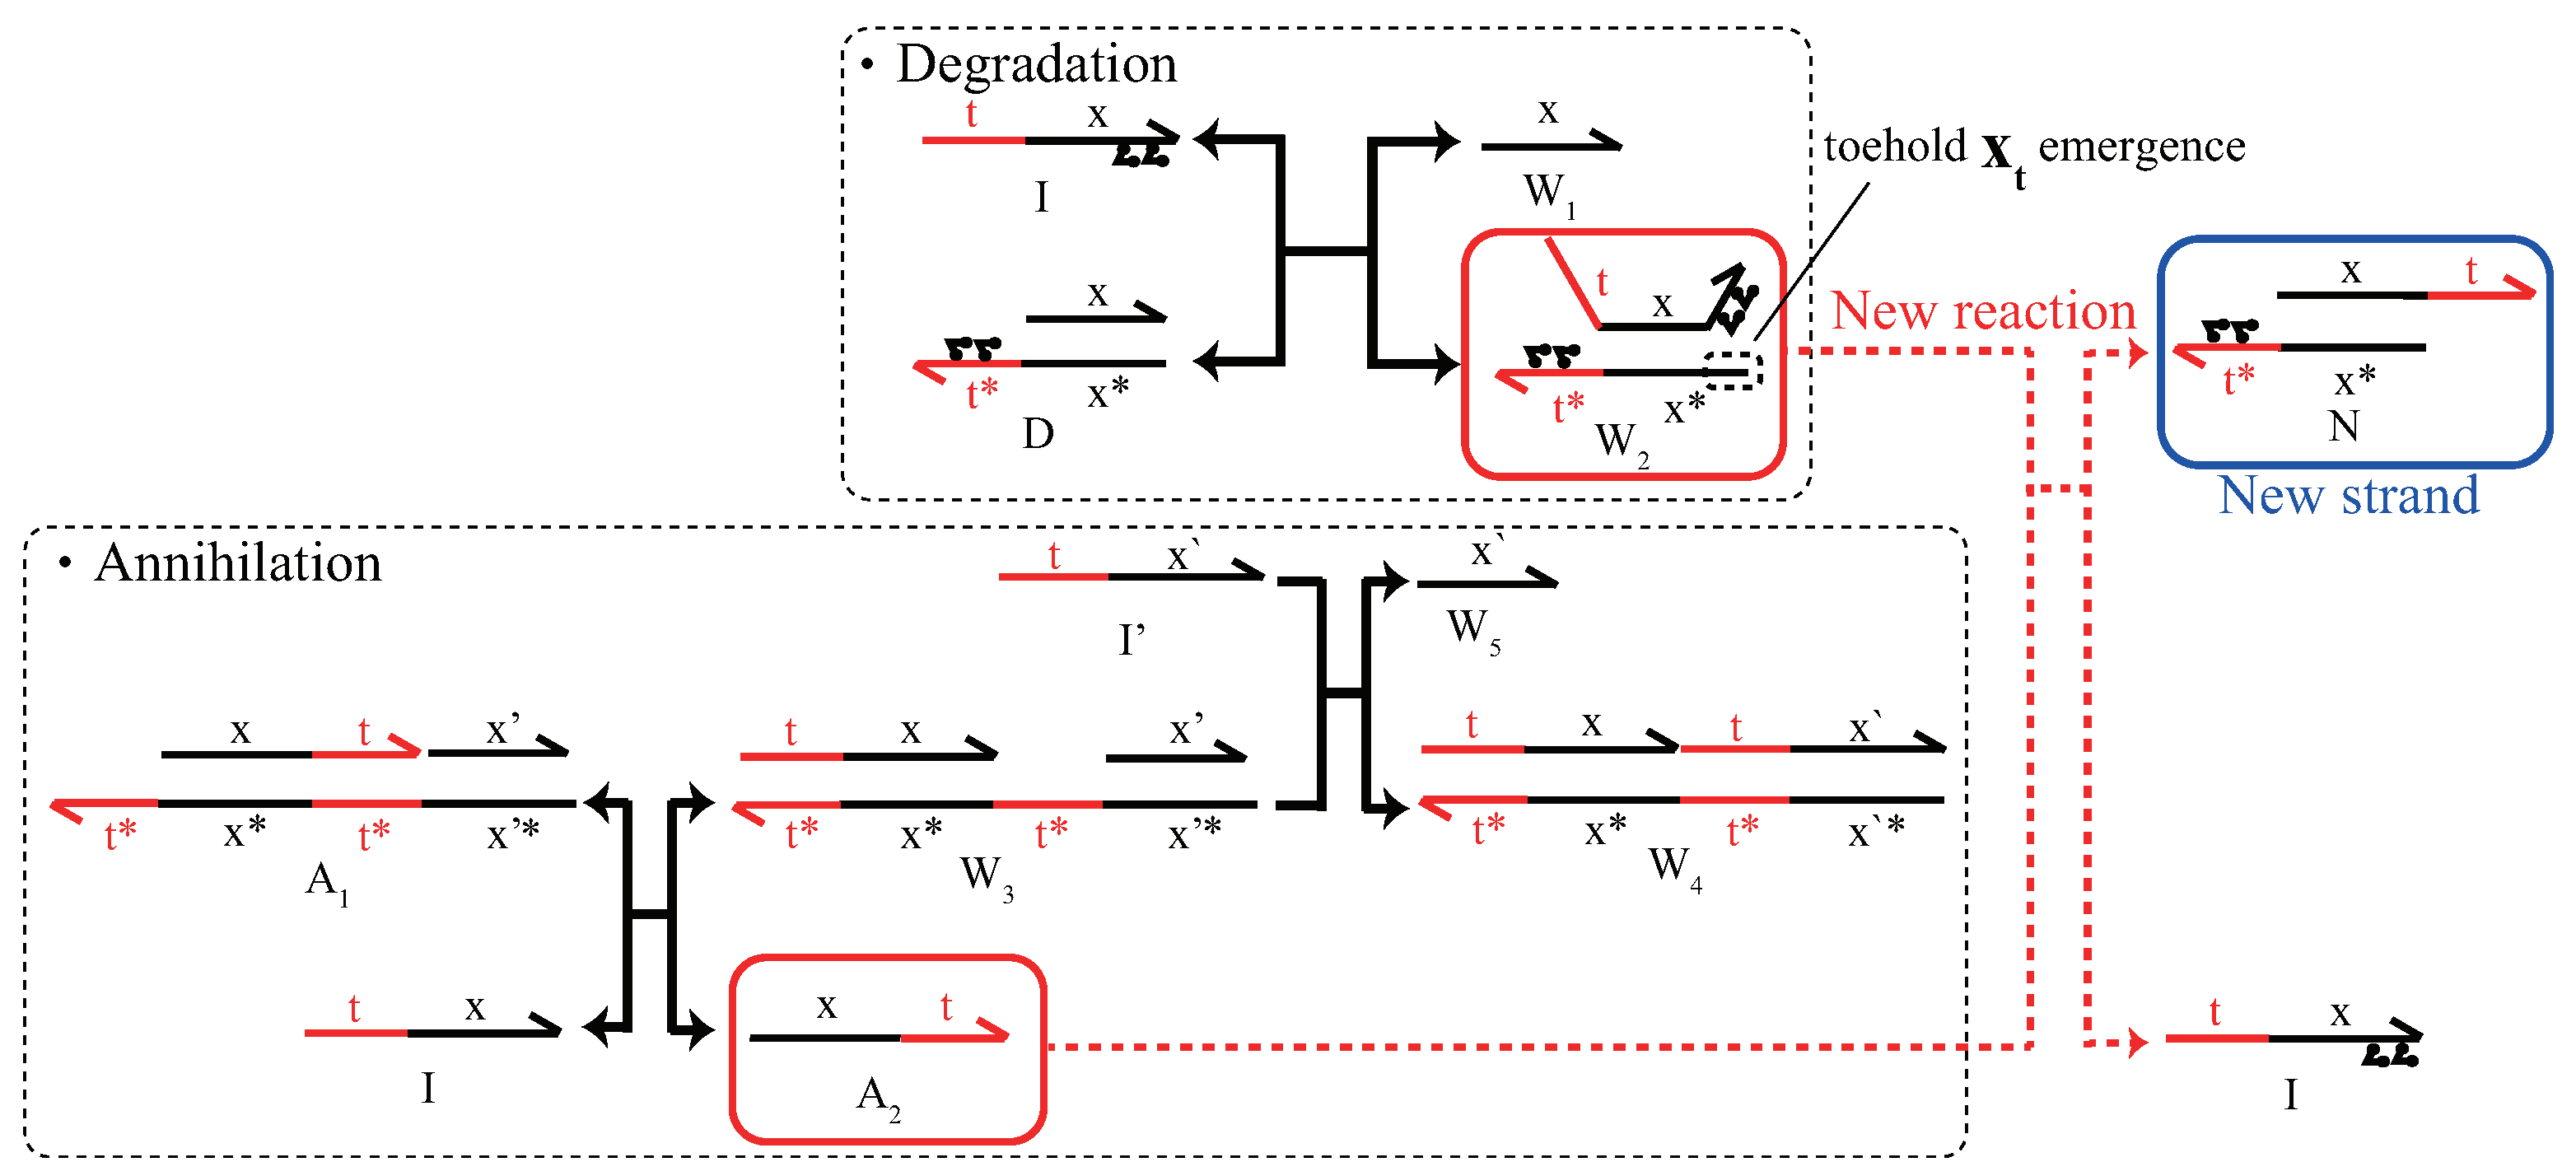
3.1. Three Basic Reaction Mechanisms
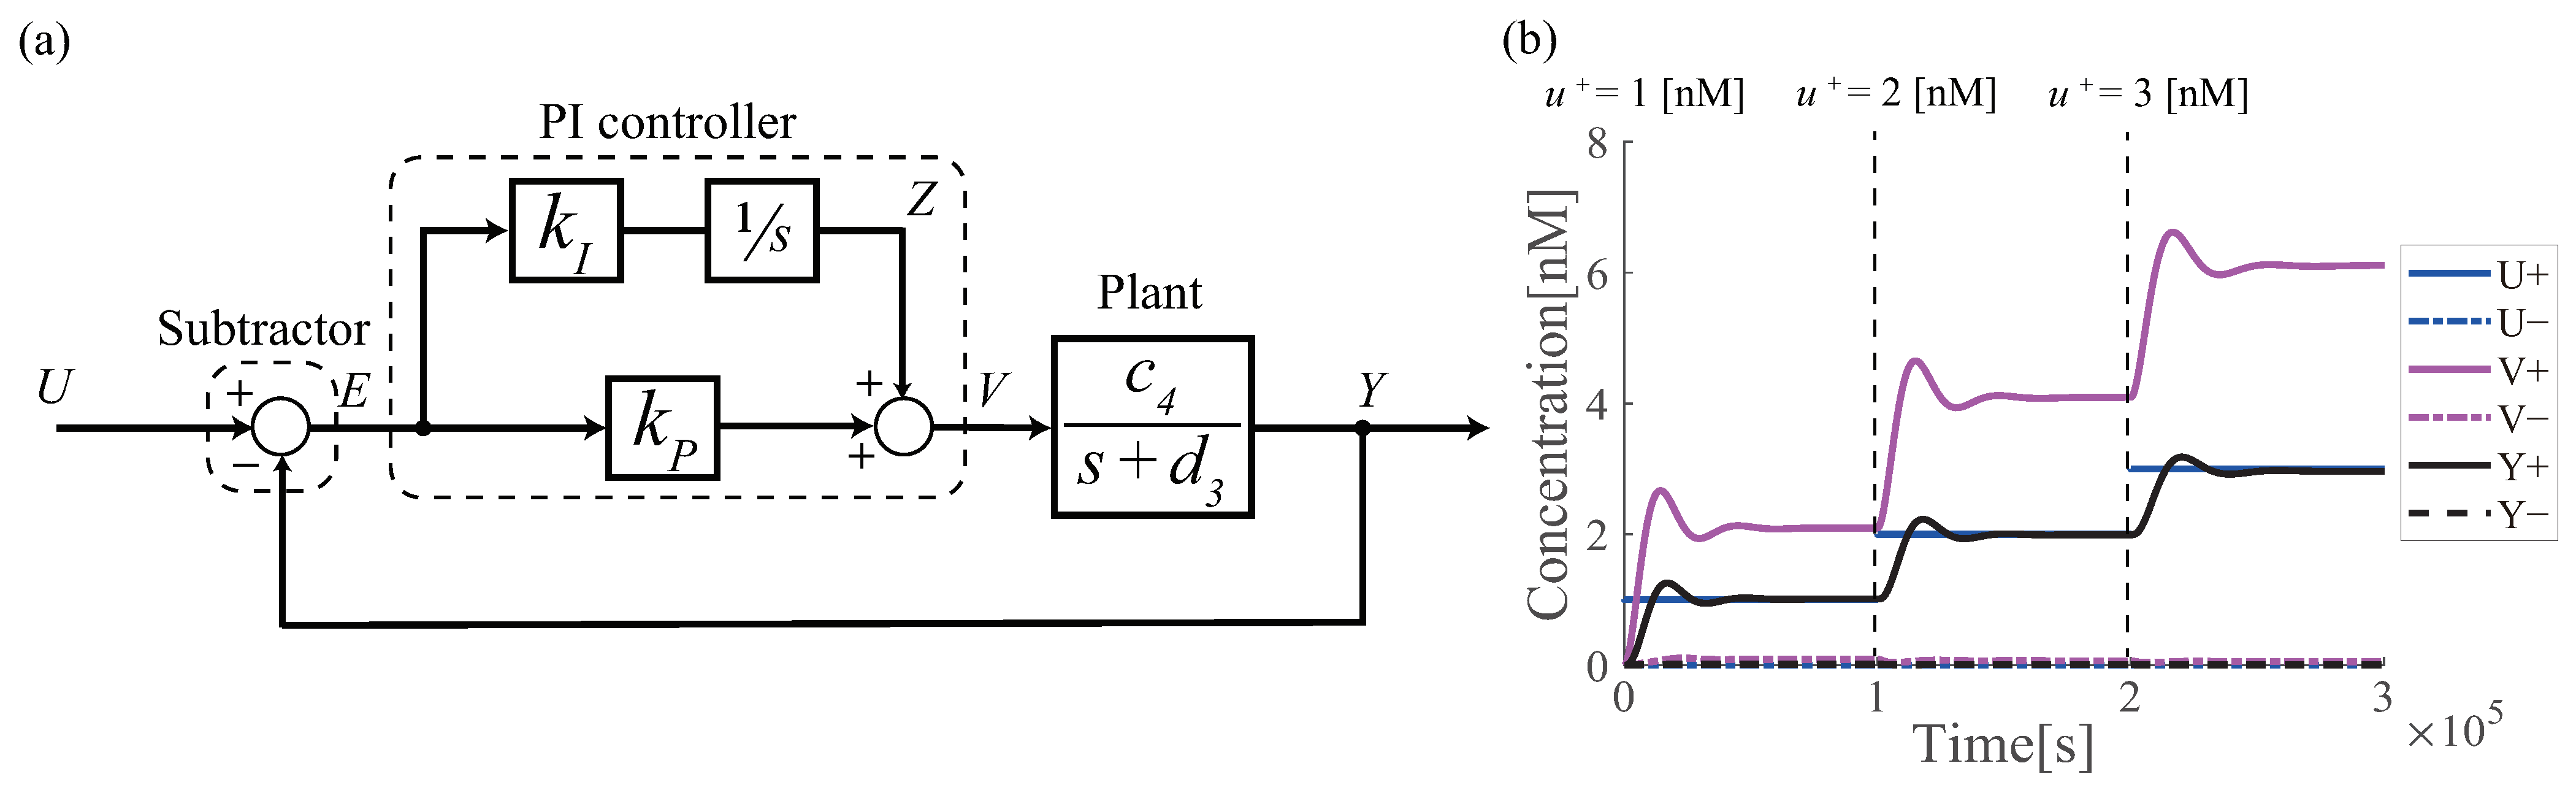
3.2. Design of Molecular PI Controller
4. Problem Statement
5. Previous Works
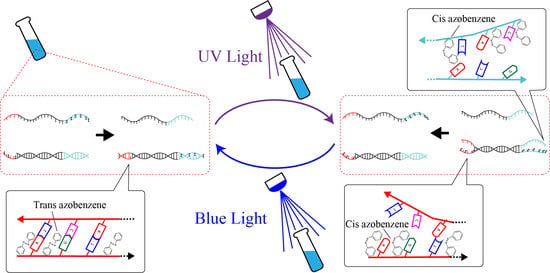
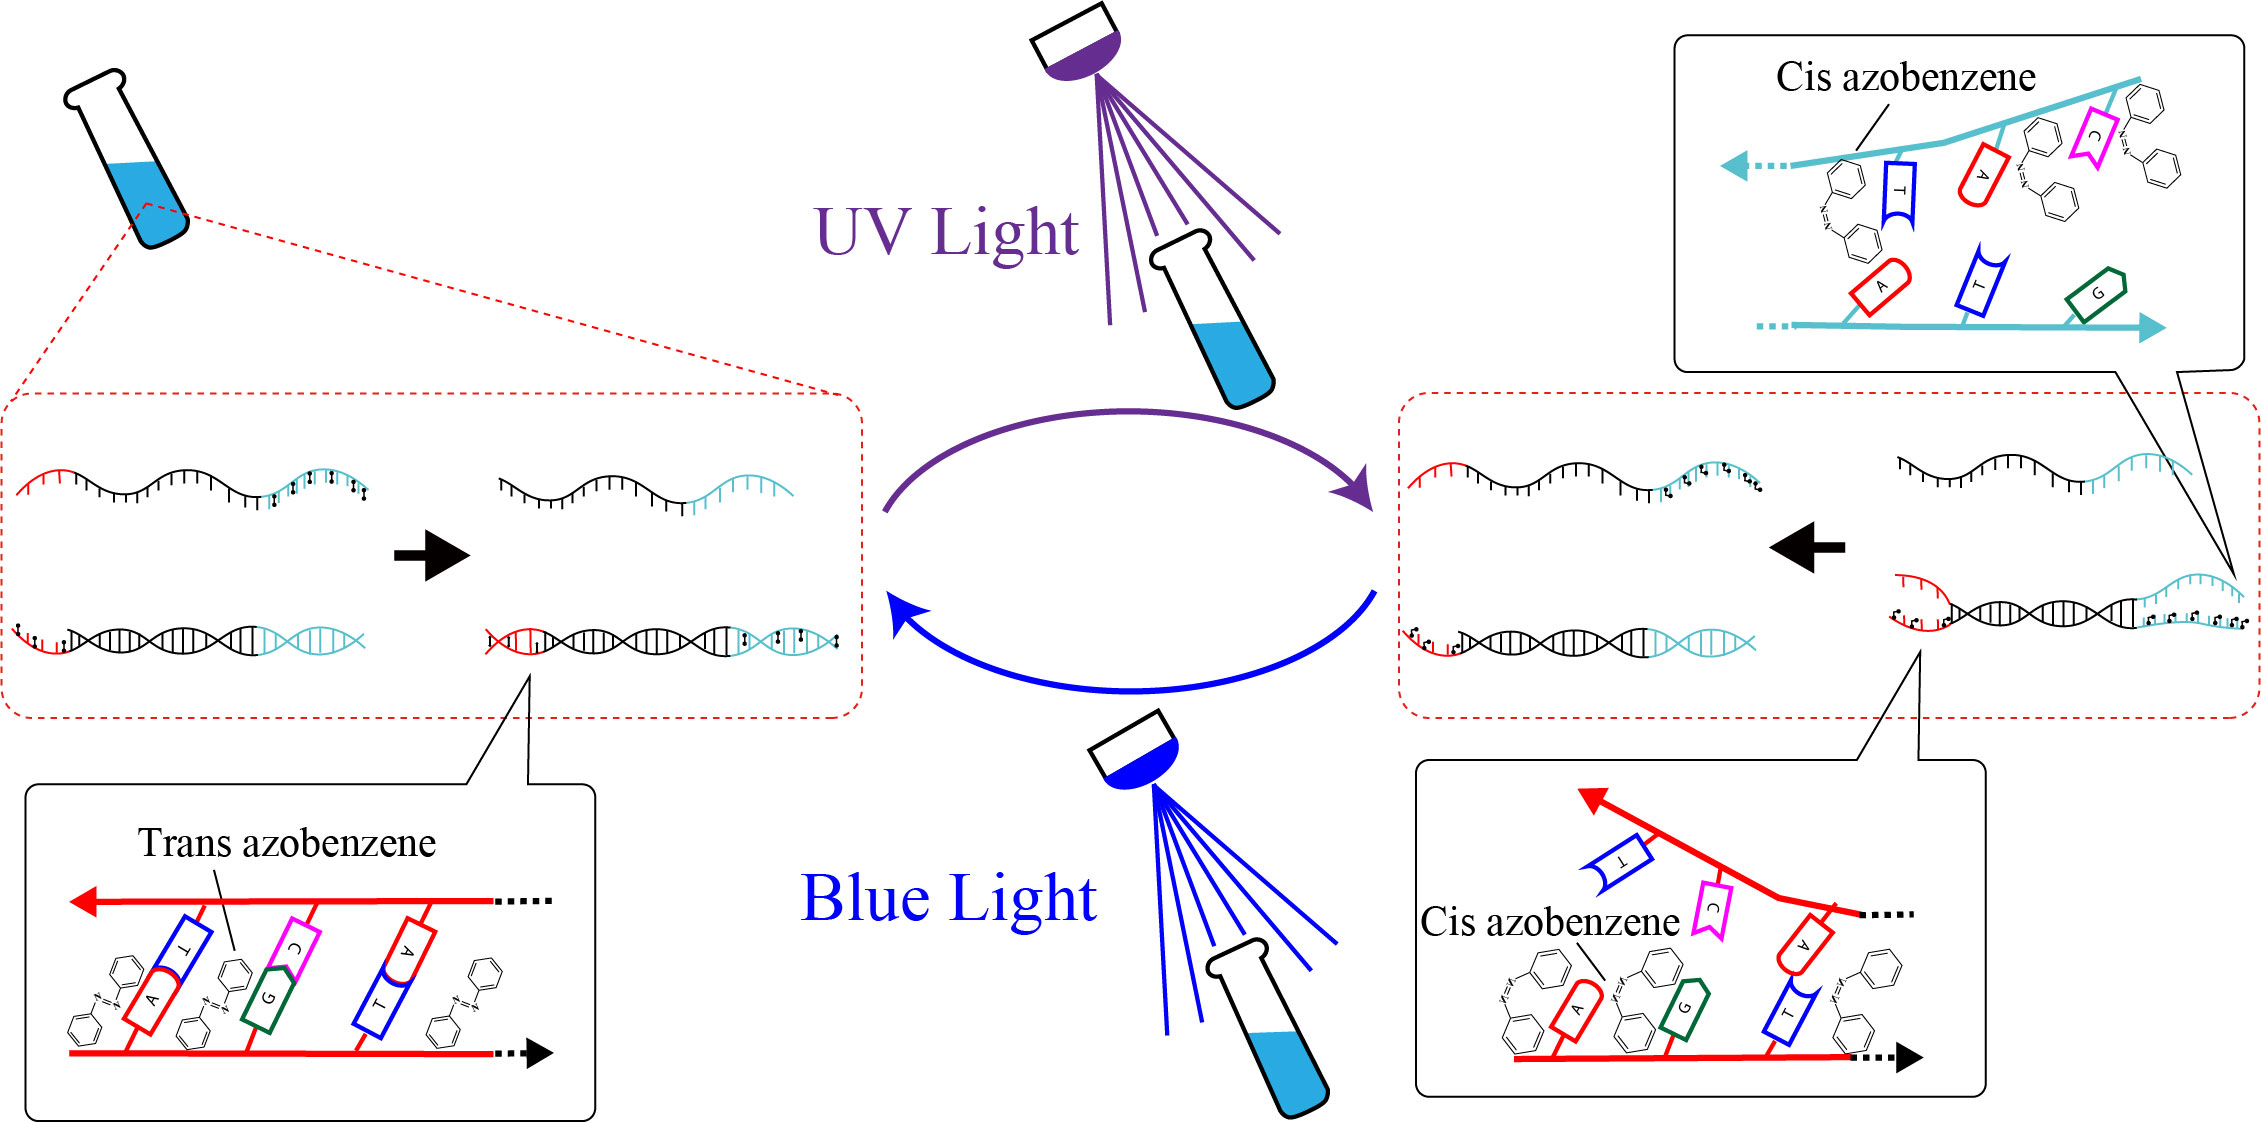
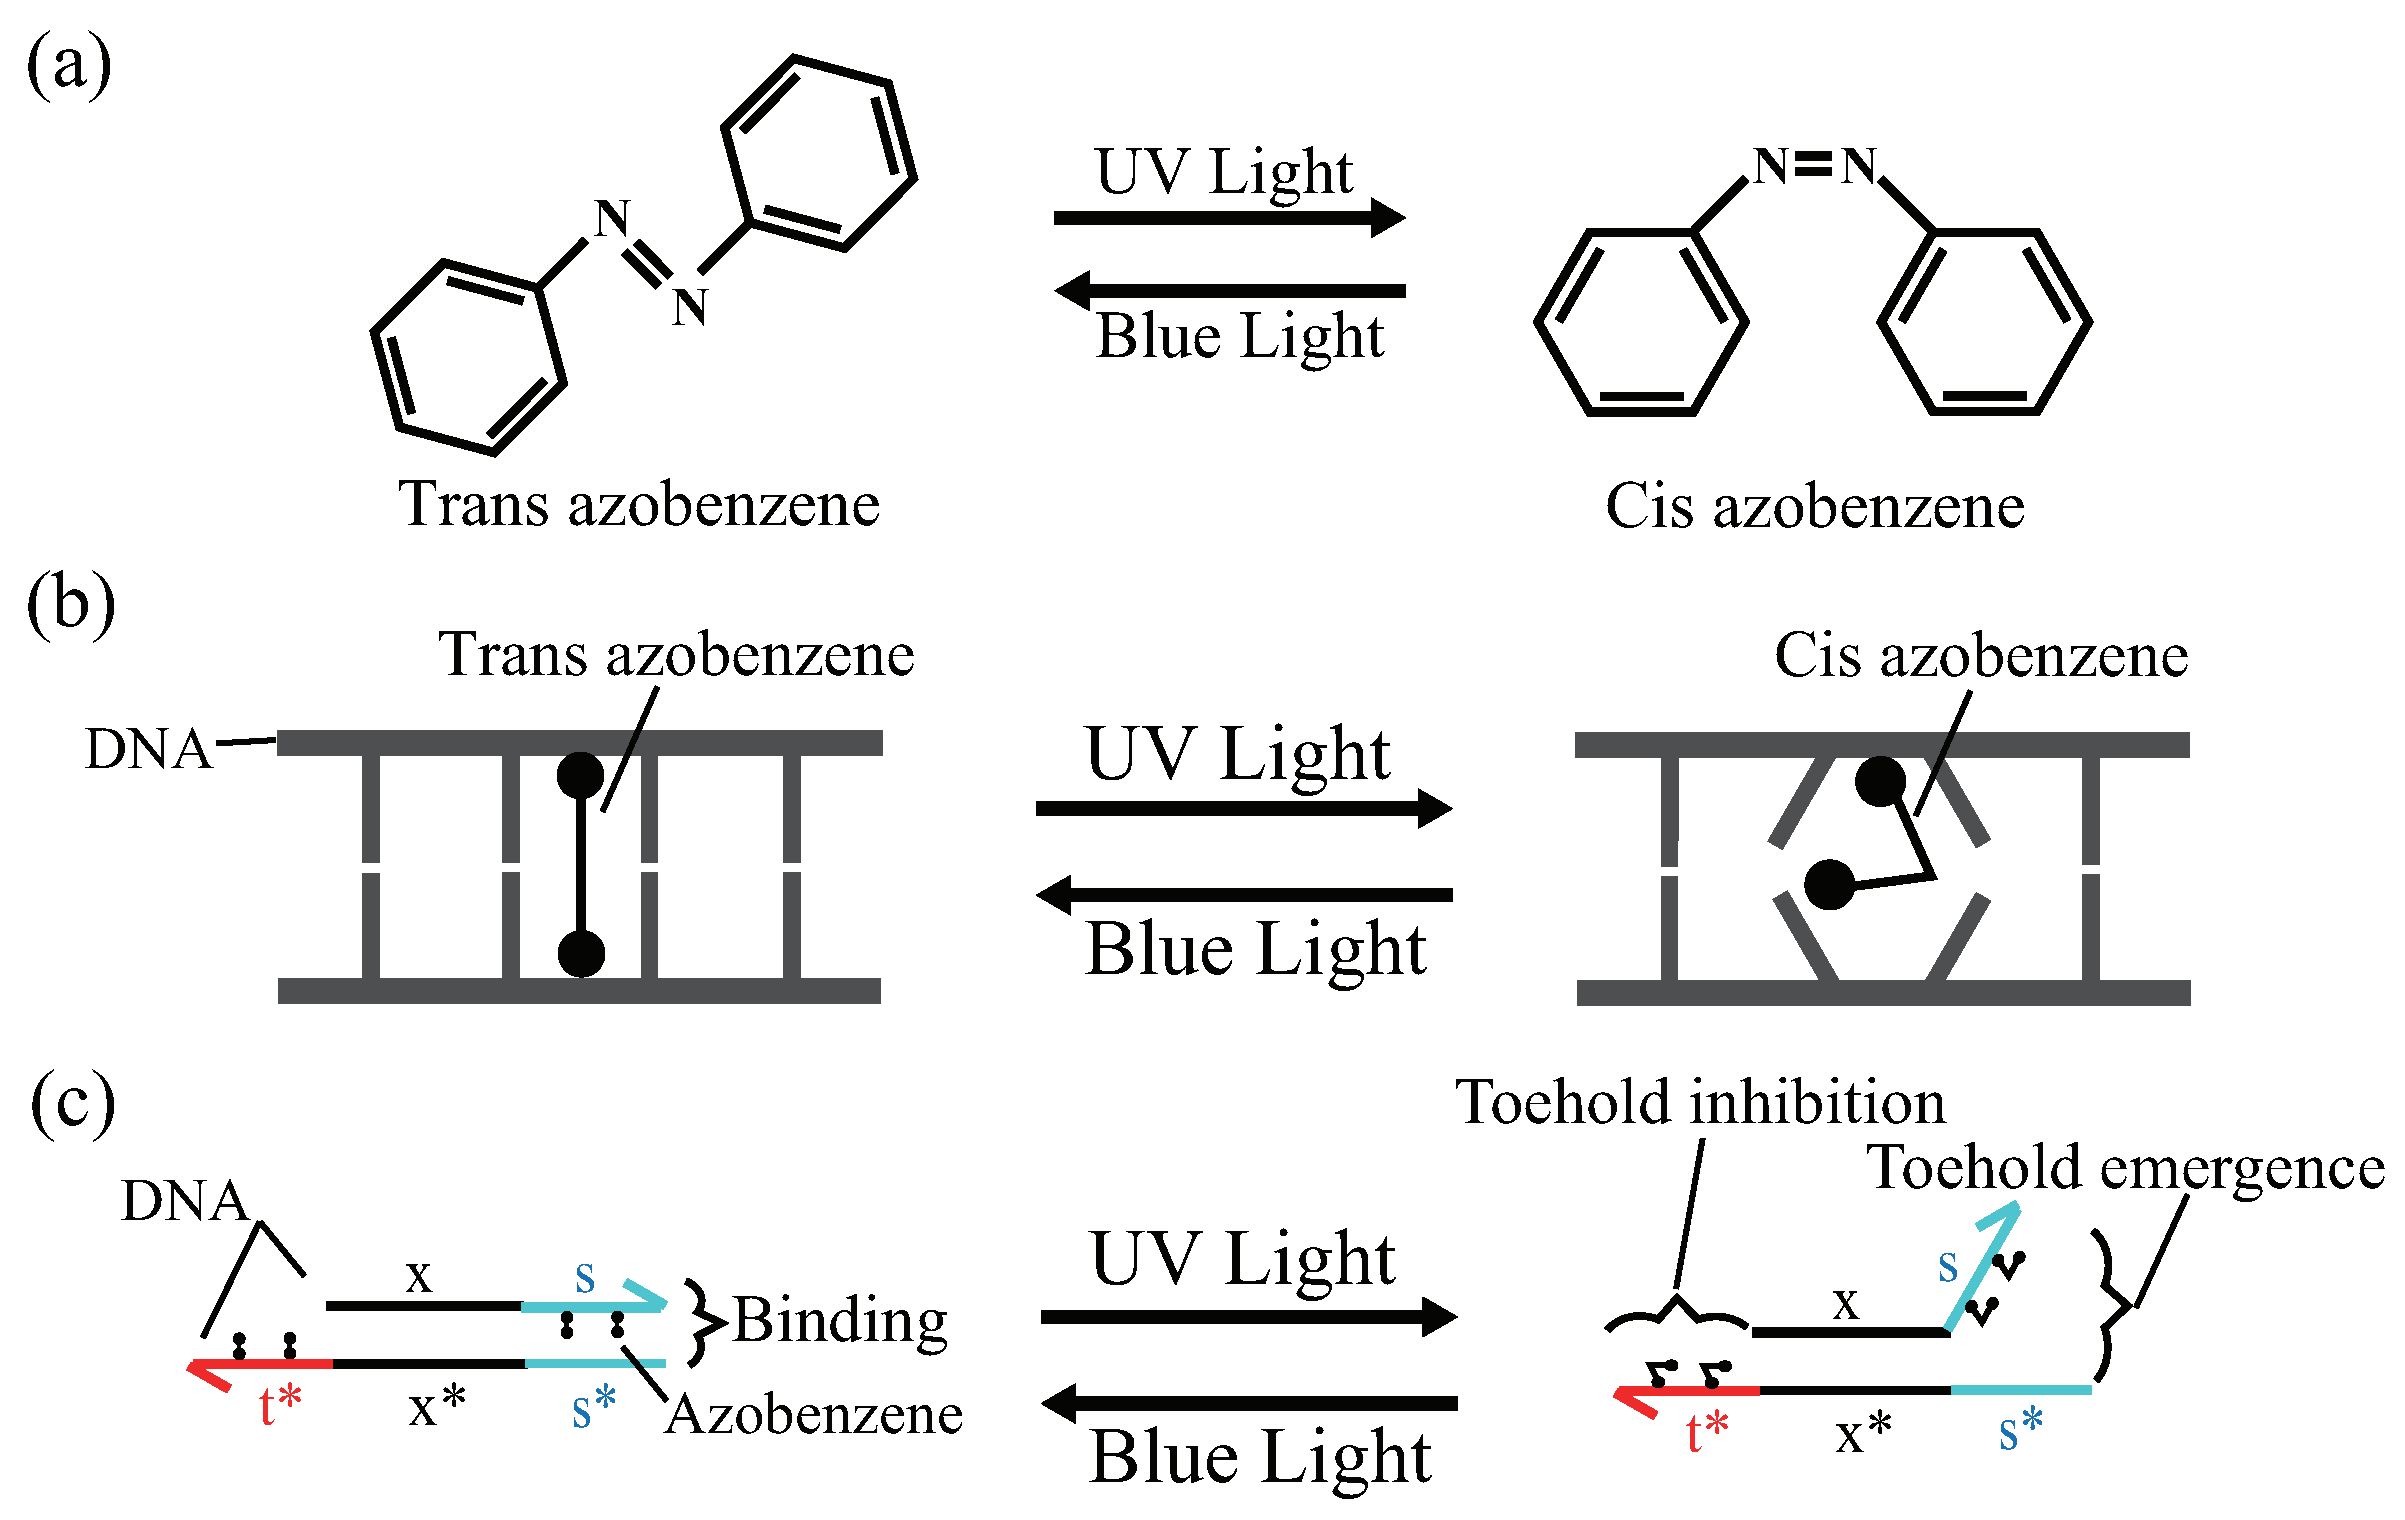
5.1. Photoisomerization of Azobenzene
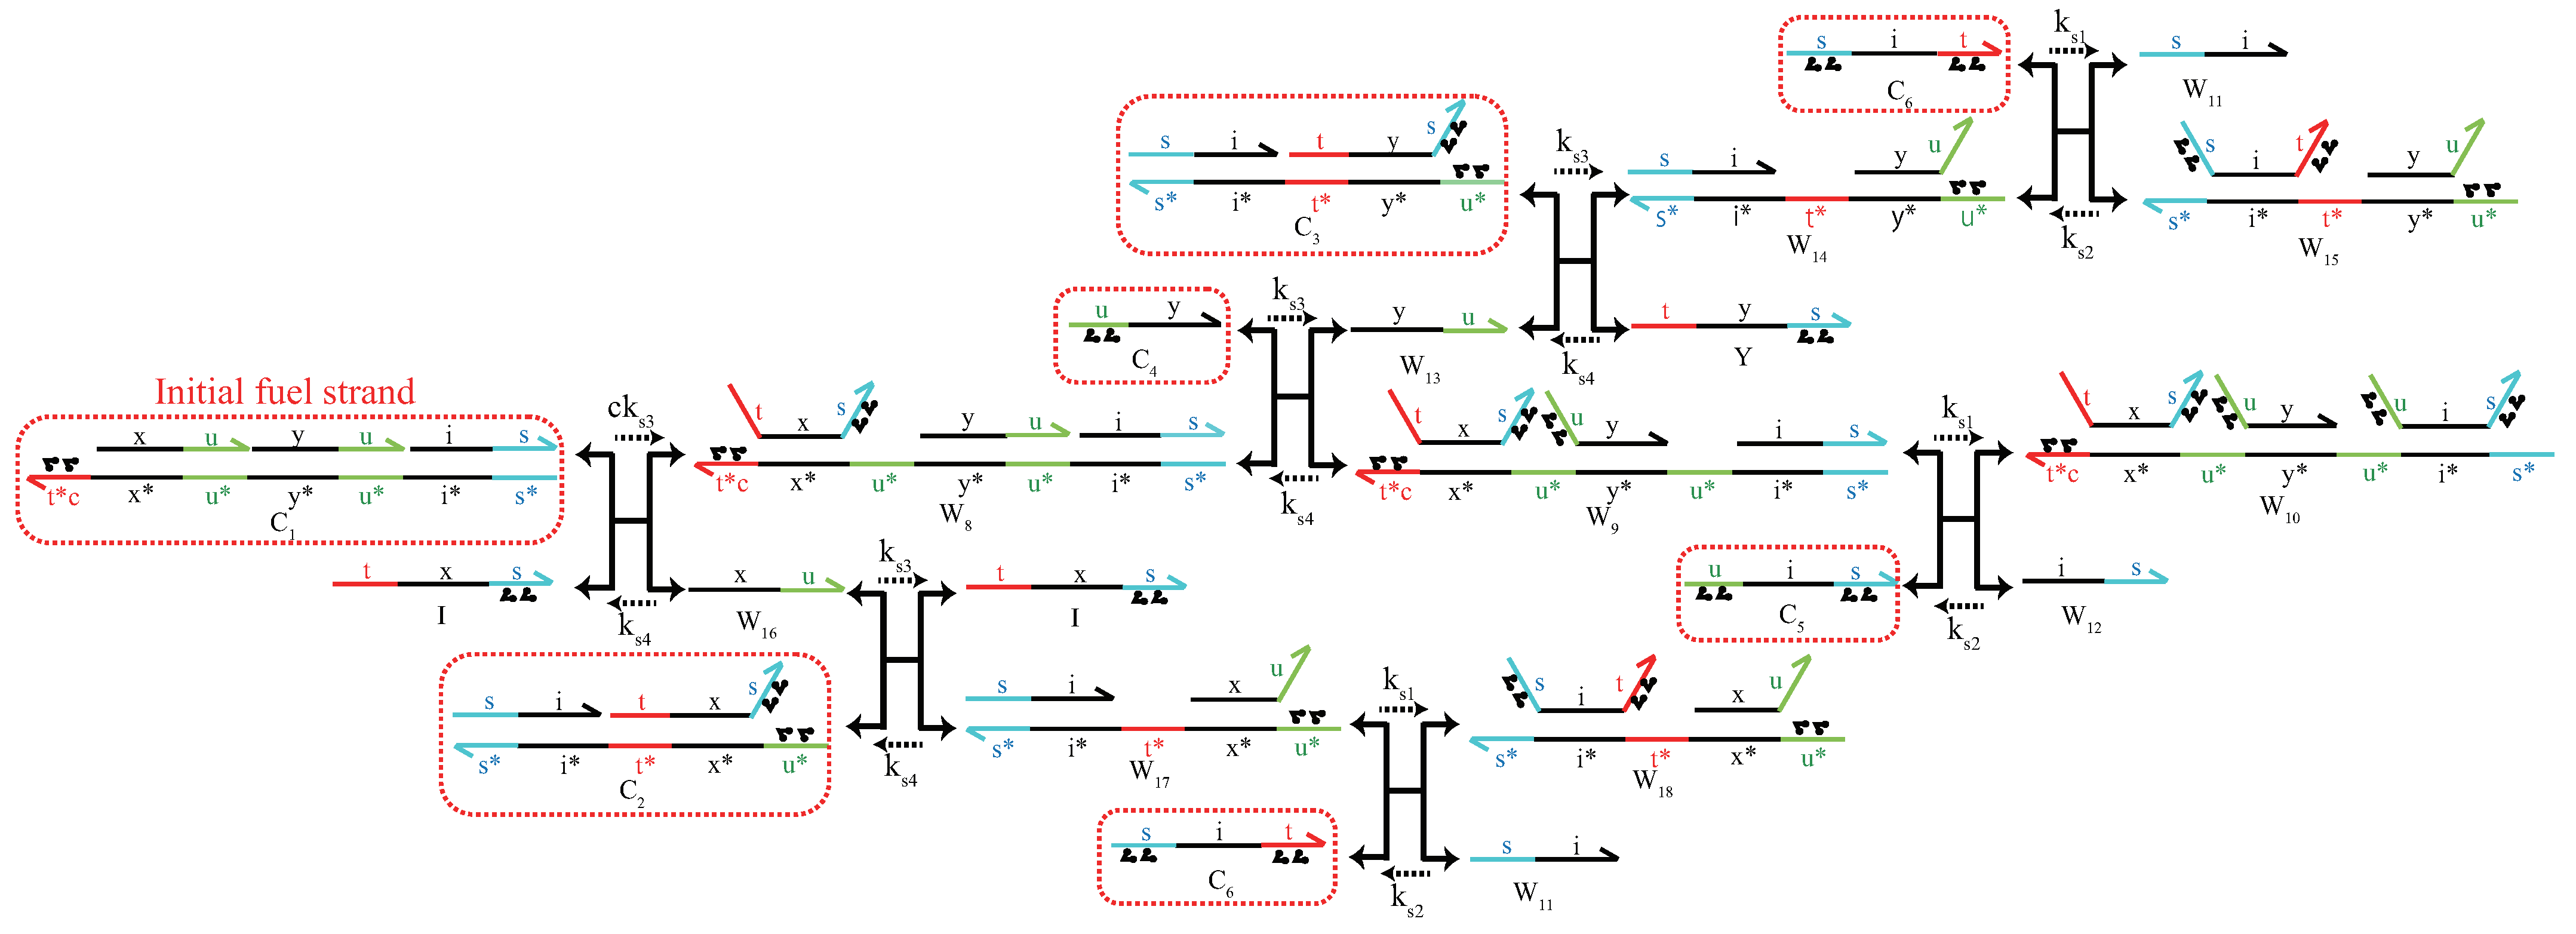
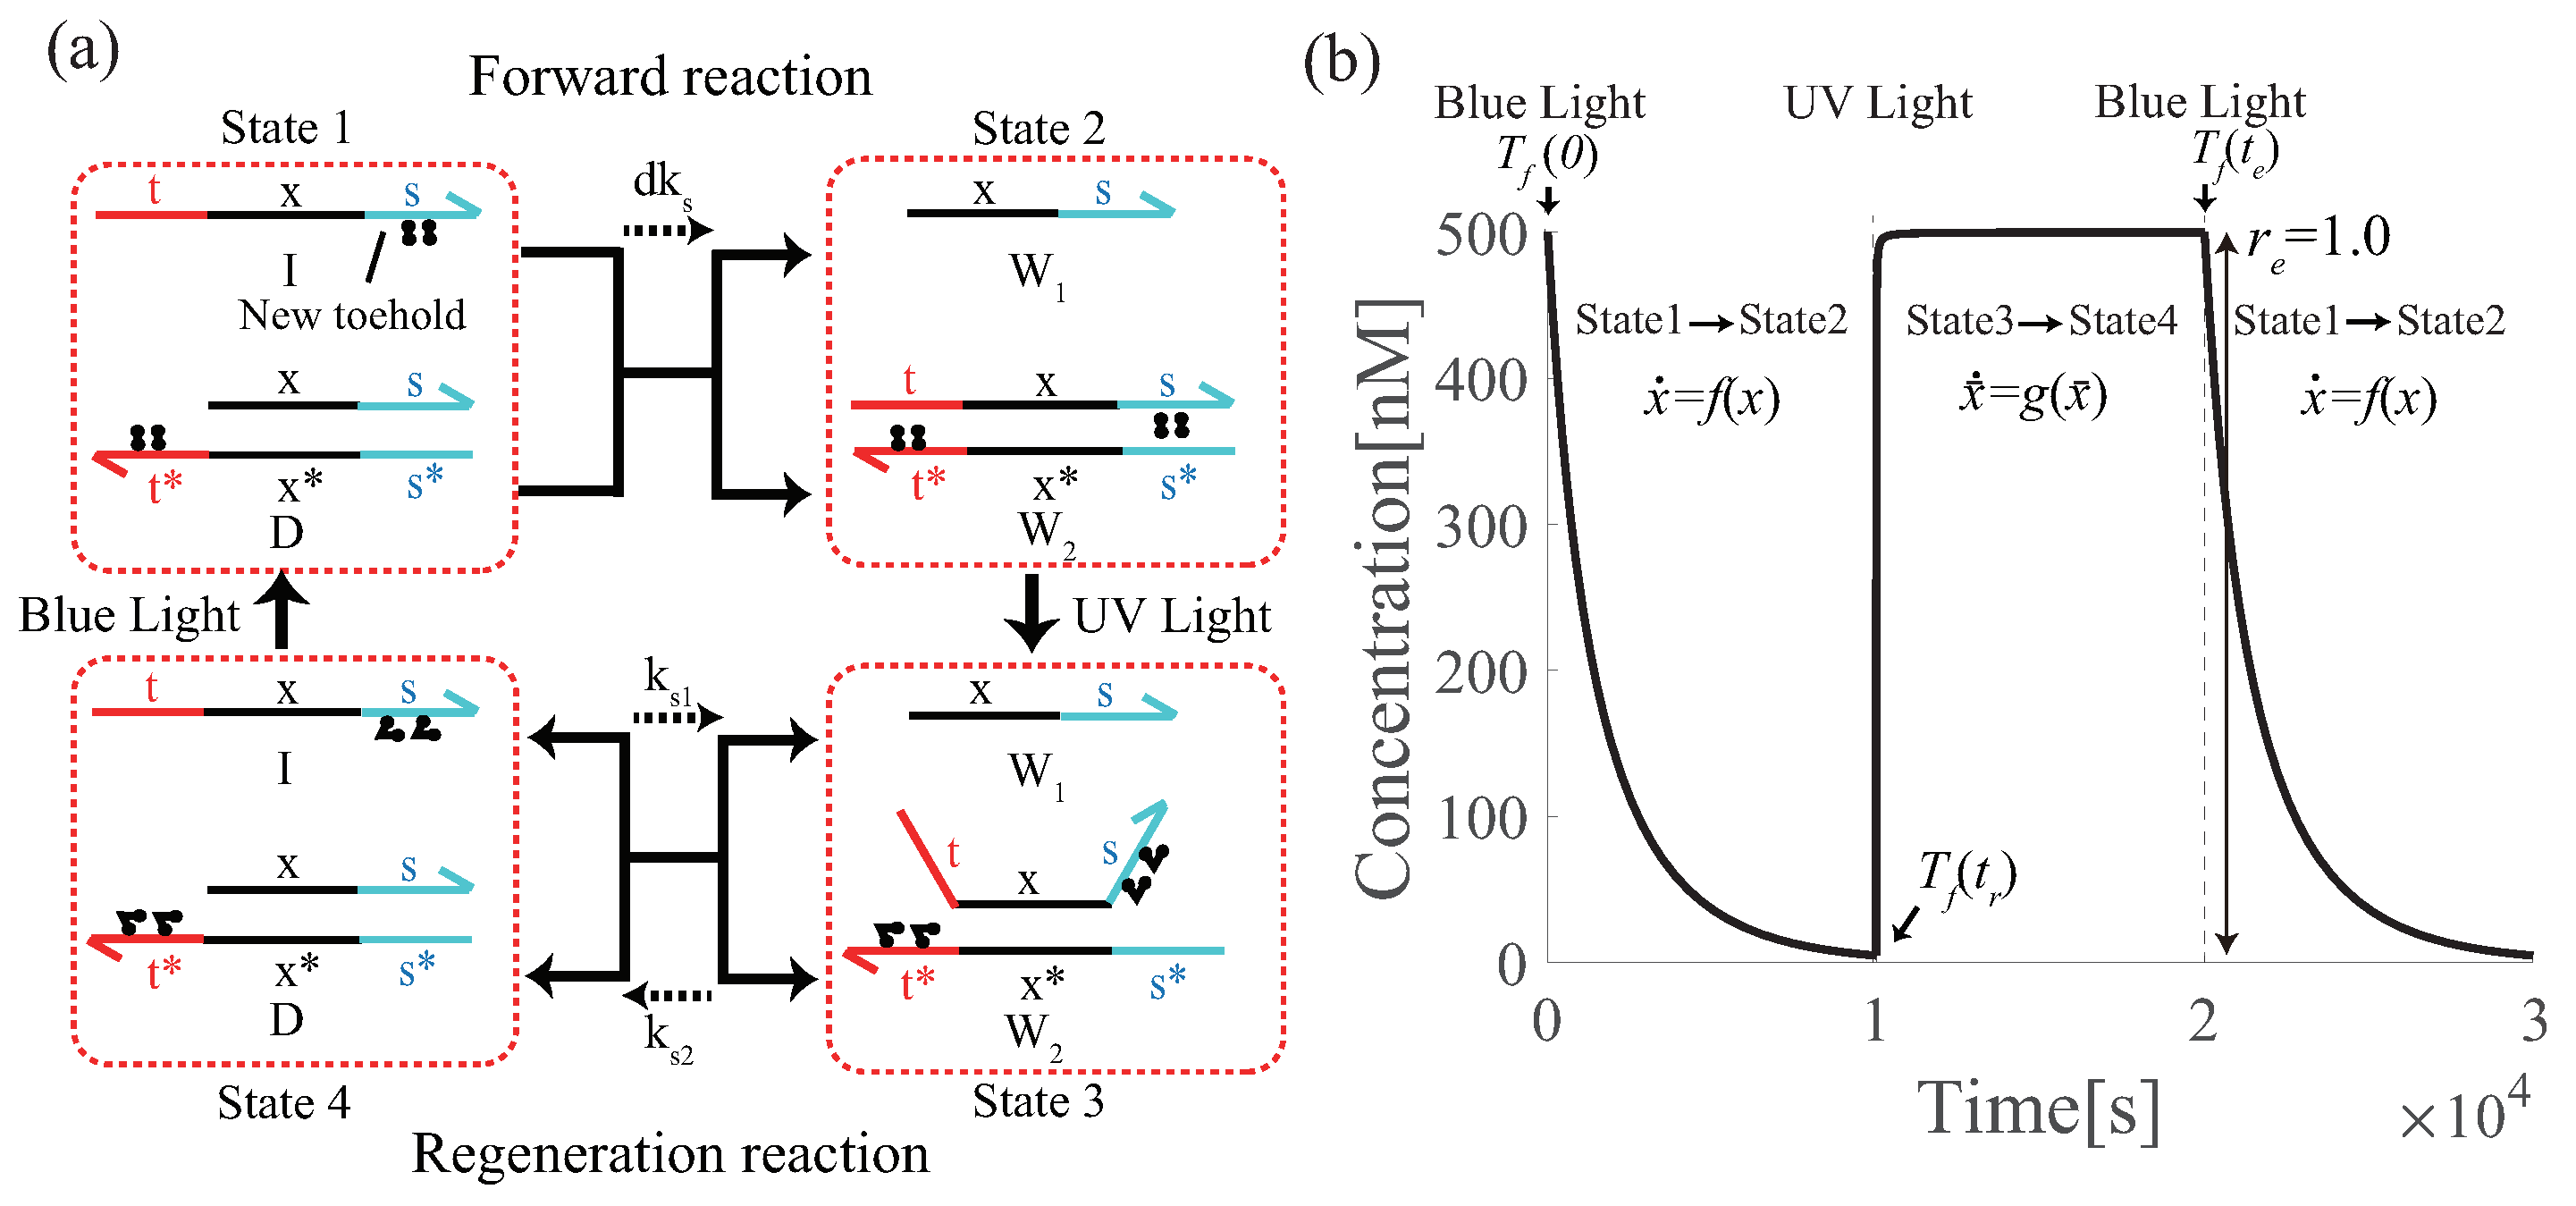
5.2. Renewable Design of Three Basic Circuits
6. Results & Discussions
6.1. Renewable Design of PI Controller
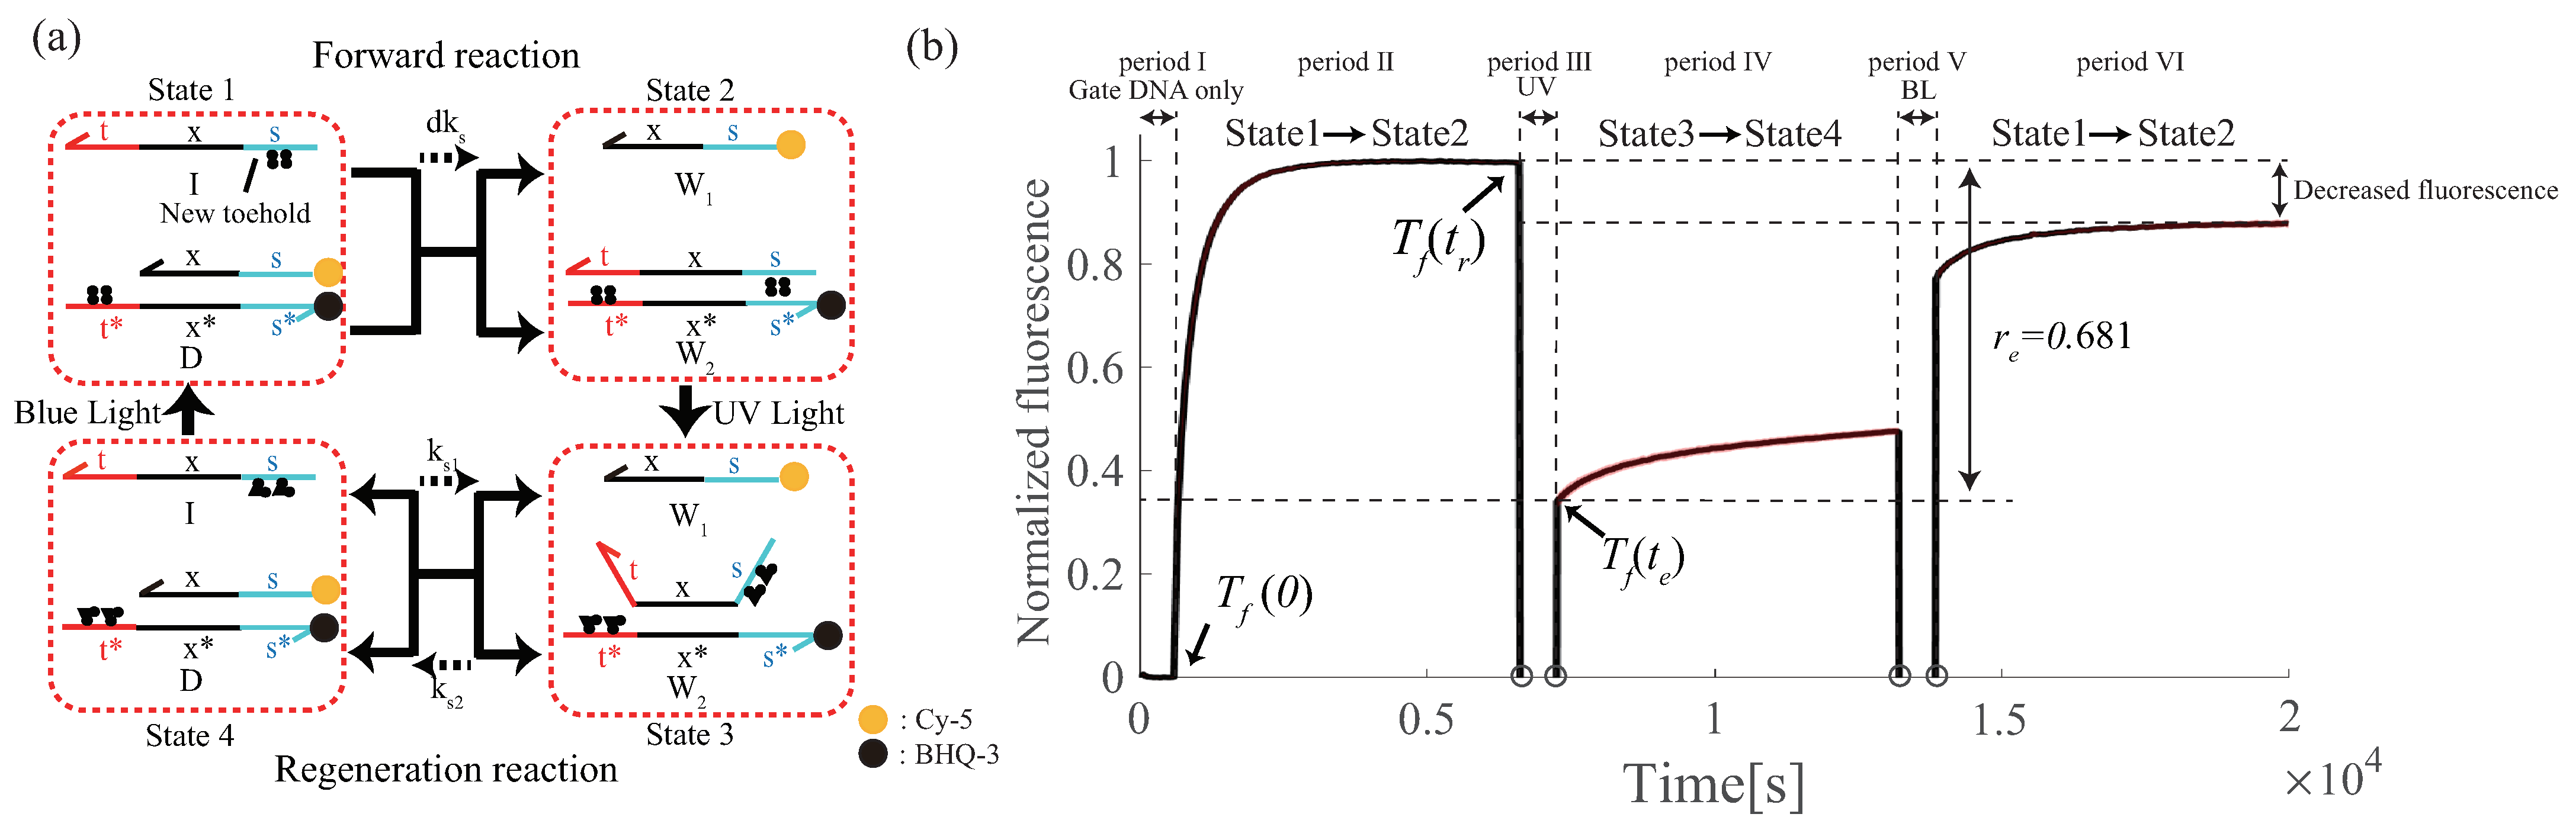
6.2. Effectiveness of Azobenzene
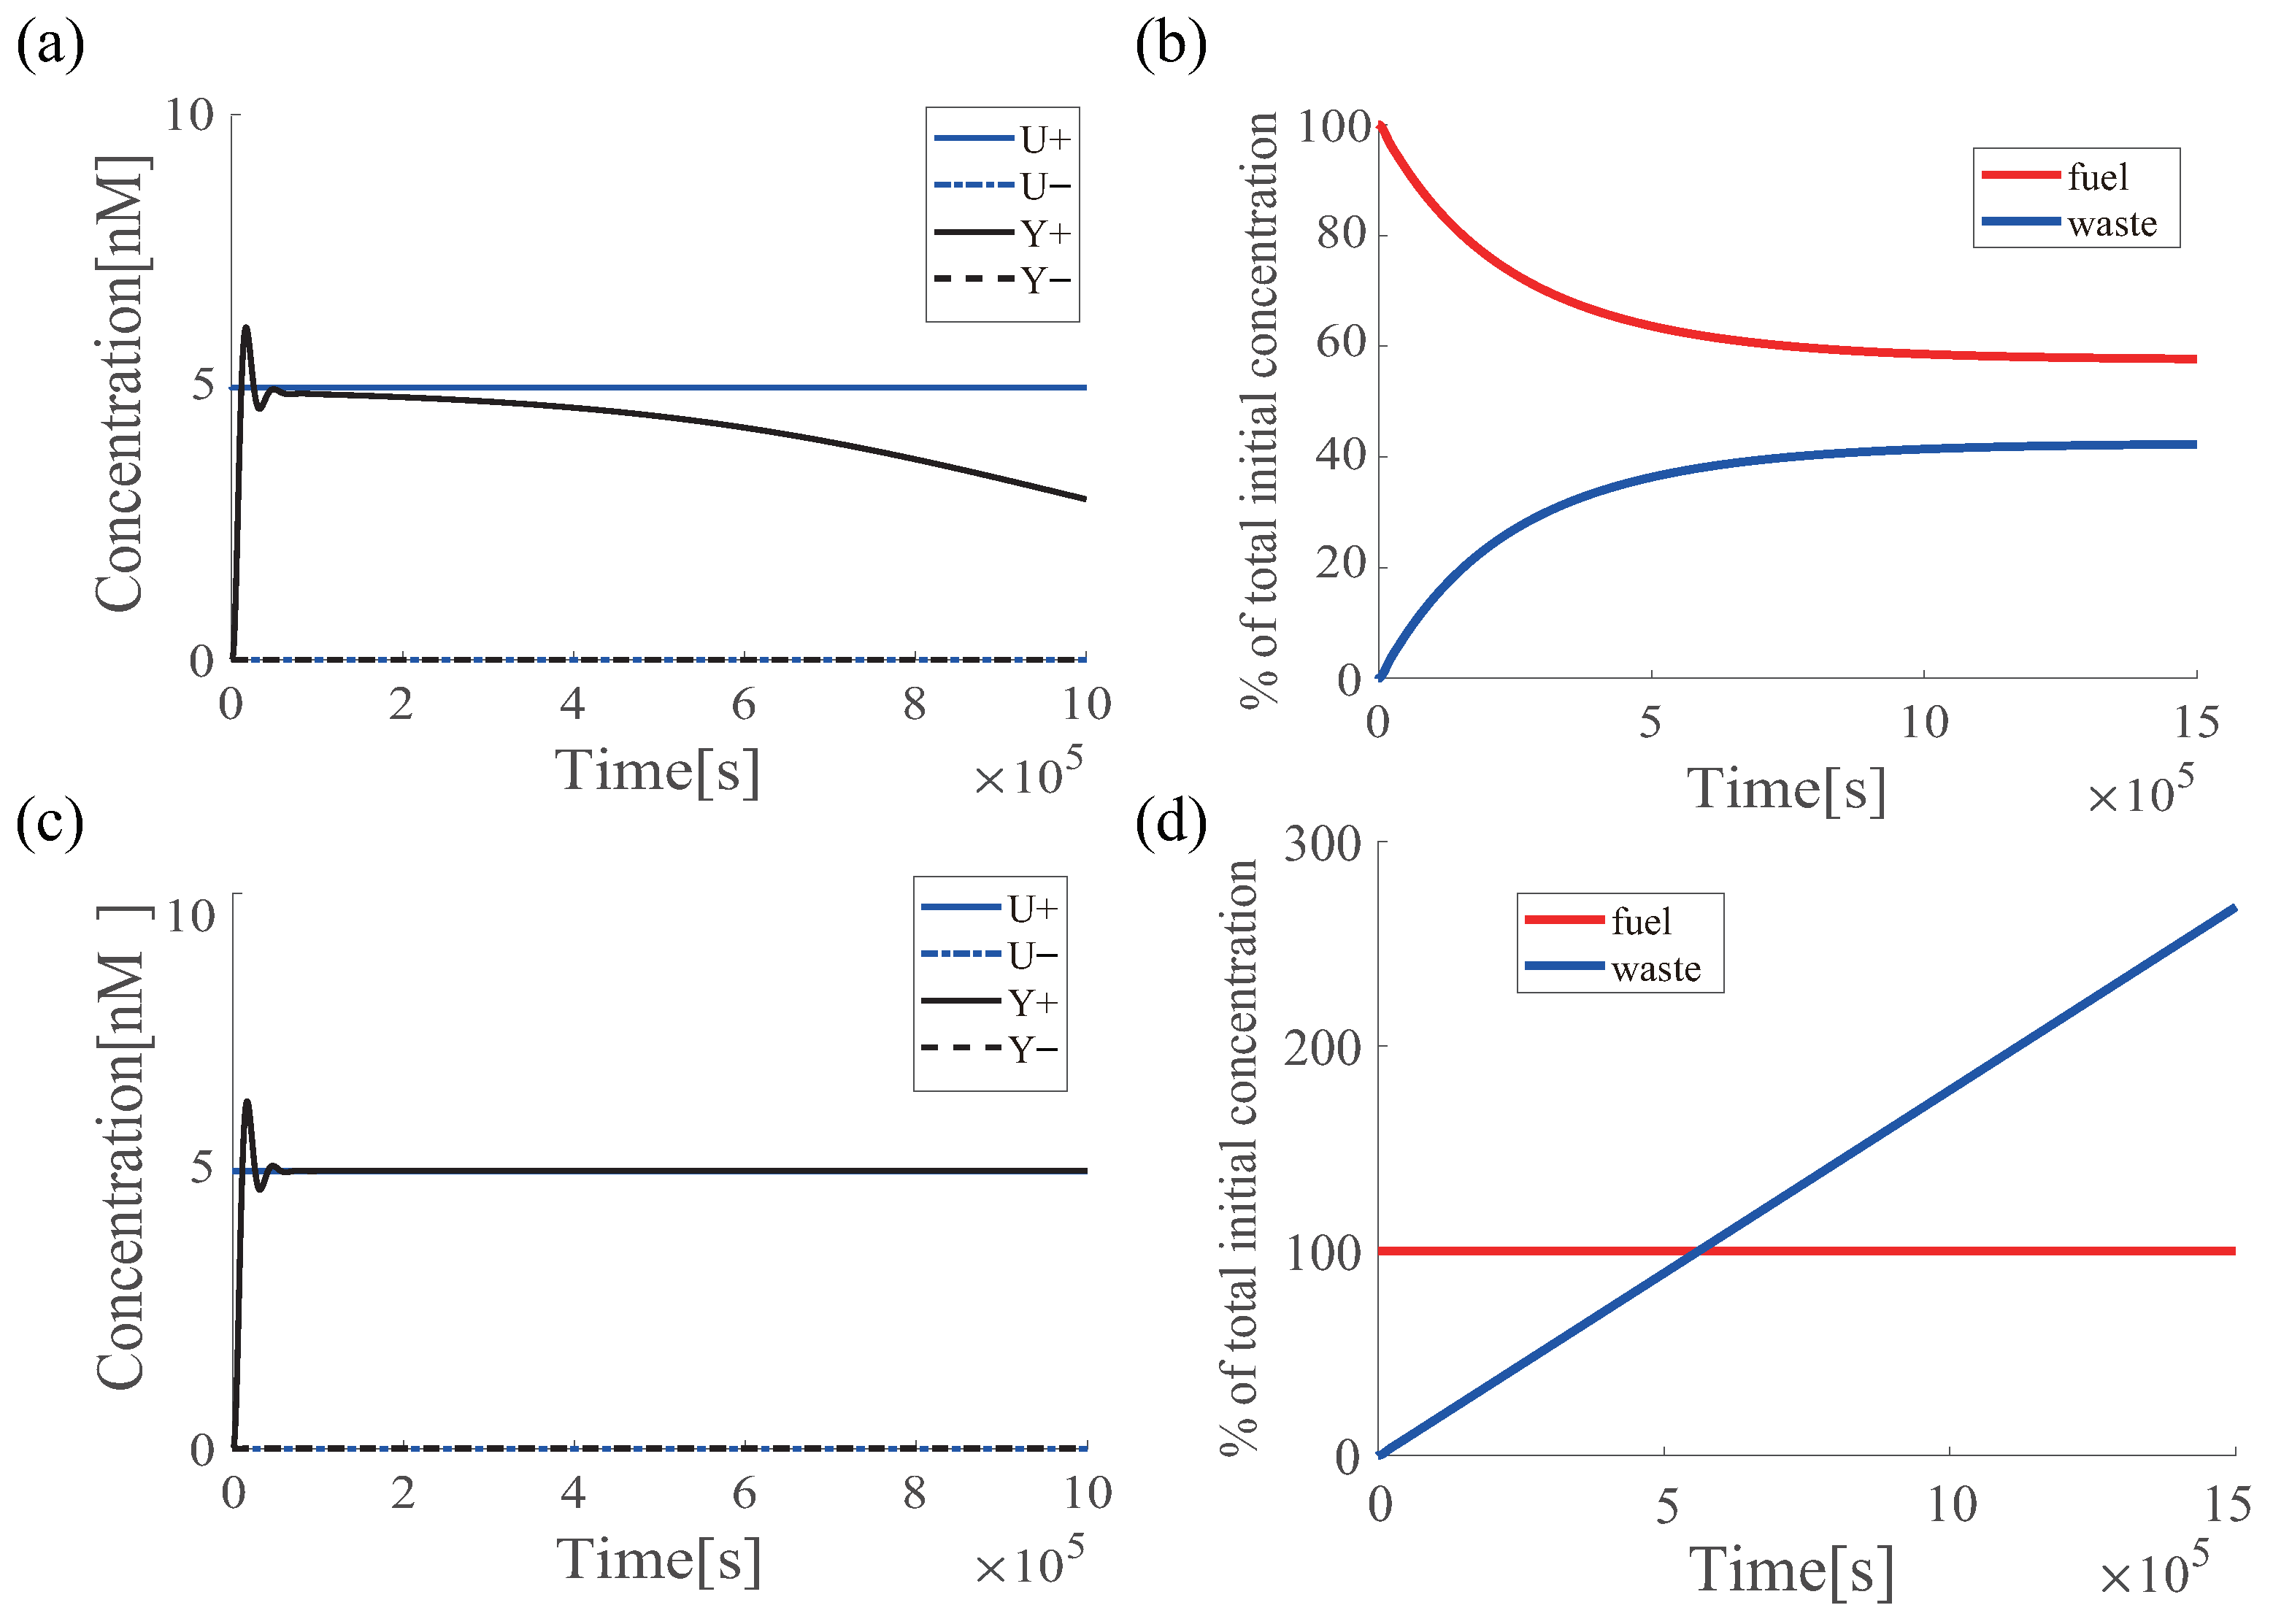
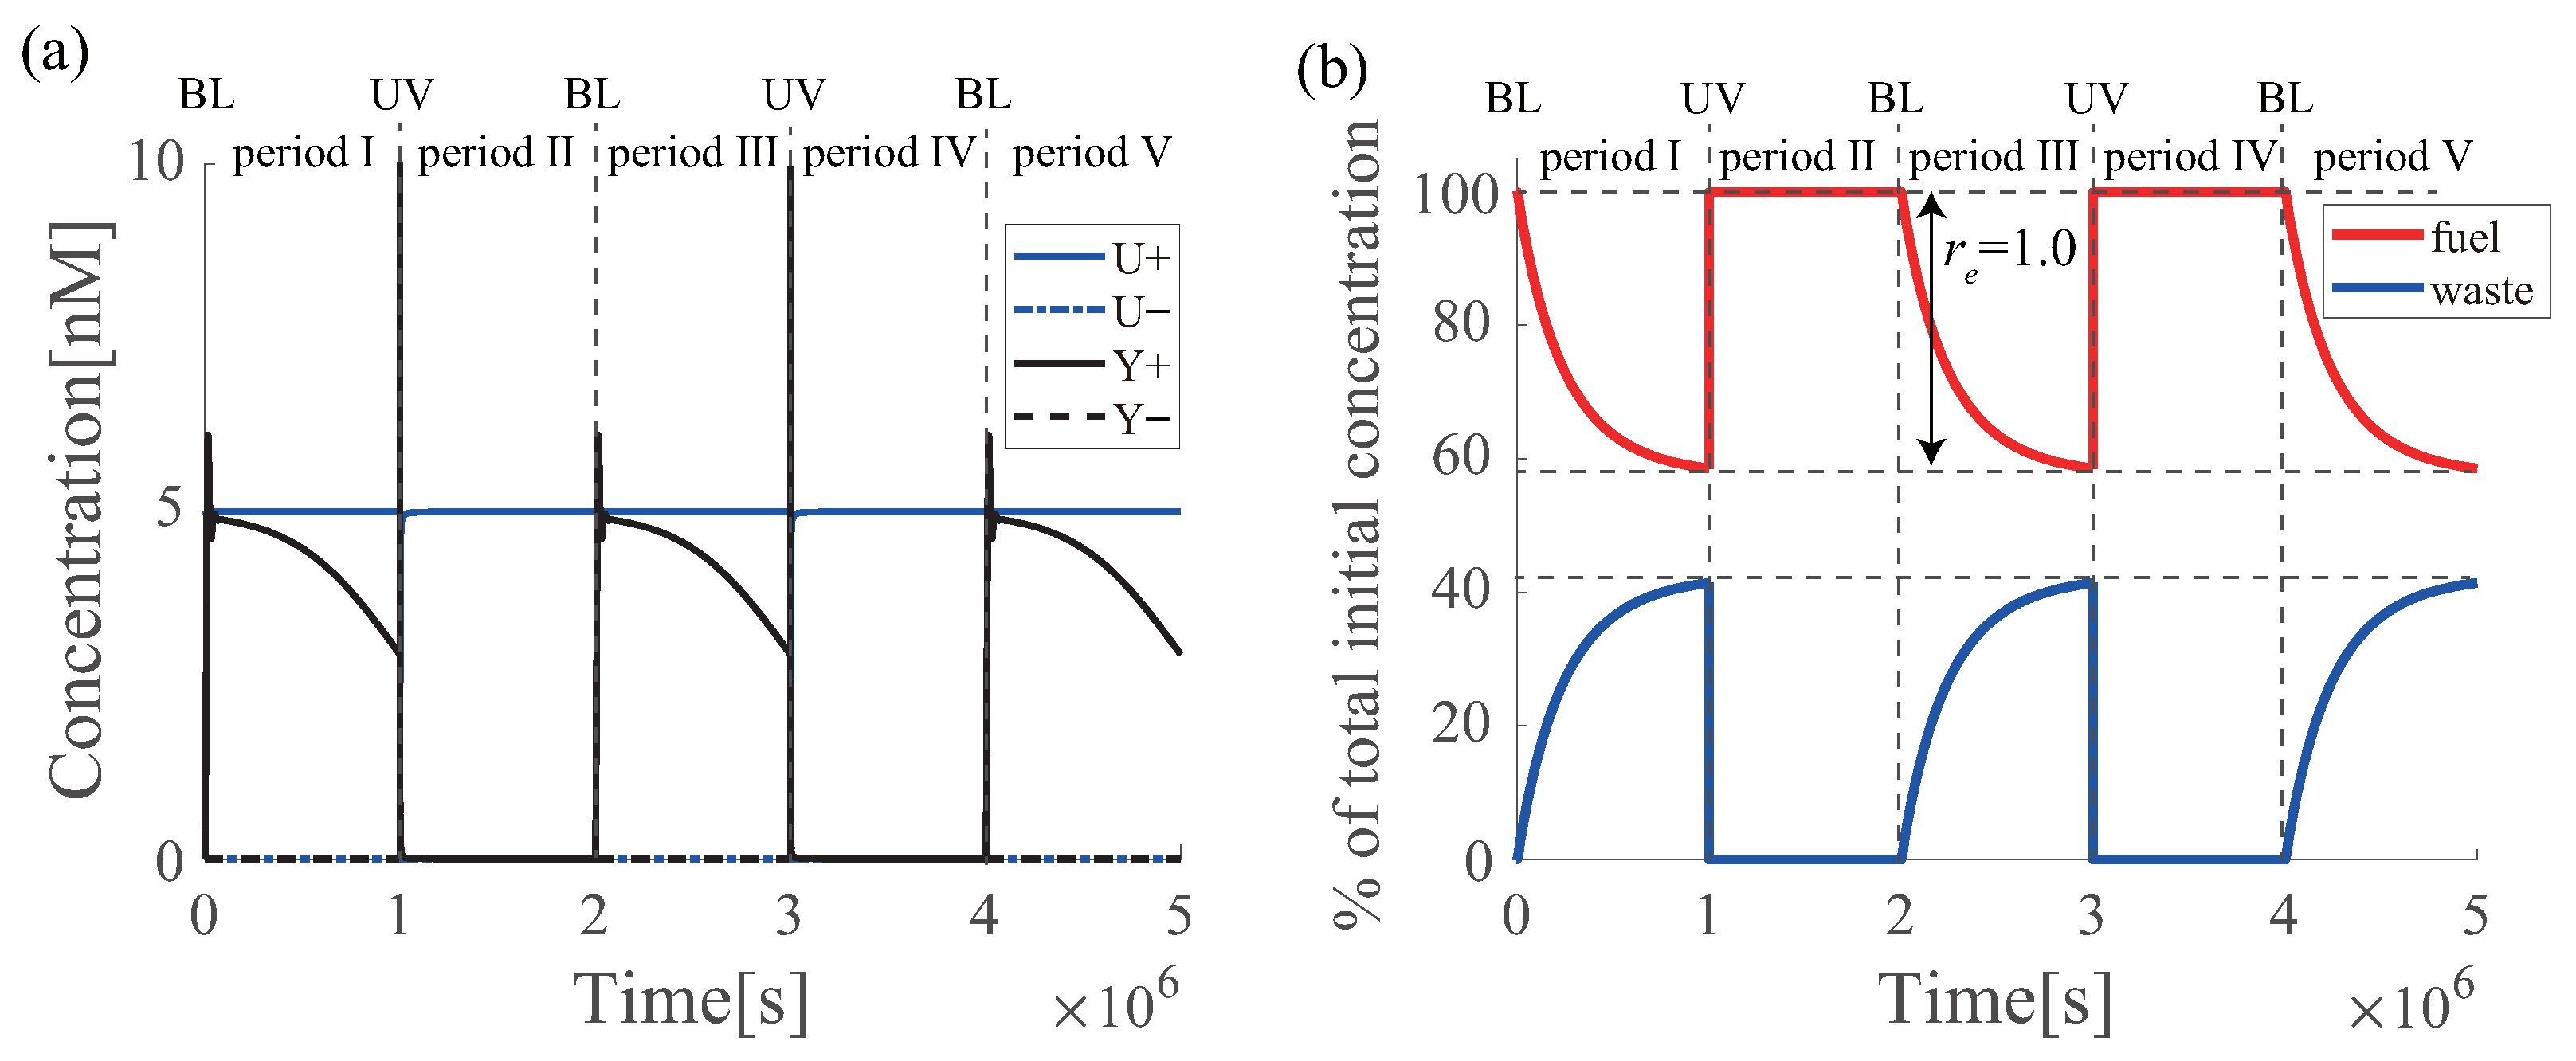
6.3. Proof-of-Principle of Renewable Design
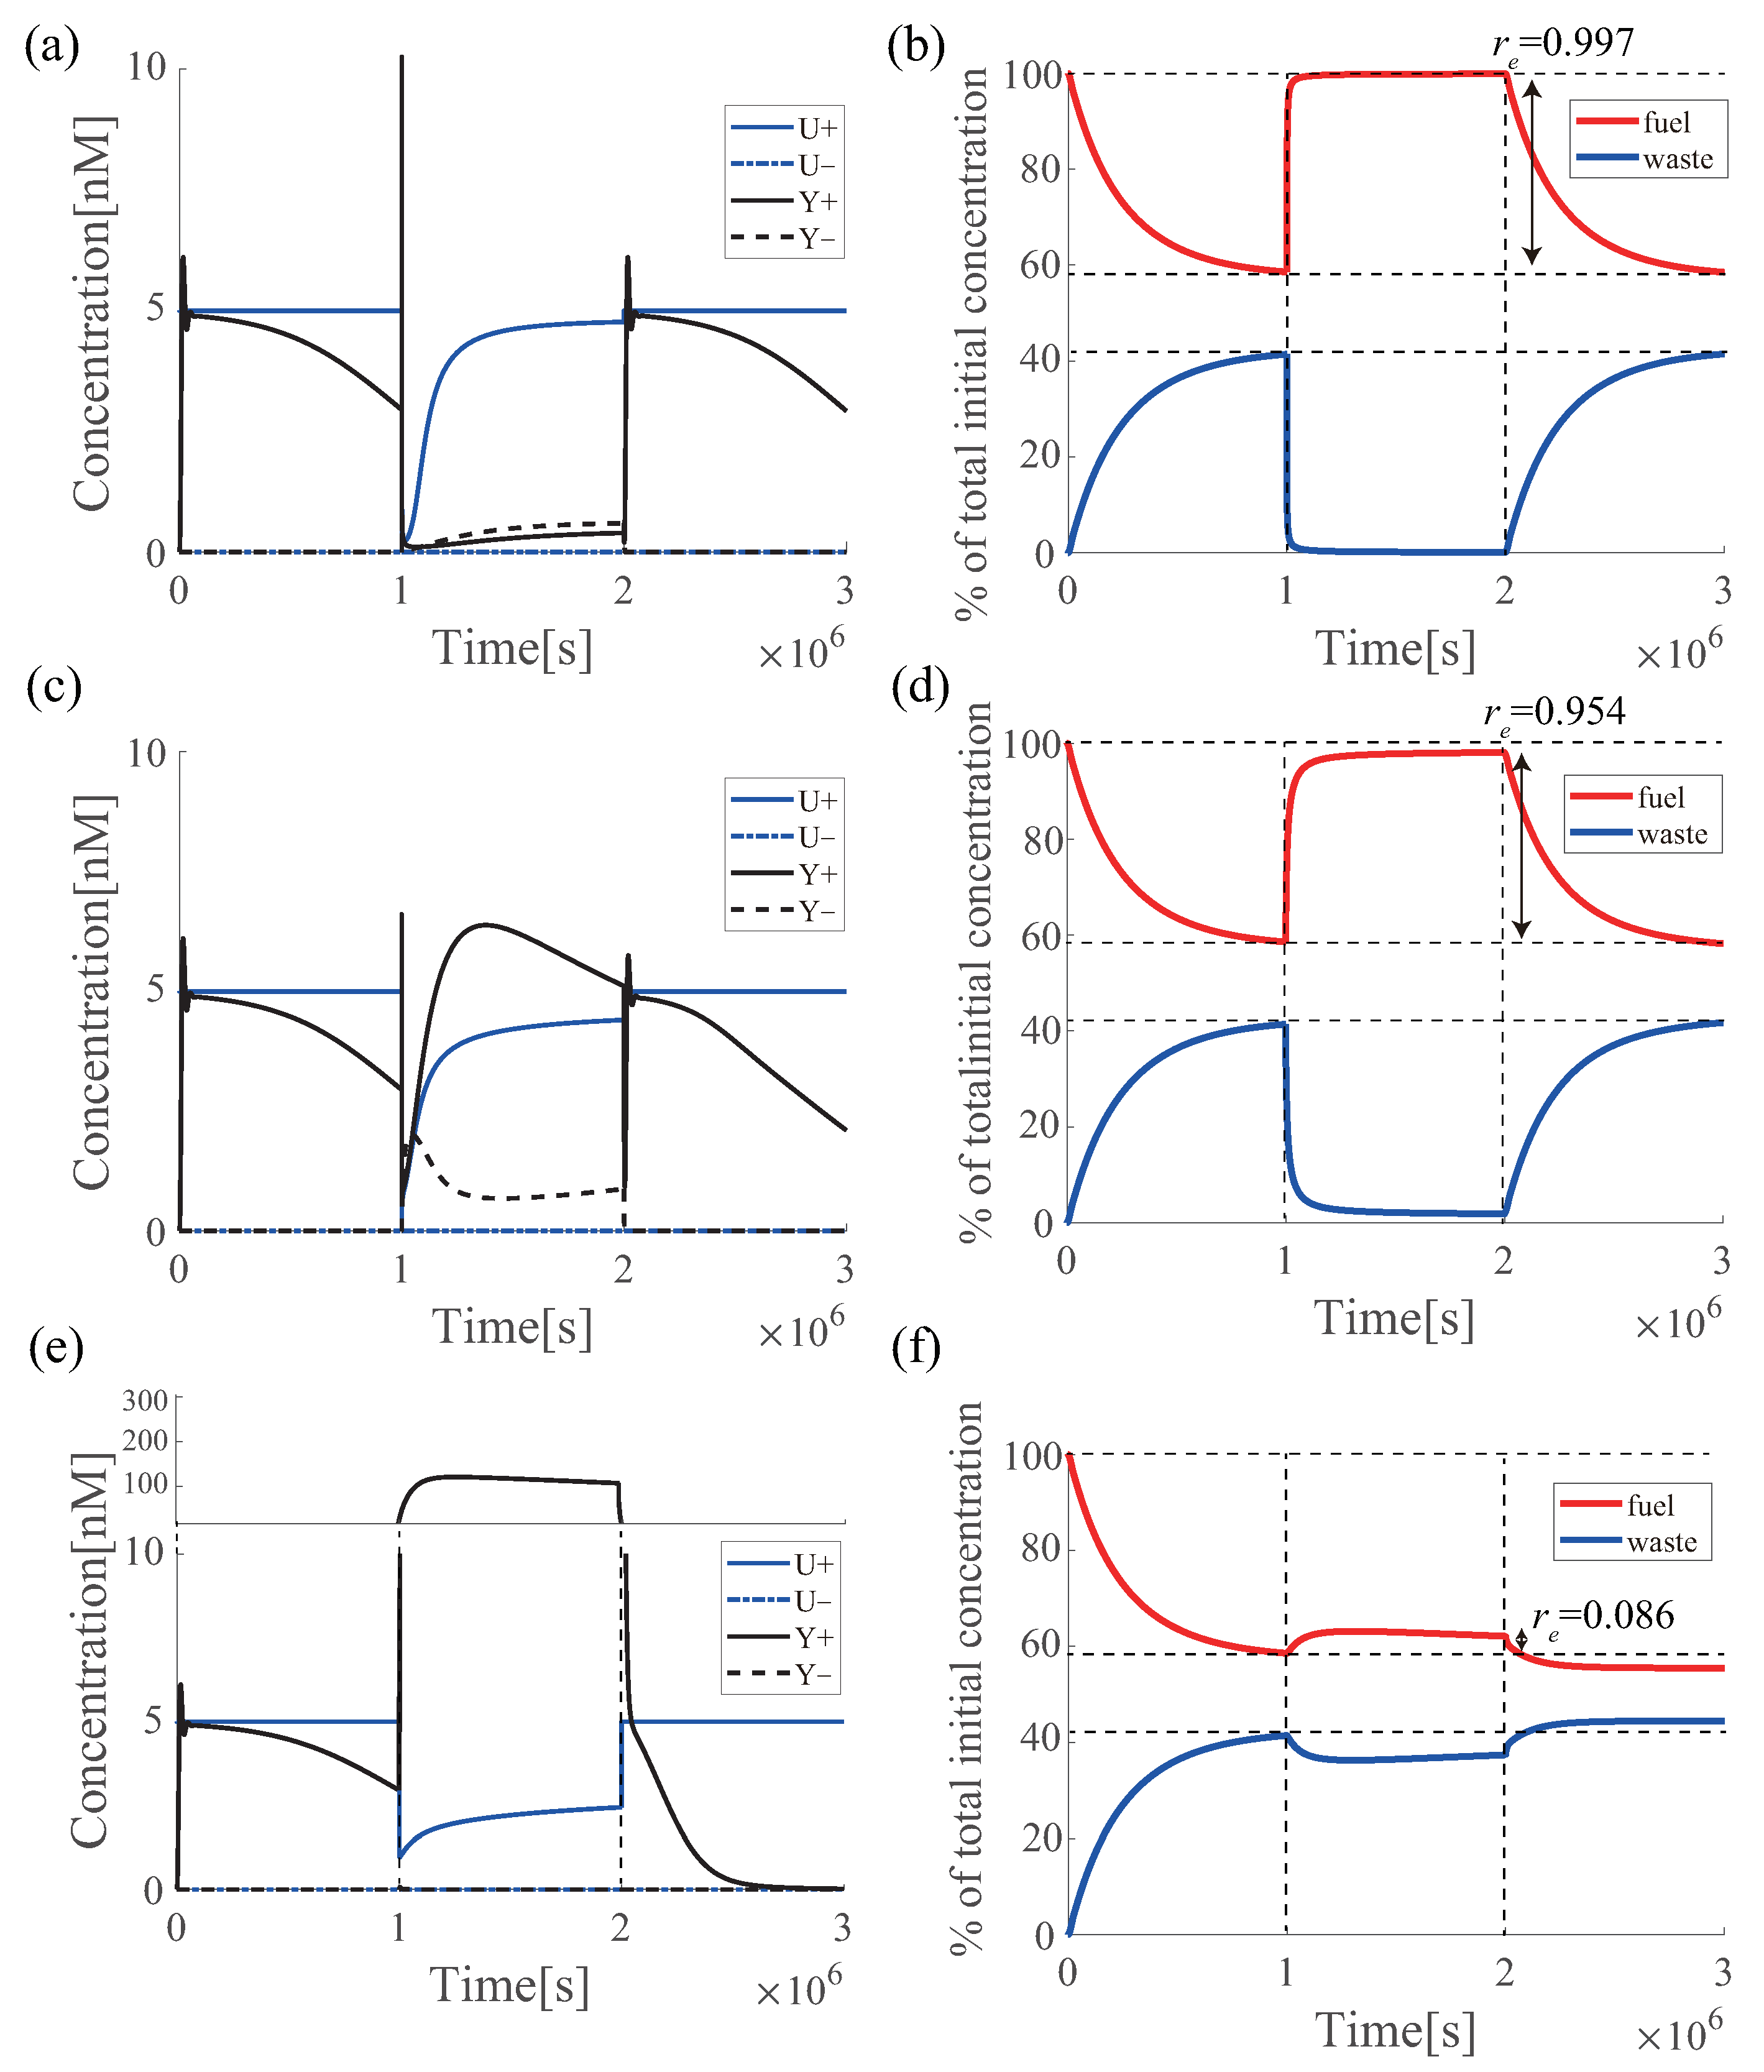
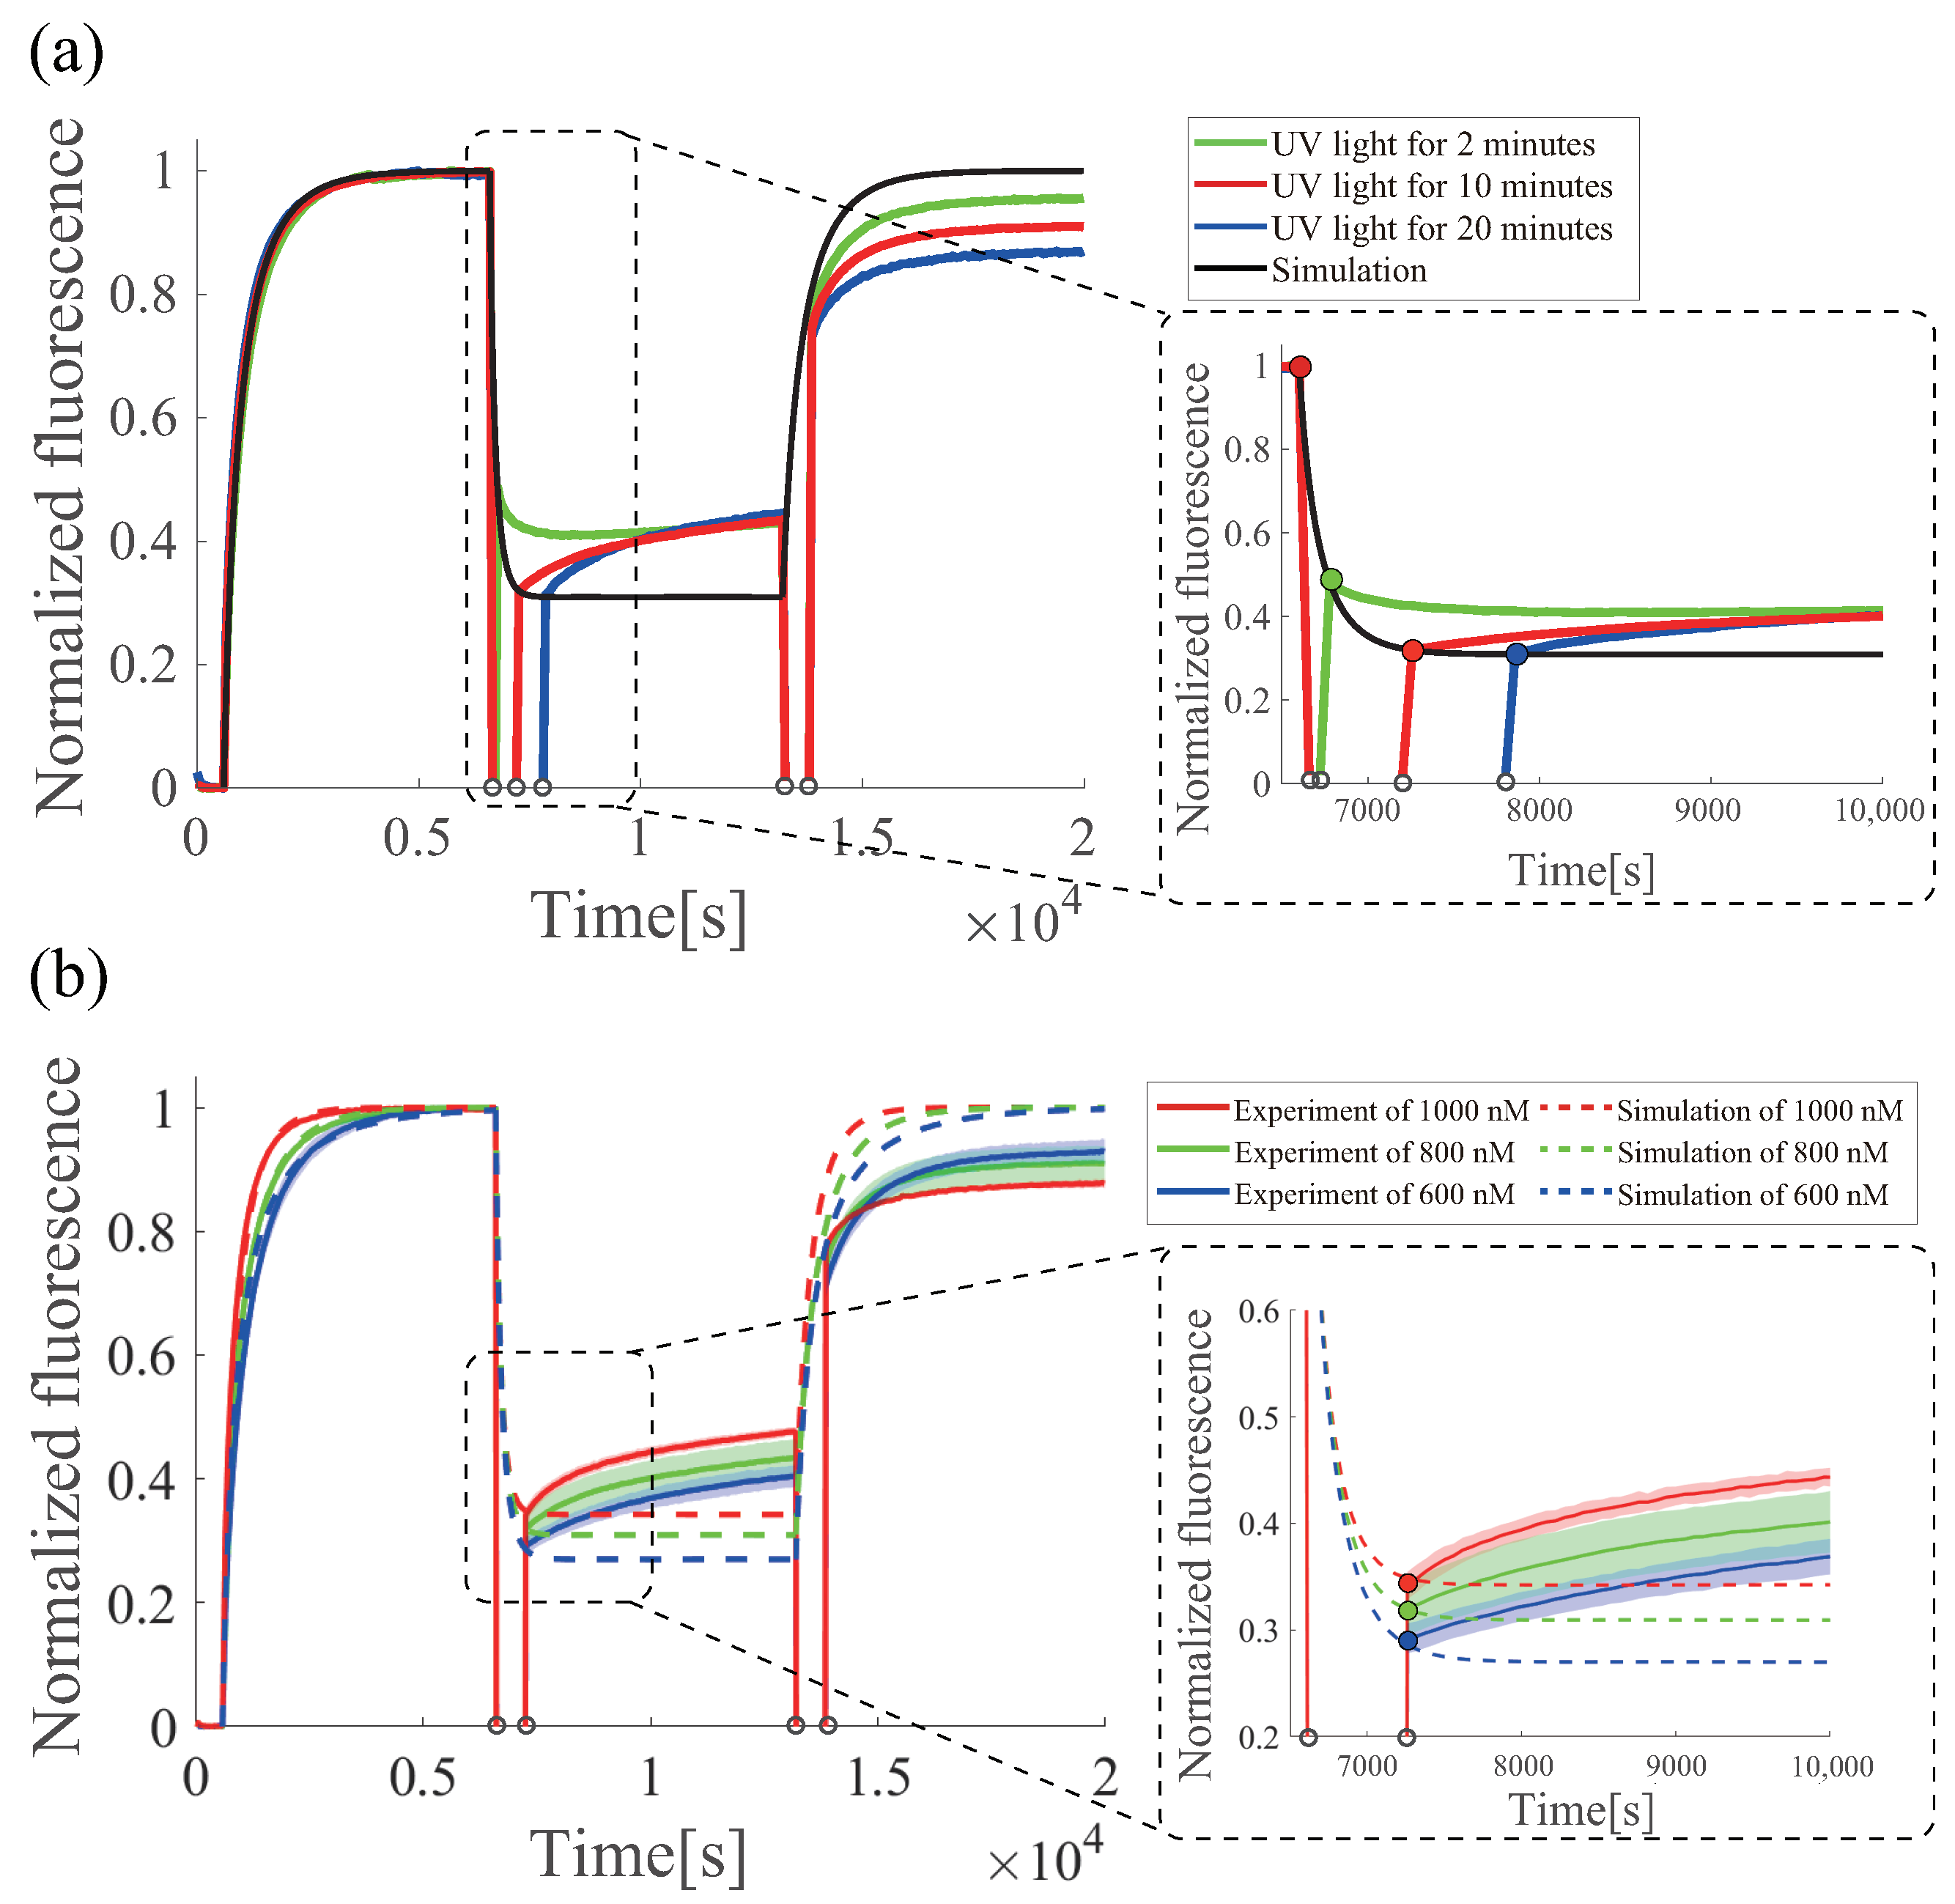
6.4. Estimation of the Effectiveness of Azobenzene under UV Irradiation
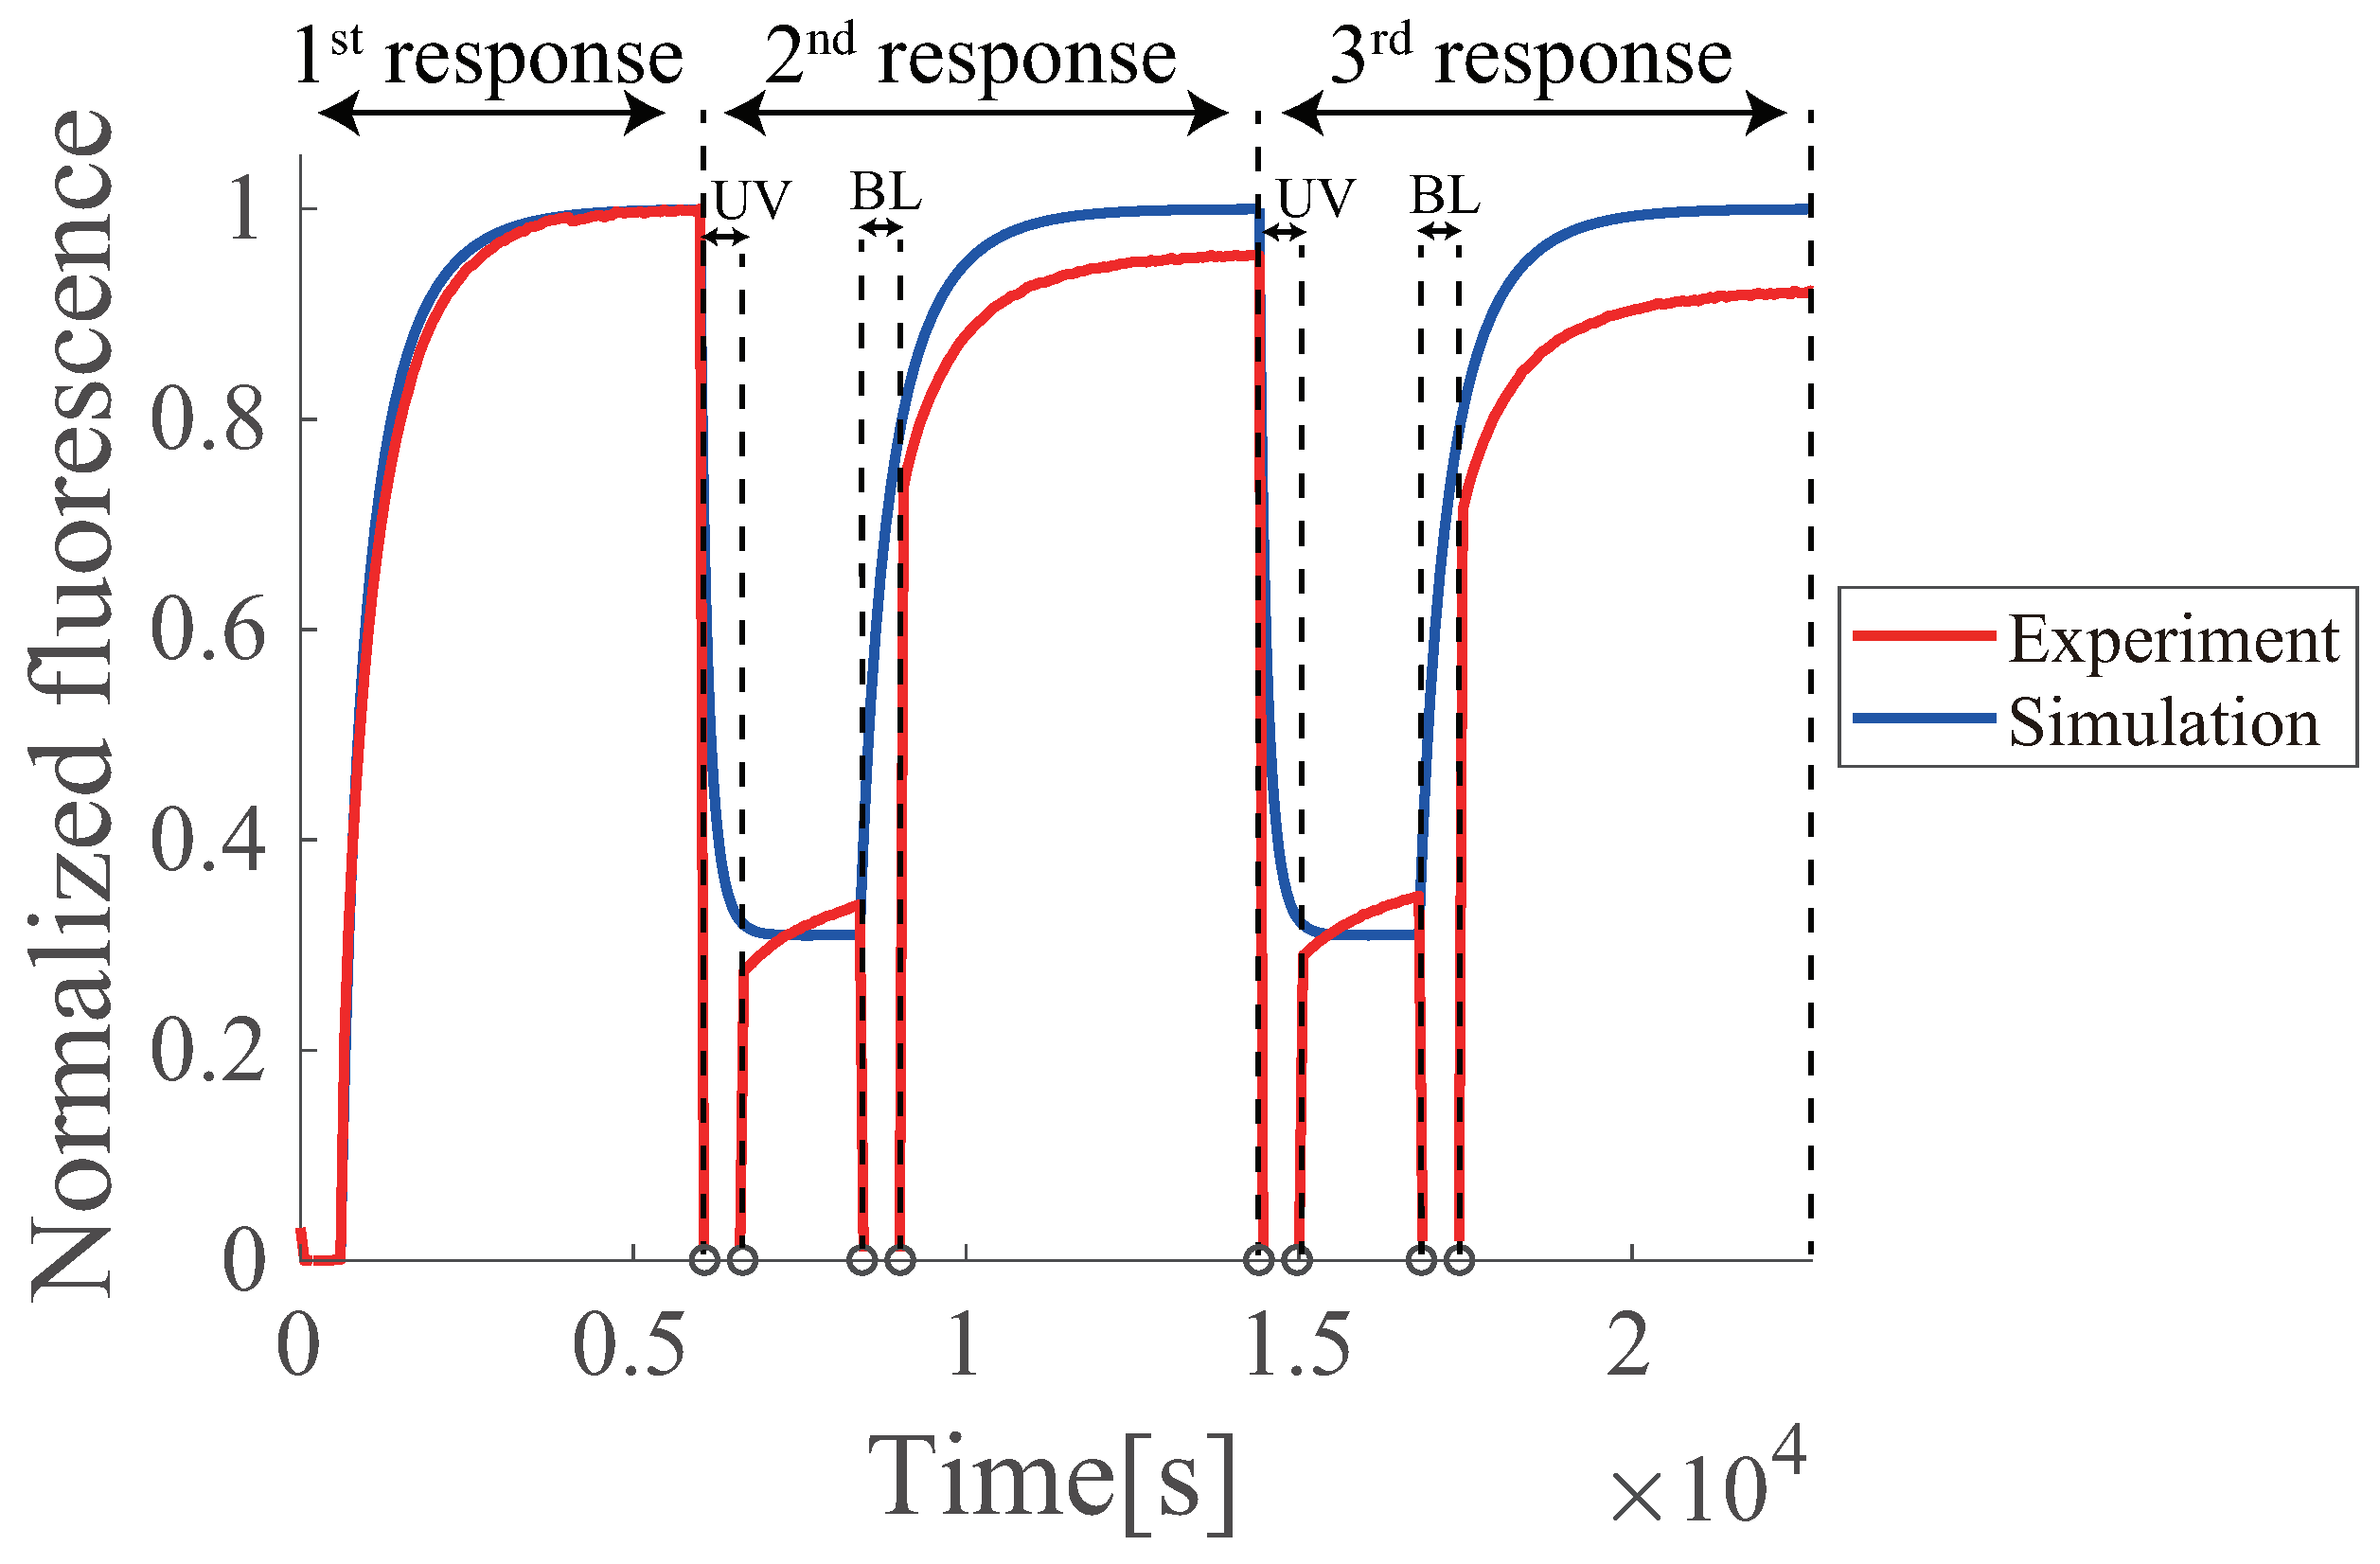
6.5. Multiple Regenerations of Azo-Degradation Circuit
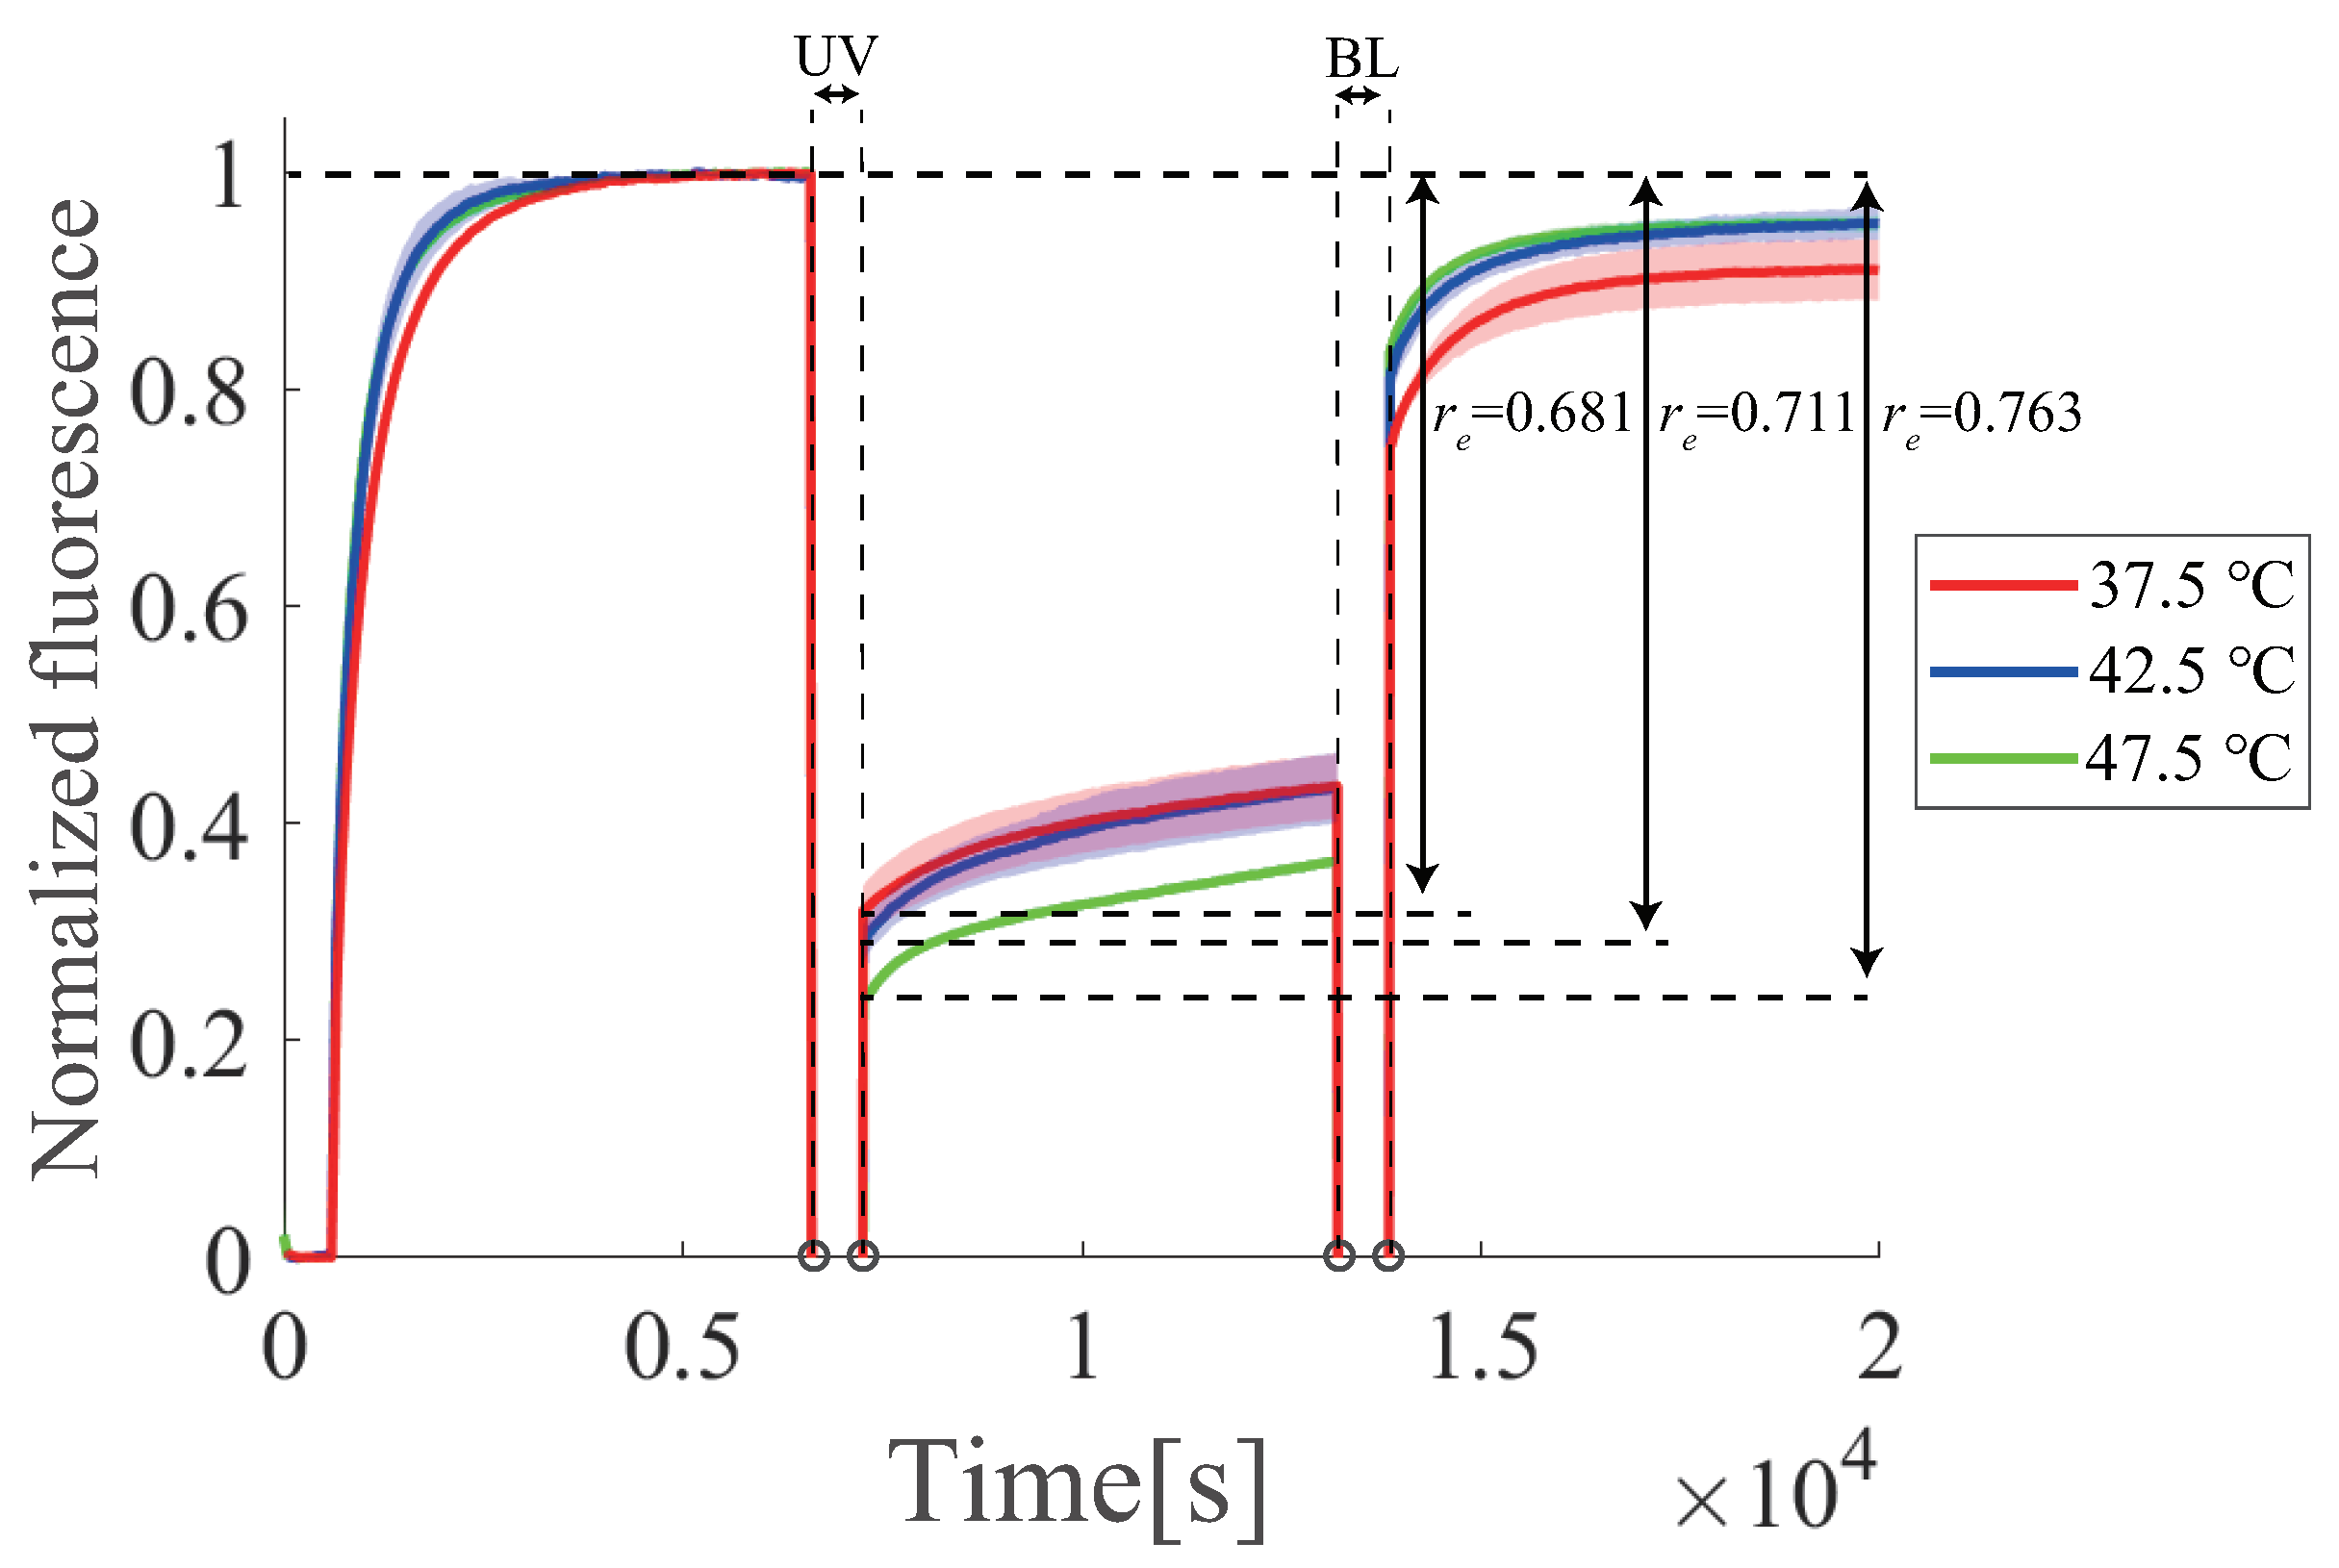
6.6. Temperature Dependence
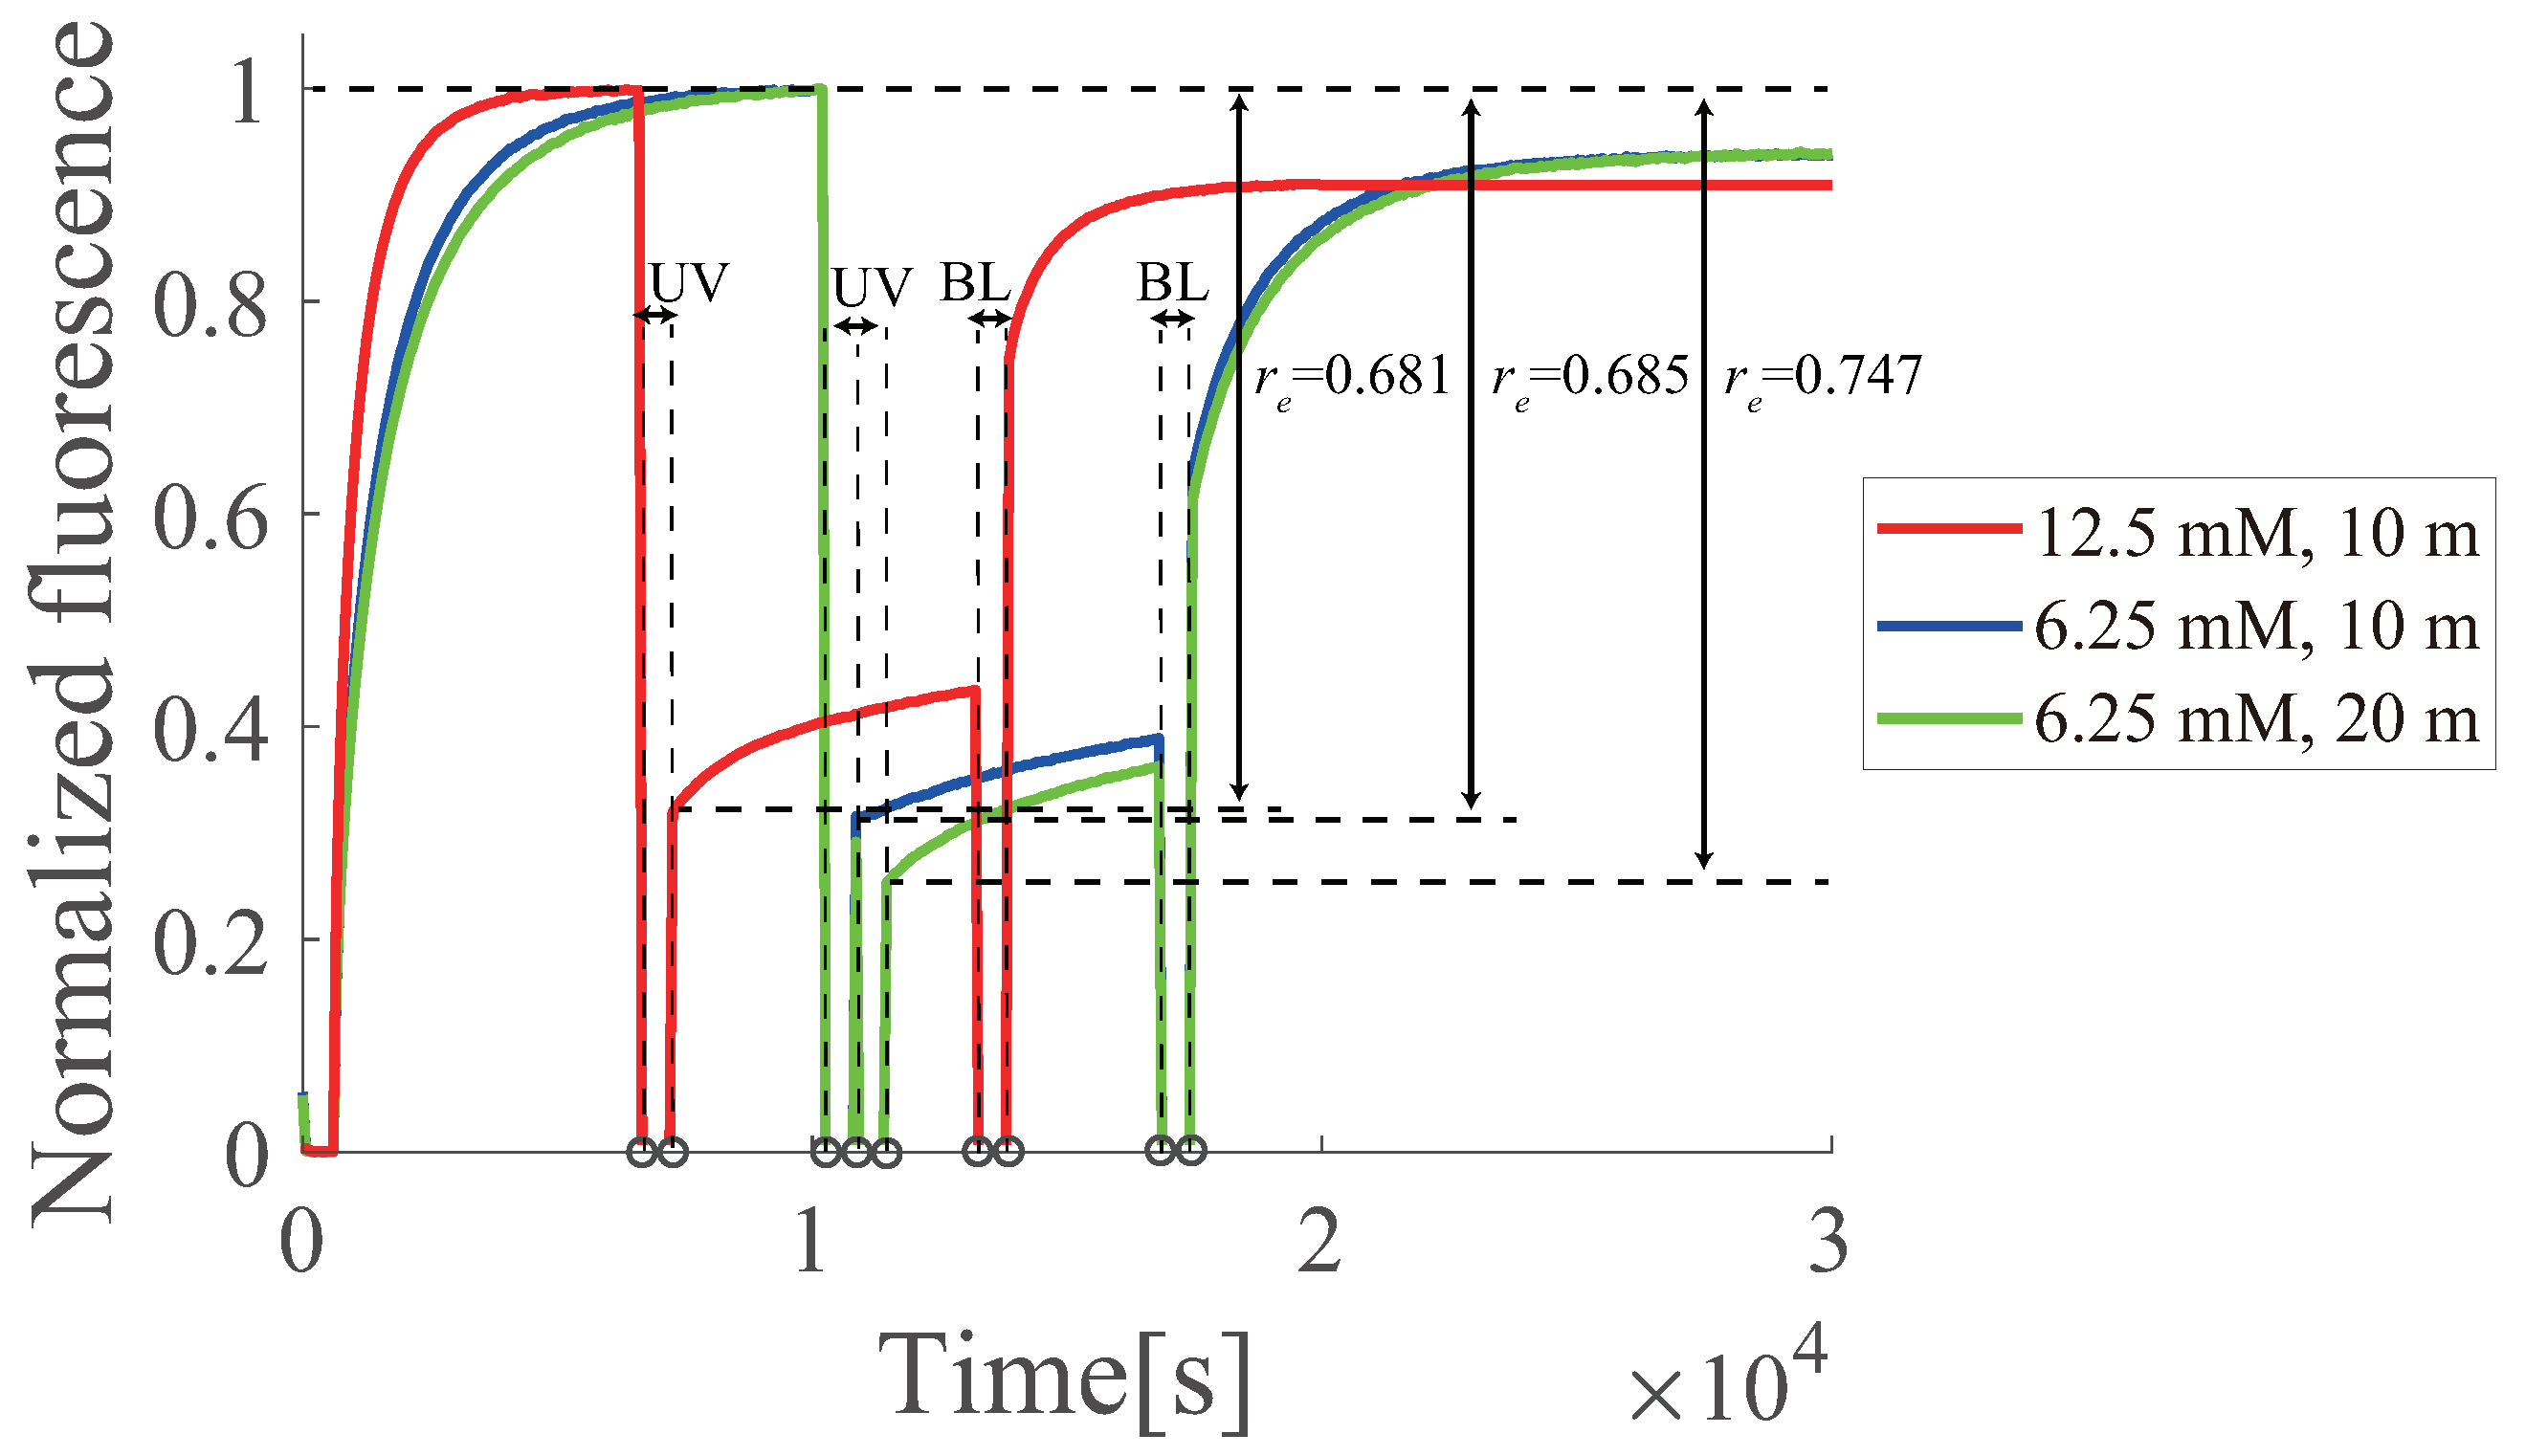
6.7. Buffer Dependence
7. Conclusions
Supplementary Materials
Author Contributions
Funding
Conflicts of Interest
Abbreviations
| BL | Blue light |
| UV | ultraviolet |
| DNA-PI controller | PI controller designed with DNA |
| azo-PI controller | PI controller with azobenzene attached |
| azo-catalysis | catalysis with azobenzene attached |
| azo-degradation | degradation with azobenzene attached |
| azo-annihilation | annihilation with azobenzene attached |
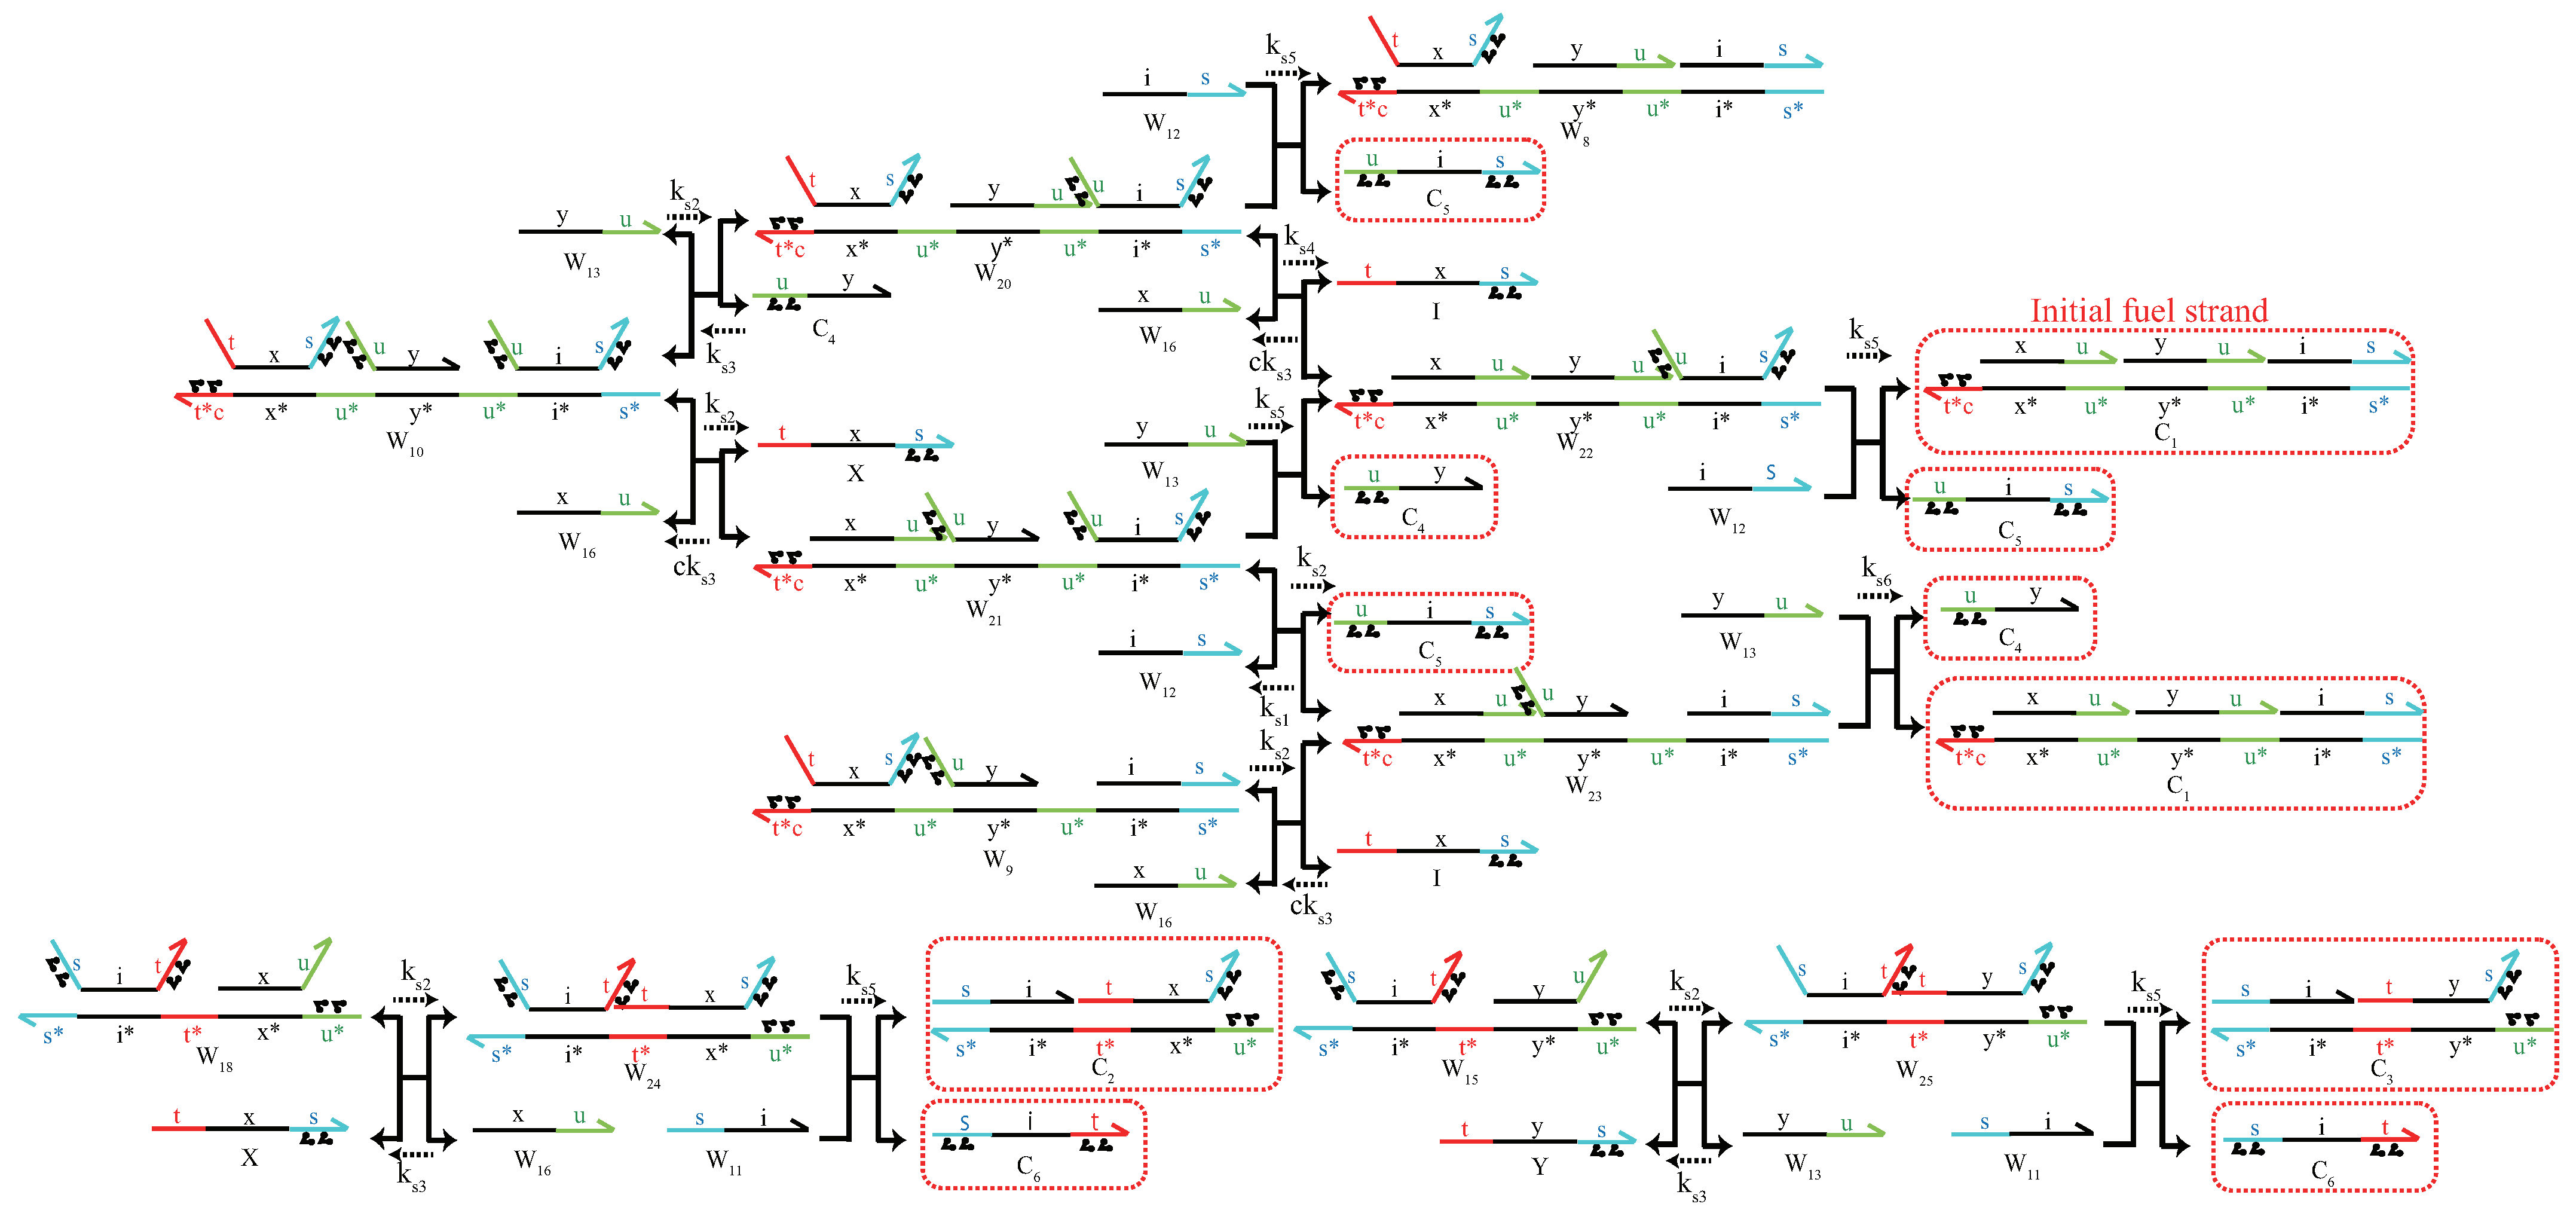
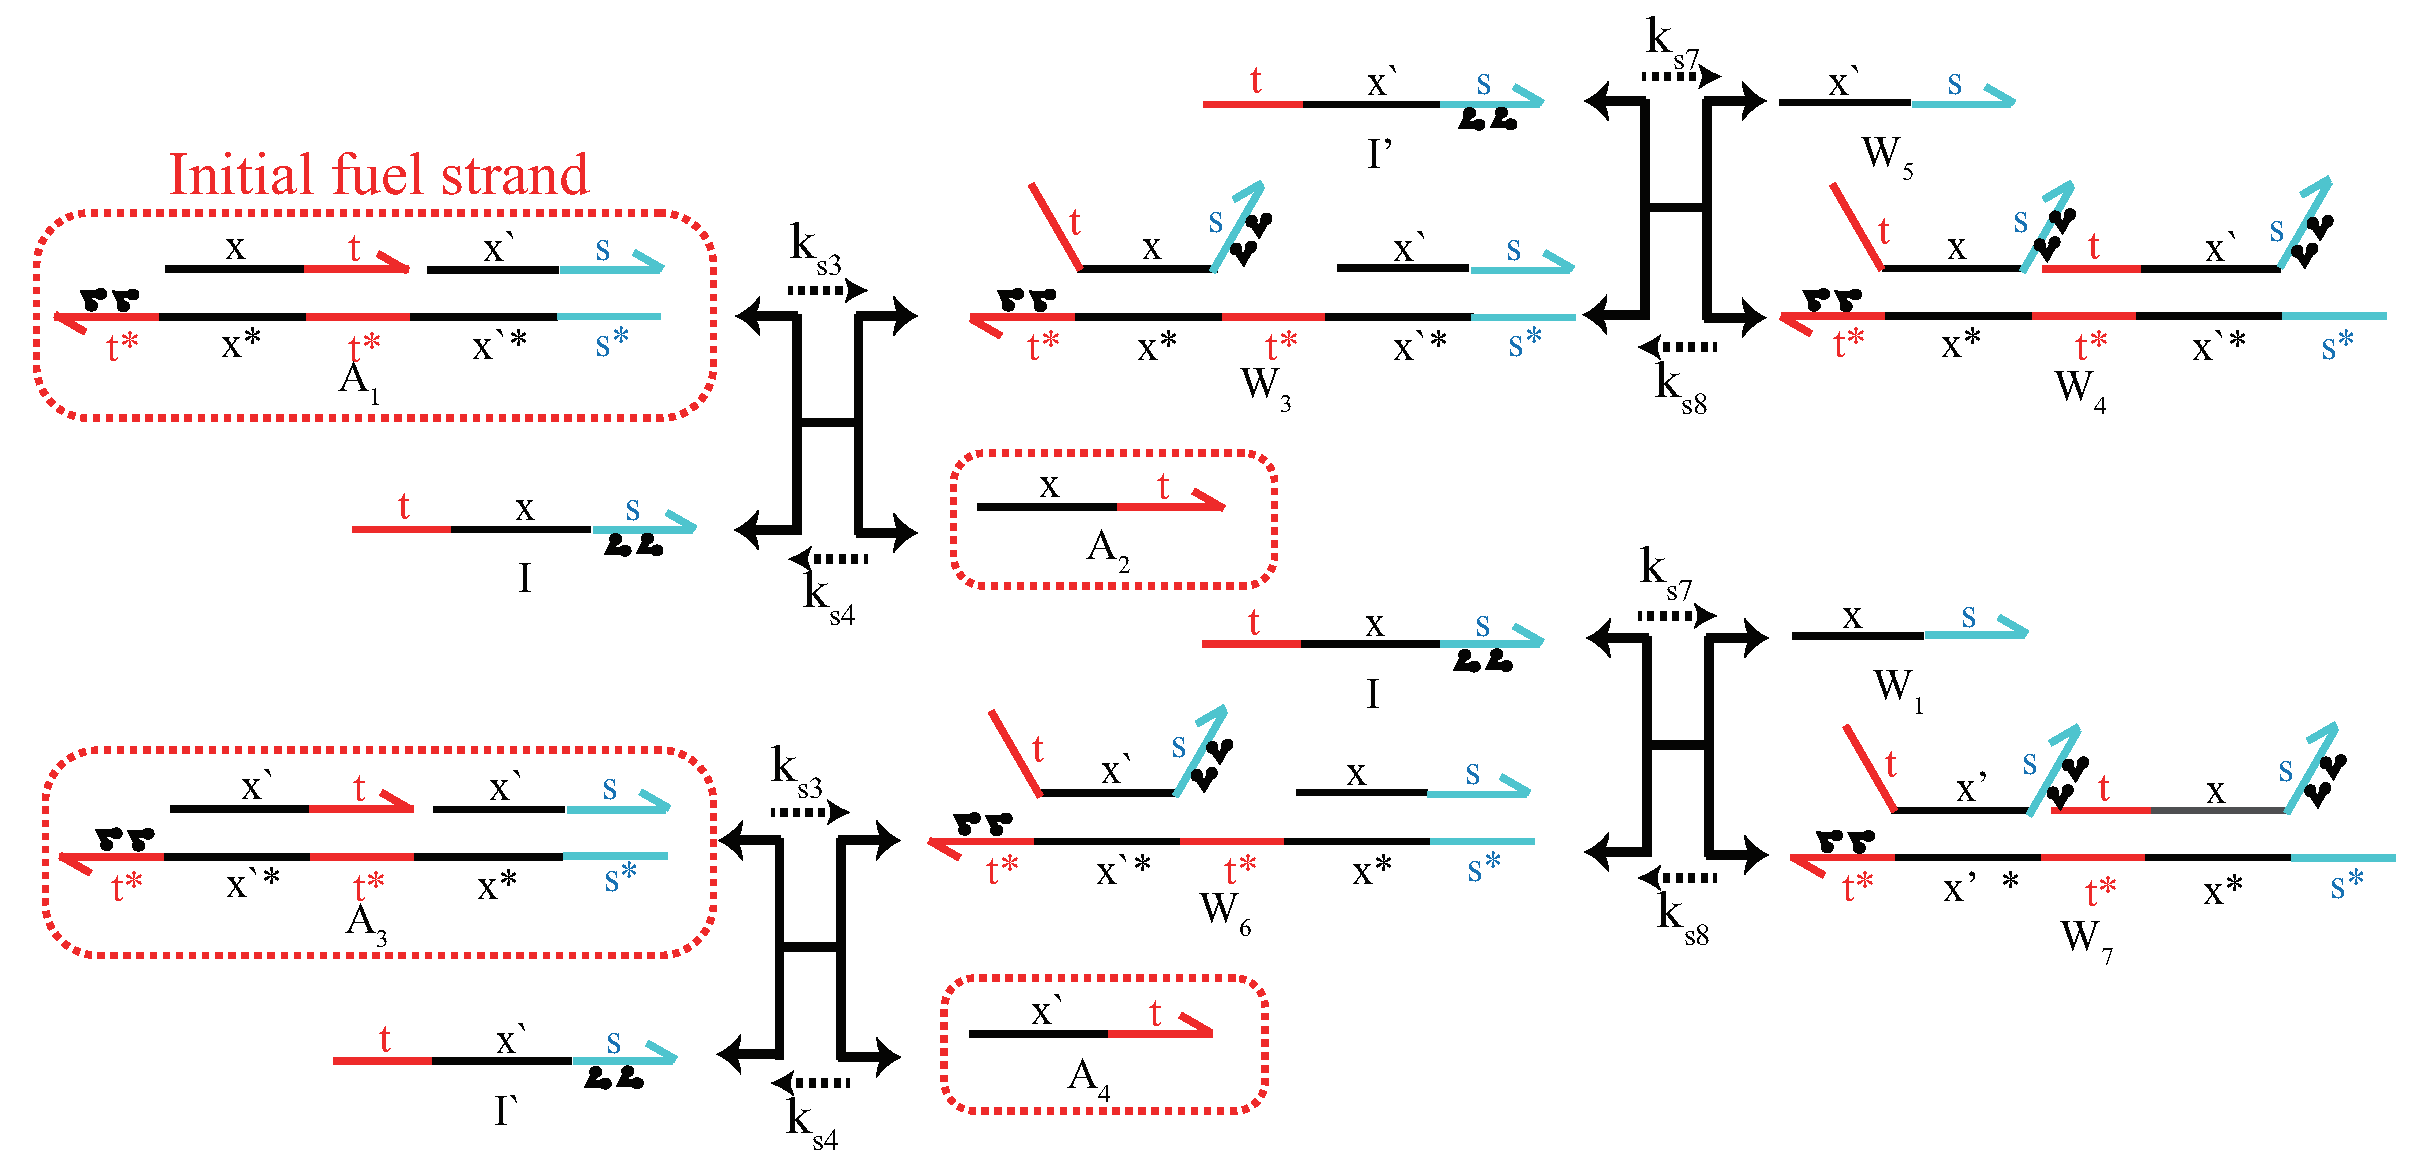
Appendix A. Design of DNA Circuits with Attached Azobenzene


References
- Benenson, Y.; Paz-Elizur, T.; Ada, R.; Keinan, E.; Livneh, Z.; Shapiro, E. Programmable and autonomous computing machine made of biomolecules. Nature 2001, 414, 430–434. [Google Scholar] [CrossRef] [PubMed]
- Qian, L.; Winfree, E. A simple DNA gate motif for synthesizing large-scale circuits. R. Soc. Interface 2011, 8, 1281–1297. [Google Scholar] [CrossRef] [PubMed] [Green Version]
- Qian, L.; Winfree, E. Scaling up digital circuit computation with dna strand displacement cascades. Science 2011, 332, 1196–1201. [Google Scholar] [CrossRef] [PubMed] [Green Version]
- Seelig, G.; Soloveichik, D.; Zhang, D.Y.; Winfree, E. Enzyme-free nucleic acid logic circuits. Science 2006, 314, 1585–1588. [Google Scholar] [CrossRef] [PubMed] [Green Version]
- Soloveichik, D.; Seelig, G.; Winfree, E. DNA as a universal substrate for chemical kinetics. Proc. Natl. Acad. Sci. USA 2009, 107, 5393–5398. [Google Scholar] [CrossRef] [Green Version]
- Stojanovic, M.N.; Mitchell, T.E.; Stefanovic, D. Deoxyribozyme-based logic gates. J. Am. Chem. Soc. 2002, 124, 3555–3561. [Google Scholar] [CrossRef]
- Yin, P.; Choi, H.M.T.; Calvert, C.R.; Oierce, N.A. Programming biomolecular self-assembly pathways. Nature 2008, 451, 318–322. [Google Scholar] [CrossRef] [Green Version]
- Yurke, B.; Turberfirld, A.J.; Mills, A.P., Jr.; Simmerl, F.C.; Neumann, J.L. A dna-fuelled molecular machine made of dna. Nature 2000, 406, 605–608. [Google Scholar] [CrossRef]
- Murata, S.; Konagaya, A.; Kobayashi, S.; Saito, H.; Higiya, M. Molecular robotics: A new paradigm for artifacts. New Gereration Comput. 2013, 31, 27–45. [Google Scholar] [CrossRef] [Green Version]
- Sato, Y.; Hiratsuka, Y.; Kawamata, I.; Murata, S.; Nomura, S.M. Micrometer-sized molecular robot changes its shape in response to signal molecules. Sci. Robot 2017, 2, eaal3735. [Google Scholar] [CrossRef]
- Nakakuki, T.; Imura, J. Molecular governor: DNA feedback regulator for molecular robotics. SICE J. Control Meas. Syst. Integr. 2016, 9, 60–69. [Google Scholar] [CrossRef] [Green Version]
- Oishi, K.; Klavins, E. Biomolecular implementation of linear I/O systems. IET Syst. Biol. 2011, 5, 252–260. [Google Scholar] [CrossRef] [PubMed] [Green Version]
- Paulino, N.M.G.; Foo, M.; Kim, J.; Bates, D. PID and state feedback controllers using DNA strand displacement reactions. IEEE Control Syst. Lett. 2019, 3, 805–810. [Google Scholar] [CrossRef]
- Yordanov, B.; Kim, J.; Petersen, R.L.; Shudy, A.; Kulkarni, V.V.; Phillips, A. Computational design of nucleic acid feedback control circuits. ACS Synth. Biol. 2014, 3, 600–616. [Google Scholar] [CrossRef]
- Sawlekar, R.; Montefusco, F.; Kulkarni, V.V.; Bates, D.G. Implementing nonlinear feedback controllers using DNA strand displacement reactions. IEEE Trans. NanoBiosci. 2016, 15, 443–454. [Google Scholar] [CrossRef] [Green Version]
- Nakakuki, T.; Imura, J. Finite-time regulation property of DNA feedback regulator. Automatica 2020, 114, 108826. [Google Scholar] [CrossRef]
- Rong, P.; Nakakuki, T. Analysis of finite-time regulation property of biomolecular PI controller. Control Theory Technol. 2020, 18, 135–142. [Google Scholar] [CrossRef]
- Condon, A.; Hu, A.J.; Thachuk, C. Less haste, less waste: On recycling and its limits in strand displacement systems. Interface Focus 2012, 2, 512–521. [Google Scholar] [CrossRef] [Green Version]
- Lakin, M.R.; Youssef, S.; Cardelli, L.; Phillips, A. Abstractions for dna circuit design. J. R. Soc. Interface 2012, 9, 470–486. [Google Scholar] [CrossRef]
- Eshra, A.; Shah, S.; Reif, J. DNA hairpin gate: A renewable DNA seesaw motif using hairpins. IEEE Trans. Nanotechnol. 2019, 18, 252–259. [Google Scholar] [CrossRef]
- Garg, S.; Shah, S.; Bui, H.; Song, T.; Mokhtar, R.; Reif, J. Renewable time-responsive DNA circuits. Small 2018, 14, 1801470. [Google Scholar] [CrossRef] [PubMed]
- Asanuma, H.; Liang, X.G.; Nishioka, H.; Matsunaga, D.; Liu, M.Z.; Komiyama, M. Synthesis of azobenzene-tethered DNA for reversible photo-regulation of DNA. Nat. Protoc. 2007, 2, 203–212. [Google Scholar] [CrossRef] [PubMed]
- Song, X.; Eshra, A.; Dwyer, C.; Reif, J. Renewable DNA seesaw logic circuits enabled by photoregulation of toehold-mediated strand displacement. RSC Adv. 2017, 7, 28130–28144. [Google Scholar] [CrossRef] [Green Version]
- Tamba, M.; Takashi, N. Renewable implementation of rational biomolecular systems design. In Proceedings of the 2020 59th Annual Conference of the Society of Instrument and Control Engineers of Japan (SICE), Chiang Mai, Thailand, 23–26 September 2020. [Google Scholar]
- Zhang, D.Y.; Winfree, E. Control of DNA strand displacement kinetics using toehold exchange. JACS 2009, 131, 17303–17314. [Google Scholar] [CrossRef] [PubMed] [Green Version]
- Visual DSD. Available online: https://www.microsoft.com/en-us/research/project/programming-dna-circuits/ (accessed on 22 January 2022).
- Nishioka, H.; Liang, X.; Asanuma, H. Effect of the ortho modification of azobenzene on the photoregulatory efficiency of DNA hybridization and the thermal stability of its cis form. Chem. Eur. J. 2010, 16, 2054–2062. [Google Scholar] [CrossRef]


| 100% | 80% | 60% | 40% | 20% | 0% | |
|---|---|---|---|---|---|---|
| 4.1410 | 8.5367 | 2.054 | 1.7476 | 2.8887 | 8.5436 | |
| 0.0011 | 3.6509 | 2.0968 | 2.3262 | 9.0797 | 4.1410 | |
| 4.1410 | 7.2793 | 1.7928 | 1.6047 | 2.7996 | 8.6716 | |
| 0.0011 | 0.0011 | 0.0011 | 0.0010 | 0.0010 | 8.6716 | |
| 0.0011 | 3.6510 | 2.0976 | 2.3437 | 9.5163 | 5.4136 | |
| 0.0011 | 0.0011 | 0.0011 | 0.0011 | 0.0011 | 0.0011 | |
| 8.6716 | 9.7521 | 9.5901 | 9.2402 | 8.8792 | 8.5436 | |
| 8.6716 | 2.6648 | 1.4562 | 1.5549 | 6.0460 | 3.2996 |
| Sequence | Base Sequence (5–3) |
|---|---|
| D (under strand) | XAXGTX GGTGAGTGATGTAGG ATATAATATG—BHQ-3 |
| D (upper strand) | Cy5—CATATTATAT CCTACATCACTCACC |
| I | XCXATXATXTAXTAXT CCTACATCACTCACC ACT |
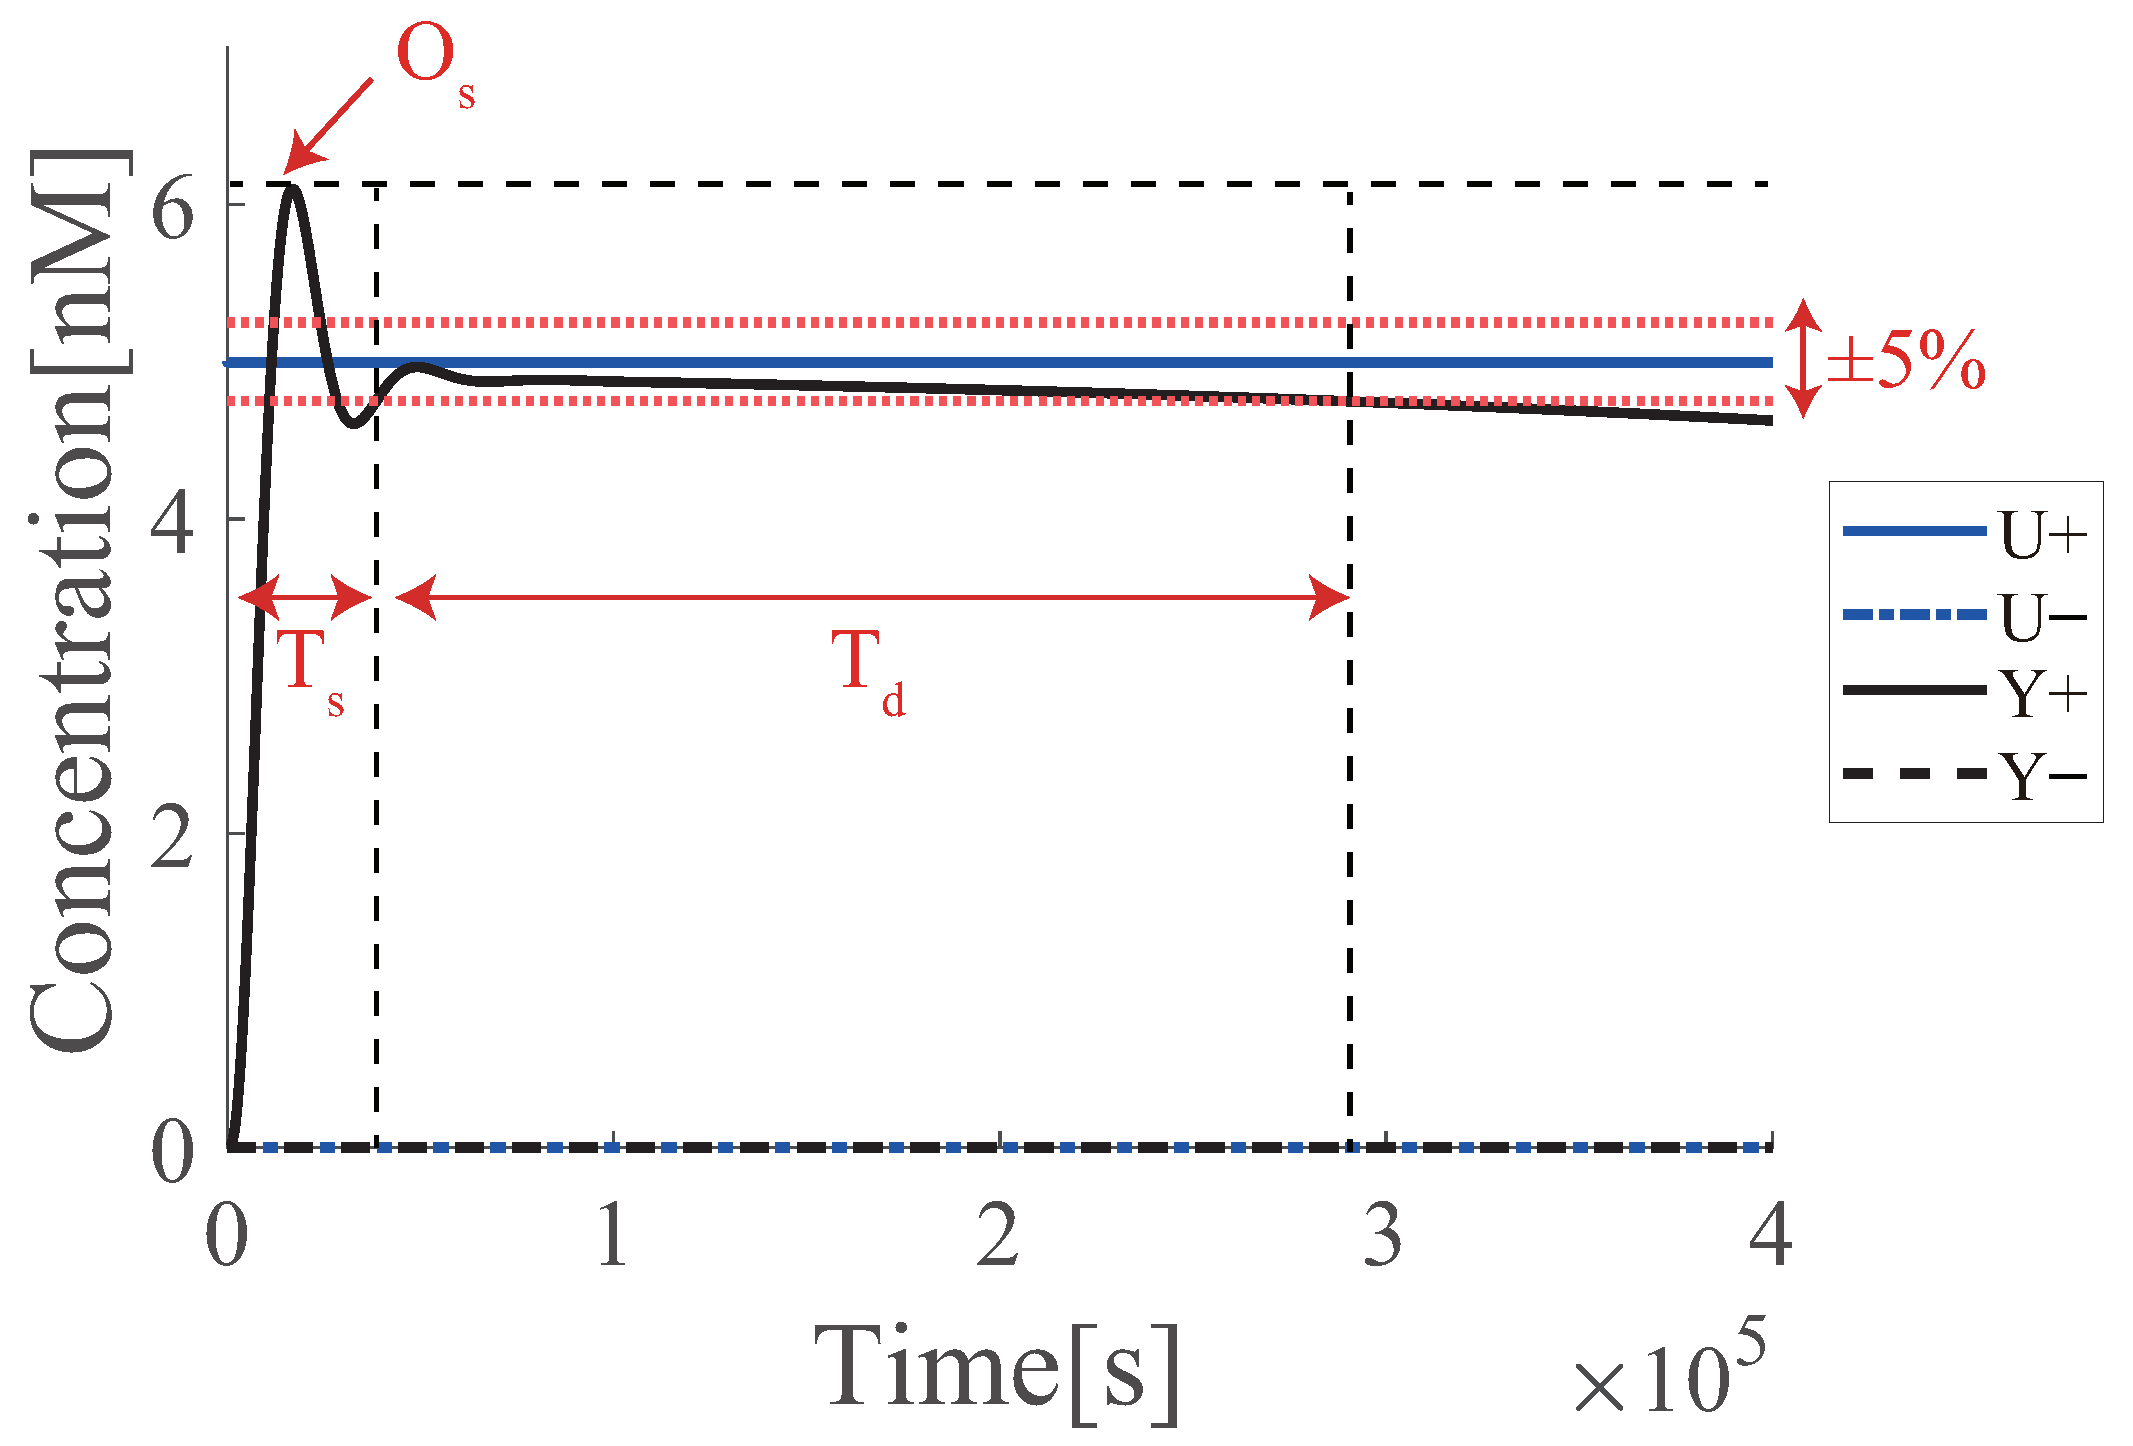
| Effectiveness of Azobenzene | ||||
|---|---|---|---|---|
| 100% | 1.0 | 6.1 | 40,626 | 249,249 |
| 60% | 0.997 | 6.1 | 38,639 | 246,655 |
| 40% | 0.954 | 5.7 | 39,821 | 163,951 |
| 20% | 0.086 | 107.5 | 39,593 | 16,187 |
Publisher’s Note: MDPI stays neutral with regard to jurisdictional claims in published maps and institutional affiliations. |
© 2022 by the authors. Licensee MDPI, Basel, Switzerland. This article is an open access article distributed under the terms and conditions of the Creative Commons Attribution (CC BY) license (https://creativecommons.org/licenses/by/4.0/).
Share and Cite
Tamba, M.; Murayama, K.; Asanuma, H.; Nakakuki, T. Renewable DNA Proportional-Integral Controller with Photoresponsive Molecules. Micromachines 2022, 13, 193. https://doi.org/10.3390/mi13020193
Tamba M, Murayama K, Asanuma H, Nakakuki T. Renewable DNA Proportional-Integral Controller with Photoresponsive Molecules. Micromachines. 2022; 13(2):193. https://doi.org/10.3390/mi13020193
Chicago/Turabian StyleTamba, Masaaki, Keiji Murayama, Hiroyuki Asanuma, and Takashi Nakakuki. 2022. "Renewable DNA Proportional-Integral Controller with Photoresponsive Molecules" Micromachines 13, no. 2: 193. https://doi.org/10.3390/mi13020193
APA StyleTamba, M., Murayama, K., Asanuma, H., & Nakakuki, T. (2022). Renewable DNA Proportional-Integral Controller with Photoresponsive Molecules. Micromachines, 13(2), 193. https://doi.org/10.3390/mi13020193