
Design and Optimization of a Novel MEMS Tuning Fork Gyroscope Microstructure

Abstract
:1. Introduction
2. Materials and Methods
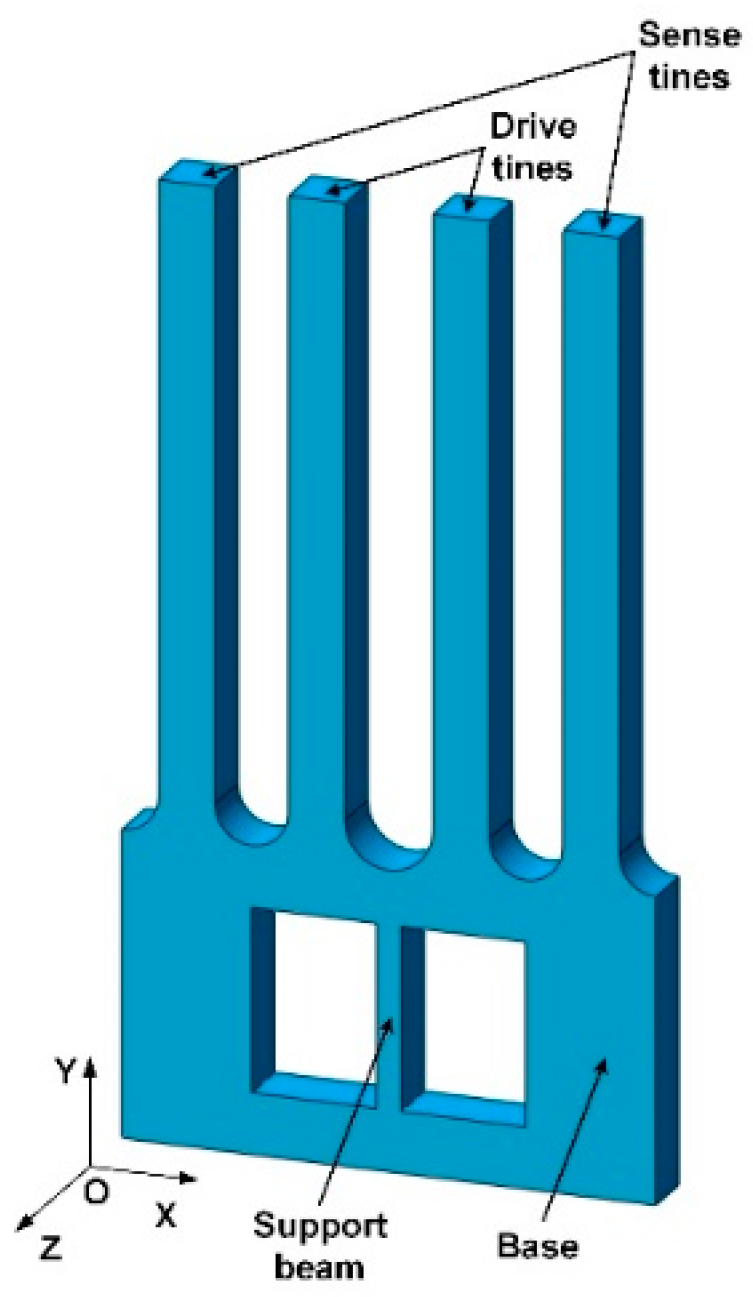
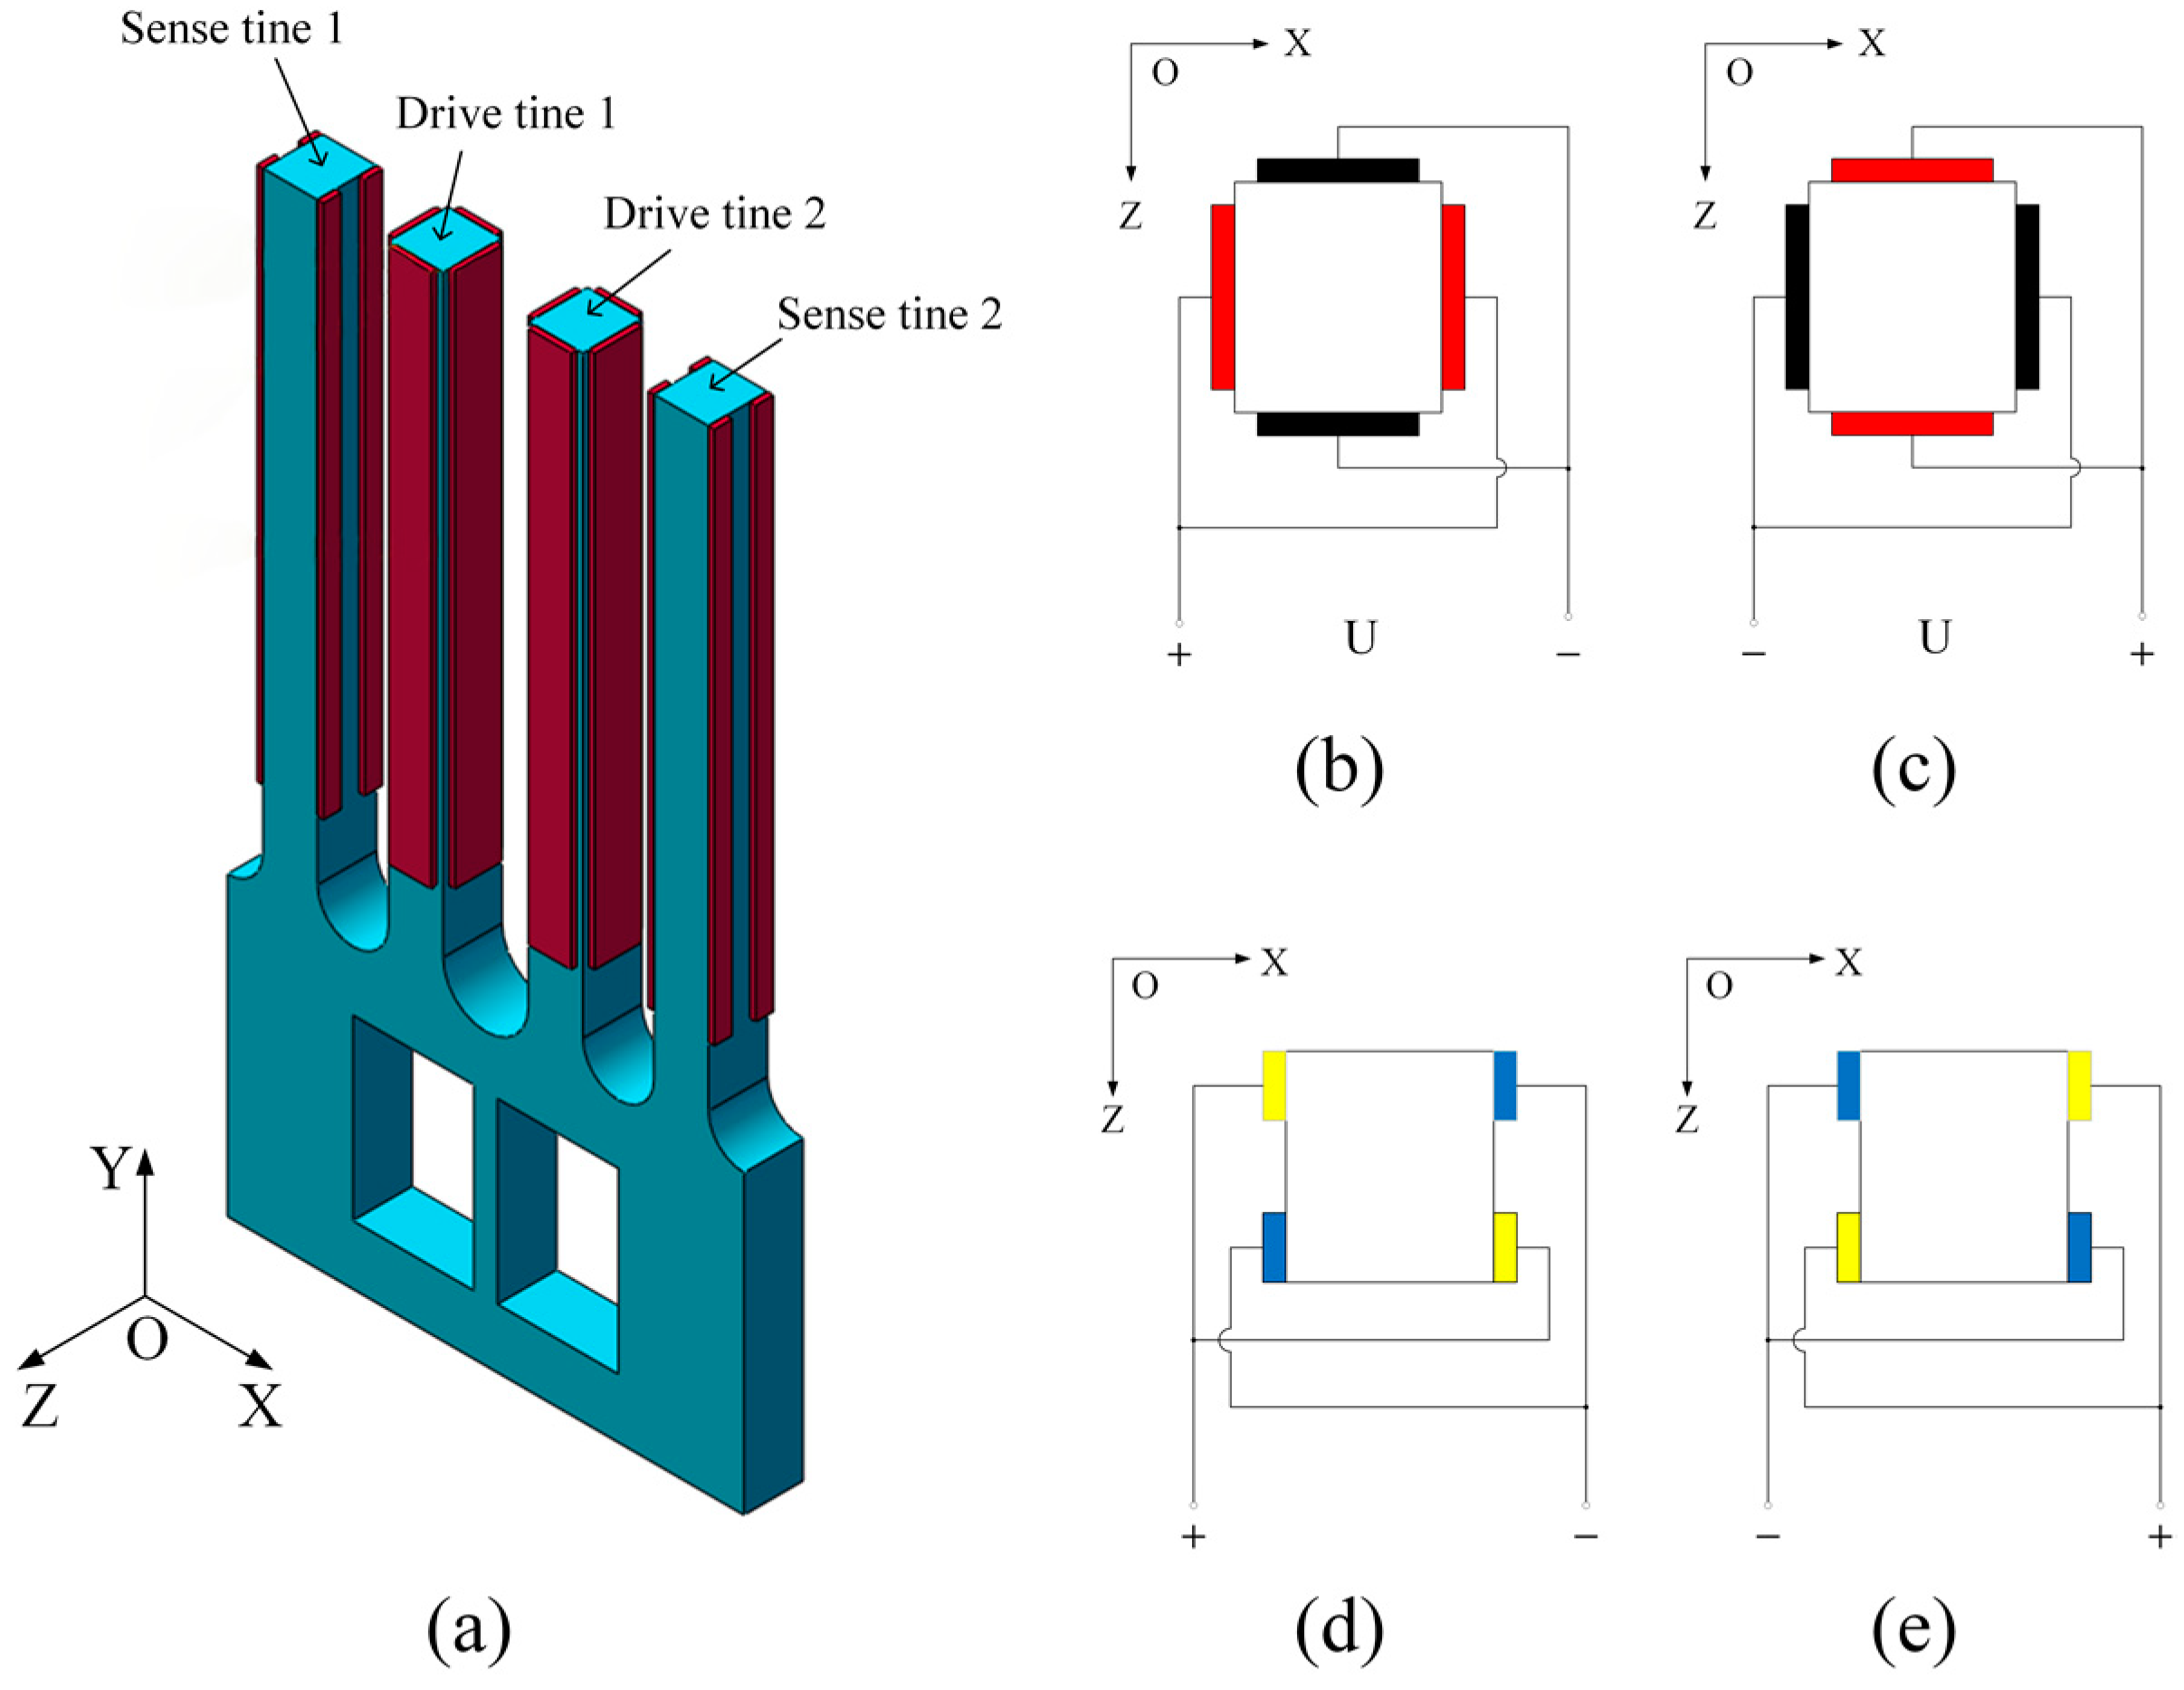
2.1. Architectural Design
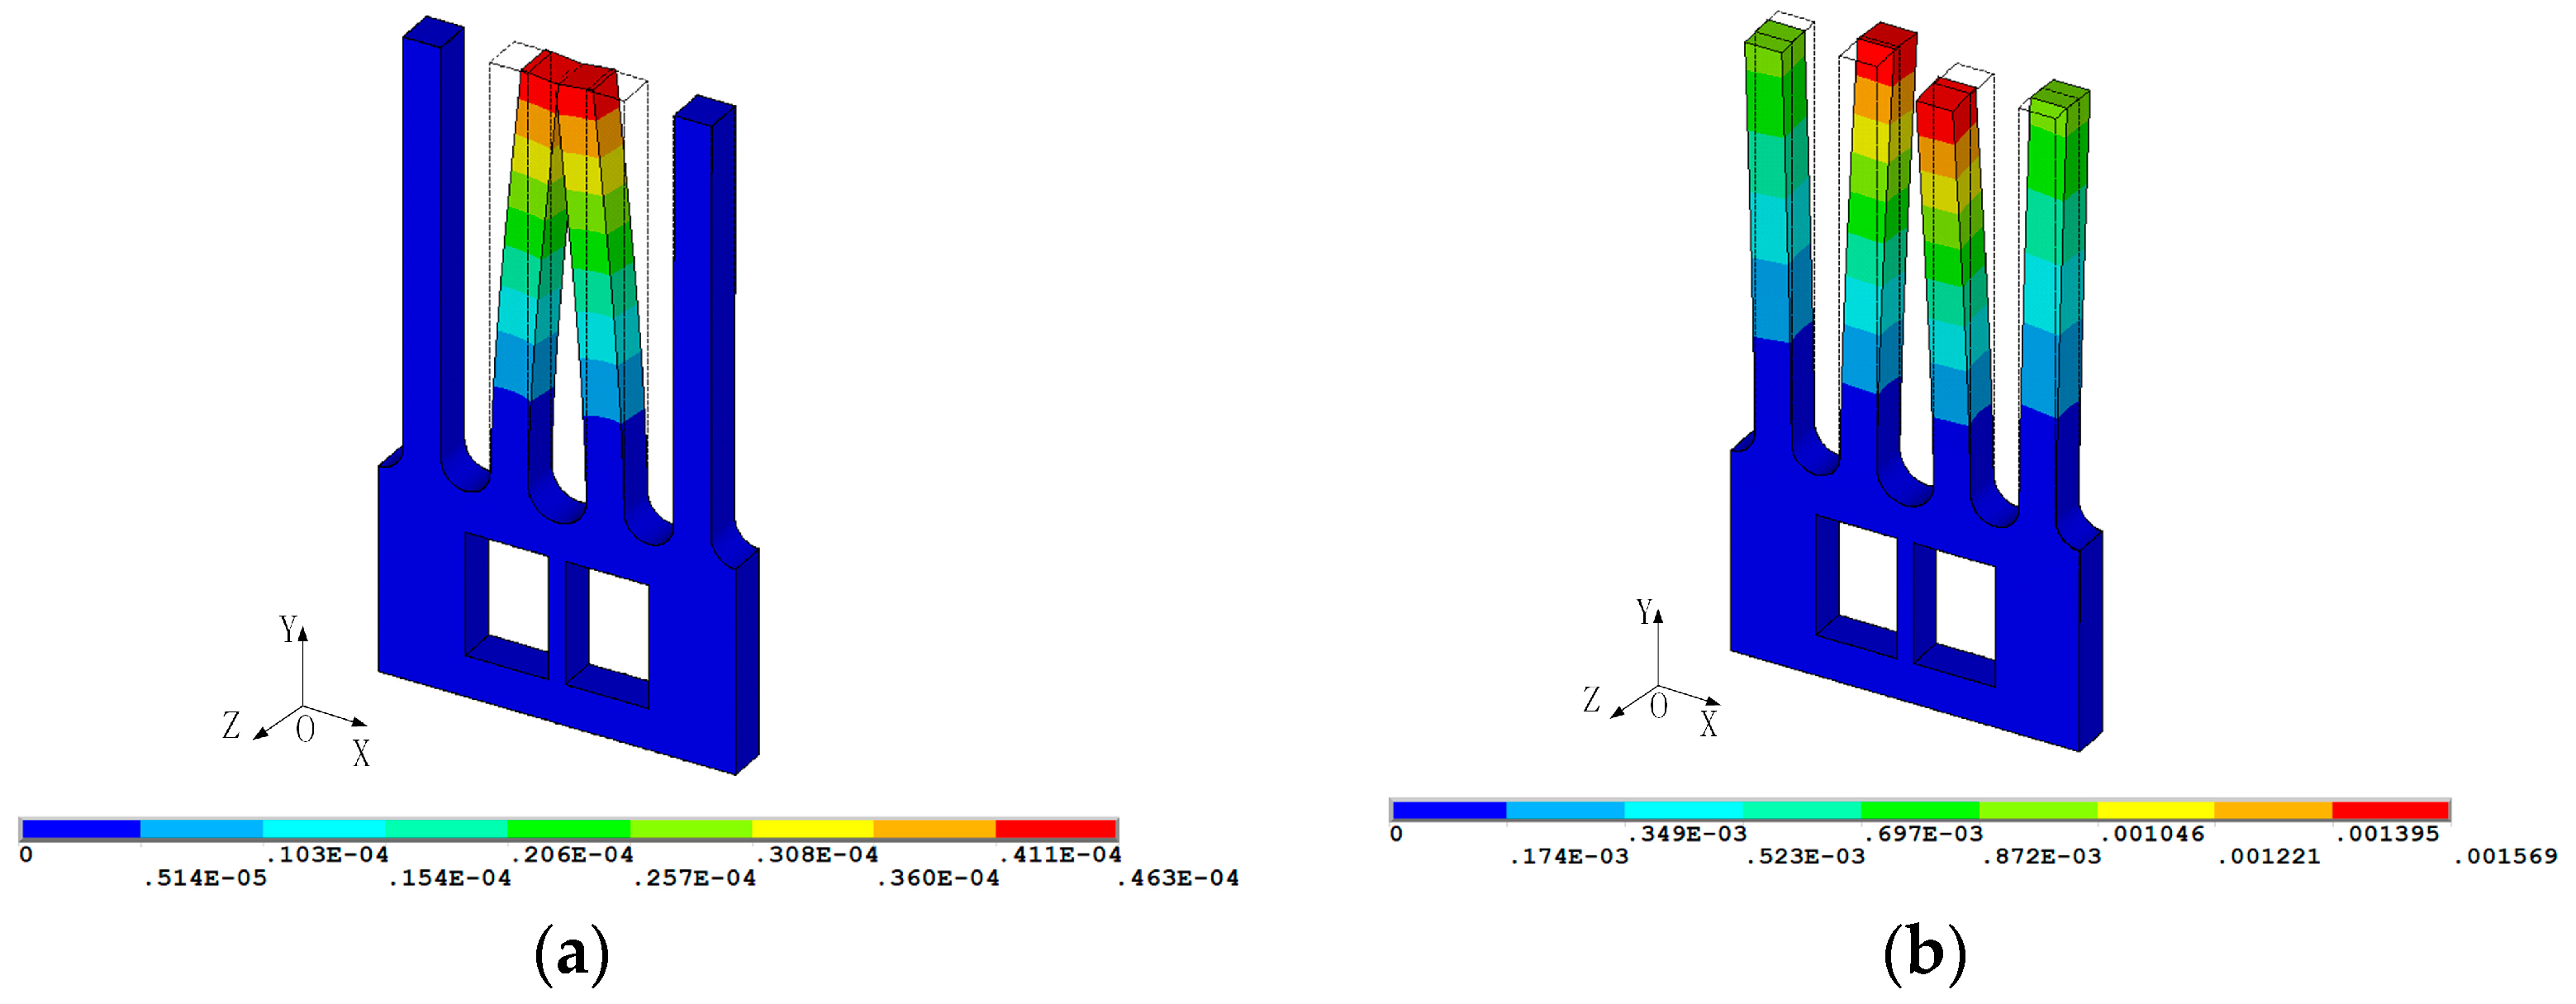
2.2. Mode Shape
3. Results and Analysis
3.1. Structural Analysis
- (1)
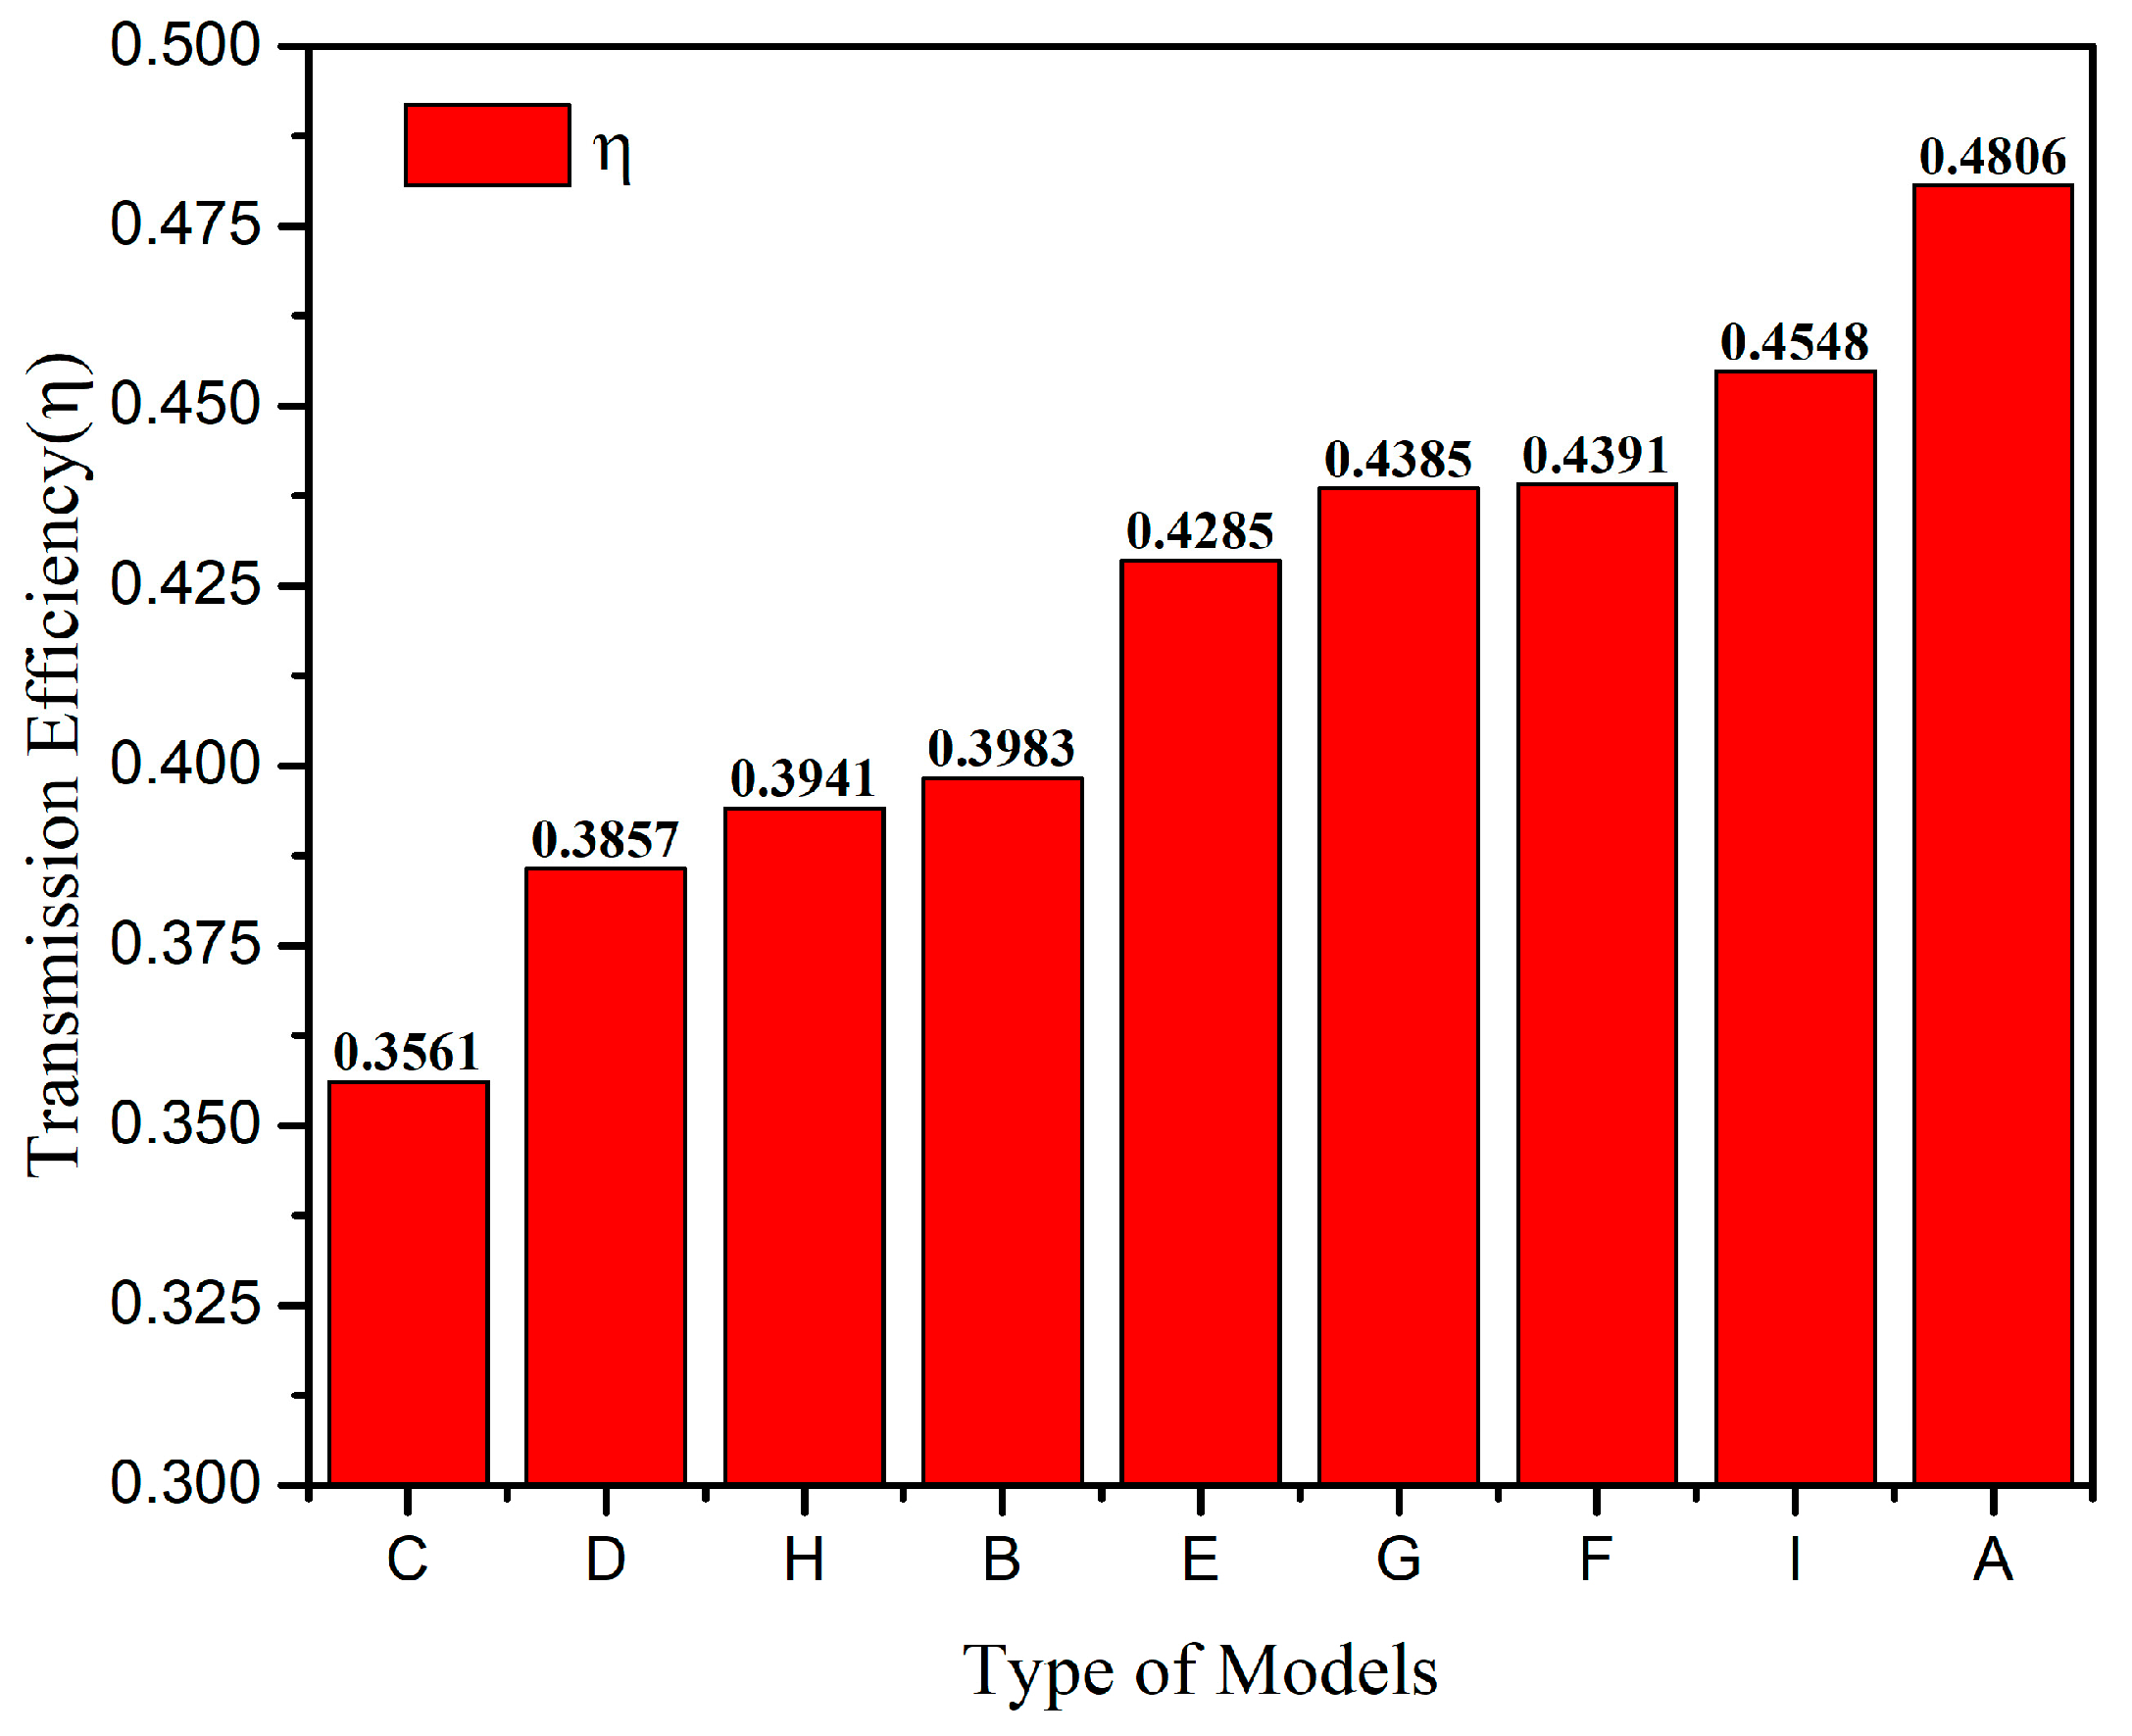
- The transmission efficiency of Coriolis vibration ŋ should be as high as possible;
- (2)
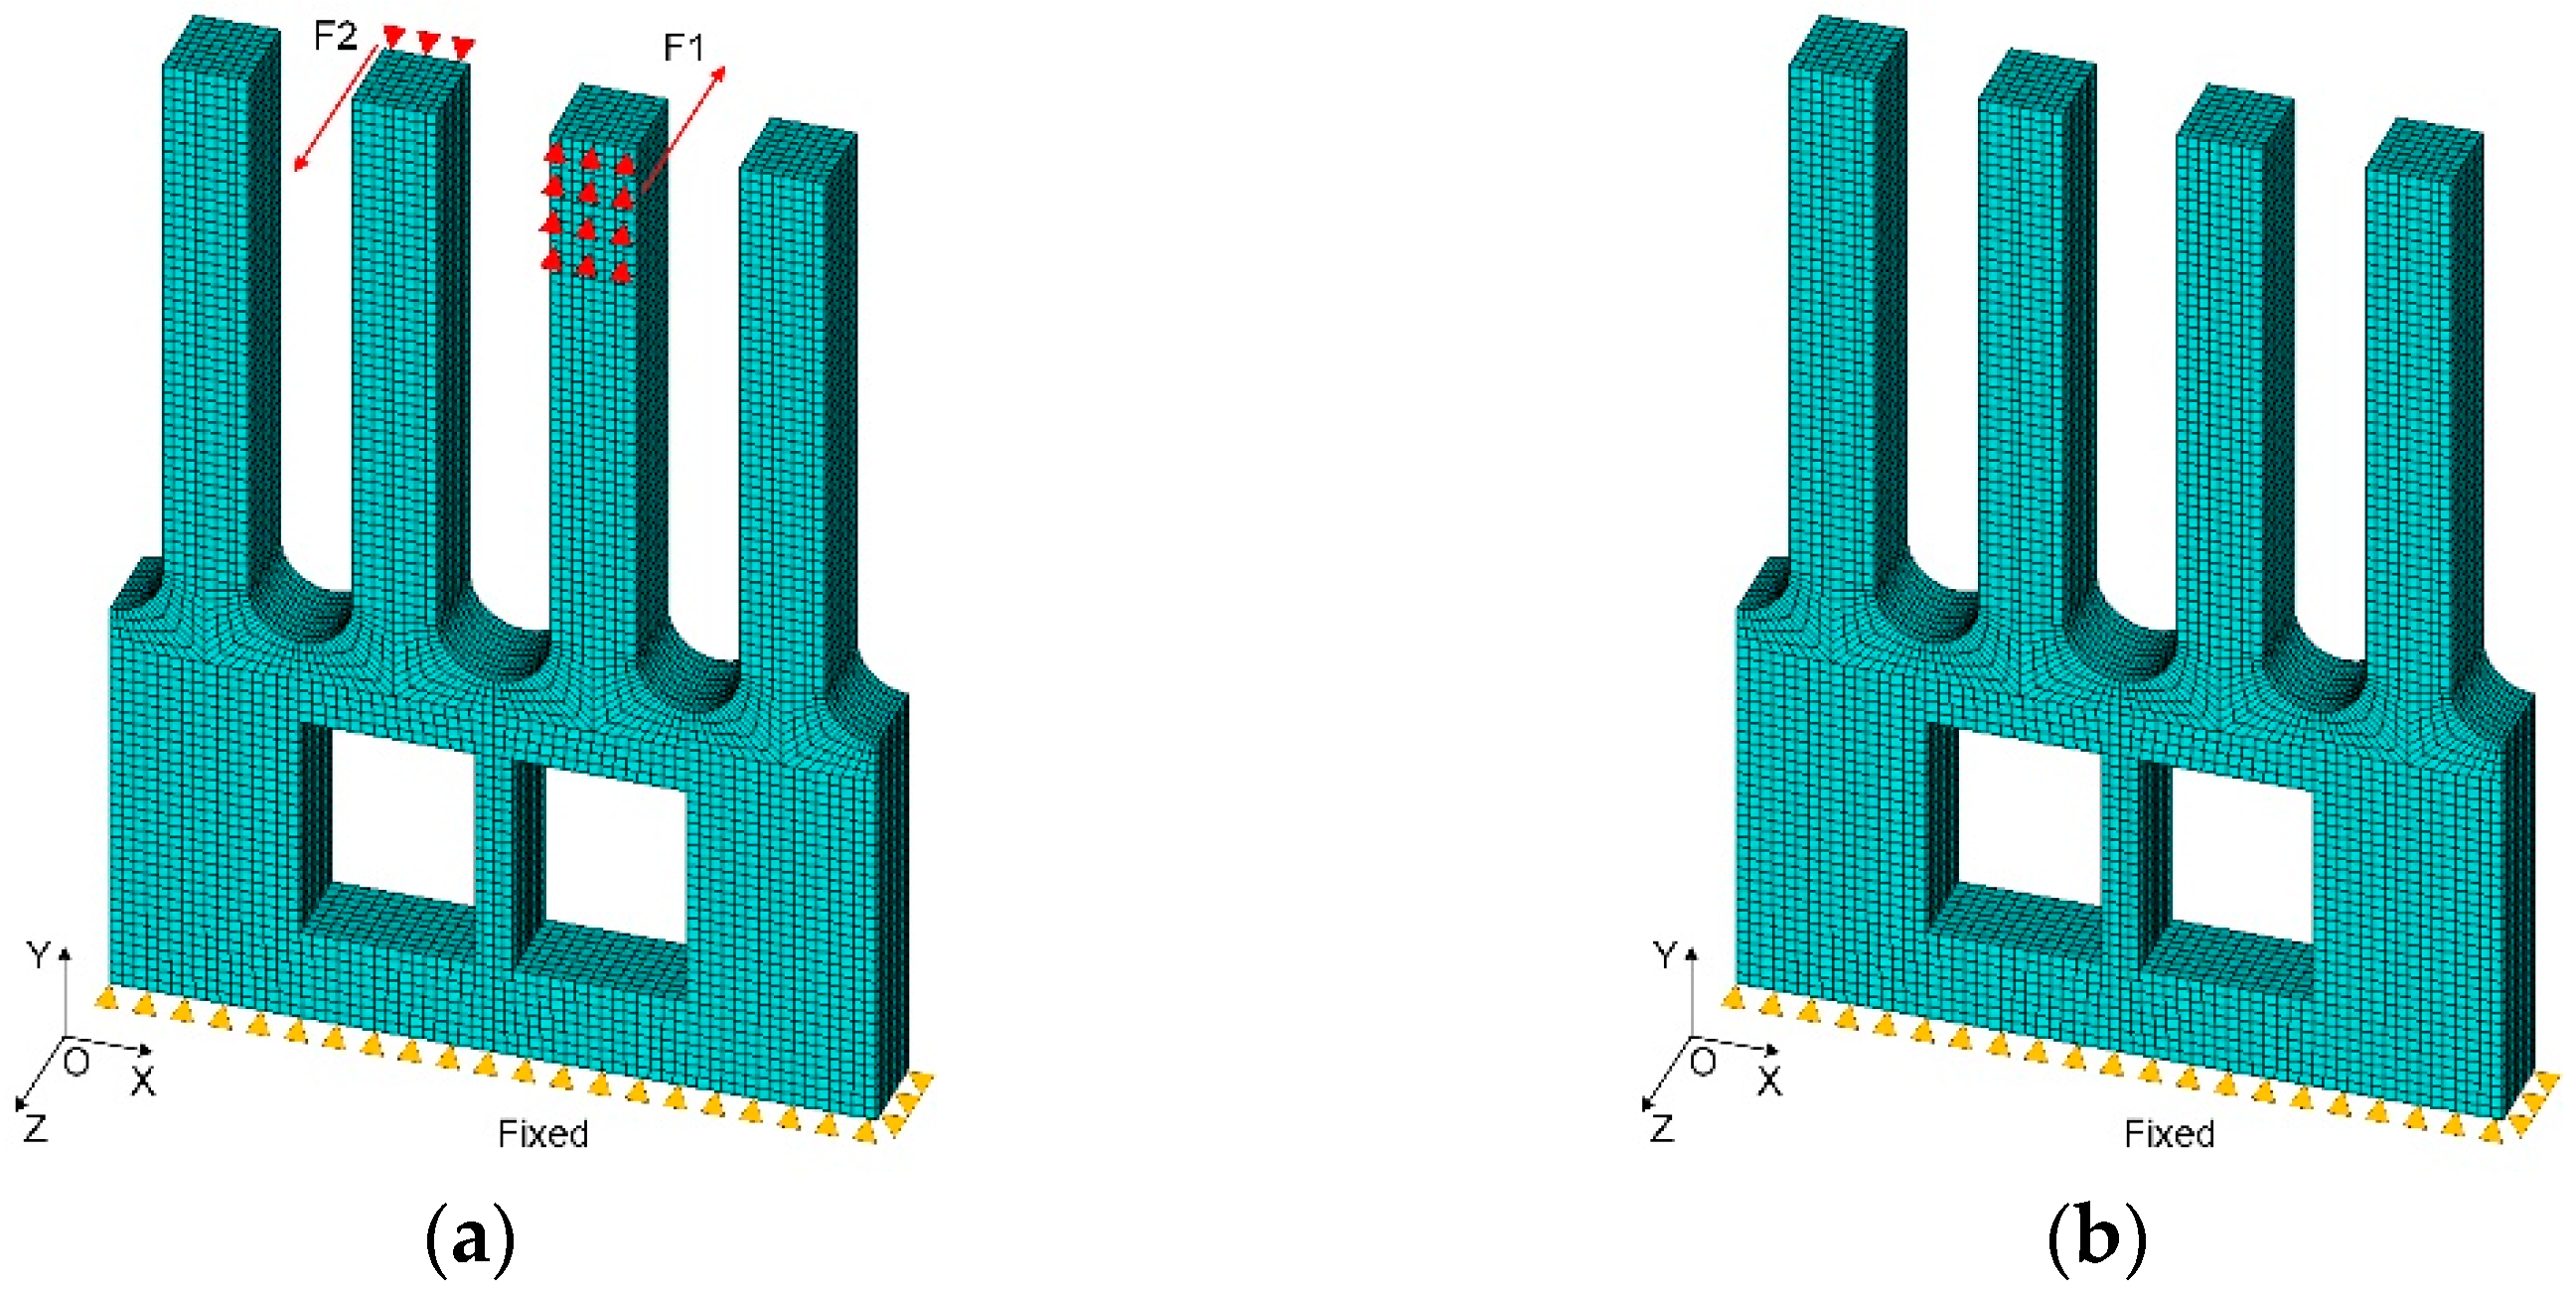
- The working modal (driving mode and sensing mode) order and frequency should be as low as possible, which can achieve greater response amplitude in the structural vibration. When the excitation frequency is close to the r-th natural frequency ωr, the system response {q(t)} is approximately expressed by the following formula.where {u(r)} is the r-th modal vector, N0r is excitation amplitude, and ξr is damping ratio.
- (3)
- The driving mode and the sensing mode should be adjacent to reduce the effects of interfering modes.
3.2. Size Optimization with Taguchi Method
- (a)
- Smaller-the-better characteristic:
- (b)
- Larger-the-better characteristic:
- (c)
- Nominal-the-best characteristic:where yi is measured values, and n and m are number of experiments and nominal value respectively.
- (1)
- The transmission efficiency of Coriolis vibration which meets the larger-the-better characteristic;
- (2)
- Frequency difference between the driving mode and sensing mode. When the frequency difference between the two is large, the working bandwidth of the gyroscope meets Formula (9) [31]:
- (3)
- The driving modal frequency which meets the smaller-the-better characteristic;
- (4)
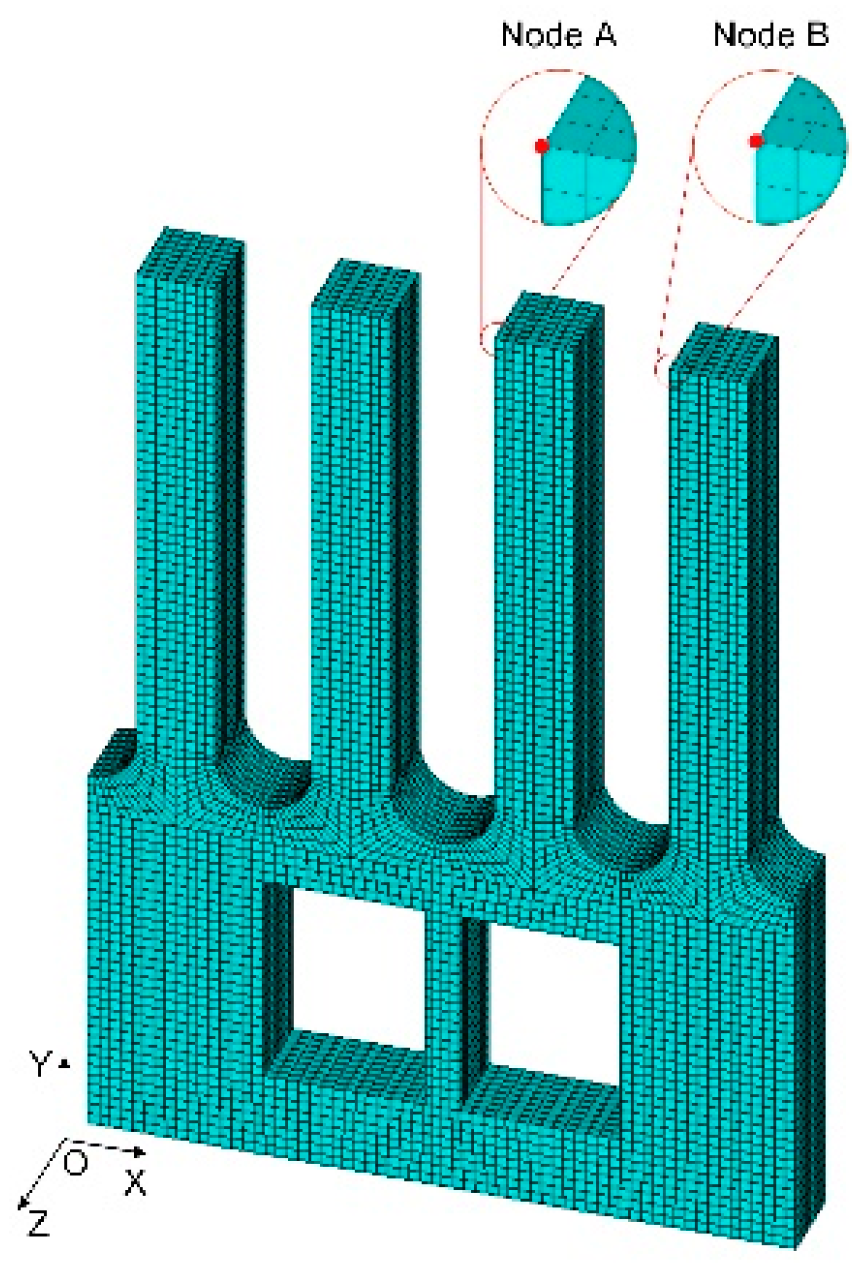
- The drive coupling coefficient which meets the smaller-the-better characteristic. Similar to Section 3.2, the drive coupling coefficient is denoted as λ and defined by the Formula (11) given below.where XB is the displacement of node B in the driving mode, and XA is the displacement of node A.
4. Discussion
- (1)
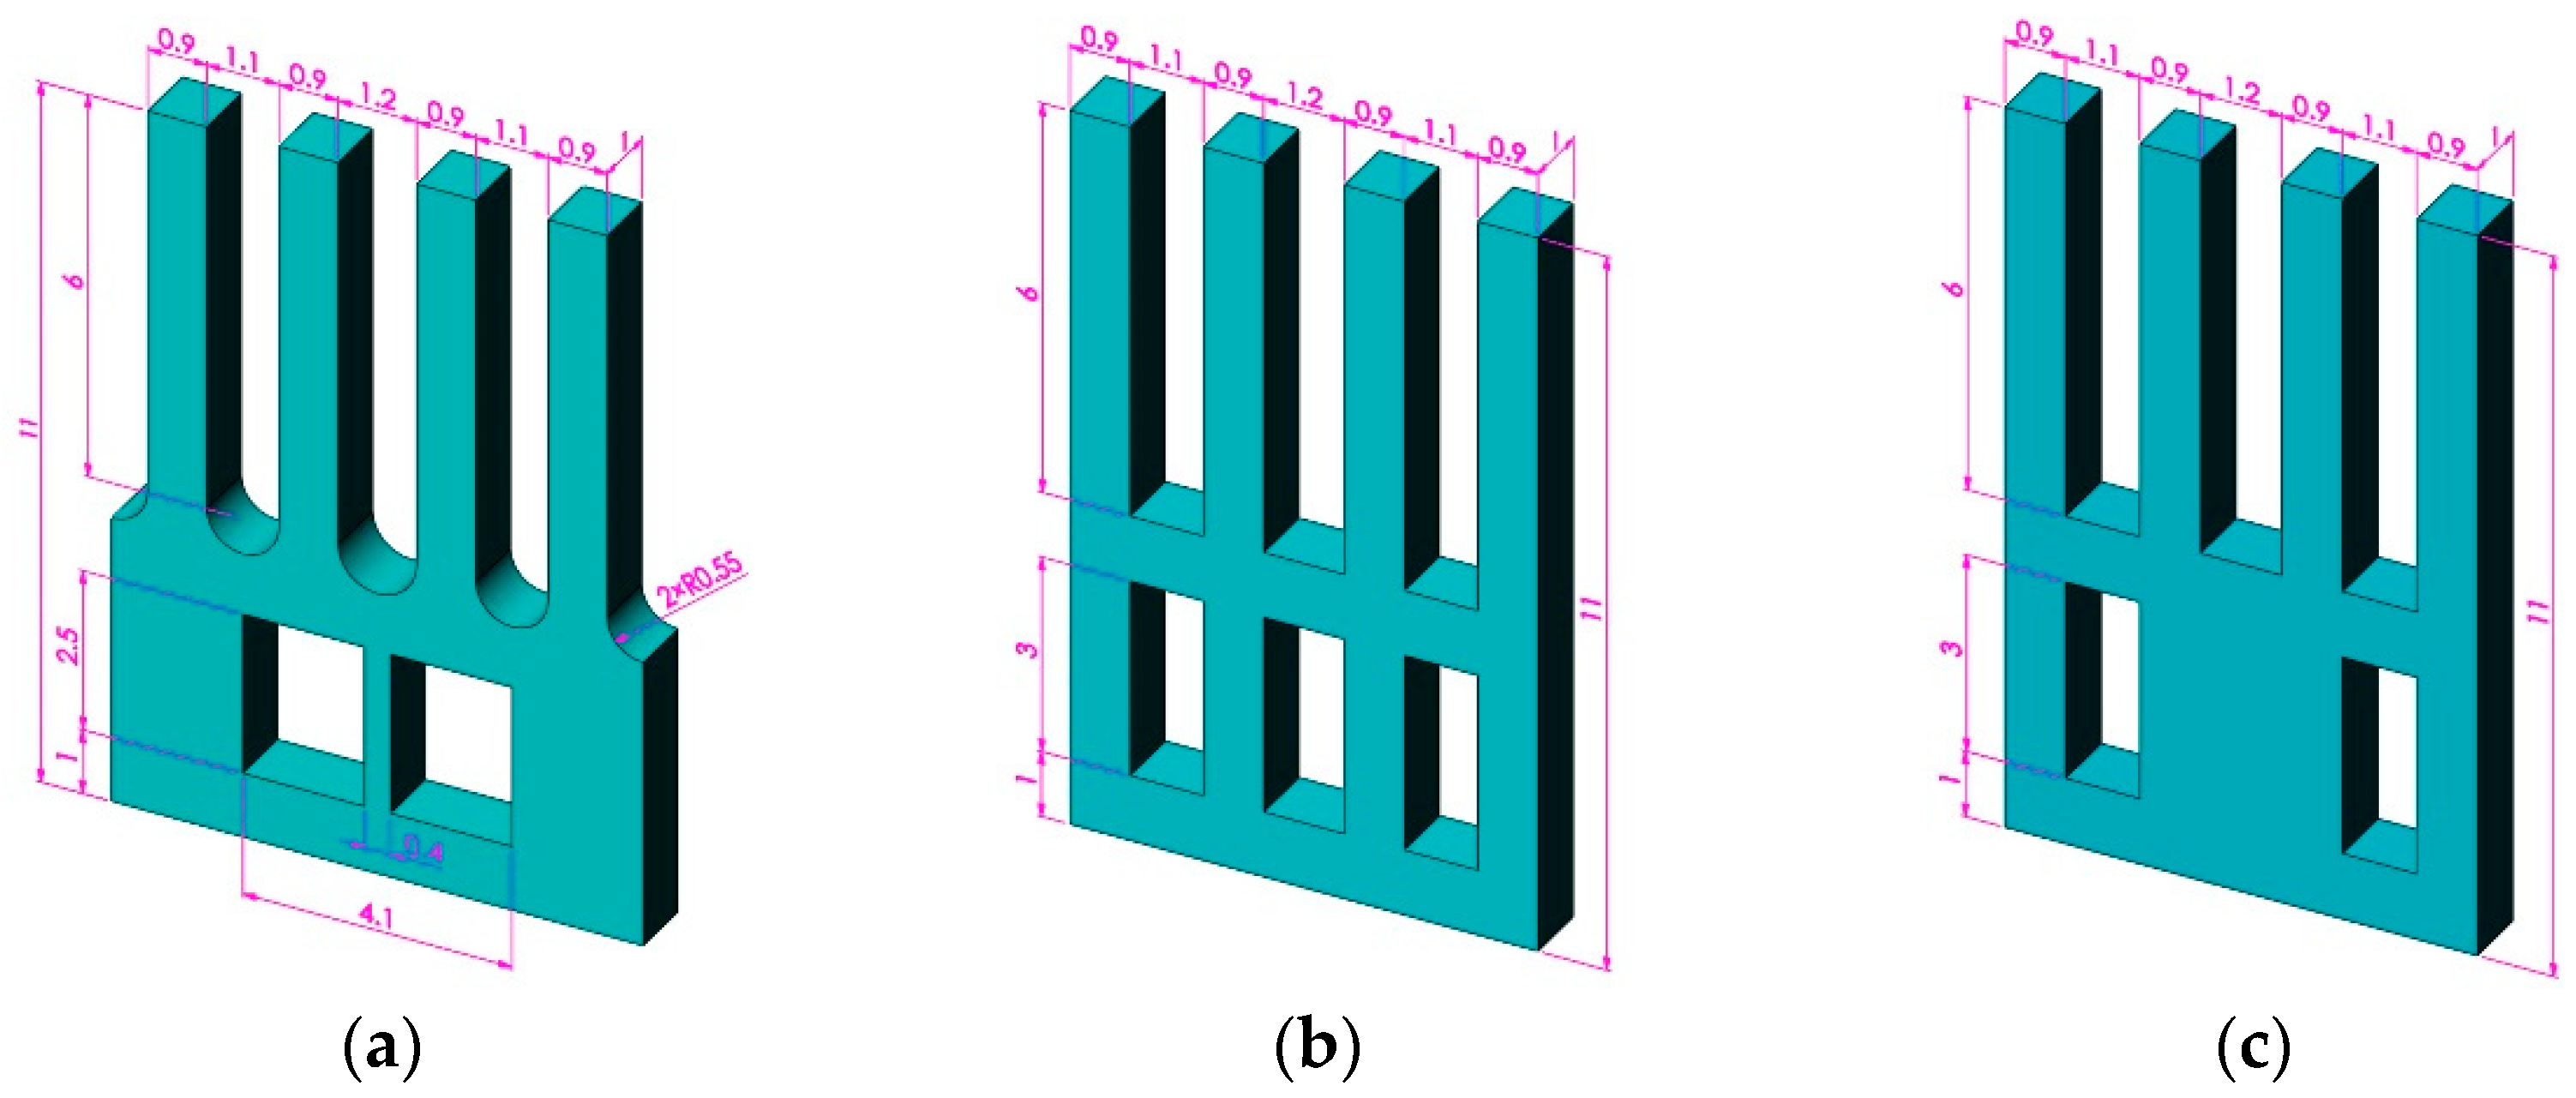
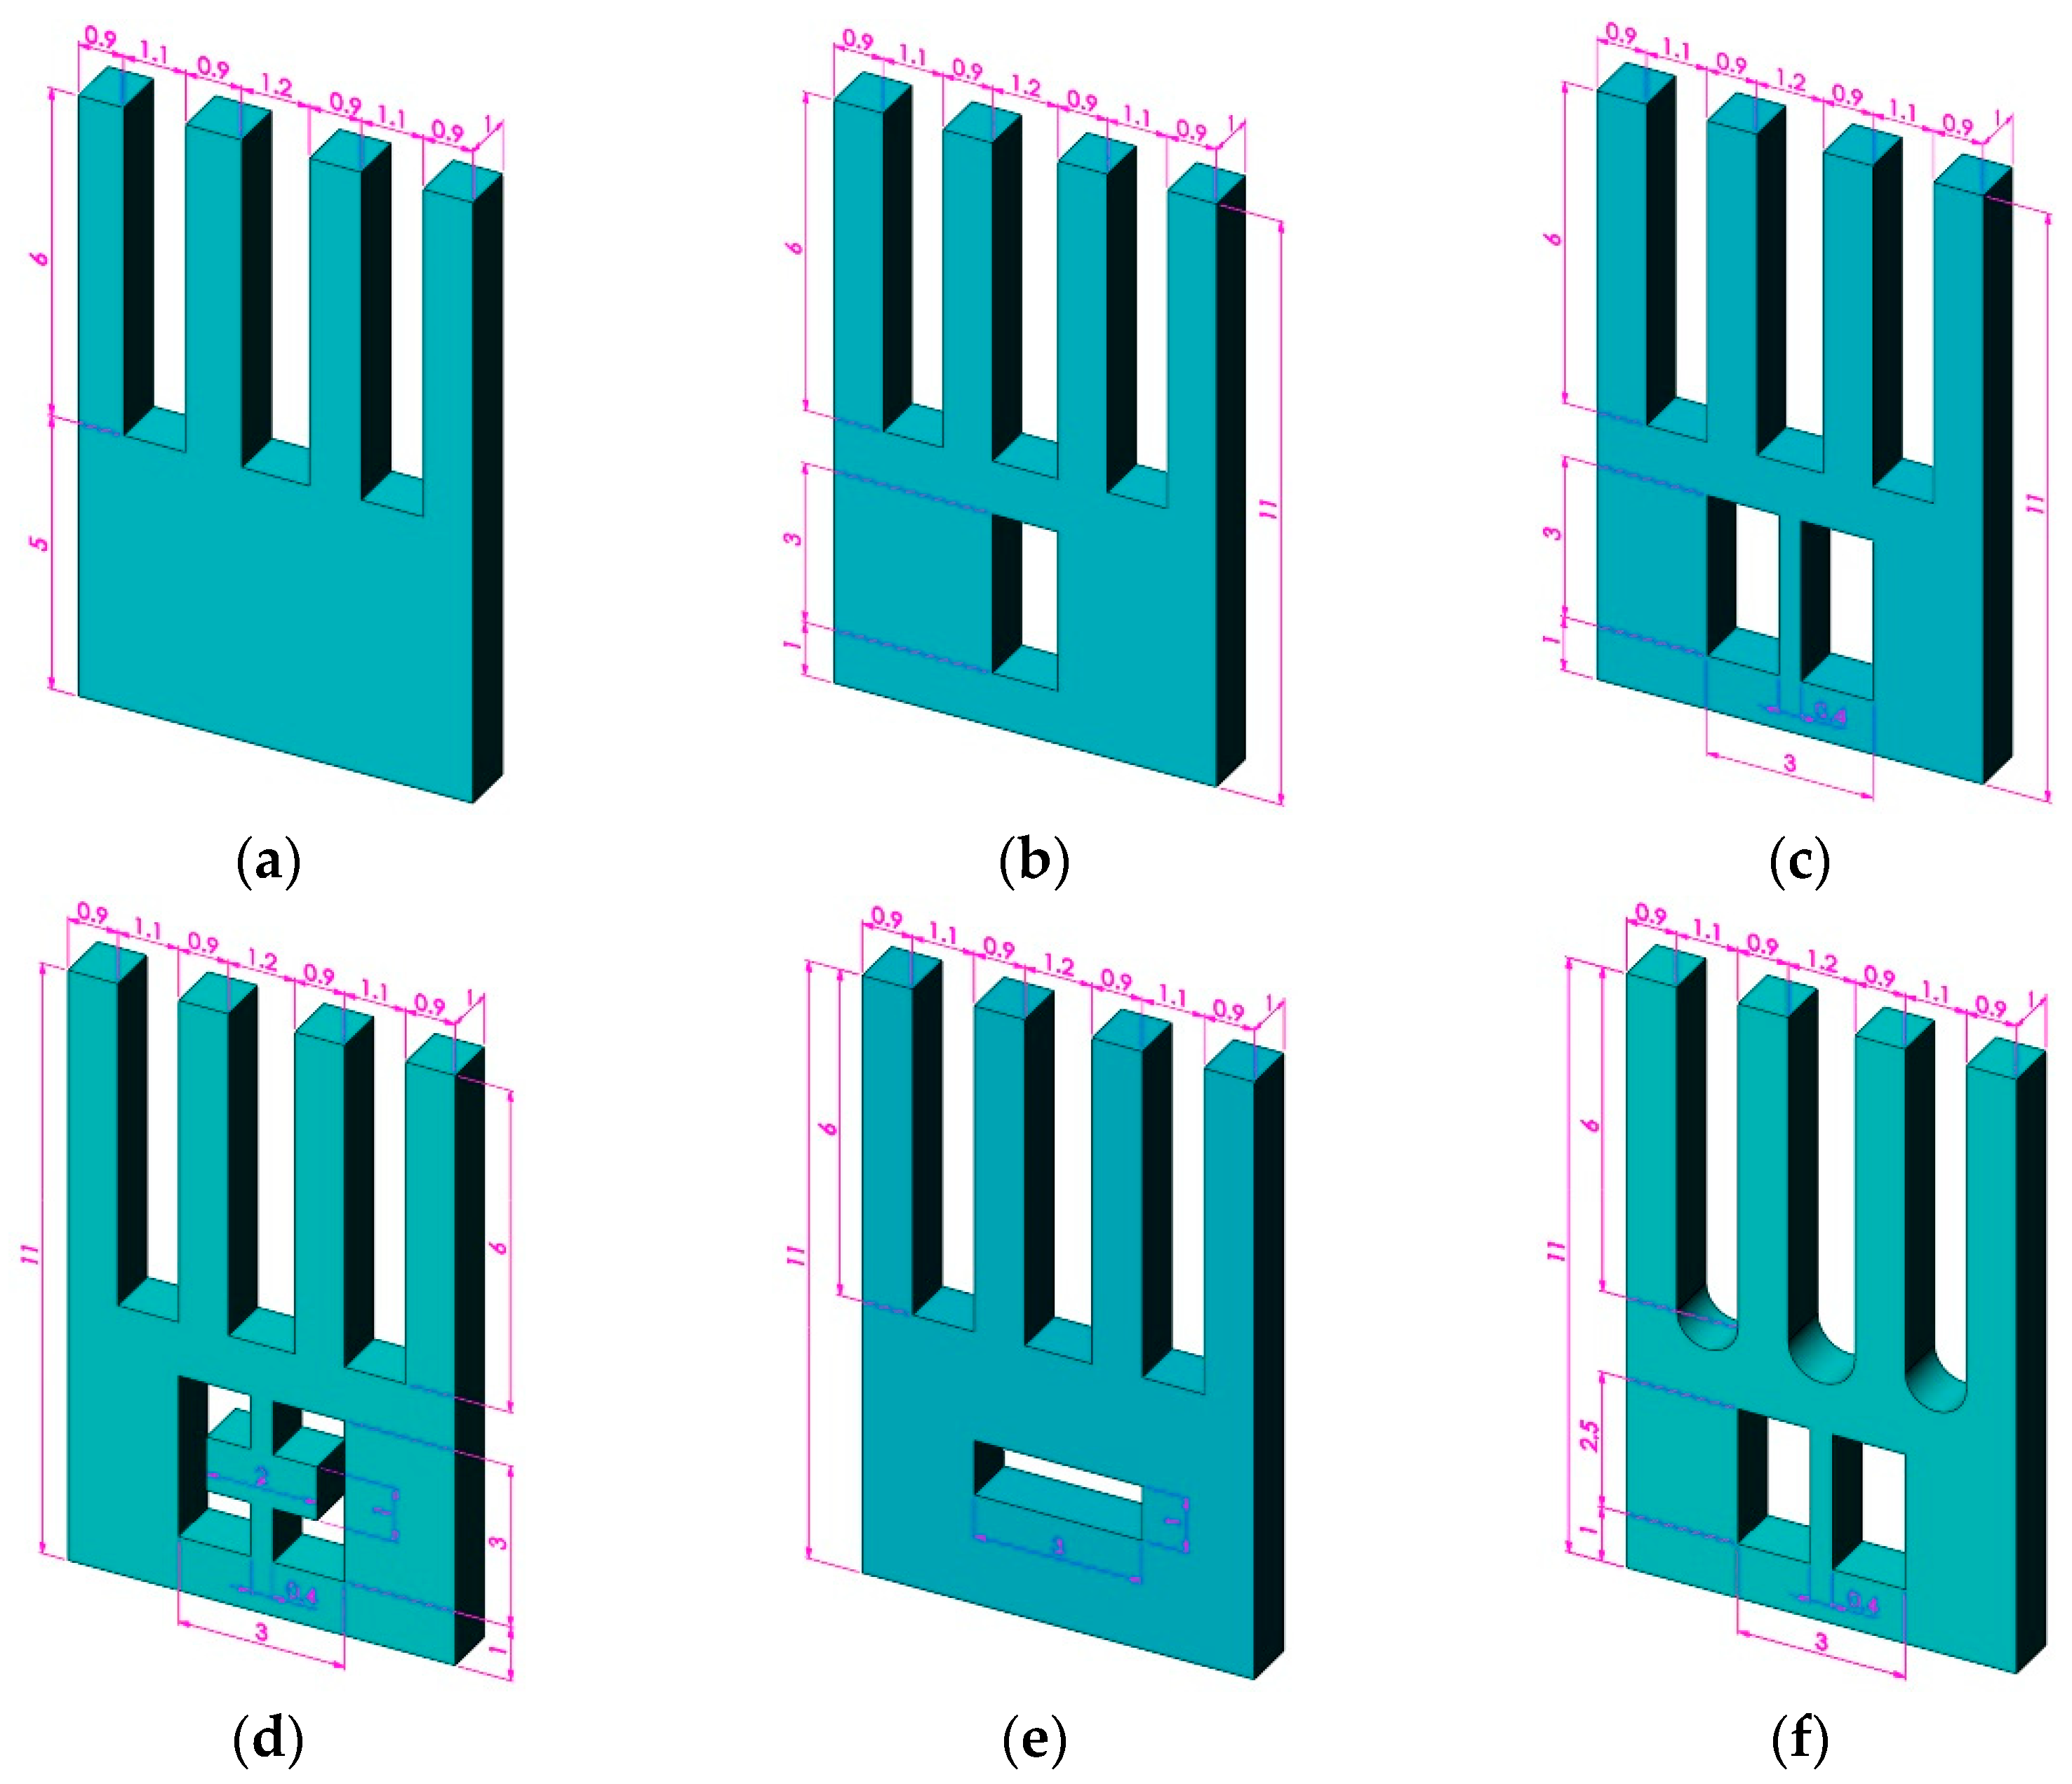
- Slotting on both sides of the base will increase the local torsional stiffness of the edge area of the base, which is not conducive to the transmission of Coriolis vibration. Slotting in the middle of the base will increase the local torsional stiffness of the middle area of the base, thereby hindering the loss of Coriolis vibration towards the middle direction, and playing a guiding and promoting role in the transmission of Coriolis vibration;
- (2)
- The decrease in drive–sense interval d1 reduces the distance between the drive tine and the sense tine, thereby reducing energy loss in the transmission process and improving the transmission efficiency;
- (3)
- The increase in drive–drive interval d2 increases the width of the base, thereby reducing the overall torsional stiffness of the base and facilitating the transmission of Coriolis vibration.
5. Conclusions
- (1)
- This gyroscope microstructure worked by transmitting vibrations between the drive tine and sense tine, relatively eliminating the kinematic coupling. It was credible to evaluate the transmission efficiency of Coriolis vibration by using the sensing mode, which can greatly reduce the amount of calculation required;
- (2)
- During gyroscope structural analysis, slotting in the middle of the base improved the transmission efficiency, and opening arc slots between the tines reduced the working modal order and frequency. Moreover, the base protruding slightly outward improved local symmetry to obtain better vibration performance;
- (3)
- The height of tines had a large influence on the frequency difference of working mode and the frequency of driving mode, while the tine interval had a large effect on the transmission efficiency of Coriolis vibration. Optimized by the Taguchi method, the transmission efficiency was improved by about 18%, and the working modal frequency was reduced by about 2.7 kHz. The improvement of these two indicators will further improve the mechanical sensitivity of the gyroscope microstructure.
Author Contributions
Funding
Acknowledgments
Conflicts of Interest
References
- Belyanin, L.N.; Vu, D.K. Nutation damping of dynamically tuned gyroscopes. In Proceedings of the MATEC Web of Conferences, Tomsk, Russia, 18–20 April 2017; p. 1008. [Google Scholar]
- Bencze, W.J.; Brumley, R.W.; Eglington, M.L.; Buchman, S. Precision electrostatic suspension system for the gravity probe B relativity mission’s science gyroscopes. In Proceedings of the SICE 2003 Annual Conference, Fukui, Japan, 4–6 August 2003; pp. 2726–2731. [Google Scholar]
- Di Virgilio, A.; Schreiber, K.U.; Gebauer, A.; Wells, J.P.; Tartaglia, A.; Belfi, J.; Beverini, N.; Ortolan, A. A laser gyroscope system to detect the Gravito-Magnetic effect on Earth. Int. J. Mod. Phys. D 2010, 19, 2331–2343. [Google Scholar] [CrossRef] [Green Version]
- Usui, R.; Ohno, A. Recent progress of fiber optic gyroscopes and applications at JAE. In Proceedings of the 2002 15th Optical Fiber Sensors Conference Technical Digest, Portland, OR, USA, 10 May 2002; pp. 11–14. [Google Scholar]
- Xu, Q.; Xiao, D.; Hou, Z.; Zhuo, M.; Li, W.; Xu, X.; Wu, X. A novel high-sensitivity butterfly gyroscope driven by horizontal driving force. IEEE Sens. J. 2019, 19, 2064–2071. [Google Scholar]
- Xia, D.; Yu, C.; Kong, L. The development of micromachined gyroscope structure and circuitry technology. Sensors 2014, 14, 1394–1473. [Google Scholar] [CrossRef] [PubMed] [Green Version]
- Guo, X.; Sun, C.; Wang, P.; Huang, L. Vision sensor and dual MEMS gyroscope integrated system for attitude determination on moving base. Rev. Sci. Instrum. 2018, 89, 015002. [Google Scholar] [CrossRef]
- Shkel, A.M. Micromachined gyroscopes: Challenges, design solutions, and opportunities. Smart Structures and Materials 2001: Smart Electronics and MEMS. Int. Soc. Opt. Photonics 2001, 4334, 74–85. [Google Scholar]
- Yazdi, N.; Ayazi, F.; Najafi, K. Micromachined inertial sensors. Proc. IEEE 1998, 86, 1640–1659. [Google Scholar] [CrossRef] [Green Version]
- Liu, K.; Zhang, W.; Chen, W.; Li, K.; Dai, F.; Cui, F.; Wu, X.; Ma, G.; Xiao, Q. The development of micro-gyroscope technology. J. Micromech. Microeng. 2009, 19, 113001. [Google Scholar] [CrossRef]
- Nguyen, M.N.; Ha, N.S.; Nguyen, L.Q.; Chu, H.M.; Vu, H.N. Z-Axis micromachined tuning fork gyroscope with low air damping. Micromachines 2017, 8, 42. [Google Scholar] [CrossRef]
- Weinberg, M.S.; Kourepenis, A. Error sources in in-plane silicon tuning-fork MEMS gyroscopes. J. Microelectromechanical Syst. 2006, 15, 479–491. [Google Scholar] [CrossRef]
- Wang, R.; Cheng, P.; Xie, F.; Young, D.; Hao, Z. A multiple-beam tuning-fork gyroscope with high quality factors. Sens. Actuators A Phys. 2011, 166, 22–33. [Google Scholar] [CrossRef]
- Li, Z.; Gao, S.; Jin, L.; Liu, H.; Guan, Y.; Peng, S. Design and mechanical sensitivity analysis of a MEMS tuning fork gyroscope with an anchored leverage mechanism. Sensors 2019, 19, 3455. [Google Scholar] [CrossRef] [PubMed] [Green Version]
- Zhao, Y.; Zhao, J.; Wang, X.; Xia, G.M.; Shi, Q.; Qiu, A.P.; Xu, Y.P. A sub-0.1°/h bias-instability split-mode MEMS gyroscope with CMOS readout circuit. IEEE J. Solid-State Circuits 2018, 53, 2636–2650. [Google Scholar] [CrossRef]
- Yang, C.; Li, H. Digital control system for the MEMS tuning fork gyroscope based on synchronous integral demodulato. IEEE Sens. J. 2015, 15, 5755–5764. [Google Scholar] [CrossRef]
- Zhang, Z.; Feng, L.; Sun, Y. Study on digital correlation demodulation technology of micro quartz tuning fork gyroscope. In Proceedings of the Conference on Advanced Sensor Systems and Applications IV, Beijing, China, 9 November 2010. [Google Scholar]
- Prikhodko, I.P.; Trusov, A.A.; Shkel, A.M. Compensation of drifts in high-Q MEMS gyroscopes using temperature self-sensing. Sens. Actuators A Phys. 2013, 201, 517–524. [Google Scholar] [CrossRef] [Green Version]
- Behbahani, A.H.; M’Closkey, R.T. Multimodal tuning of an axisymmetric resonator. J. Dyn. Syst. Meas. Control. 2019, 141, 091010. [Google Scholar] [CrossRef] [Green Version]
- Howard, H.G.; Behbahani, A.H.; Gibson, J.S.; M’Closkey, R.T. Adaptive cancellation of parasitic coupling. J. Microelectromechanical Syst. 2018, 27, 844–853. [Google Scholar]
- Li, C.; Yang, B.; Guo, X.; Wu, L. A digital calibration technique of MEMS gyroscope for closed-loop mode-matching control. Micromachines 2019, 10, 496. [Google Scholar] [CrossRef] [Green Version]
- Ge, H.H.; Behbahani, A.H.; M’Closkey, R.T. MEMS gyro drift compensation using multiple rate measurements derived from a single resonator. In Proceedings of the 2018 IEEE/ION Position, Location and Navigation Symposium (PLANS), Monterey, CA, USA, 23–26 April 2018; pp. 288–293. [Google Scholar]
- Trusov, A.A.; Prikhodko, I.P.; Zotov, S.A.; Shkel, A.M. Low-Dissipation silicon tuning fork gyroscopes for rate and whole angle measurements. IEEE Sens. J. 2011, 11, 2763–2770. [Google Scholar] [CrossRef]
- Bernstein, J.; Bancu, M.; Cook, E.; Henry, T.; Kwok, P.; Nyinjee, T.; Perlin, G.; Teynor, B.; Weinberg, M. Diamond hemispherical resonator fabrication by isotropic glass etch. In Proceedings of the Solid-State Sensors, Actuators, Microsystems Workshop, Hilton Head Island, SC, USA, 8–12 June 2014; pp. 273–276. [Google Scholar]
- Xu, Q.; Hou, Z.; Kuang, Y.; Miao, T.; Ou, F.; Zhuo, M.; Xiao, D.; Wu, X. A tuning fork gyroscope with a polygon-shaped vibration beam. Micromachines 2019, 10, 813. [Google Scholar] [CrossRef] [Green Version]
- Wu, X.; Xie, L.; Xing, J.; Dong, P.; Wang, H.; Su, J. A z-axis quartz tuning fork micromachined gyroscope based on shear stress detection. IEEE Sens. J. 2011, 12, 1246–1252. [Google Scholar] [CrossRef]
- Xu, P.; Wei, Z.; Jia, L.; Zhao, Y.; Han, G.; Si, C.; Ning, J.; Yang, F. ZRO drift reduction of MEMS gyroscopes via internal and packaging stress release. Micromachines 2021, 12, 1329. [Google Scholar] [CrossRef] [PubMed]
- Bai, B.; Li, C.; Zhao, Y. Development of an effective method to reduce mechanical coupling error in a micro quartz tuning fork gyroscope. Sens. Actuators A Phys. 2021, 332, 113058. [Google Scholar] [CrossRef]
- Bishop, R.E.D.; Johnson, D.C. The Mechanics of Vibration; Cambridge University Press: Cambridge, UK, 2011. [Google Scholar]
- Canel, T.; Zeren, M.; Sınmazçelik, T. Laser parameters optimization of surface treating of Al 6082-T6 with Taguchi method. Opt. Laser Technol. 2019, 120, 105714. [Google Scholar] [CrossRef]
- Bao, M.H. Micro mechanical transducers-pressure sensors, accelerometers and gyroscopes. In Handbook of Sensors and Actuators; Elsevier: Amsterdam, The Netherlands, 2000; pp. 139–198. [Google Scholar]

| Type | Harmonic Analysis | Modal Analysis | ||||||
|---|---|---|---|---|---|---|---|---|
| Amplitude A (μm) | Amplitude B (μm) | Phase A (°) | Phase B (°) | AB/AA | AB/AA | |||
| A | 24.1411 | 11.8684 | −0.622 | 179.407 | 0.4916 | 180.029 | 0.4806 | 180 |
| B | 23.0454 | 9.2162 | −0.750 | 179.273 | 0.3999 | 180.023 | 0.3983 | 180 |
| C | 23.6177 | 8.4889 | −0.765 | 179.260 | 0.3594 | 180.025 | 0.3561 | 180 |
| Type | Modal Frequency (Hz) | ŋ | |||
|---|---|---|---|---|---|
| Fifth Order | Sixth Order | Seventh Order | Eighth Order | ||
| A | 17,302.9 (#) | 17,369.6 (*) | 17,713.9 | -- | 0.4806 |
| B | -- | 18,460.3 | 18,658.5 (#) | 19,475.1 (*) | 0.3983 |
| C | -- | 18,676.9 | 19,198.2 (#) | 19,639.6 (*) | 0.3561 |
| D | -- | 19,343.1 | 19,384.1 (#) | 19,777.7 (*) | 0.3857 |
| E | -- | 19,106.6 (#) | 19,264.8 | 19,669.4 (*) | 0.4285 |
| F | -- | 18,565.9 (#) | 19,171.6 | 19,436.1 (*) | 0.4391 |
| G | -- | 18,598.8 (#) | 19,172.7 | 19,436.7 (*) | 0.4385 |
| H | -- | 19,186.2 (#) | 19,305.6 | 19,762.5 (*) | 0.3941 |
| I | -- | 17,394.5 (#) | 17,460.5 (*) | 17,961.3 | 0.4548 |
| Levels | A | B | C | D | E |
|---|---|---|---|---|---|
| h2 (mm) | d1 (mm) | d2 (mm) | w1 (mm) | h3 (mm) | |
| 1 | 3.5 | 0.6 | 0.66 | 0.12 | 1 |
| 2 | 4 | 0.7 | 0.76 | 0.16 | 1.5 |
| 3 | 4.5 | 0.8 | 0.86 | 0.2 | 2 |
| 4 | 5 | 0.9 | 0.96 | 0.24 | 2.5 |
| 5 | 5.5 | 1 | 1.06 | 0.28 | 3 |
| Levels | F |
|---|---|
| Mesh Size (mm) | |
| 1 | 0.06 |
| 2 | 0.08 |
| Feature Sizes | d0 | d1 | d2 | h1 | h2 | t | h3 | h4 | w1 | w2 |
|---|---|---|---|---|---|---|---|---|---|---|
| Initial Value (mm) | 0.46 | 0.8 | 0.86 | 3.5 | 4.5 | 0.5 | 2 | 0.5 | 0.2 | 1.19 |
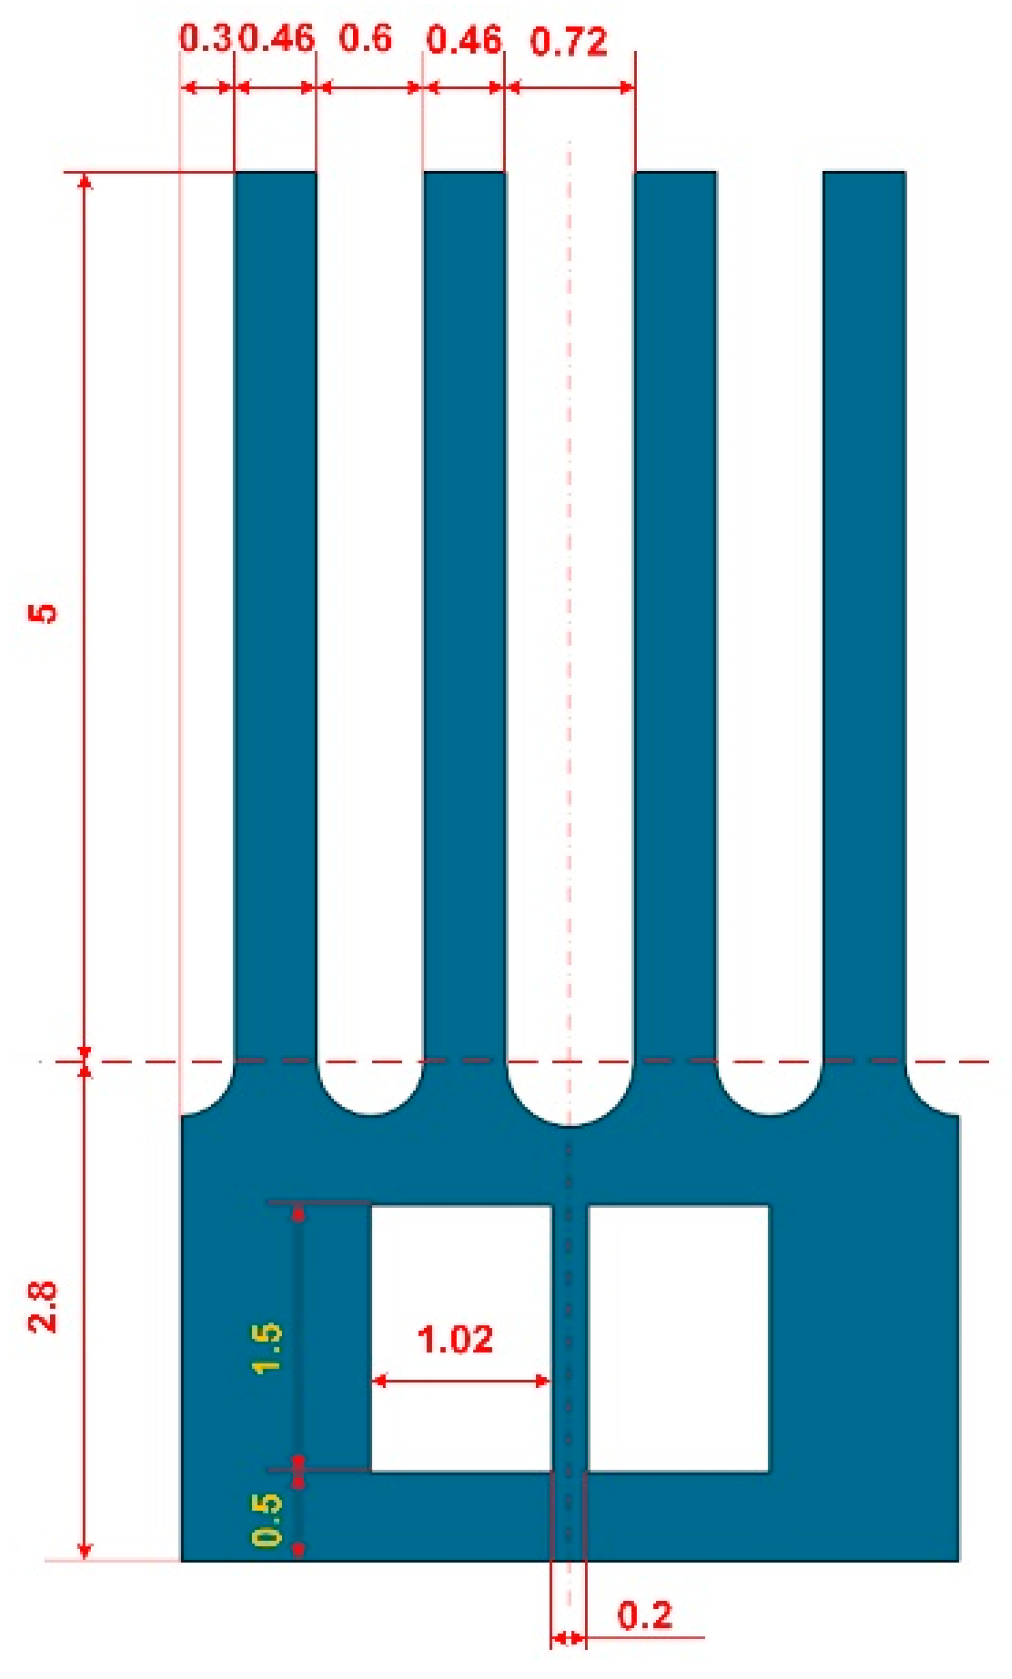
| Optimized Value (mm) | 0.46 | 0.6 | 0.72 | 2.8 | 5 | 0.5 | 1.5 | 0.5 | 0.2 | 1.02 |
| Drive Modal Order | Sense Modal Order | Drive Modal Frequency (Hz) | Sense Modal Frequency (Hz) | Frequency Difference ΔF (Hz) | The Transmission Efficiency ŋ | |
|---|---|---|---|---|---|---|
| Initial | 6 | 5 | 16,832.9 | 16,623.2 | 209.7 | 0.4632 |
| Optimized | 5 | 6 | 13,907.8 | 14,101.5 | 193.7 | 0.5466 |
Publisher’s Note: MDPI stays neutral with regard to jurisdictional claims in published maps and institutional affiliations. |
© 2022 by the authors. Licensee MDPI, Basel, Switzerland. This article is an open access article distributed under the terms and conditions of the Creative Commons Attribution (CC BY) license (https://creativecommons.org/licenses/by/4.0/).
Share and Cite
Xiong, C.; Zeng, P.; Lv, W.; Lu, F.; Zhang, M.; Huang, Y.; Zhu, F. Design and Optimization of a Novel MEMS Tuning Fork Gyroscope Microstructure. Micromachines 2022, 13, 172. https://doi.org/10.3390/mi13020172
Xiong C, Zeng P, Lv W, Lu F, Zhang M, Huang Y, Zhu F. Design and Optimization of a Novel MEMS Tuning Fork Gyroscope Microstructure. Micromachines. 2022; 13(2):172. https://doi.org/10.3390/mi13020172
Chicago/Turabian StyleXiong, Chuanguo, Pengjun Zeng, Weishan Lv, Fengming Lu, Ming Zhang, Yuhua Huang, and Fulong Zhu. 2022. "Design and Optimization of a Novel MEMS Tuning Fork Gyroscope Microstructure" Micromachines 13, no. 2: 172. https://doi.org/10.3390/mi13020172
APA StyleXiong, C., Zeng, P., Lv, W., Lu, F., Zhang, M., Huang, Y., & Zhu, F. (2022). Design and Optimization of a Novel MEMS Tuning Fork Gyroscope Microstructure. Micromachines, 13(2), 172. https://doi.org/10.3390/mi13020172