Abstract
Piezoelectric material properties were optimized to develop materials for an ultrasonic vibrator targeting a high vibration efficiency. Herein, novel materials were developed using a composition represented by 0.08Pb(Ni1/3Nb2/3)O3-0.07Pb(Mn1/3Nb2/3)O3-0.85Pb(Zr0.5Ti0.5)O3 + 0.3 wt.% CuO + 0.3 wt.% Fe2O3 with 0.3 wt.% Sb2O3 doping. A ceramic shape with a thickness of 2 mm was optimized using finite element analysis software, and high values of coupling factors (0.54) and mechanical quality factors (1151) were obtained. This ceramic was used to fabricate a bio-beauty device (frequency = 1 MHz), and the manufactured ultrasonic vibrator indicated that the actuator oscillated with the maximum amplitude at a frequency of 1.06 MHz.
1. Introduction
Ultrasonic vibrators using piezoelectric ceramics are devices based on the reverse piezoelectric effect, which convert electrical energy into mechanical energy. When an AC voltage is applied, ultrasonic energy matching the signal frequency is emitted, which can be used as an ultrasonic vibrator [1]. Piezoelectric vibrators are compact and lightweight, owing to their simple structure, and have a wide frequency band; therefore, they have a wide variety of applications, depending on the size of the center frequency. Additionally, they can be used under different vibration modes, depending on the shape of the piezoelectric ceramics, such as cylindrical, disk, and curved types [2,3]. Among these, there is a high demand for disk-type piezoelectric ceramics because they have the advantage of generating high power in a low frequency range when combined with metals [4].
For a piezoelectric material to be applied as an ultrasonic vibrator, electrical energy needs to be appropriately converted into mechanical energy because the element operates using elastic vibrations, and it is essential to develop a material that can simultaneously satisfy the piezoelectric properties of the electromechanical coupling factor (kt) and the mechanical quality factor (Qm) for reducing the heat loss during high-power operations [5,6,7,8].
To develop a material that meets the application requirements, relaxor ferroelectrics, an ABO3 type complex perovskite compound, are dissolved in the basic composition of PZT piezoelectric ceramics, or the piezoelectric property values are modified via various means by using a small amount of additives; research on this was continuously being conducted [9,10,11,12,13,14].
This study aimed to develop an ultrasonic vibrator for a bio-beauty device (frequency = 1 MHz) that comprises a piezoelectric ceramic with a novel composition and metal processing material. The vibrator requires large amplitudes and high precision for the actuation of bio-beauty devices. First, to develop piezoelectric materials for ultrasonic vibrators, with different composition ratios of relaxor materials, piezoelectric properties were compared and analyzed with the simultaneous substitution of Pb(Mn1/3Nb2/3)O3(PMN), a hard relaxor, into Pb(Ni1/3Nb2/3)O3-Pb(Zr0.5Ti0.5)O3 (PNN-PZT). Moreover, we investigated the effect of doping with Sb2O3 to increase the mechanical quality factor, as a hardener. Then, using a finite element analysis software (ATILA FEA, Micromechatronics, State college, PA, USA), the measured values of the developed piezoelectric materials were examined, and a resonance mode analysis was performed according to the change in the thickness of the piezoelectric ceramics. Based on the analysis results, an actual ultrasonic vibrator was fabricated, and its performance was evaluated by analyzing the ultrasonic waveforms output during operation.
2. Materials and Methods
In this study, PbO, ZrO2, TiO2, Nb2O5, NiO, MnO2, CuO, and Fe2O3 were used as starting materials (high purity powders, ≥98%, Kojundo Chemical Laboratory); 0.3 wt.% CuO and 0.3 wt.% Fe2O3 were added as sintering aids to lower the sintering temperature in the basic composition, (0.15-x)Pb(Ni1/3Nb2/3)O3–xPb(Mn1/3Nb2/3)O3–0.85Pb(Zr0.5Ti0.5)O3 (PNN–PMN–PZT, x = 0.01–0.13). Raw material powder and zirconia balls were mixed together in an ethanol solution for 24 h to weigh the powder according to the composition ratio and disperse it evenly; thereafter, they were dried for 4 h or more at 120 °C. Then, the powder was calcinated at 850 °C for 4 h, and an excess doping content of Sb2O3 was added (0.1–0.7 wt.%) to the prepared powder and mixed for 24 h. An appropriate amount of 10 wt.% poly vinyl alcohol (PVA) aqueous solution was added to the powder as a binder, and a pressure of ~10 MPa was applied to form a disk (diameter = 20 mm). For the molded ceramic to have a denser structure, a water pressure of 130 MPa was applied via cold isostatic pressing (CIP) followed by sintering. Then, sintering was conducted at 500 °C for 1 h to remove the binder and then at 1000 °C for 2 h. The degree of densification was confirmed by observing the microstructure of the sintered specimen using scanning electron microscopy (SEM, ThermoFisher, Waltham, MA, USA); the crystallographic structure was analyzed using X-ray diffraction (XRD, BRUKER, Billerica, MA, USA) analysis. The average particle size was calculated via linear intercept analysis, determined by counting the number of grains intersecting the parallel lines on the SEM image and dividing the length of the parallel lines by the number of grains intersecting the lines.
To measure the electrical properties of the sintered specimen, both sides were polished, and then an Ag electrode was annealed at 650 °C for 30 min. Thereafter, for the polarization treatment, a 3 kV/mm electric field was applied for 30 min in a silicone oil bath at 120 °C, followed by aging for 24 h in air. For the polarized specimen, the piezoelectric constant (d33) was measured using a d33 meter (Model YE2730, HANTECH, Gunpo, Korea), and the electromechanical coupling factor (kt) and mechanical quality factor (Qm) were calculated according to the IEEE standard method using an impedance analyzer (Model 4990A, Keysight Technologies Inc., Santa Rosa, CA, USA). The Curie temperature was measured by the change of capacitance of the sample at 1 kHz in a chamber system (Poly K Technologies, State College, PA, USA) and by correlating the change in the dielectric constant with the temperature change from 20 to 500 °C using an LCR meter (E4980, Agilent, Santa Clara, CA, USA).
A piezoelectric ceramic made of the developed material optimized through the above experiment was attached to the center of a circular titanium workpiece; this workpiece remained in direct contact with skin in the beauty device via conductive epoxy. The manufactured ultrasonic vibrator element was assembled with a PCB circuit board that could auto-oscillate when power was supplied, and the frequency and output waveforms of the electrical signal generated from the ultrasonic vibrator were measured using an oscilloscope (TBS 2000 SERIES, Tektronix, Beaverton, WA, USA).
3. Results and Discussion
Figure 1 shows the XRD patterns of the sintered ceramic for different composition ratios of PNN and PMN. As shown in Figure 1a, a pure perovskite structure was formed without secondary phases under all composition ranges. A (200)R rhombohedral diffraction line was formed with the increasing molar ratios of PMN, and phase change of the rhombohedral peak occurred due to the change in the crystal lattice when the diffraction pattern for 2-θ in the range of 43°–46° was enlarged. In Figure 1b, the relative intensity ratios of the tetragonal (002) and (200) peaks and rhombohedral (200) peak on the diffraction pattern are compared to calculate and show the tetragonal phase generation fraction of each specimen. The tetragonal phase content was calculated using the following formula:
where I(002)T and I(200)T indicate the tetragonal (002) and (200) diffraction peak intensities, respectively, and I(200)R denotes the rhombohedral (200) diffraction peak intensities [10]. The tetragonal phase fraction calculated decreased from 80% to 61% as the PMN molar ratio increased.
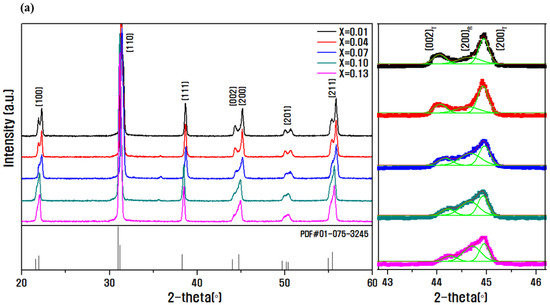
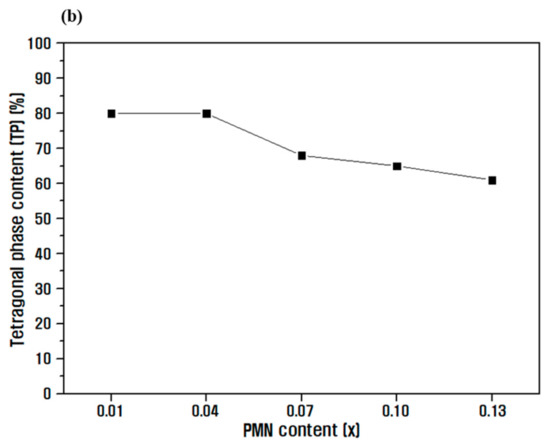
Figure 1.
(a) X-ray diffraction pattern analysis results according to PMN molar ratio, and (b) tetragonal phase fraction results in the (0.15-x)Pb(Ni1/3Nb2/3)O3-xPb(Mn1/3Nb2/3)O3-0.85Pb(Zr0.5Ti0.5)O3 ceramic.
Figure 2a shows SEM images of the microstructure of the fracture surface of the sintered PNN-PMN-PZT ceramics with different composition ratios. In certain portions of all compositions, grain boundaries were not observed. According to Li [15], this can be attributed to the addition of CuO and Fe2O3, which helps form a liquid phase at a low temperature. With PbO-CuO (680 °C) and PbO-Fe2O3 (730 °C), the bonding between the grain boundaries is strengthened, but the internal strength is weakened owing to internal defects, and the area of transgranular fractures increases [16]. Zheng et al. [17] reported that when rhombohedral phase stabilization is achieved, the particle size decreases owing to the improvement of internal stress. Although the grain size was not accurately measured owing to the transgranular fracture, the overall grain size tends to decrease as the PMN molar ratio increases.
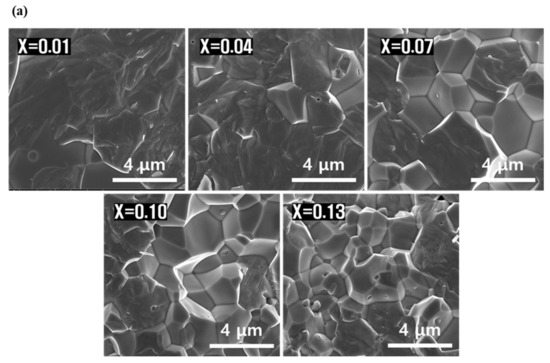
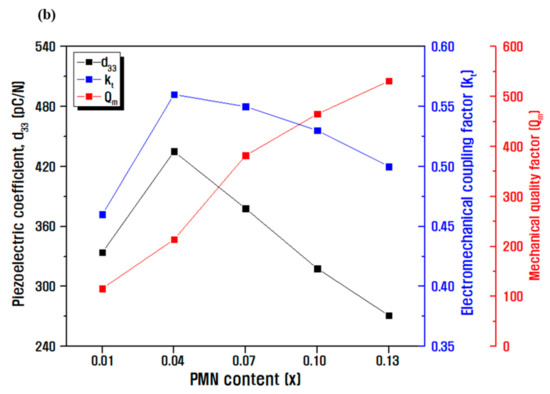
Figure 2.
(a) FE-SEM images of fracture surfaces with different PMN molar ratios and (b) measurement results of electrical properties in (0.15-x)Pb(Ni1/3Nb2/3)O3-xPb(Mn1/3Nb2/3)O3-0.85Pb(Zr0.5Ti0.5)O3 ceramic.
Figure 2b shows the measurement results of electrical characteristics for different composition ratios. The piezoelectric coefficient and electromechanical coupling coefficient were maximum in the composition with x = 0.04; as the PMN molar ratio increased, these coefficients decreased in proportion to the particle size. A higher mechanical quality factor leads to changes to the domain motion, which is inversely proportional to the internal stress; therefore, as the PMN molar ratio increases, the particle size decreases, and the internal stress improves, making it difficult to move the domain. It is considered that the mechanical quality factor continues to increase [18,19,20,21].
A decrease in the tetragonal phase fraction is confirmed in Figure 1. In addition, to improve the value of the mechanical quality factor while maintaining the characteristic value at x = 0.07, along with excellent piezoelectric and electromechanical coefficients of 378 pC/N and 0.55, respectively, an experiment was conducted to add a doping material, Sb2O3, as a hardener.
Figure 3 shows the XRD patterns with Sb2O3 as the dopant in 0.08PNN-0.07PMN-0.85PZT. In Figure 3a, when Sb2O3 was added, the Sb3+ (0.76 Å) ion had a similar ionic radius and occupied the high valence Zr4+ (0.72 Å) site, resulting in stabilizing the isotropic rhombohedral phase. With an increasing Sb2O3 dopant content, the (200)R diffraction line between 43° and 46° was enhanced [22]. Figure 3b also quantitatively confirms that the tetragonal phase fraction gradually decreased due to the phase transition to the rhombohedral phase with increasing amounts of Sb2O3.
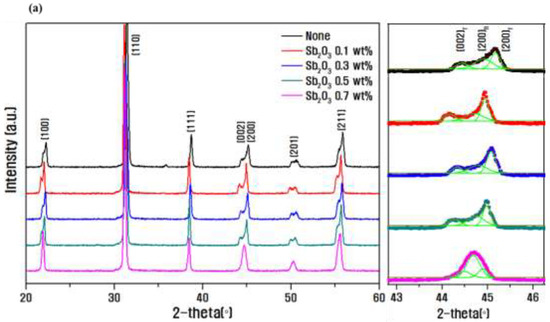
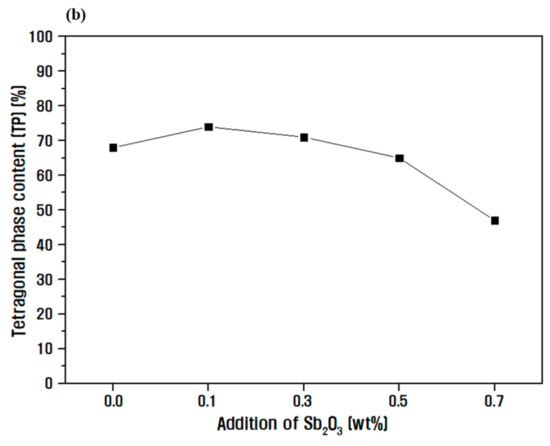
Figure 3.
(a) Results of X-ray diffraction pattern analysis with different Sb2O3 doping amounts in 0.08Pb(Ni1/3Nb2/3)O3-0.07Pb(Mn1/3Nb2/3)O3-0.85Pb(Zr0.5Ti0.5)O3 ceramics and (b) tetragonal phase fraction results.
Figure 4 shows the SEM images and density of the microstructures of the fracture surfaces of PNN-PMN-PZT ceramics with different Sb2O3 doping amounts. Figure 4a shows a dense microstructure under all conditions; the average grain size decreased from 2.43 to 1.17 μm with increasing Sb2O3 doping amount [23,24]. Figure 3 confirms that the internal stress in the lattice improved with decreasing crystal size, and phase transition to the rhombohedral phase occurred. As seen in the SEM images, Figure 4b shows a dense structure without pores when Sb2O3 is added, resulting in an excellent value of ~98% relative density with a maximum value of 7.97 g/cm3. The high density can be related to the liquid phase formation due to the low melting point (656 °C) of Sb2O3. It was confirmed that the density also decreased with decreasing particle size.
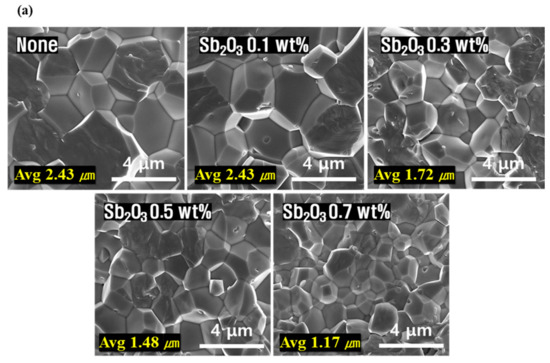
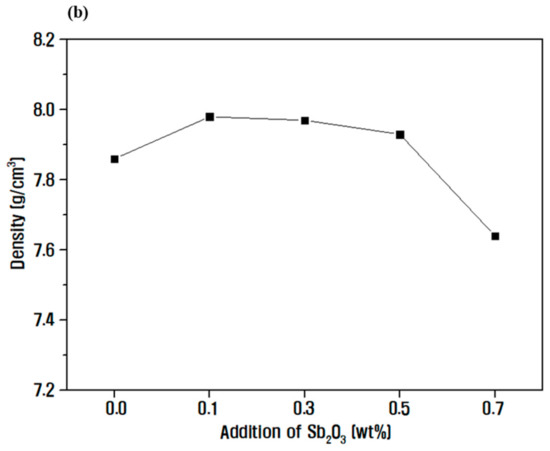
Figure 4.
(Inset) FE-SEM images of fracture surfaces with different Sb2O3 doping amounts in 0.08Pb(Ni1/3Nb2/3)O3-0.07Pb(Mn1/3Nb2/3)O3-0.85Pb(Zr0.5Ti0.5)O3 ceramic; (a) average grain size and (b) density measurement results.
Figure 5 shows the evaluated electrical characteristics for different Sb2O3 doping amounts. In Figure 5a, it is confirmed that the piezoelectric constant and electromechanical coupling coefficient decreased with decreasing polarization efficiency and average grain size due to the decrease in anisotropy with an increasing amount of Sb2O3. However, as Sb3+ was substituted at the B-site, space charges were formed owing to the occurrence of oxygen vacancies, and an internal electric field was generated in the ceramic particles, which suppressed the movement of the domains, increasing the mechanical quality factor. When the doping amount was >0.3 wt.%, the mechanical quality factor decreased, which implies a decrease with decreasing density [25]. Figure 5b confirms the Curie temperature at the point at which the dielectric constant is the highest, determined by measuring the dielectric properties according to the temperature change at 1 kHz. All the samples possessed a highly stable curve below the Curie temperature, indicating a good ferroelectric-stable characteristics. In the phase transition region, the movement of the interphase boundary induced an energy loss abruptly, leading to the loss peak around the Curie temperature. The Curie temperature was 275 °C at 0.3 wt.% Sb2O3, implying a maximum mechanical quality factor [26,27].
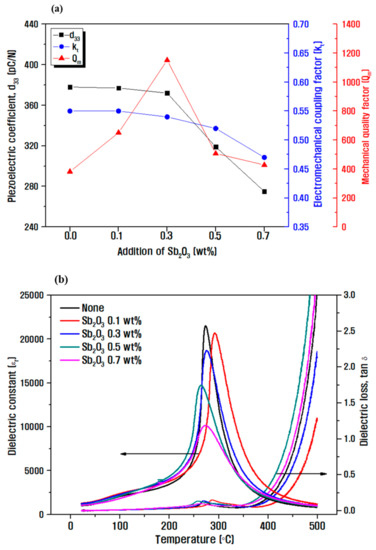
Figure 5.
(a) Electrical characteristics of 0.08Pb(Ni1/3Nb2/3)O3-0.07Pb(Mn1/3Nb2/3)O3-0.85Pb(Zr0.5Ti0.5)O3 according to different Sb2O3 doping amounts, and (b) dielectric properties according to the temperature change at 1 kHz measurement.
By adding 0.3 wt.% Sb2O3 doping material to the optimized composition of 0.08PNN-0.07PMN-0.85PZT, d33 = 372 pC/N, kt = 0.54, the mechanical quality factor increased to 1151 without significant deterioration in properties compared to the basic composition, and thus, a piezoelectric material for ultrasonic vibrators was developed. These excellent piezoelectric properties show superior values compared to those of conventional commercially available materials; thus, the findings of this study are expected to provide insights for developing new compositions without the need for expensive rare elements.
Before manufacturing the ultrasonic transducer, simulation was performed using the piezoelectric analysis program (ATILA) to optimize the size of the piezoelectric body. The natural frequency of the piezoelectric ceramic was determined based on the piezoelectric constant and material dimensions, and each frequency region used different vibration modes. Typically, when an AC voltage is applied to piezoelectric ceramics, two resonance modes appear. First, the resonance occurring at the lowest frequency is a radial vibration mode, and at this time, the resonance and anti-resonance frequencies and resonance resistance values affect the electromechanical coupling coefficient and mechanical quality coefficient [28,29,30]. Second, the thickness vibration mode of piezoelectric ceramics occurring at high frequencies is the most important vibration mode for transmitting and receiving ultrasonic waves, and the center frequency of the vibrator strongly depends on the thickness of the piezoelectric ceramics [31]. Therefore, to analyze the resonance mode according to the change in thickness, the diameter (D) of the ceramic was fixed to 16 mm, which is the diameter after sintering, and the models were designed with four thicknesses (T), namely 0.8, 1.2, 1.6, and 2.0 mm. For the characteristic values such as d33, density, and dielectric constant of the piezoelectric ceramic, values measured from the previously optimized sample were input. To determine the frequency band where resonance occurred, modal analysis was conducted; it was confirmed that the largest resonance characteristic appeared with a coupling factor of 30% near 141 kHz. Based on the frequency values determined via modal analysis, the frequency range was determined, and then, harmonic analysis was performed to predict the resonance mode and impedance characteristics.
Figure 6 shows the results of the impedance characteristic analysis for different thicknesses of the piezoelectric ceramic via piezo simulation analysis and the results of the impedance analysis for operation of the ultrasonic vibrator element at different frequencies. In the radial vibration mode, the resonant frequency of 139 kHz and anti-resonant frequency of 161 kHz were the same irrespective of the different thickness of the ceramic at the same position. The result of analyzing the resonance mode occurred at a high frequency (Figure 6b). In the thickness vibration mode, for ceramic thicknesses of 0.8 and 2.0 mm, the center frequencies were 2.56 and 1.04 MHz, respectively, confirming the decrease in frequency [32,33,34].
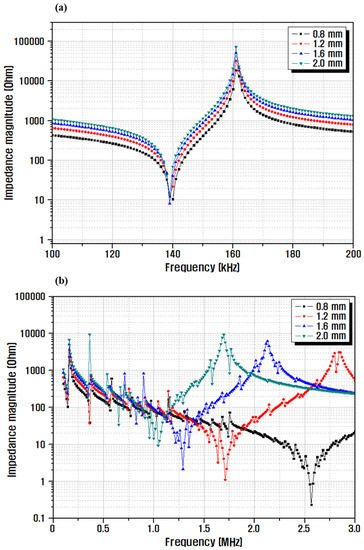
Figure 6.
Simulation results of impedance characteristics for different thicknesses of piezoelectric ceramics: (a) radial, and (b) thickness vibration mode.
Figure 7 shows a comparison between the simulation and impedance analysis results for different frequencies using the fabricated sample. Beauty devices that are in contact with the skin typically use a frequency of 1 MHz; therefore, according to the simulation results, the piezoelectric ceramic was manufactured with a thickness of 2 mm, and the center frequency was 1 MHz. Comparing the impedance and simulation results in the radial vibration mode in Figure 7a, the resonant frequency of the actual sample was slightly lowered, from 139 to 135 kHz, and a low impedance of 2.6 Ω was obtained at that frequency. If the difference between the resonance frequencies of the radial vibration and the thickness direction vibration of the piezoelectric ceramic is >10 times, the radial vibration and thickness direction vibration do not affect each other. However, in the case of a ceramic with a thickness of 2 mm, as shown in Figure 7b, the center frequency in the thickness direction vibration mode is 1.06 MHz, and the difference in the resonance frequency in the radial vibration mode is small; therefore, the thickness direction vibration of the fabricated sample is mild. This also influences the directional vibration characteristics [35]. The center frequency in the vibration mode in the thickness direction of the actual sample exhibited a value almost identical to 1.04 MHz in the simulation analysis result; however, it can be seen that the difference in impedance value occurred when resonance occurs. This is attributed to the thickness deviation that occurs during grinding to 2 mm.
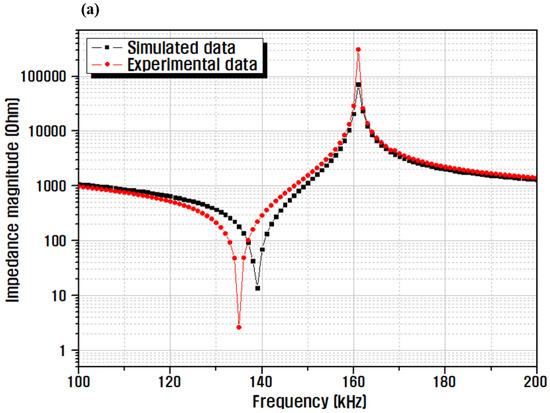
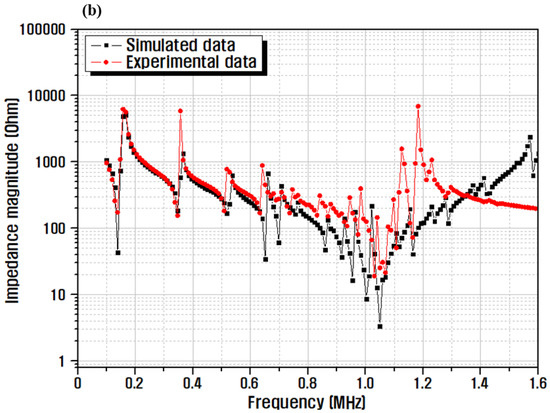
Figure 7.
Simulation and impedance analysis results, according to the frequency of the fabricated sample: (a) radial, and (b) thickness vibration mode.
The experimental apparatus for performance evaluation of the fabricated ultrasonic vibrator and the analysis results of the ultrasonic output waveform are presented in Figure 8. To measure the center frequency and waveform of the ultrasonic vibrator fabricated seen in Figure 8a, a self-oscillating PCB circuit that induces oscillation of the vibrator by generating a sinusoidal oscillation frequency and an ultrasonic vibrator were assembled. A voltage of 24 V was applied to the circuit, and the signal output from the oscillation of the ultrasonic vibrator at the center frequency was confirmed by connecting it to the oscilloscope equipment. By enlarging the detailed waveform of the modulated signal from the entire waveform in Figure 8b, the maximum amplitude was shown to oscillate at a frequency of 1.06 MHz, as shown in Figure 8c. The maximum output waveform yielded a value of 28 V. The simulation value was 1.04 MHz, but there was no significant difference at 1.06 MHz in the waveform measurement results of the fabricated sample.
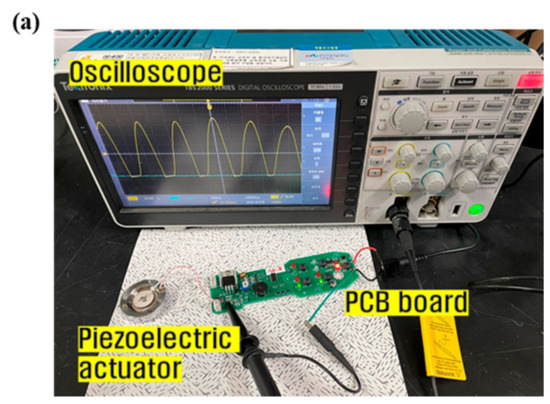
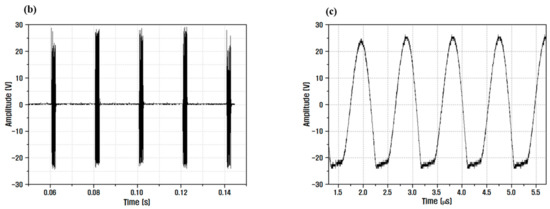
Figure 8.
(a) Experimental apparatus for performance evaluation of ultrasonic vibrator, analysis results of (b) ultrasonic output waveform, and (c) detailed waveform.
4. Conclusions
In this study, to develop a material for an ultrasonic vibrator, piezoelectric material properties were optimized for different molar ratios of PNN and PMN, and varying amounts of Sb2O3 doping material were added for the optimized Pb(Ni1/3Nb2/3)O3-Pb(Mn1/3Nb2/3)O3-Pb(Zr0.5Ti0.5)O3 composition.
When 0.3 wt.% Sb2O3 dopant was added to the basic composition of 0.08PNN-0.07PMN-0.85PZT + 0.3 wt.% CuO + 0.3 wt.% Fe2O3, it was confirmed that the composition could be used in practical applications with a high-efficiency ultrasonic vibrator, as it exhibited excellent characteristic values of d33 = 372 pC/N, kt = 0.54, Qm = 1151, and Tc = 275 °C. As per the resonance mode analysis results for the different ceramic thicknesses, using the piezoelectric analysis tool, it was determined that the center frequency was 1.04 MHz when the ceramic diameter was 16 mm and thickness was 2 mm. An ultrasonic vibrator for a bio-beauty device was manufactured using the optimized ceramic material. Output waveform analysis of the manufactured ultrasonic vibrator revealed that the vibrator oscillated with maximum amplitude at a frequency of 1.06 MHz, which is almost identical to the designed value. Thus, by developing a material with a high electromechanical coupling coefficient, a high mechanical quality factor, and an optimized ceramic shape, an ultrasonic vibrator capable of stably generating ultrasonic waves at a target driving frequency was developed, and its applicability to various actuator devices was confirmed.
Author Contributions
Conceptualization, H.-C.L. and S.-W.K.; methodology, S.-W.K.; software, S.-W.K.; validation, H.-C.L. and S.-W.K.; formal analysis, S.-W.K.; investigation, S.-W.K.; resources, S.-W.K.; data curation, S.-W.K.; writing—Original draft preparation, S.-W.K.; writing—Review and editing, H.-C.L.; visualization, S.-W.K.; supervision, H.-C.L.; project administration, H.-C.L.; funding acquisition, H.-C.L. All authors have read and agreed to the published version of the manuscript.
Funding
This study was supported by the Industrial Technology Innovation Program (Grant No. 20011196) funded by the Ministry of Trade, Industry, and Energy (MOTIE) and the Priority Research Centers Program (2017R1A6A1A03015562) through the National Research Foundation (NRF), funded by the Ministry of Education.
Data Availability Statement
The data presented in this study are contained within the article.
Conflicts of Interest
The authors declare no conflict of interest.
References
- Zhou, Q.; Lam, K.H.; Zheng, H.; Qiu, W.; Shung, K.K. Piezoelectric single crystal ultrasonic transducers for biomedical applications. Prog. Mater. Sci. 2014, 66, 87–111. [Google Scholar] [CrossRef]
- Chen, D.; Wang, L.; Luo, X.; Fei, C.; Li, D.; Shan, G.; Yang, Y. Recent development and perspectives of optimization design methods for piezoelectric ultrasonic transducers. Micromachines 2021, 12, 779. [Google Scholar] [CrossRef]
- Sherrit, S.; Wiederick, H.D.; Mukherjee, B.K.; Sayer, M. An accurate equivalent circuit for the unloaded piezoelectric vibrator in the thickness mode. J. Phys. D Appl. Phys. 1997, 30, 2354–2363. [Google Scholar] [CrossRef]
- Han, J.S.; Gal, C.W.; Park, J.M.; Park, S.J. Powder injection molding of PNN-PMN-PZN doped low temperature sintering PZT ceramics. J. Manuf. Process. 2017, 28, 235–242. [Google Scholar] [CrossRef]
- Yang, Z.; Chao, X.; Zhang, R.; Chang, Y.; Chen, Y. Fabrication and electrical characteristics of piezoelectric PMN-PZN-PZT ceramic transformers. Mater. Sci. Eng. B Solid-State Mater. Adv. Technol. 2007, 138, 277–283. [Google Scholar] [CrossRef]
- Joo, H.; Kim, I.; Song, J.; Jeong, S.; Kim, M. Piezoelectric properties of rosen-type piezoelectric transformer using 0.01Pb(Ni1/3Nb2/3)O3-0.08Pb(Mn1/3Nb2/3)O3-0.19Pb(Zr0.505Ti0.495)O3 ceramics. J. Kor. Phys. Soc. 2010, 56, 374–377. [Google Scholar] [CrossRef]
- Yoo, J. High dielectric and piezoelectric properties of low-temperature sintering PNN-PMN-PZT ceramics for low-loss piezoelectric actuator application. Trans. Electr. Electron. Mater. 2018, 19, 249–253. [Google Scholar] [CrossRef]
- Ra, C.M.; Yoo, J.H. Dielectric and piezoelectric properties of PMW-PNN-PZT ceramics as a function of ZnO addition. J. Korean Inst. Electr. Electron. Mater. Eng. 2015, 28, 165–169. [Google Scholar] [CrossRef]
- Li, H.L.; Zhang, Y.; Zhou, J.J.; Zhang, X.W.; Liu, H.; Fang, J.Z. Phase structure and electrical properties of xPZN-(1-x)PZT piezoceramics near the tetragonal/rhombohedral phase boundary. Ceram. Int. 2015, 41, 4822–4828. [Google Scholar] [CrossRef]
- Zhang, J.; Zhang, Y.; Yan, Z.; Wang, A.; Jiang, P.; Zhong, M. Fabrication and performance of PNN-PZT piezoelectric ceramics obtained by low-temperature sintering. Sci. Eng. Compos. Mater. 2020, 27, 359–365. [Google Scholar] [CrossRef]
- Stevenson, T.; Martin, D.G.; Cowin, P.I.; Blumfield, A.; Bell, A.J.; Comyn, T.P.; Weaver, P.M. Piezoelectric materials for high temperature transducers and actuators. J. Mater. Sci. Mater. Electron. 2015, 26, 9256–9267. [Google Scholar] [CrossRef]
- Nie, R.; Zhang, Q.; Yue, Y.; Liu, H.; Chen, Y.; Chen, Q.; Zhu, J.; Yu, P.; Xiao, D. Phase structure-electrical property relationships in Pb(Ni1/3Nb2/3)O3-Pb(Zr,Ti)O3-based ceramics. J. Appl. Phys. 2016, 119, 124111. [Google Scholar] [CrossRef]
- Zheng, M.P.; Hou, Y.D.; Ge, H.Y.; Zhu, M.K.; Yan, H. Effect of NiO additive on microstructure, mechanical behavior and electrical properties of 0.2PZN-0.8PZT ceramics. J. Eur. Ceram. Soc. 2013, 33, 1447–1456. [Google Scholar] [CrossRef]
- Hamzioui, L.; Kahoul, F.; Boutarfaia, A. The effect of Nb2O5 addition on the structural, dielectric and piezoelectric properties of Pb0.98Ba0.02[(Zr0.52Ti0.48)0.98(Cr3+0.5,Ta5+0.5)0.02] ceramics. Energy Proc. 2015, 74, 198–204. [Google Scholar] [CrossRef][Green Version]
- Li, S.; Fu, J.; Zuo, R. Middle-low temperature sintering and piezoelectric properties of CuO and Bi2O3 doped PMS-PZT based ceramics for ultrasonic motors. Ceram. Int. 2021, 47, 20117–20125. [Google Scholar] [CrossRef]
- Jeong, Y.; Yoo, J.; Lee, S.; Hong, J. Piezoelectric characteristics of low temperature sintering Pb(Mn1/3Nb2/3)O3-Pb(Ni1/3Nb2/3)O3-Pb(Zr0.50Ti0.50)O3 according to the addition of CuO and Fe2O3. Sens. Actuators A Phys. 2007, 135, 215–219. [Google Scholar] [CrossRef]
- Zheng, M.; Hou, Y.; Zhu, M.; Zhang, M.; Yan, H. Shift of morphotropic phase boundary in high-performance fine-grained PZN-PZT ceramics. J. Eur. Ceram. Soc. 2014, 34, 2275–2283. [Google Scholar] [CrossRef]
- Hamzioui, L.; Kahoul, F.; Boutarfaia, A.; Guemache, A.; Hamzioui, L.; Kahoul, F.; Boutarfaia, A.; Guemache, A.; Aillerie, M.; Hamzioui, L.; et al. Structure, dielectric and piezoelectric properties of Pb [(Zr0.45,Ti0.5)(Mn0.5,Sb0.5)0.05]O3 ceramics. Process. Appl. Ceram. 2021, 14, 19–24. [Google Scholar] [CrossRef]
- Kalem, V.; Timucin, M. Structural, piezoelectric and dielectric properties of PSLZT-PMnN ceramics. J. Eur. Ceram. Soc. 2013, 33, 105–111. [Google Scholar] [CrossRef]
- Yoo, J.; Kim, T.; Lee, E.; Choi, N.G.; Jeong, H.S. Physical properties of PNN-PMN-PZT doped with zinc oxide and CLBO for ultrasonic transducer. Trans. Electr. Electron. Mater. 2017, 18, 334–337. [Google Scholar] [CrossRef]
- Kim, H.T.; Ji, J.H.; Kim, B.S.; Baek, J.S.; Koh, J.H. Engineered hard piezoelectric materials of MnO2 doped PZT-PSN ceramics for sensors applications. J. Asian Ceram. Soc. 2021, 9, 1083–1090. [Google Scholar] [CrossRef]
- Peng, Z.H.; Zheng, D.Y.; Zhou, T.; Yang, L.; Zhang, N.; Fang, C. Effects of Co2O3 doping on electrical properties and dielectric relaxation of PMS–PNN–PZT ceramics. J. Mater. Sci. Mater. Electron. 2018, 29, 5961–5968. [Google Scholar] [CrossRef]
- Dinh Tung Luan, N.; Vuong, L.D.; Van Chuong, T.; Truong Tho, N. Structure and physical properties of PZT-PMnN-PSN ceramics near the morphological phase boundary. Adv. Mater. Sci. Eng. 2014, 2014, 821404. [Google Scholar] [CrossRef]
- Mahmud, I.; Yoon, M.S.; Ur, S.C. Antimony oxide-doped 0.99Pb(Zr0.53Ti0.47)O3-0.01Bi(Y1−xSbx)O3 piezoelectric ceramics for energy-harvesting applications. Appl. Sci. 2017, 7, 960. [Google Scholar] [CrossRef]
- Kim, I.; Kim, M.; Jeong, S.; Song, J.; Joo, H.; Thang, V.V.; Muller, A. Properties of step-down multilayer piezo stack transformers using PNN-PMN-PZT ceramics with CeO2 addition. J. Kor. Phys. Soc. 2011, 58, 580–584. [Google Scholar] [CrossRef]
- Zhuo, Z.; Ling, Z.; Liu, Y. Phase composition and piezoelectric properties of Pb(Sb1/2Nb1/2)–PbTiO3–PbZrO3 ceramics. J. Mater. Sci. Mater. Electron. 2018, 29, 9524–9530. [Google Scholar] [CrossRef]
- Menasra, H.; Necira, Z.; Bouneb, K.; Maklid, A.; Boutarfaia, A. Microstructure and dielectric properties of Bi substituted PLZMST ceramics. Mater. Sci. Appl. 2013, 4, 293–298. [Google Scholar] [CrossRef][Green Version]
- Lin, S. Study on the radial vibration of a new type of composite piezoelectric transducer. J. Sound Vib. 2007, 306, 192–202. [Google Scholar] [CrossRef]
- Lin, S.; Hu, J.; Fu, Z. Electromechanical characteristics of piezoelectric ceramic transformers in radial vibration composed of concentric piezoelectric ceramic disk and ring. Smart Mater. Struct. 2013, 22, 045018. [Google Scholar] [CrossRef]
- Meyer, Y.; Lachat, R. Vibration characterization procedure of piezoelectric ceramic parameters—Application to low-cost thin disks made of piezoceramics. MATEC Web Conf. 2015, 20, 01003. [Google Scholar] [CrossRef]
- Kim, D.J.; Oh, S.H.; Kim, J.O. Measurements of radial in-plane vibration characteristics of piezoelectric disk transducers. Trans. Kor. Soc. Noise Vib. Eng. 2015, 25, 13–23. [Google Scholar] [CrossRef]
- Kim, J.-W.; Park, C.-H.; Chong, H.-H.; Jeong, S.-S.; Park, T.-G. Design and fabrication of a thin-type ultrasonic motor. J. Kor. Inst. Electr. Electron. Mater. Eng. 2010, 23, 525–529. [Google Scholar] [CrossRef][Green Version]
- Wang, G.; Qin, L.; Wang, L.K. Non direction high-frequency underwater transducer. Second Int. Conf. Smart Mater. Nanotechnol. Eng. 2009, 7493, 749354. [Google Scholar] [CrossRef]
- Kim, J.O.; Lee, J.G.; Chun, H.Y. Radial vibration characteristics of spherical piezoelectric transducers. Ultrasonics 2005, 43, 531–537. [Google Scholar] [CrossRef]
- Piao, C.; Kim, J.O. Vibration characteristics of an ultrasonic transducer of two piezoelectric discs. Ultrasonics 2017, 74, 72–80. [Google Scholar] [CrossRef] [PubMed]
Publisher’s Note: MDPI stays neutral with regard to jurisdictional claims in published maps and institutional affiliations. |
© 2022 by the authors. Licensee MDPI, Basel, Switzerland. This article is an open access article distributed under the terms and conditions of the Creative Commons Attribution (CC BY) license (https://creativecommons.org/licenses/by/4.0/).