Article

Thermodynamic Modeling of Solvent-Assisted Lipid Bilayer Formation Process

1
School of Mechanical and Aerospace Engineering, Nanyang Technological University, Singapore 639798, Singapore
2
School of Materials Science and Engineering, Nanyang Technological University, Singapore 639798, Singapore
3
School of Chemical and Biomedical Engineering, Nanyang Technological University, Singapore 637459, Singapore
*
Authors to whom correspondence should be addressed.
Micromachines 2022, 13(1), 134; https://doi.org/10.3390/mi13010134
Submission received: 22 December 2021 / Revised: 10 January 2022 / Accepted: 11 January 2022 / Published: 15 January 2022
(This article belongs to the Special Issue Lipid Bilayers on Chip, Volume II)

Abstract

:
The solvent-assisted lipid bilayer (SALB) formation method provides a simple and efficient, microfluidic-based strategy to fabricate supported lipid bilayers (SLBs) with rich compositional diversity on a wide range of solid supports. While various studies have been performed to characterize SLBs formed using the SALB method, relatively limited work has been carried out to understand the underlying mechanisms of SALB formation under various experimental conditions. Through thermodynamic modeling, we studied the experimental parameters that affect the SALB formation process, including substrate surface properties, initial lipid concentration, and temperature. It was found that all the parameters are critically important to successfully form high-quality SLBs. The model also helps to identify the range of parameter space within which conformal, homogeneous SLBs can be fabricated, and provides mechanistic guidance to optimize experimental conditions for lipid membrane-related applications.

1. Introduction

Supported lipid bilayers (SLBs) have received extensive attention from researchers due to their ability to faithfully mimic biological membranes [1,2,3,4]. SLBs can be used to investigate lipid membrane-mediated biological processes in vitro in a controlled manner [5,6,7], for biofunctionalization of inorganic solid substrates for biocompatibility [8,9], and in many other applications such as programmed drug delivery [10] and biosensing [11,12]. To realize their functionalities, versatile and intact SLBs must be reliably fabricated. Several techniques have been developed to fabricate SLBs, such as the Langmuir−Blodgett (LB) film technique [13], the spin-coating method [14], and the vesicle fusion (VF) method [12,15]. The LB technique relies on the transfer of lipid bilayers formed at the air-water interface to a solid substrate as it is vertically immersed into the liquid. This method is prone to producing low-quality SLBs with holes and decoupled leaflets, limiting their usefulness [16]. The spin-coating method can produce high-quality and defect-free lipid multilayers in dry conditions [17,18], but the multilayers’ stability deteriorates drastically upon hydration [19]. The VF method forms SLBs by allowing the lipid vesicles to adsorb onto the solid support, leading to vesicle rupture and membrane fusion [20]. Although the VF method has been widely employed, the use of preformed lipid vesicles makes the process complicated. In addition, the VF strategy requires fluid-phase lipids and thus the fabrication cannot be carried out below the phase transition temperature ( T m ) of the lipids being used [21]. Moreover, spontaneous vesicle rupture is challenging for some substrate materials (e.g., gold [8] and titanium oxide [22]). Additional treatments are often needed to facilitate vesicle rupture on those substrates [23].
A recently developed strategy, termed the solvent-assisted lipid bilayer (SALB) formation [24,25,26,27], offers a simple, robust, and highly efficient protocol to fabricate SLBs. The substrate that needs to be coated is placed in a microfluidic chamber that contains phospholipids in a water-miscible organic solvent. As the organic solvent is progressively replaced by an aqueous buffer solution, SLBs form spontaneously on the solid substrate, as illustrated in Figure 1a. The design of the flow channel and the setup of the microfluidic system have been introduced in our previous publication [24]. This one-step SLB fabrication route [26] represents a more simplified workflow than existing methods, and works for a wider range of phospholipids and sterol compositions [28,29]. Since it does not depend on the quality of lipid bilayers at the water-air interface, or on the controlled rupture of lipid vesicles, this method effectively overcomes the technical difficulties of existing methods. It has been demonstrated that this method can be extended to coat SLBs on a variety of substrate materials. Previous experiments have identified several parameters that could affect the outcome of the SALB fabrication, including the lipid concentration in the organic solvent, substrate material, and temperature [24,27,30]. However, a fundamental understanding of the underlying physical mechanisms remains incomplete [31]. In this study, we estimate the energetics and carry out a thermodynamic analysis to investigate key parameters that affect the SALB formation process, including the substrate type, lipid concentration, and temperature. Such understanding provides guidance for optimizing the SALB protocol to ensure high-quality SLB fabrication.

2. SALB Formation–Estimation of Energetics and a Thermodynamics Model

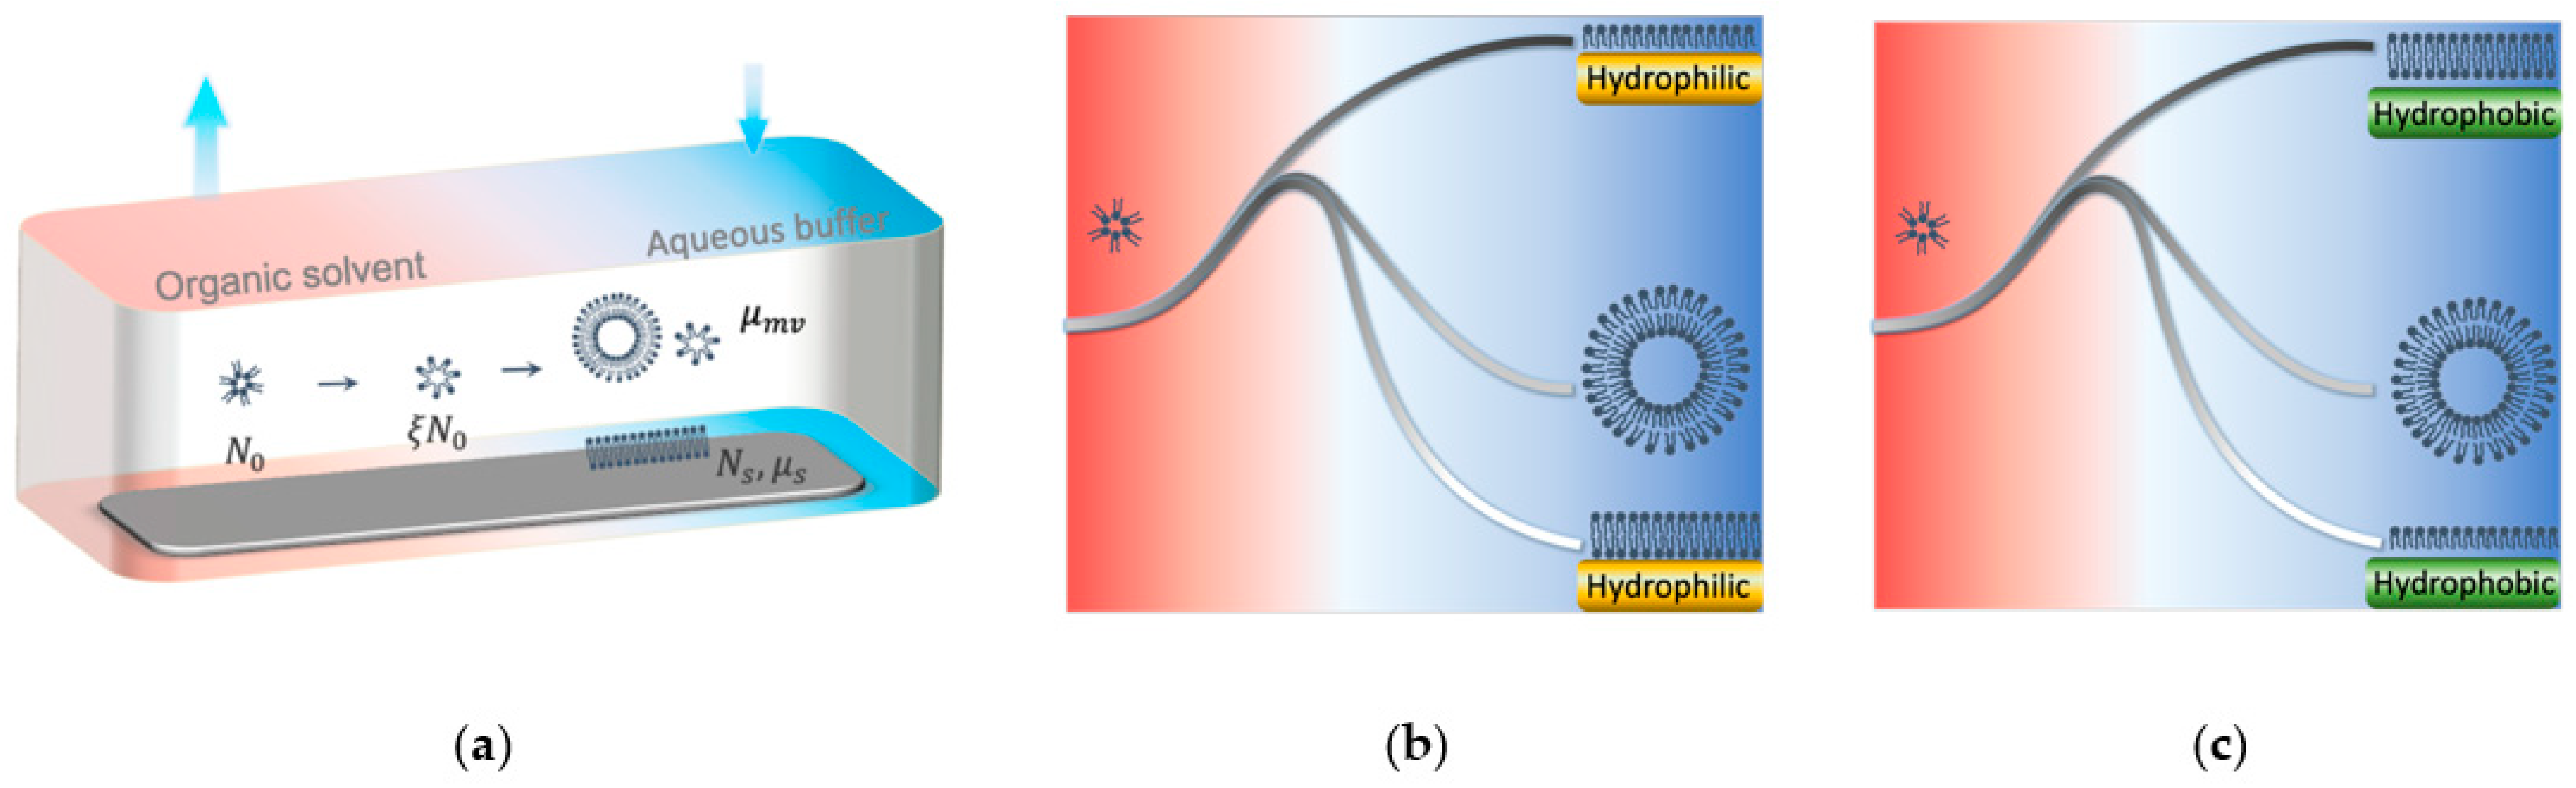
2.1. Estimation of Energetics of SALB Formation

Our previous studies have demonstrated that formation of SLBs is highly dependent on the substrate material. Using the SALB method, SLBs can form on silicon dioxide and gold substrates [32], as shown in Figure 1b, but a lipid monolayer instead of SLB forms on alkanethiol-coated gold substrates as shown in Figure 1c. Silicon dioxide and gold substrates are hydrophilic while alkanethiol-coated gold substrate is hydrophobic, suggesting that lipid self-assembly depends on the hydrophilicity-hydrophobicity of the surface.
Regulation of lipid organization through substrate hydrophobicity can be rationalized based on the Gibbs free energy profile of the SALB system [33]. As depicted schematically in Figure 1b,c, the Gibbs free energy changes as the lipids reorganize when the organic solvent is gradually replaced by an aqueous buffer (left to right in Figure 1). Prior to solvent exchange, lipids are presented as inverted micelles in the organic solution [34]. Injecting the aqueous buffer induces the rupture of inverted micelles as the exposure of hydrophobic hydrocarbon tails to water molecules would greatly increase the system energy, making the inverted micelles energetically unfavorable. The lipids may spontaneously self-assemble into various lipid structures, including lipid layers on the substrate, and conventional micelles and vesicles suspended in the aqueous buffer. On hydrophilic substrates (e.g., silicon dioxide and gold), the formation of lipid bilayers on the substrate surface prevents the exposure of hydrophobic tails to the hydrophilic environment – water molecules in the aqueous buffer and on the solid substrate surface. As a result, the system Gibbs free energy is significantly lower for lipid bilayer structures than for monolayers, i.e., μ s b μ s m , where μ s b and μ s m are the chemical potentials of individual lipids in a supported bilayer and monolayer structures, respectively. Formation of suspended conventional micelles or vesicles also reduces the system Gibbs free energy by sealing the hydrophobic tails inside, i.e.,   μ m v < μ s m , where μ m v is the chemical potential of individual lipids in suspended conventional micelles or vesicles. Whether SLBs or suspended lipid structures are more energetically favored largely depends on the molecular structure of the lipid molecules and the substrate property [35]. For lipid molecules in the shape of cylinder (e.g., DOPC [36]) or truncated cone (e.g., DPPC and POPC [37]),   μ s b < μ m v and therefore they tend to form SLBs. In contrast, repulsive forces in the hydrophobic chains and headgroups will be generated from the steric, hydration, and electrostatic effects when lipid molecules in the shape of inverted cones form SLBs, giving rise to an imbalance of the lipid lateral pressure and elevated bending energy at the molecular level. However, on hydrophobic substrates (e.g., alkanethiol-coated gold, fluoropolymers [38], and the epoxy SU-8 [39]), μ s m μ s b , inducing the formation of a supported lipid monolayer. This simple estimation of the Gibbs free energy indicates that SLBs form on hydrophilic surfaces and lipid monolayers form on hydrophobic surfaces.

2.2. Thermodynamic Analysis of SALB Formation

We consider the reaction chamber as a thermodynamic system, since the rate of aqueous buffer injection is much slower than the rate of lipid bilayer formation on the substrate. It is noted that the effect of solvent exchange kinetics is taken into consideration by introducing a scaling factor, ξ , which is defined as the ratio of the time average of the lipid concentration during solvent exchange (see Supplementary Materials) to the initial lipid concentration. In the reaction chamber in Figure 1a, the lipids initially in the form of inverted micelles in the solvent self-assemble into either supported lipid layers (a bilayer on hydrophilic substrates and a monolayer on hydrophobic substrates) or suspended lipid structures (i.e., conventional micelles and vesicles) after the system reaches equilibrium. Assuming that the total initial number of lipids in the reaction chamber is N 0 , the number of lipids available for adsorption on the substrate is ξ N 0 . Denoting the number of lipids in the supported lipid layer as N s , the number of lipids re-assembled into suspended lipid structures is thus given by N m v = ξ N 0 N s . The system free energy is given as:
G = N s μ s + ( ξ N 0 N s ) μ m v k B T [ ξ N 0 ln ( ξ N 0 N s ) + ( ξ N 0 N s ) ln ( N s ξ N 0 N s ) ]  
where μ s is the chemical potential of individual lipids in supported lipid layers, and k B and T are the Boltzmann constant and temperature, respectively. Minimizing the system free energy with respect to N s yields:
N s = ξ · N 0 1 + e x p ( μ m v μ s k B T )

3. Results

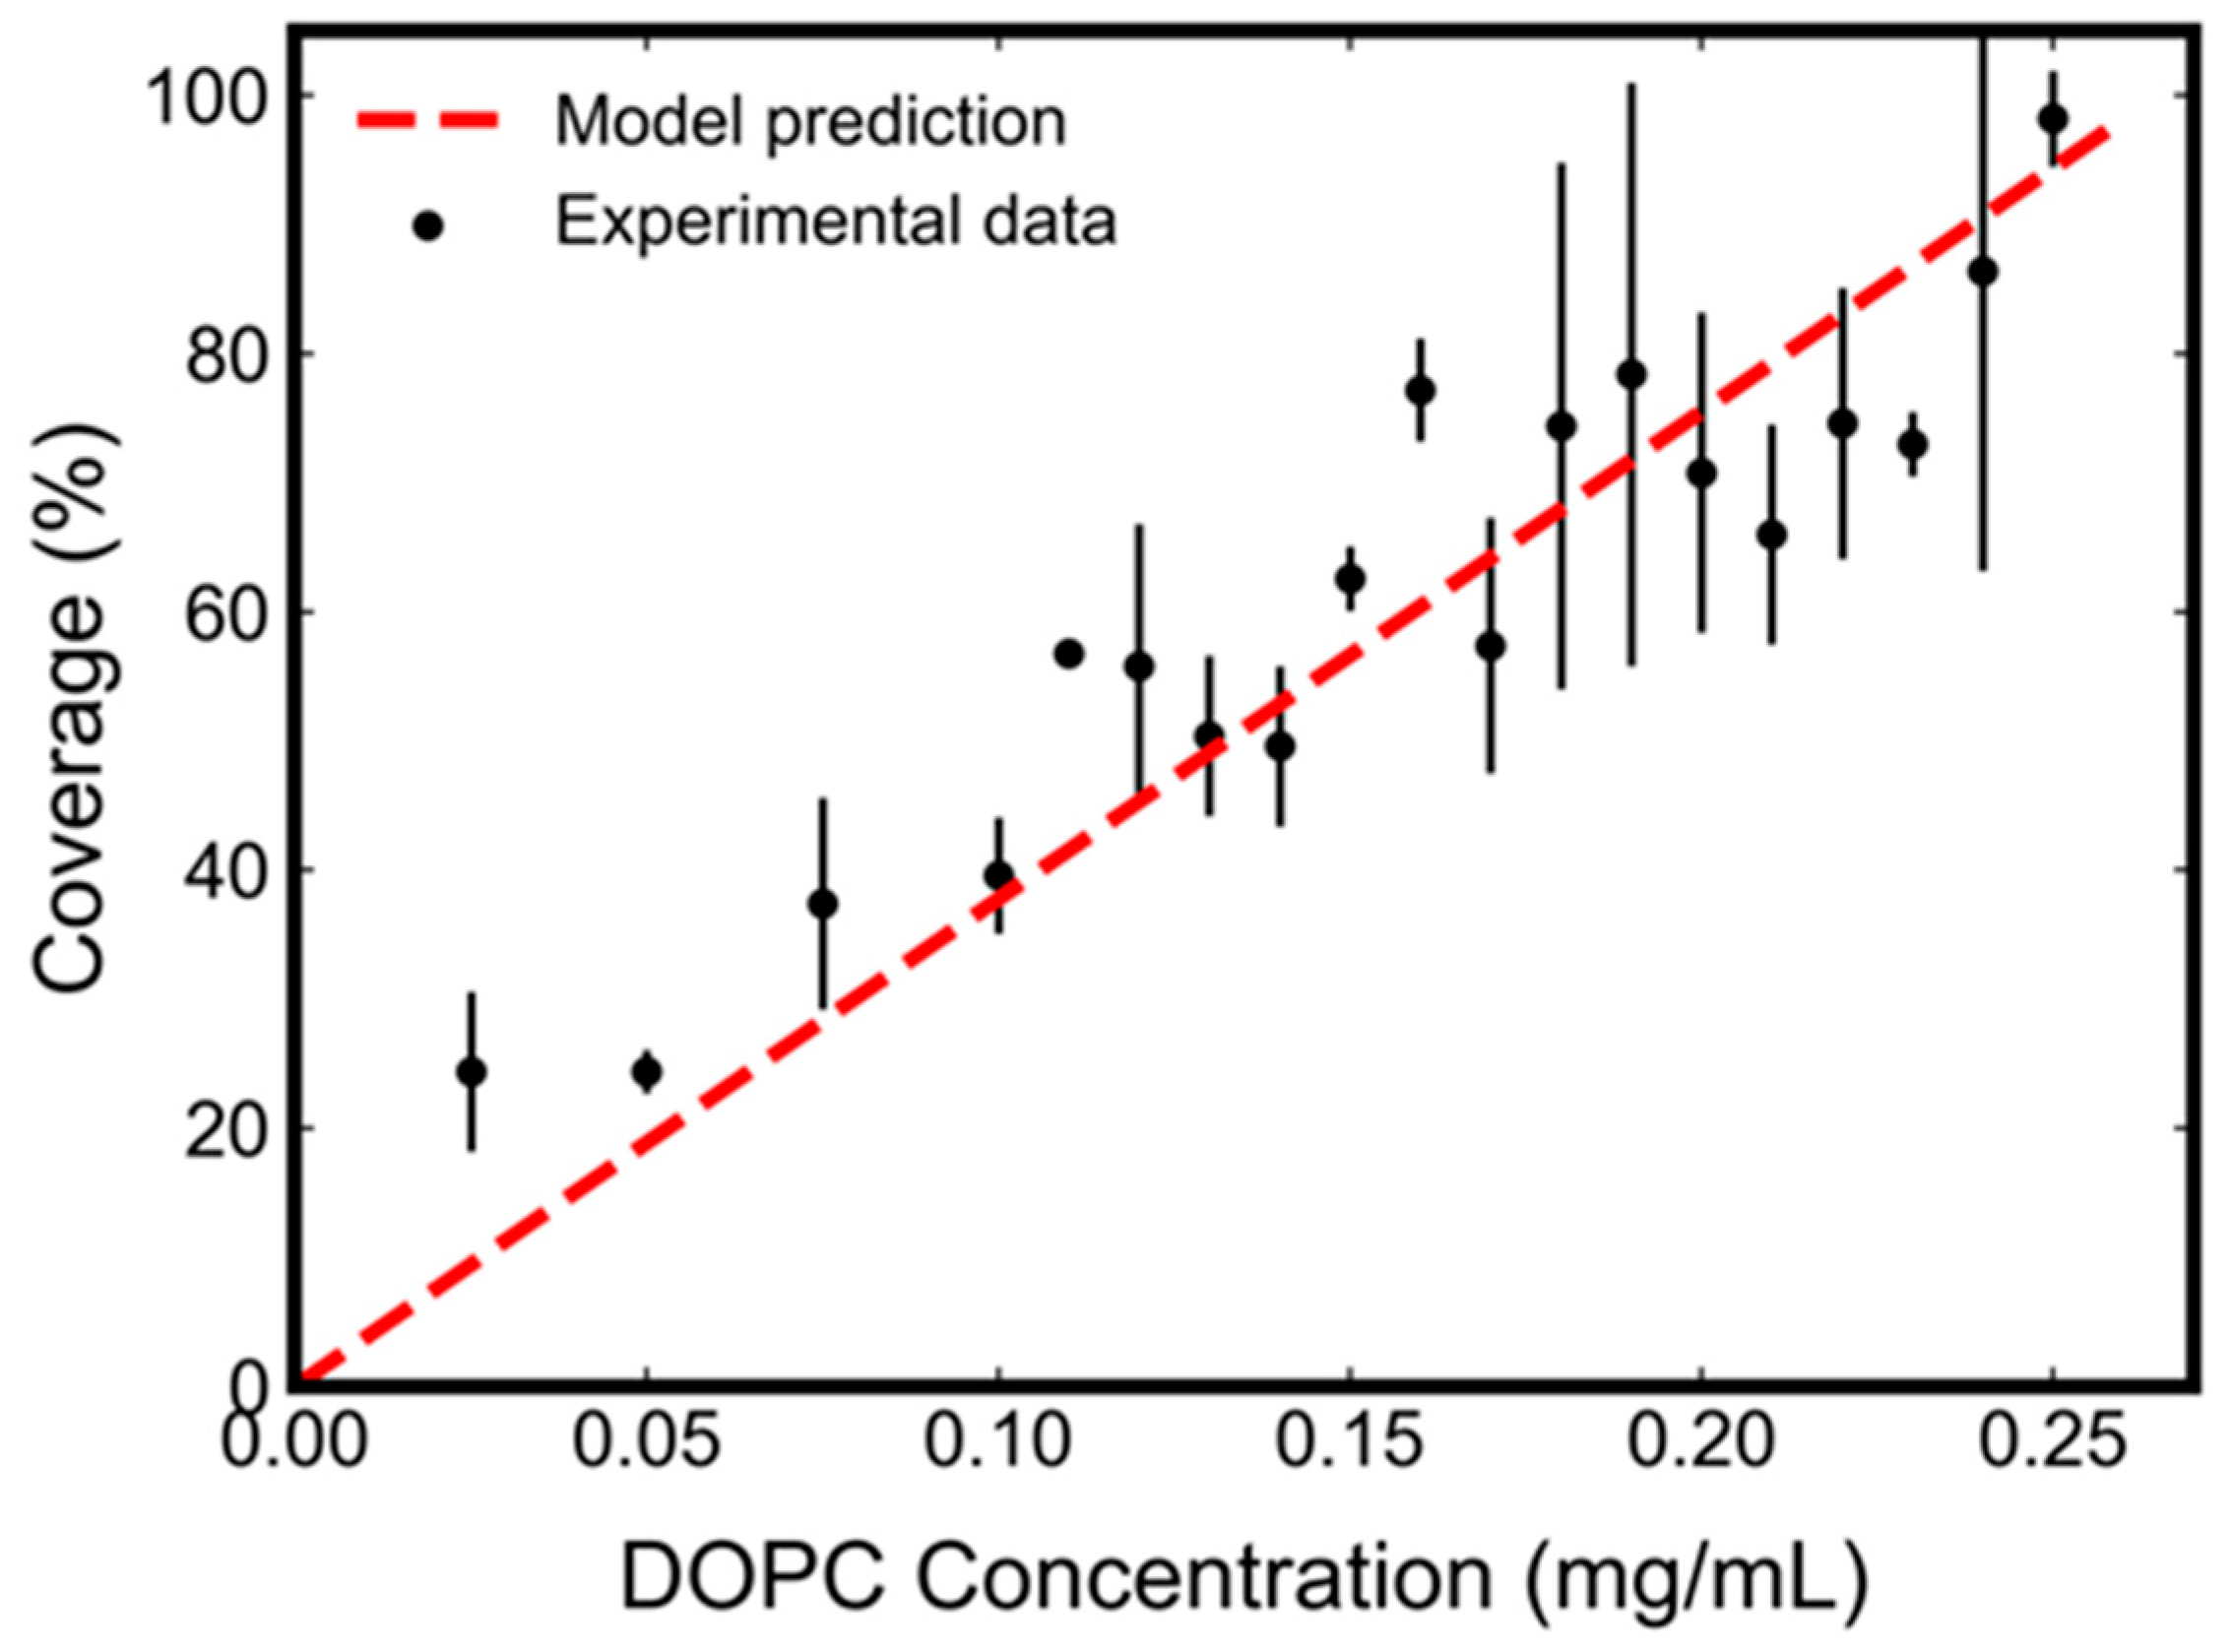
3.1. Lipid Concentration

In our earlier experiments [24,27,30,32], the amount of adsorbed phospholipids on the substrate was monitored in real time by using the quartz crystal microbalance-dissipation (QCM-D) monitoring technique [40,41], which allowed us to record the resonance frequency shift and measure lipid layer formation with nanoscale resolution. The relation between the lipid mass change and the measured frequency change is provided by the Sauerbrey equation: Δ m = C · Δ f , where C is a constant related to the properties of the QCM-D quartz crystal sensor chip, Δ m is the mass of adsorbed lipids per unit surface area, and Δ f is the measured frequency shift [42]. The number of lipids in Equation (2) is first converted to the mass of lipids. This allows us to directly correlate the number of adsorbed lipids N s with the resonance frequency shift Δ f . The SLB coverage percentage can be defined as the ratio of frequency change due to the current level of SLB coverage Δ f to the frequency change due to a full-spanning SLB Δ f c :
Δ f / Δ f c = { V · ξ C · A · Δ f c × 1 1 + e x p ( μ m v μ s k B T )     } × c 0
where V, A and c 0 are the volume of the fluidic chamber, the active quartz crystal area, and the initial lipid mass concentration in the organic solvent, respectively.
Our model predicts that the SLB surface coverage percentage is linearly dependent on the initial lipid concentration according to Equation (3). This prediction has been confirmed by our experimental characterization (black solid circles with error bars in Figure 2). Experiments were carried out at a fixed temperature of 24.0 ± 0.5 °C, with the initial DOPC lipid concentration ranging from 0.025 mg/mL to 0.25 mg/mL in isopropanol solution. A microfluidic chamber with a silicon-dioxide-coated sensor substrate was used. An aqueous buffer (10 mM Tris, 150 mM NaCl, pH 7.5) was slowly infused into the isopropanol solution containing lipids. Upon this solvent-exchange step, the formation of DOPC SLB ( Δ f ) was measured by the QCM-D technique. The frequency shift of the complete DOPC SLB ( Δ f c ) formed in our experiments was measured to be -25 Hz. Figure 2 shows excellent agreement between the model prediction and the experimental data. Based on our experimental setup [31] and model assumption (see Supplementary Materials), we set V = 58   mm 3 , C = 17.7   ng · cm 2 · Hz 1 , A = 97   mm 2 , and ξ = 0.05 . Linear least squares fitting the experimental data to Equation (3) predicts that μ m v μ s = 0.585   kJ / mol . This is consistent with our understanding of energetics in Section 2.1 ( μ s b < μ m v for cylindrical lipids) and close to reported values [43].

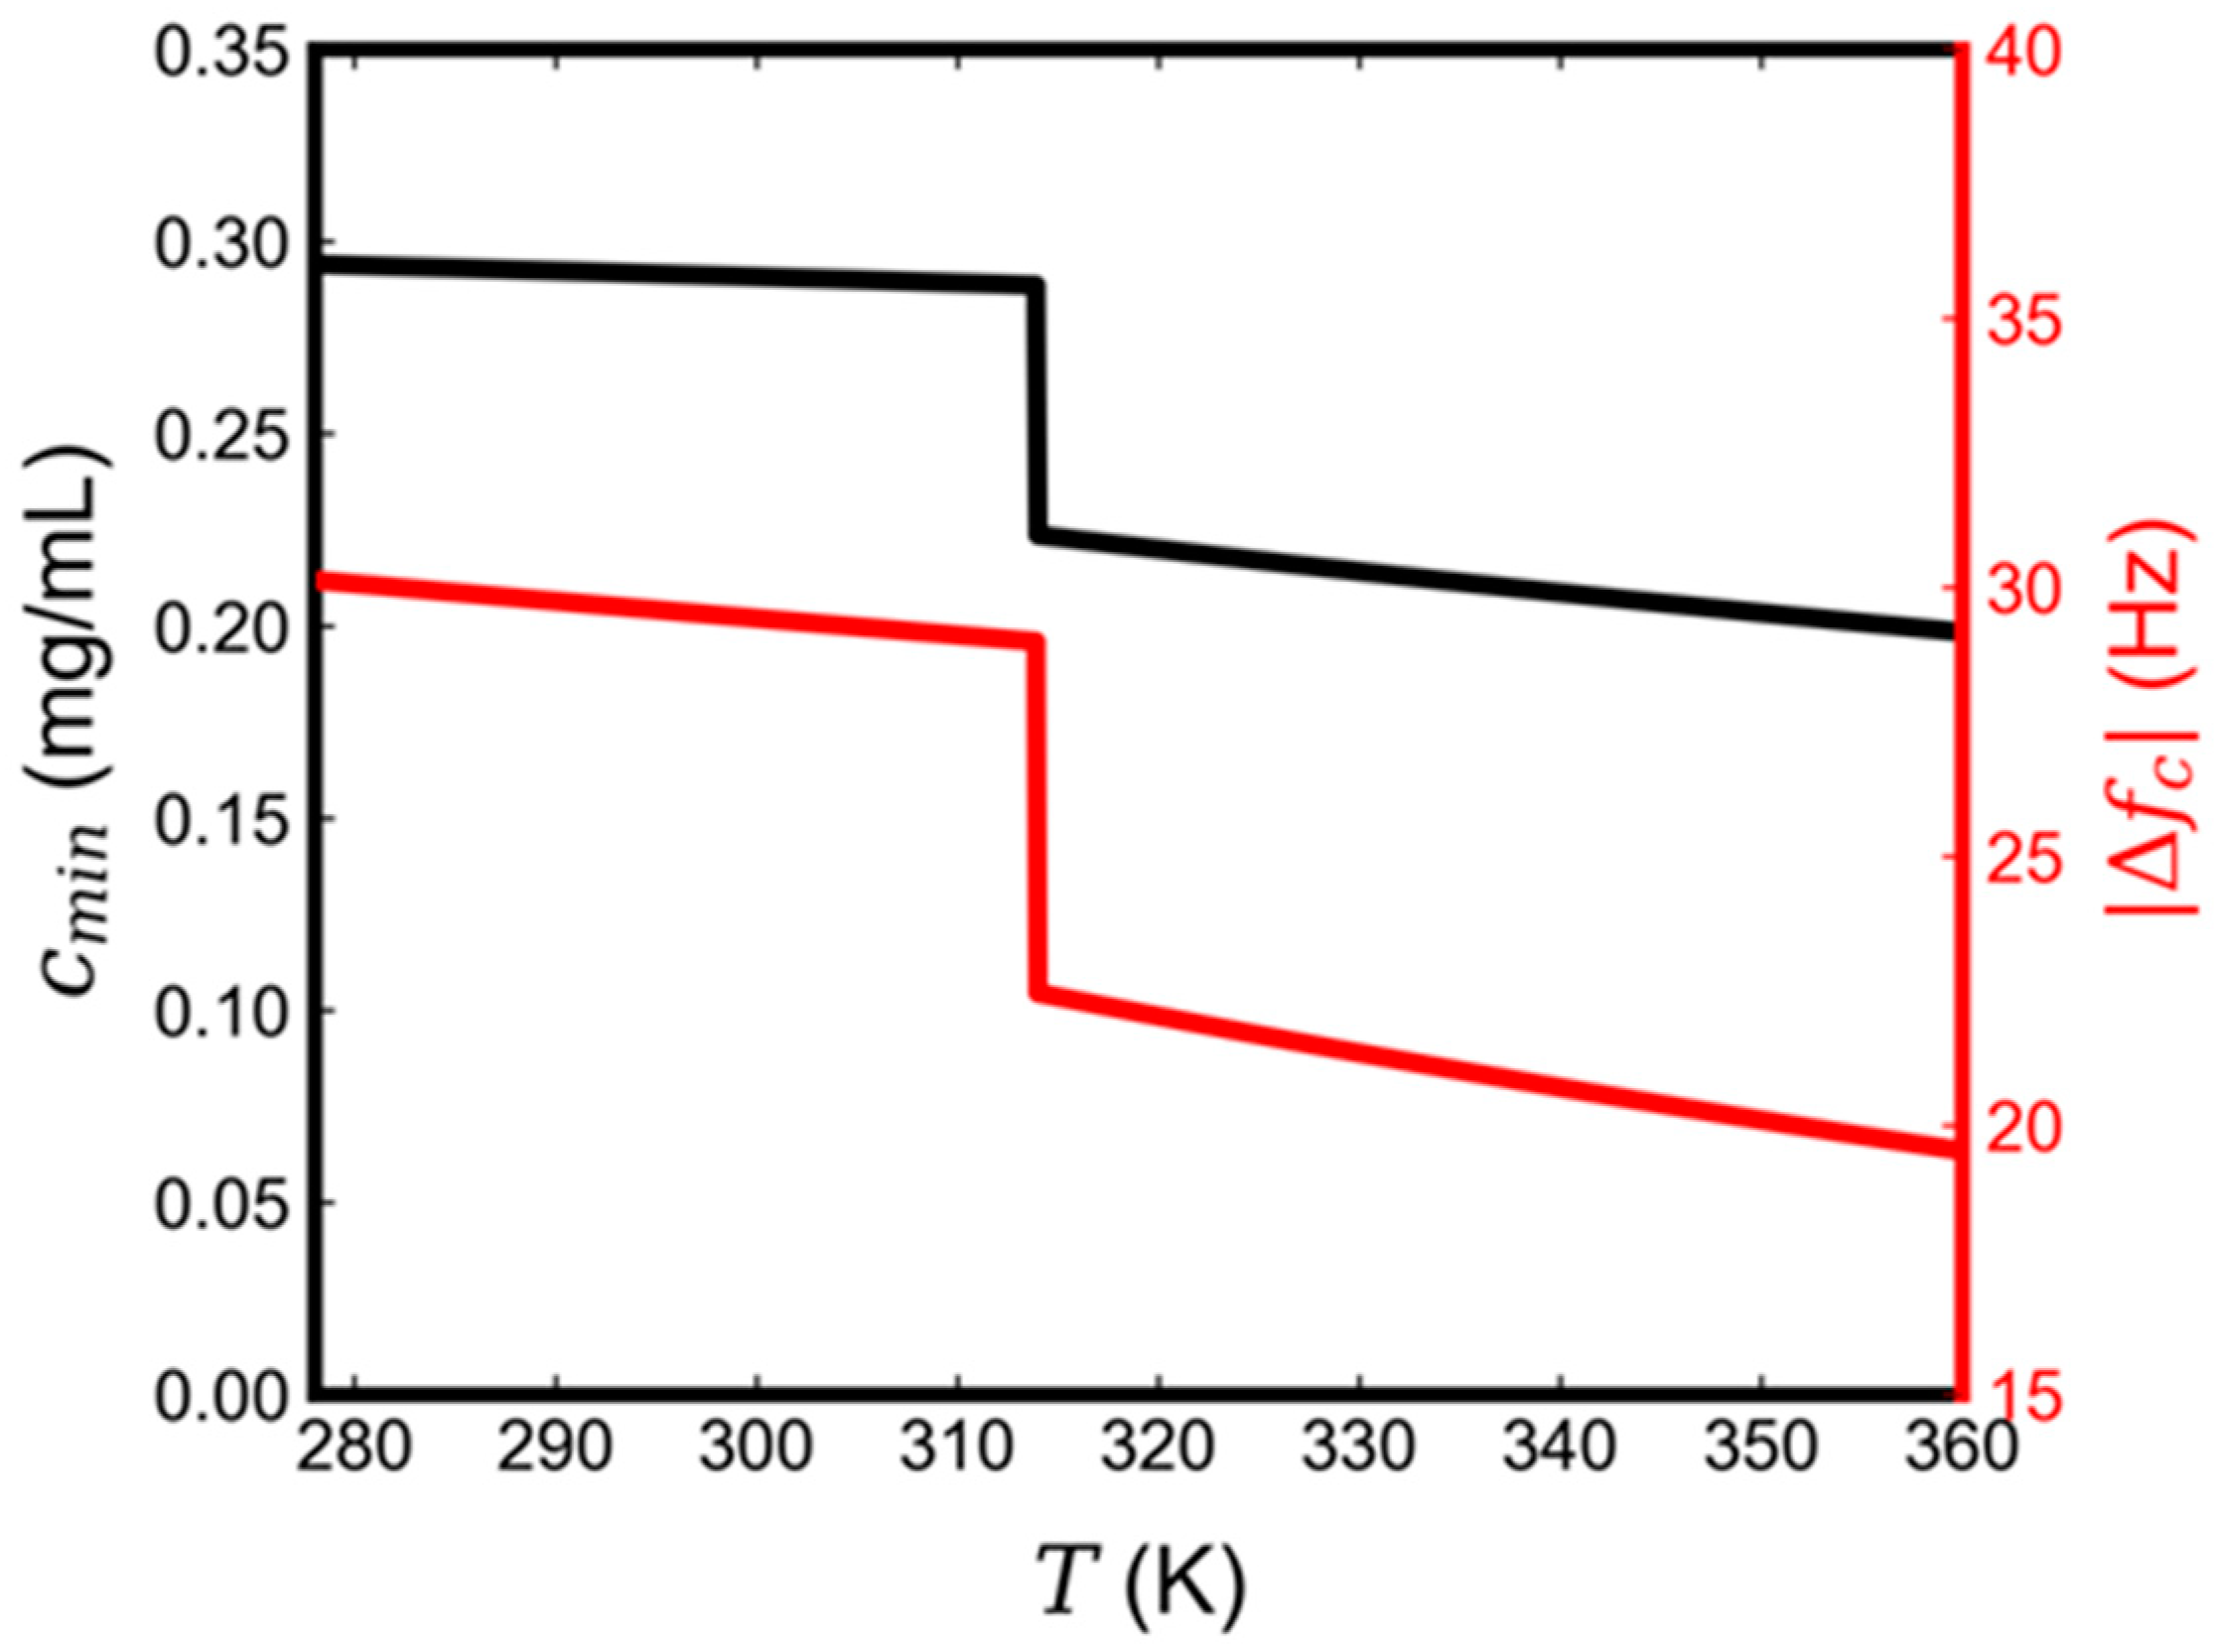
3.2. Effect of Temperature

The SALB method overcomes the temperature limit of the traditional VF strategy and has been demonstrated to produce homogenous SLBs in both the gel and liquid phases. The effect of temperature on SLB production during the SALB formation process is not well characterized or fully understood. According to Equation (3), our model predicts that temperature may modulate SLB formation through three different aspects. First, it directly affects the thermal energy ( k B T ) of the system. Second, it may affect the chemical potentials of the lipids ( μ m v and μ s ). But the thermodynamics of general lipid self-assembly shows that micelles and SLBs are in thermodynamically equivalent states [44,45], suggesting that they have the same dependence on temperature and any resulting difference in μ m v μ s should be largely independent of temperature. In addition, temperature can modulate the frequency shift Δ f c by altering lipid packing density:
Δ f c = 2 M N A · C · a 0
where M , N A and a 0 are the molecular weight of the lipids, the Avogadro’s constant, and the area per lipid (APL), respectively.
In general, APL increases with temperature, since a higher temperature causes increased disorder of the lipid hydrocarbon chain [46]. It was shown that APL changes with temperature linearly as [47,48]:
a 0 = a m + k A · ( T T m ) = { a m g k A g · ( T m T ) ,     T < T m a m f + k A f · ( T T m ) ,     T T m
where T m , a m and k A are the phase transition temperature of the membrane, the APL at the phase transition temperature, and a phase-related coefficient, respectively. The superscript g denotes the gel phase and f denotes the fluid phase. Substituting Equation (5) into Equation (4), Δ f c can be expressed as a function of temperature:
Δ f c = ( 2 M C · N A ) × ( 1 a m + k A · ( T T m ) )
When a complete SLB forms, Δ f / Δ f c = 1 in Equation (3), from which we can obtain the minimum lipid concentration to achieve full SLB coverage as:
c m i n = ( 2 M · A N A · V · ξ ) × ( 1 + e x p ( μ m v μ s k B T ) a m + k A · ( T T m )   )
Equations (6) and (7) enable us to predict the temperature effect on both the QCM-D frequency signal corresponding to a complete SLB and the minimum lipid concentration to form a complete SLB. Based on existing computational and experimental data for DPPC lipids, M = 734.039   g · mo l 1 , T m = 314   K , a m g = 47.5   2 , a m f = 61.3   2 , k A f 0.2   2 / , k A g 0.06   2 / ° C [47,48,49], and μ m v μ s 1   kJ · mo l 1 [43]. Figure 3 shows that both Δ f c   and c m i n monotonically decrease with the increase in temperature and follow a similar trend when the temperature is above or below T m . At T = T m , there is a sudden drop in both quantities due to the gel-to-liquid phase transition. The predicted drop in Δ f c has been demonstrated in previous experiments [30]. In our experiments using 0.5 mg/mL DPPC in isopropanol, the final frequency shift upon complete SLB formation changed from −36.5 Hz in the gel phase at 297 K to −29.7 Hz in the liquid phase at 323 K, which represents a 21% surface mass density reduction.

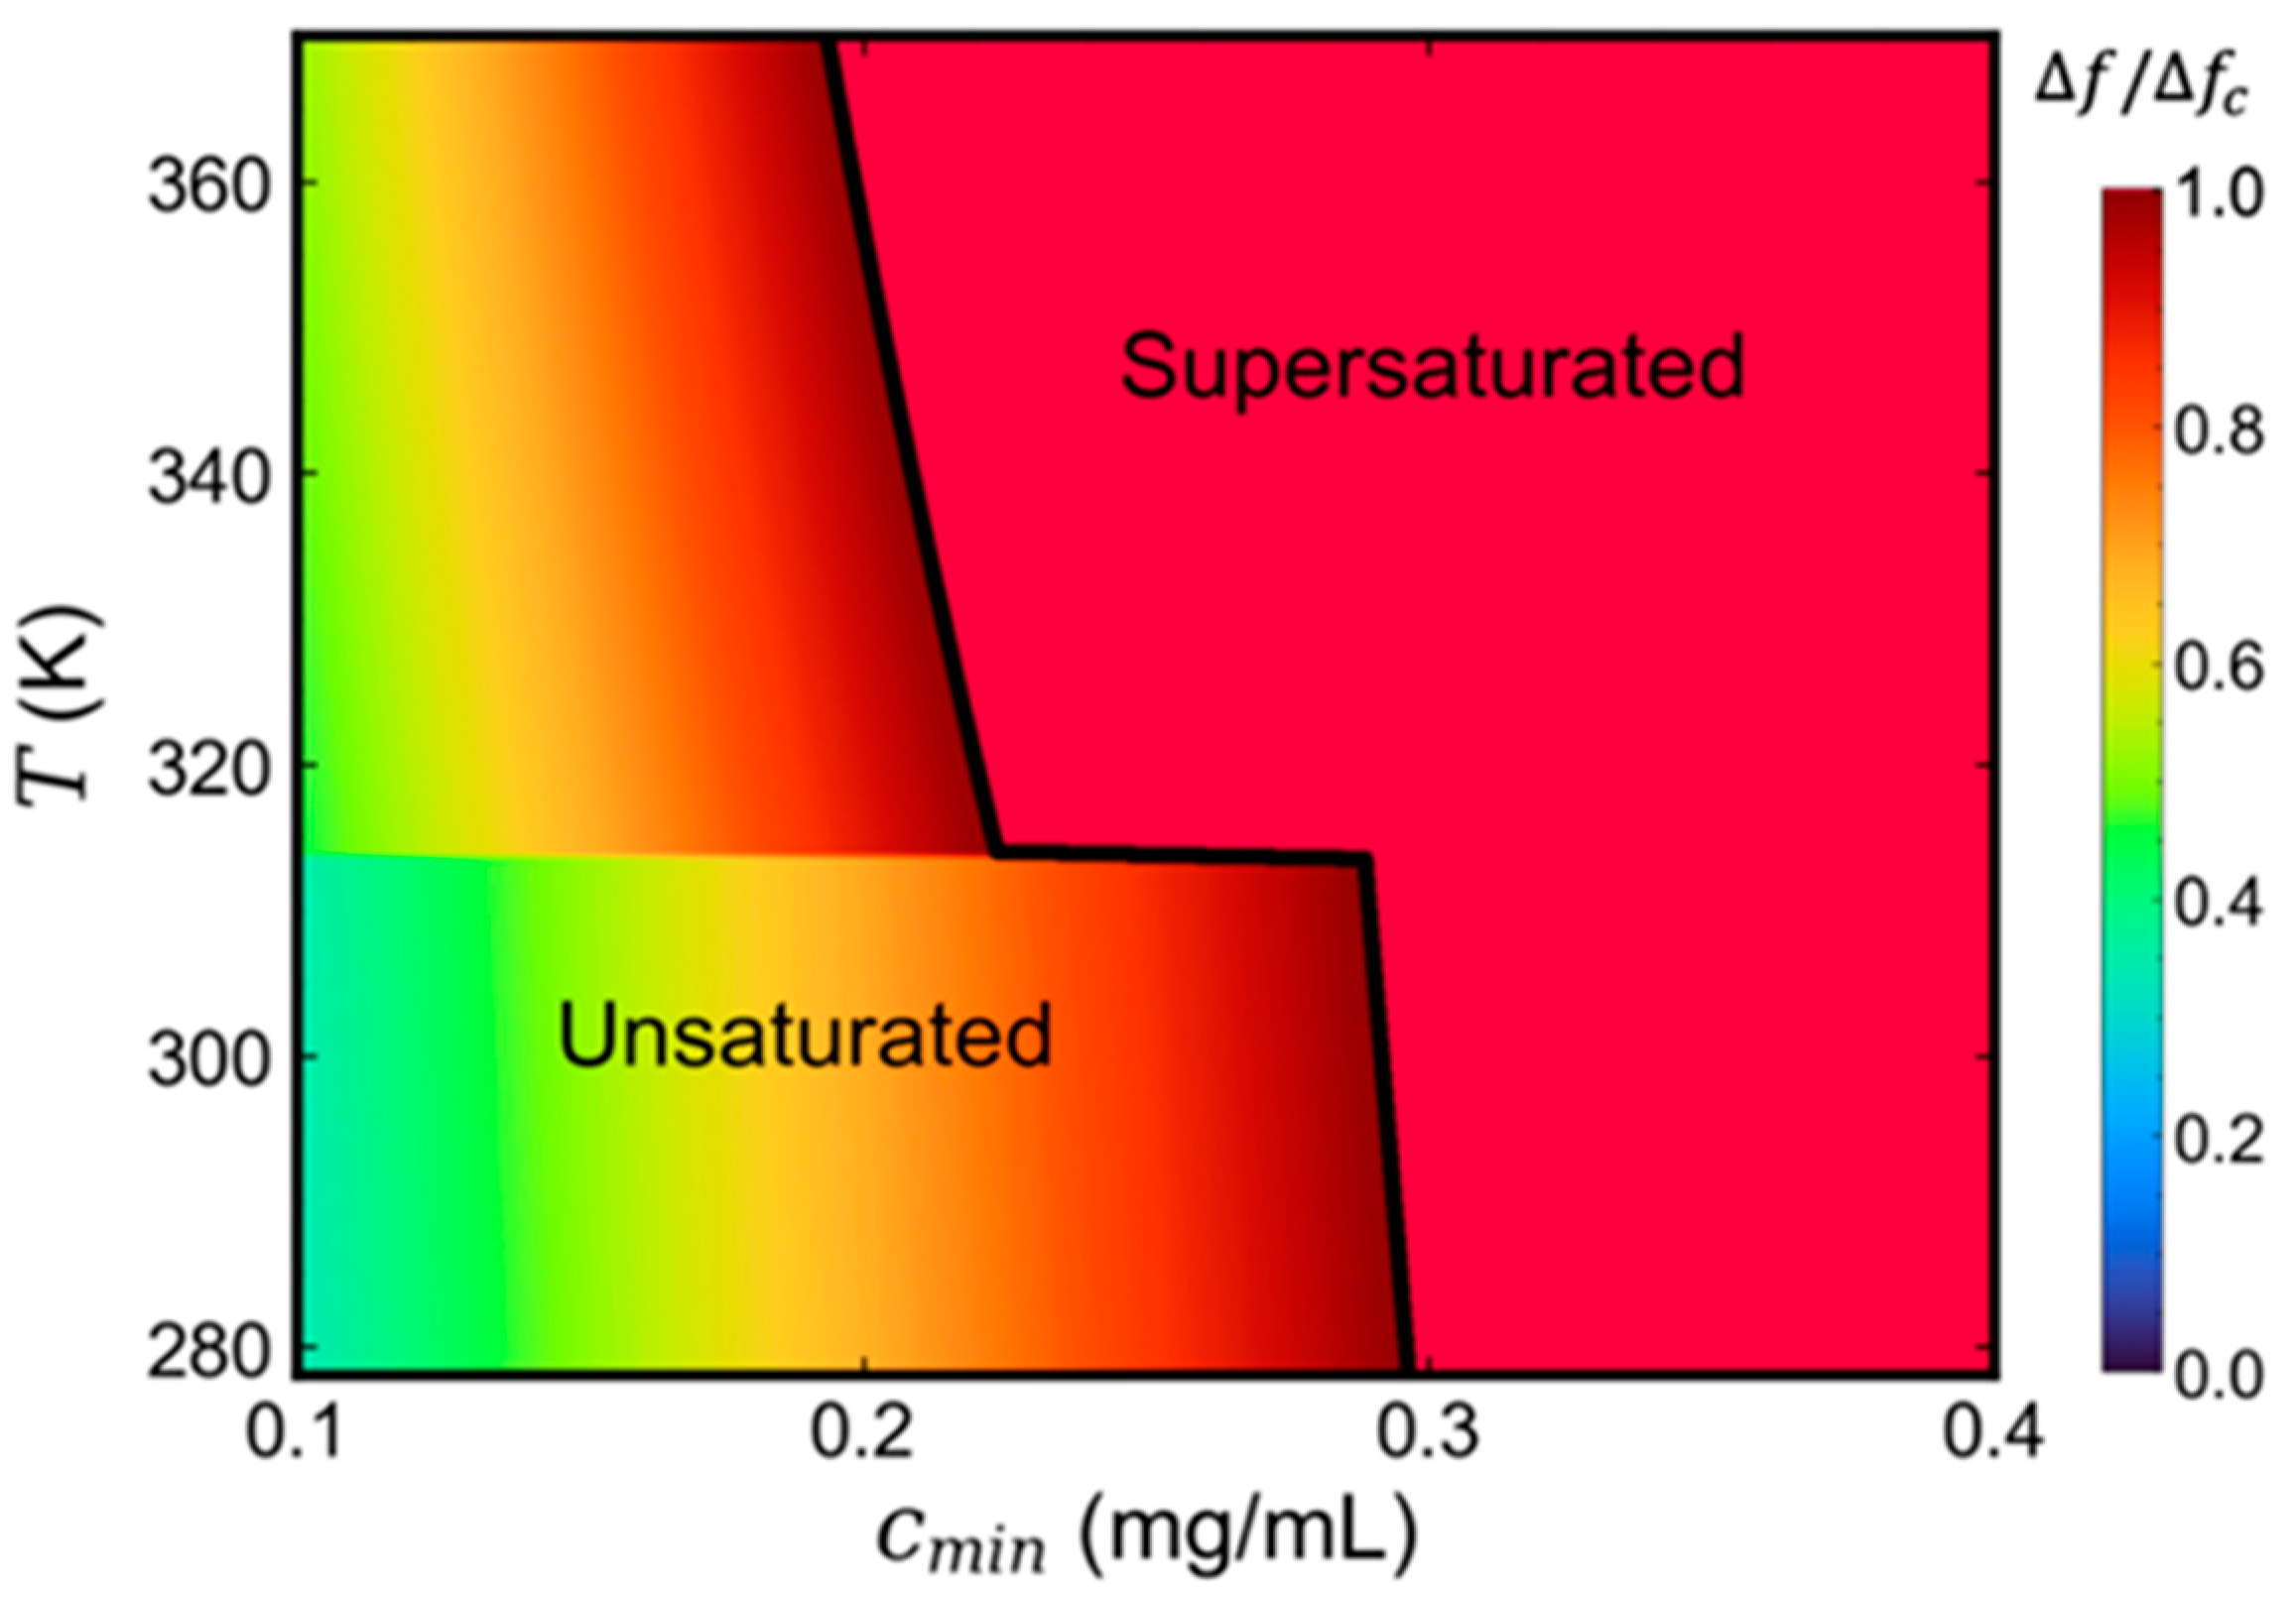
3.3. Phase Diagram Prediction

A general expression of the SLB coverage percentage as a function of temperature and initial lipid concentration can be obtained by substituting Equation (6) into Equation (3):
Δ f / Δ f c = ( N A · V · ξ b · M · A ) × ( a m + k A · ( T T m ) 1 + e x p ( μ m v μ s k B T )   ) × c 0
Equation (8) categorizes the parameters affecting the SLB coverage broadly into three groups: the one within the first bracket is a constant related to the chamber parameters, the flow rate, and the lipid type; the one in the second bracket is the temperature dependence, with two-stage behavior below or above the gel-to-liquid phase transition; and the third is the initial lipid concentration in the organic solvent. Equation (8) provides a quantitative way to evaluate the effects of various processing parameters on SLB formation using the SALB method. For instance, for the above described DPPC lipid system, the SLB coverage is primarily a function of two main parameters–temperature and initial lipid concentration. A phase diagram with a DPPC SLB coverage heatmap can thus be obtained, as shown in Figure 4. Phase diagrams for different organic solvent types and lipid compositions can readily be obtained if their effects on lipid chemical potentials and phase transition temperature can be quantitatively characterized. Figure 4 indicates that, at very low initial DPPC lipid concentrations, a complete SLB layer cannot form due to lack of lipid supply, while supersaturated SLBs are formed at very high initial lipid concentrations, leading to possible nonuniform lipid aggregates on the substrate [30]. The phase diagram provides a useful guideline to quantitatively identify the conditions within which high-quality, uniform, and intact SLBs can be achieved using the SALB method.

4. Conclusions

In this study, we have developed a thermodynamics model and carried out experimental verification of SLB formation via the SALB method. We particularly focused on the effects of the substrate surface properties, the initial lipid concentration in organic solvents, and the temperature on SLB formation to gain fundamental understanding of the underlying physicochemical mechanisms. The energetic estimate of the hydrophobic-hydrophilic properties of the substrate provides insights into the driving force of supported lipid mono-/bi-layer formation. The thermodynamic modeling leads to a general equation of the SLB coverage fraction as a function of various experimental parameters, including area per lipid, initial lipid concentration, and temperature. The model can be applied to both the gel phase and the liquid phase. One important conclusion of the current study is that there seems to exist a rather narrow range of the initial lipid concentration, below which the SLB would not fully cover the substrate surface and above which an over-confluent SLB layer with additional lipid aggregates could form, compromising the SLB quality. Important, highly useful, and quantitative information is summarized into a phase diagram. This diagram can guide the selection of various parameters to ensure quality SLB fabrication. This study has deepened the fundamental understanding of the SLB formation process, and broadened the applicability of this technique by expanding the parameter space for fabricating high quality SLBs.

Supplementary Materials

The Supplementary Materials are available at https://www.mdpi.com/article/10.3390/mi13010134/s1.

Author Contributions

Conceptualization, N.-J.C., K.J.H. and C.H.; Experiment, H.T.; Modeling, H.X.; Writing, H.X.; Supervision, N.-J.C., K.J.H. and C.H. All authors contributed to data analysis and manuscript revision. All authors have read and agreed to the published version of the manuscript

Funding

N.-J.C. acknowledges financial support from the AcRF Tier 1 grant from the Ministry of Education (MOE), Singapore (grant number TIER1-2020-T1-002-032) and from the China-Singapore International Joint Research Institute (CSIJRI). K.J.H. acknowledges financial support from Nanyang Technological University (SUG M4082428.050). C.H. acknowledges financial support from Nanyang Technological University (SUG M4082352.050).

Institutional Review Board Statement

Not applicable.

Informed Consent Statement

Not applicable.

Data Availability Statement

The data presented in this study are available in article.

Conflicts of Interest

The authors declare no conflict of interest.

References

  1. Sackmann, E. Supported membranes: Scientific and practical applications. Science 1996, 271, 43–48. [Google Scholar] [CrossRef] [PubMed]
  2. Richter, R.P.; Berat, R.; Brisson, A.R. Formation of solid-supported lipid bilayers: An integrated view. Langmuir 2006, 22, 3497–3505. [Google Scholar] [CrossRef]
  3. Chan, Y.-H.M.; Boxer, S.G. Model membrane systems and their applications. Curr. Opin. Chem. Biol. 2007, 11, 581–587. [Google Scholar] [CrossRef] [PubMed] [Green Version]
  4. Jackman, J.A.; Cho, N.J. Supported Lipid Bilayer Formation: Beyond Vesicle Fusion. Langmuir 2020, 36, 1387–1400. [Google Scholar] [CrossRef]
  5. Tayebi, L.; Ma, Y.; Vashaee, D.; Chen, G.; Sinha, S.K.; Parikh, A.N. Long-range interlayer alignment of intralayer domains in stacked lipid bilayers. Nat. Mater. 2012, 11, 1074–1080. [Google Scholar] [CrossRef] [PubMed]
  6. Pauli, G.; Tang, W.L.; Li, S.D. Development and Characterization of the Solvent-Assisted Active Loading Technology (SALT) for Liposomal Loading of Poorly Water-Soluble Compounds. Pharmaceutics 2019, 11, 465. [Google Scholar] [CrossRef] [Green Version]
  7. Mueller, P.; Rudin, D.O.; Tien, H.T.; Wescott, W.C. Reconstitution of cell membrane structure in vitro and its transformation into an excitable system. Nature 1962, 194, 979–980. [Google Scholar] [CrossRef] [PubMed]
  8. Keller, C.A.; Kasemo, B. Surface specific kinetics of lipid vesicle adsorption measured with a quartz crystal microbalance. Biophys. J. 1998, 75, 1397–1402. [Google Scholar] [CrossRef] [Green Version]
  9. Sut, T.N.; Yoon, B.K.; Jeon, W.-Y.; Jackman, J.A.; Cho, N.-J. Supported lipid bilayer coatings: Fabrication, bioconjugation, and diagnostic applications. Appl. Mater. Today 2021, 25, 101183. [Google Scholar] [CrossRef]
  10. Gopalakrishnan, G.; Thostrup, P.; Rouiller, I.; Lucido, A.L.; Belkaïd, W.; Colman, D.R.; Lennox, R.B. Lipid Bilayer Membrane-Triggered Presynaptic Vesicle Assembly. ACS Chem. Neurosci. 2010, 1, 86–94. [Google Scholar] [CrossRef] [Green Version]
  11. Siontorou, C.G.; Nikoleli, G.P.; Nikolelis, D.P.; Karapetis, S.K. Artificial Lipid Membranes: Past, Present, and Future. Membranes 2017, 7, 38. [Google Scholar] [CrossRef]
  12. Castellana, E.T.; Cremer, P.S. Solid supported lipid bilayers: From biophysical studies to sensor design. Surf. Sci. Rep. 2006, 61, 429–444. [Google Scholar] [CrossRef] [PubMed]
  13. Tamm, L.K.; McConnell, H.M. Supported phospholipid bilayers. Biophys J. 1985, 47, 105–113. [Google Scholar] [CrossRef] [Green Version]
  14. Mennicke, U.; Salditt, T. Preparation of Solid-Supported Lipid Bilayers by Spin-Coating. Langmuir 2002, 18, 8172–8177. [Google Scholar] [CrossRef]
  15. Kalb, E.; Frey, S.; Tamm, L.K. Formation of supported planar bilayers by fusion of vesicles to supported phospholipid monolayers. Biochim. Biophys. Acta Biomembr. 1992, 1103, 307–316. [Google Scholar] [CrossRef]
  16. Rinia, H.A.; Demel, R.A.; van der Eerden, J.P.J.M.; de Kruijff, B. Blistering of Langmuir-Blodgett Bilayers Containing Anionic Phospholipids as Observed by Atomic Force Microscopy. Biophys. J. 1999, 77, 1683–1693. [Google Scholar] [CrossRef] [Green Version]
  17. Sondhi, P.; Lingden, D.; Stine, K.J. Structure, Formation, and Biological Interactions of Supported Lipid Bilayers (SLB) Incorporating Lipopolysaccharide. Coatings 2020, 10, 981. [Google Scholar] [CrossRef]
  18. Dols-Perez, A.; Fumagalli, L.; Simonsen, A.C.; Gomila, G. Ultrathin Spin-Coated Dioleoylphosphatidylcholine Lipid Layers in Dry Conditions: A Combined Atomic Force Microscopy and Nanomechanical Study. Langmuir 2011, 27, 13165–13172. [Google Scholar] [CrossRef] [PubMed]
  19. Simonsen, A.C.; Bagatolli, L.A. Structure of spin-coated lipid films and domain formation in supported membranes formed by hydration. Langmuir 2004, 20, 9720–9728. [Google Scholar] [CrossRef]
  20. Hardy, G.J.; Nayak, R.; Zauscher, S. Model cell membranes: Techniques to form complex biomimetic supported lipid bilayers via vesicle fusion. Curr. Opin. Colloid Interface Sci. 2013, 18, 448–458. [Google Scholar] [CrossRef] [Green Version]
  21. Nayar, R.; Hope, M.J.; Cullis, P.R. Generation of large unilamellar vesicles from long-chain saturated phosphatidylcholines by extrusion technique. Biochim. Biophys. Acta Biomembr. 1989, 986, 200–206. [Google Scholar] [CrossRef]
  22. Reviakine, I.; Rossetti, F.F.; Morozov, A.N.; Textor, M. Investigating the properties of supported vesicular layers on titanium dioxide by quartz crystal microbalance with dissipation measurements. J. Chem. Phys. 2005, 122, 204711. [Google Scholar] [CrossRef] [PubMed] [Green Version]
  23. Jackman, J.A.; Zan, G.H.; Zhdanov, V.P.; Cho, N.J. Rupture of lipid vesicles by a broad-spectrum antiviral peptide: Influence of vesicle size. J. Phys. Chem. B 2013, 117, 16117–16128. [Google Scholar] [CrossRef] [PubMed]
  24. Ferhan, A.R.; Yoon, B.K.; Park, S.; Sut, T.N.; Chin, H.; Park, J.H.; Jackman, J.A.; Cho, N.J. Solvent-assisted preparation of supported lipid bilayers. Nat. Protoc. 2019, 14, 2091–2118. [Google Scholar] [CrossRef]
  25. Tabaei, S.R.; Vafaei, S.; Cho, N.J. Fabrication of charged membranes by the solvent-assisted lipid bilayer (SALB) formation method on SiO2 and Al2O3. Phys. Chem. Chem. Phys. 2015, 17, 11546–11552. [Google Scholar] [CrossRef]
  26. Tabaei, S.R.; Jackman, J.A.; Kim, M.; Yorulmaz, S.; Vafaei, S.; Cho, N.J. Biomembrane Fabrication by the Solvent-assisted Lipid Bilayer (SALB) Method. J. Vis. Exp. 2015, 106, 53073. [Google Scholar] [CrossRef] [PubMed] [Green Version]
  27. Jackman, J.A.; Tabaei, S.R.; Zhao, Z.; Yorulmaz, S.; Cho, N.J. Self-assembly formation of lipid bilayer coatings on bare aluminum oxide: Overcoming the force of interfacial water. ACS Appl. Mater. Interfaces 2015, 7, 959–968. [Google Scholar] [CrossRef]
  28. Tabaei, S.R.; Jackman, J.A.; Kim, S.O.; Liedberg, B.; Knoll, W.; Parikh, A.N.; Cho, N.J. Formation of cholesterol-rich supported membranes using solvent-assisted lipid self-assembly. Langmuir 2014, 30, 13345–13352. [Google Scholar] [CrossRef]
  29. Tabaei, S.R.; Jackman, J.A.; Liedberg, B.; Parikh, A.N.; Cho, N.J. Observation of Stripe Superstructure in the β-Two-Phase Coexistence Region of Cholesterol-Phospholipid Mixtures in Supported Membranes. J. Am. Chem. Soc. 2014, 136, 16962–16965. [Google Scholar] [CrossRef]
  30. Tabaei, S.R.; Jackman, J.A.; Kim, S.-O.; Zhdanov, V.P.; Cho, N.-J. Solvent-Assisted Lipid Self-Assembly at Hydrophilic Surfaces: Factors Influencing the Formation of Supported Membranes. Langmuir 2015, 31, 3125–3134. [Google Scholar] [CrossRef] [PubMed]
  31. Gillissen, J.J.; Tabaei, S.R.; Cho, N.J. A phenomenological model of the solvent-assisted lipid bilayer formation method. Phys. Chem. Chem. Phys. 2016, 18, 24157–24163. [Google Scholar] [CrossRef] [Green Version]
  32. Tabaei, S.R.; Choi, J.H.; Haw Zan, G.; Zhdanov, V.P.; Cho, N.J. Solvent-assisted lipid bilayer formation on silicon dioxide and gold. Langmuir 2014, 30, 10363–10373. [Google Scholar] [CrossRef]
  33. Efremov, A.; Mauro, J.C.; Raghavan, S. Macroscopic model of phospholipid vesicle spreading and rupture. Langmuir 2004, 20, 5724–5731. [Google Scholar] [CrossRef] [PubMed]
  34. Arsene, M.-L.; Răut, I.; Călin, M.; Jecu, M.-L.; Doni, M.; Gurban, A.-M. Versatility of Reverse Micelles: From Biomimetic Models to Nano (Bio)Sensor Design. Processes 2021, 9, 345. [Google Scholar] [CrossRef]
  35. Lombardo, D.; Kiselev, M.A.; Magazù, S.; Calandra, P. Amphiphiles Self-Assembly: Basic Concepts and Future Perspectives of Supramolecular Approaches. Adv. Condens. Matter Phys. 2015, 2015, 151683. [Google Scholar] [CrossRef] [Green Version]
  36. Paterson, D.J.; Tassieri, M.; Reboud, J.; Wilson, R.; Cooper, J.M. Lipid Topology and Electrostatic Interactions Underpin Lytic Activity of Linear Cationic Antimicrobial Peptides in Membranes. Proc. Natl. Acad. Sci. USA 2017, 114, E8324–E8332. [Google Scholar] [CrossRef] [Green Version]
  37. Wnętrzak, A.; Łątka, K.; Dynarowicz-Łątka, P. Interactions of Alkylphosphocholines with Model Membranes—The Langmuir Monolayer Study. J. Membr. Biol. 2013, 246, 453–466. [Google Scholar] [CrossRef] [Green Version]
  38. Czolkos, I.; Hakonen, B.; Orwar, O.; Jesorka, A. High-Resolution Micropatterned Teflon AF Substrates for Biocompatible Nanofluidic Devices. Langmuir 2012, 28, 3200–3205. [Google Scholar] [CrossRef] [PubMed]
  39. Erkan, Y.; Halma, K.; Czolkos, I.; Jesorka, A.; Dommersnes, P.; Kumar, R.; Brown, T.; Orwar, O. Controlled Release of Chol-TEG-DNA from Nano- and Micropatterned SU-8 Surfaces by a Spreading Lipid Film. Nano Lett. 2008, 8, 227–231. [Google Scholar] [CrossRef]
  40. Janshoff, A.; Galla, H.J.; Steinem, C. Piezoelectric Mass-Sensing Devices as Biosensors-An Alternative to Optical Biosensors? Angew. Chem. Int. Ed. Engl. 2000, 39, 4004–4032. [Google Scholar] [CrossRef]
  41. Edvardsson, M.; Svedhem, S.; Wang, G.; Richter, R.; Rodahl, M.; Kasemo, B. QCM-D and Reflectometry Instrument: Applications to Supported Lipid Structures and Their Biomolecular Interactions. Anal. Chem. 2009, 81, 349–361. [Google Scholar] [CrossRef] [PubMed]
  42. Kanazawa, K.K.; Gordon, J.G. Frequency of a quartz microbalance in contact with liquid. Anal. Chem. 1985, 57, 1770–1771. [Google Scholar] [CrossRef]
  43. Mangiarotti, A.; Wilke, N. Energetics of the Phase Transition in Free-Standing versus Supported Lipid Membranes. J. Phys. Chem. B 2015, 119, 8718–8724. [Google Scholar] [CrossRef]
  44. Marsh, D. Equation of State for Phospholipid Self-Assembly. Biophys. J. 2016, 110, 188–196. [Google Scholar] [CrossRef] [Green Version]
  45. Pinto, O.A.; Disalvo, E.A. A new model for lipid monolayer and bilayers based on thermodynamics of irreversible processes. PLoS ONE 2019, 14, e0212269. [Google Scholar] [CrossRef] [PubMed] [Green Version]
  46. Braganza, L.F.; Worcester, D.L. Hydrostatic pressure induces hydrocarbon chain interdigitation in single-component phospholipid bilayers. Biochemistry 1986, 25, 2591–2596. [Google Scholar] [CrossRef]
  47. Kučerka, N.; Nieh, M.-P.; Katsaras, J. Fluid phase lipid areas and bilayer thicknesses of commonly used phosphatidylcholines as a function of temperature. Biochim. Biophys. Acta Biomembr. 2011, 1808, 2761–2771. [Google Scholar] [CrossRef] [PubMed]
  48. Eicher, B.; Marquardt, D.; Heberle, F.A.; Letofsky-Papst, I.; Rechberger, G.N.; Appavou, M.S.; Katsaras, J.; Pabst, G. Intrinsic Curvature-Mediated Transbilayer Coupling in Asymmetric Lipid Vesicles. Biophys J. 2018, 114, 146–157. [Google Scholar] [CrossRef] [PubMed] [Green Version]
  49. Leekumjorn, S.; Sum, A.K. Molecular studies of the gel to liquid-crystalline phase transition for fully hydrated DPPC and DPPE bilayers. Biochim. Biophys. Acta 2007, 1768, 354–365. [Google Scholar] [CrossRef] [PubMed] [Green Version]
Figure 1. Schematic illustrations of Gibbs free energy profile along the solvent exchange coordinate path during the SALB formation process. (a) Schematic diagram of SLB formation pathway in the SALB method. (b) Expected Gibbs free energy profiles when inverted micelles disassemble and reorganize into different lipid structures in the system with a hydrophilic substrate during solvent exchange. (c) Expected Gibbs free energy profiles when inverted micelles disassemble and reorganize into different lipid structures in the system with a hydrophobic substrate during solvent exchange.
Micromachines 13 00134 g001
Figure 2. Effect of initial DOPC lipid concentration on SLB formation by the SALB method.
Micromachines 13 00134 g002
Figure 3. Effect of temperature during solvent exchange on the final frequency shift (red) and the minimum lipid concentration to form a complete DPPC SLB (black). The sudden drop is located at the phase transition temperature of DPPC, namely, T m = 314   K .
Micromachines 13 00134 g003
Figure 4. Phase diagram of the DPPC SLB coverage produced using the SALB method as a function of temperature and lipid concentration.
Micromachines 13 00134 g004
Publisher’s Note: MDPI stays neutral with regard to jurisdictional claims in published maps and institutional affiliations.

