
Study on Deposition Characteristics of Microparticles in Terminal Pulmonary Acini by IB–LBM


Abstract
1. Introduction
2. Numerical Model
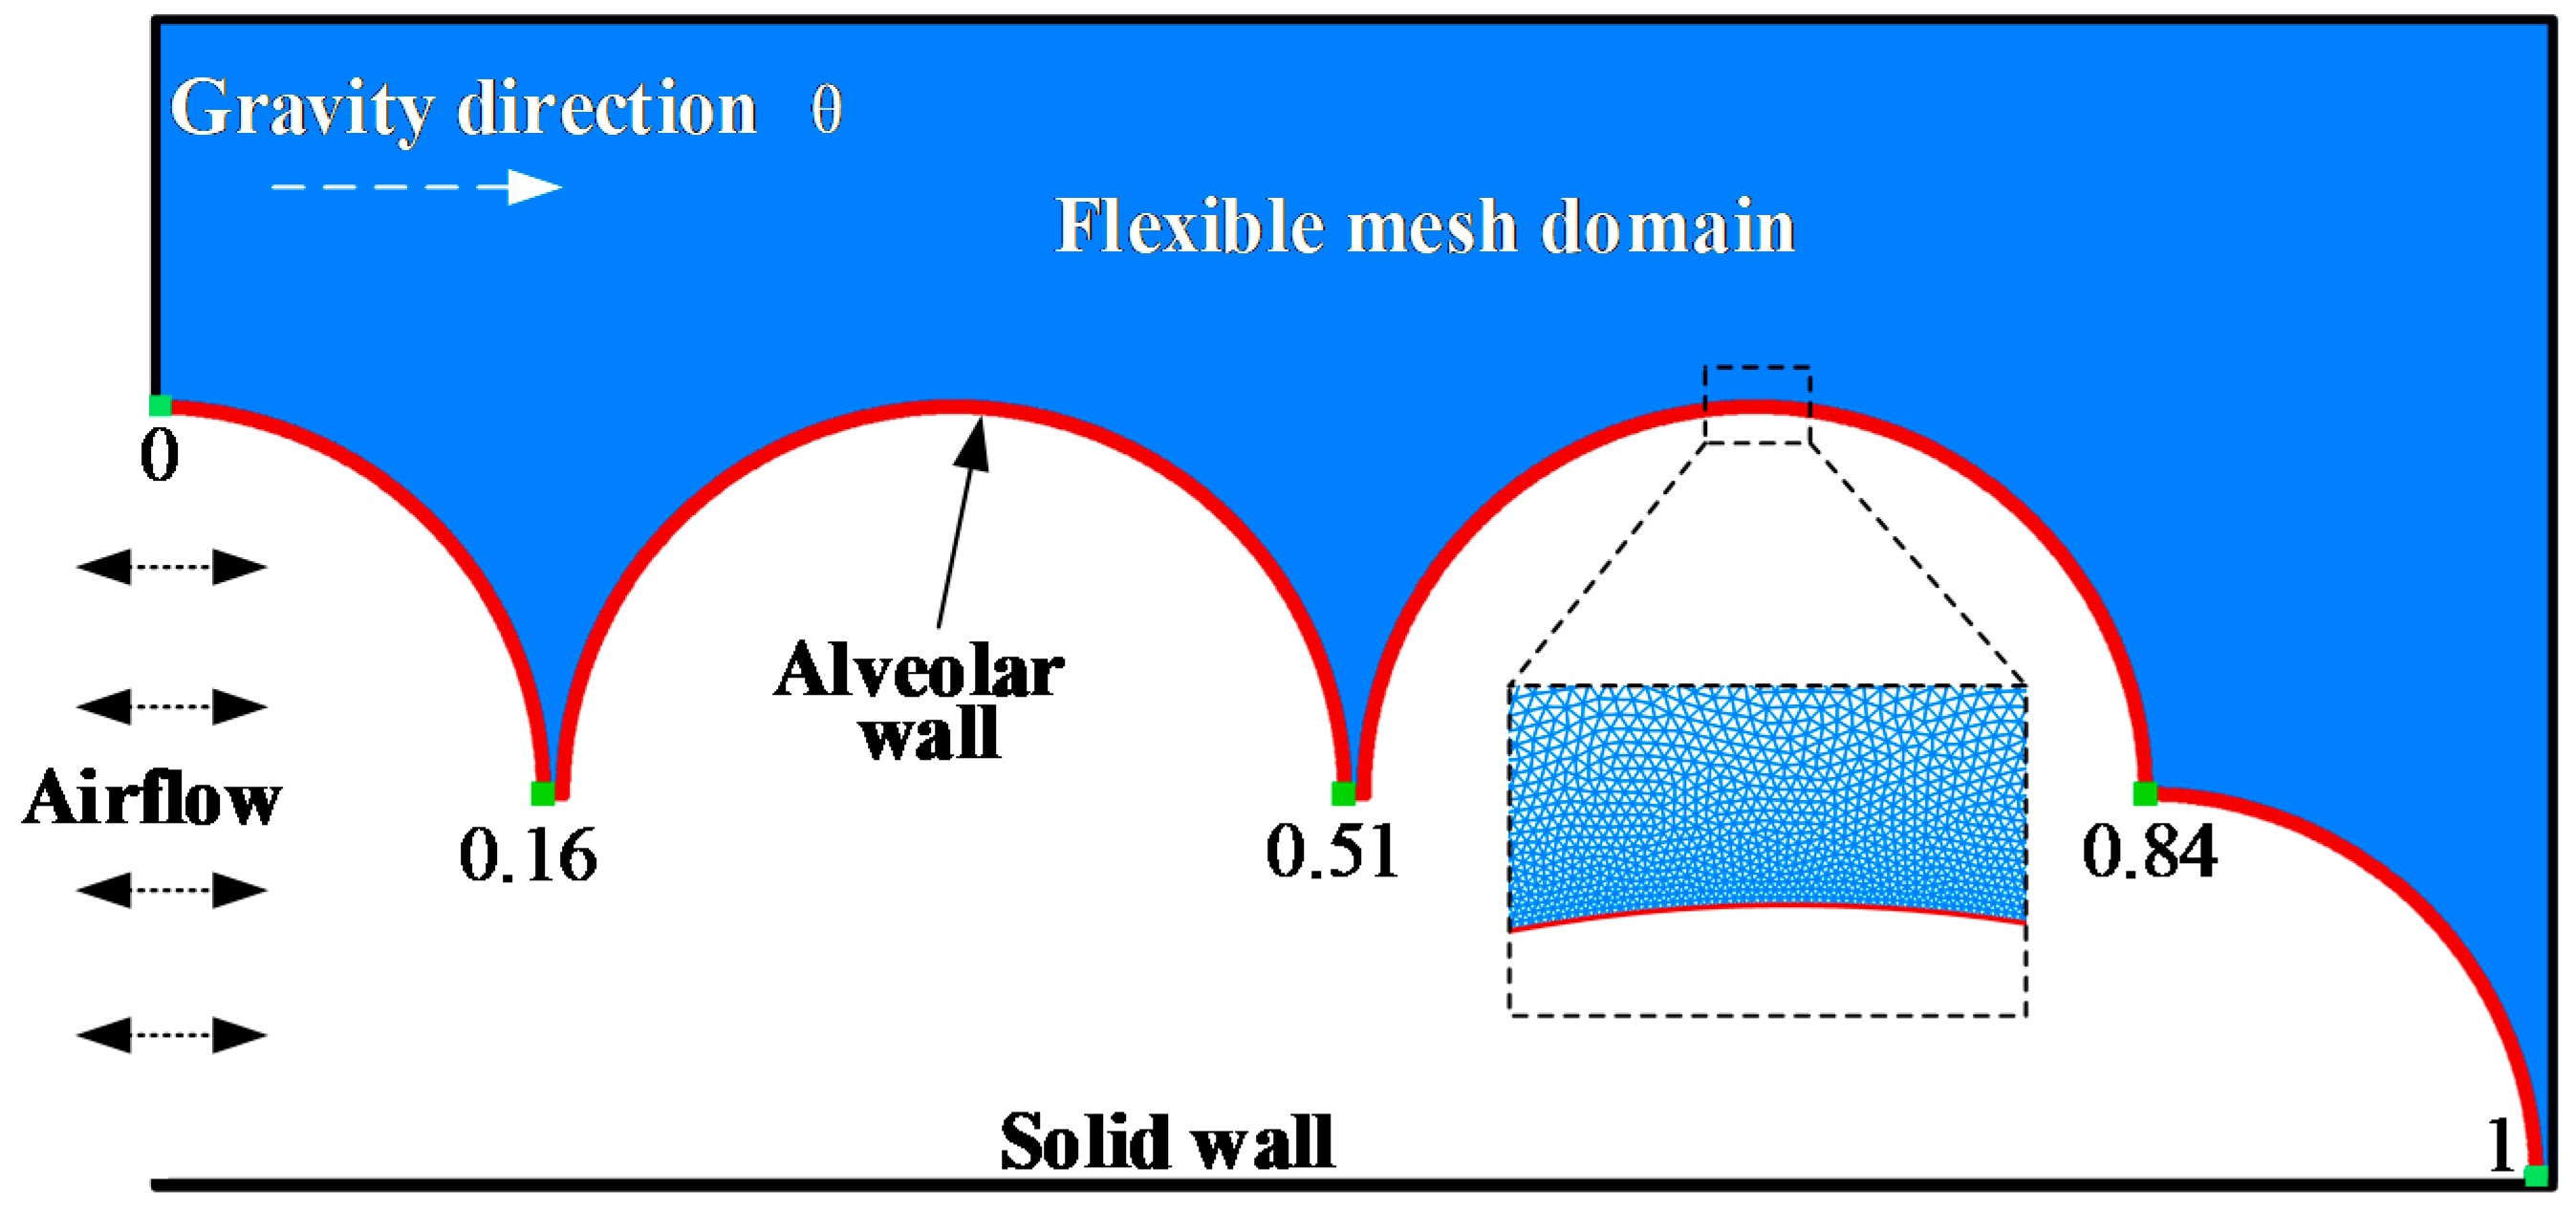
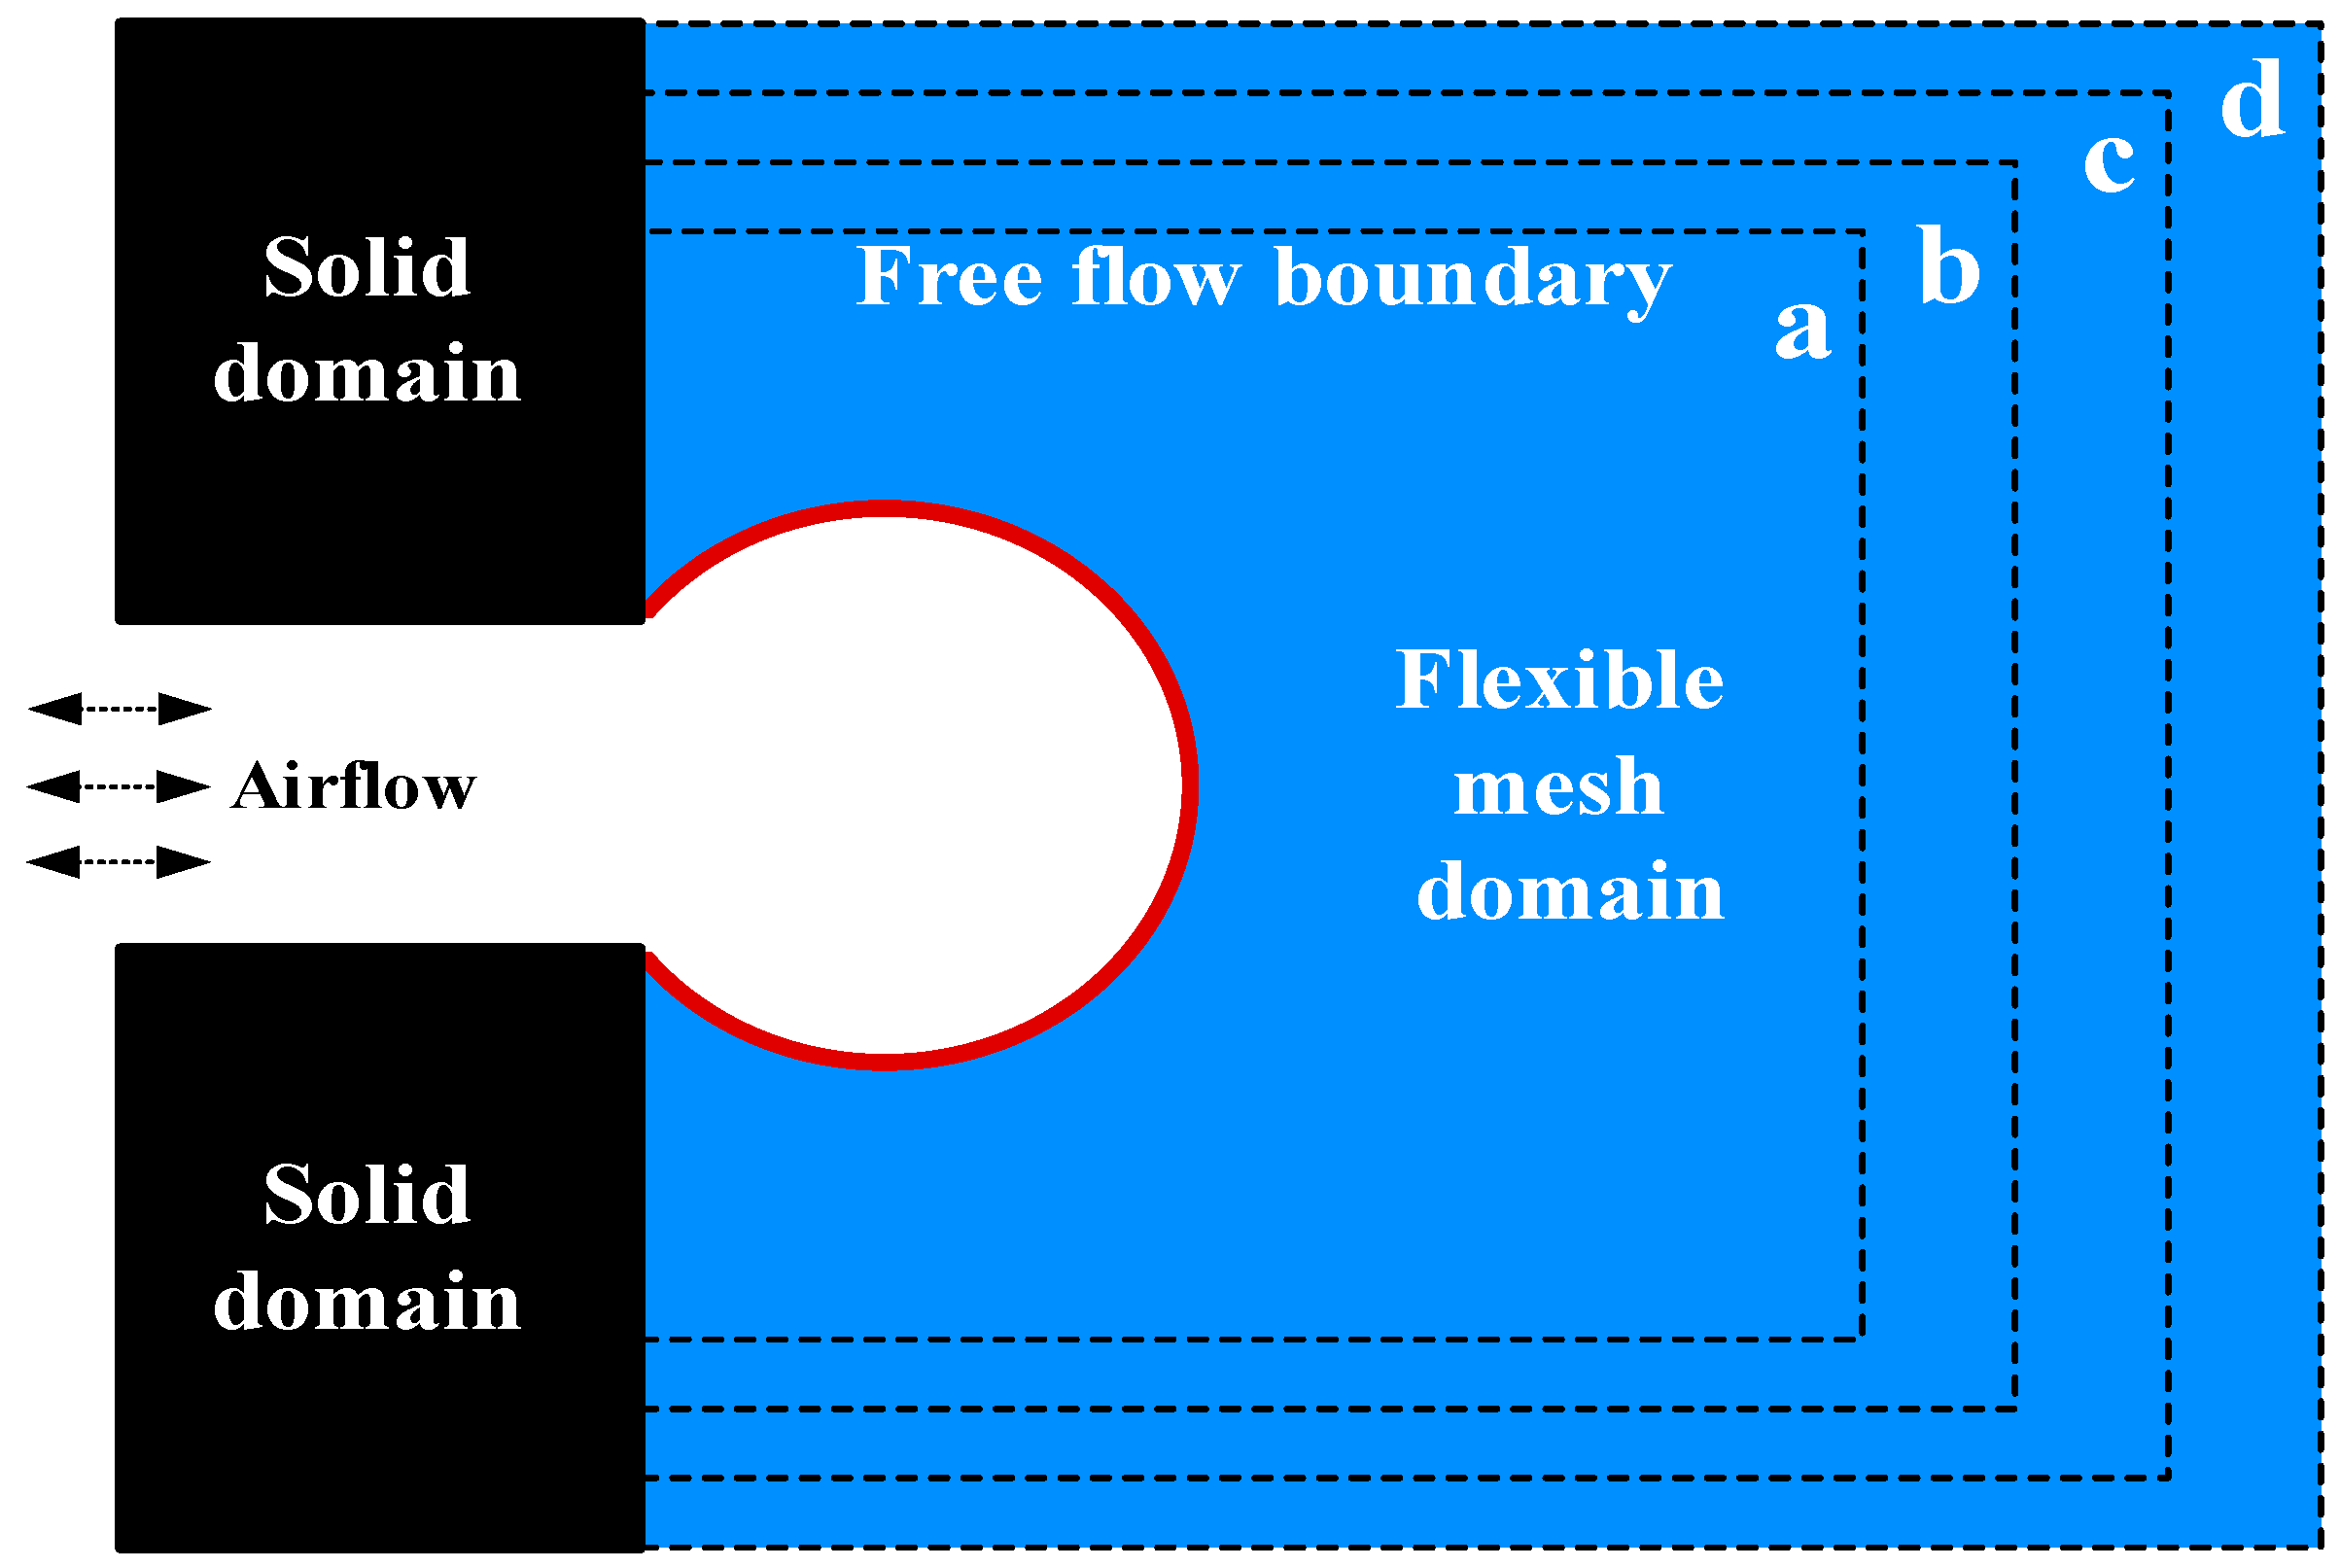
2.1. Alveolar Model
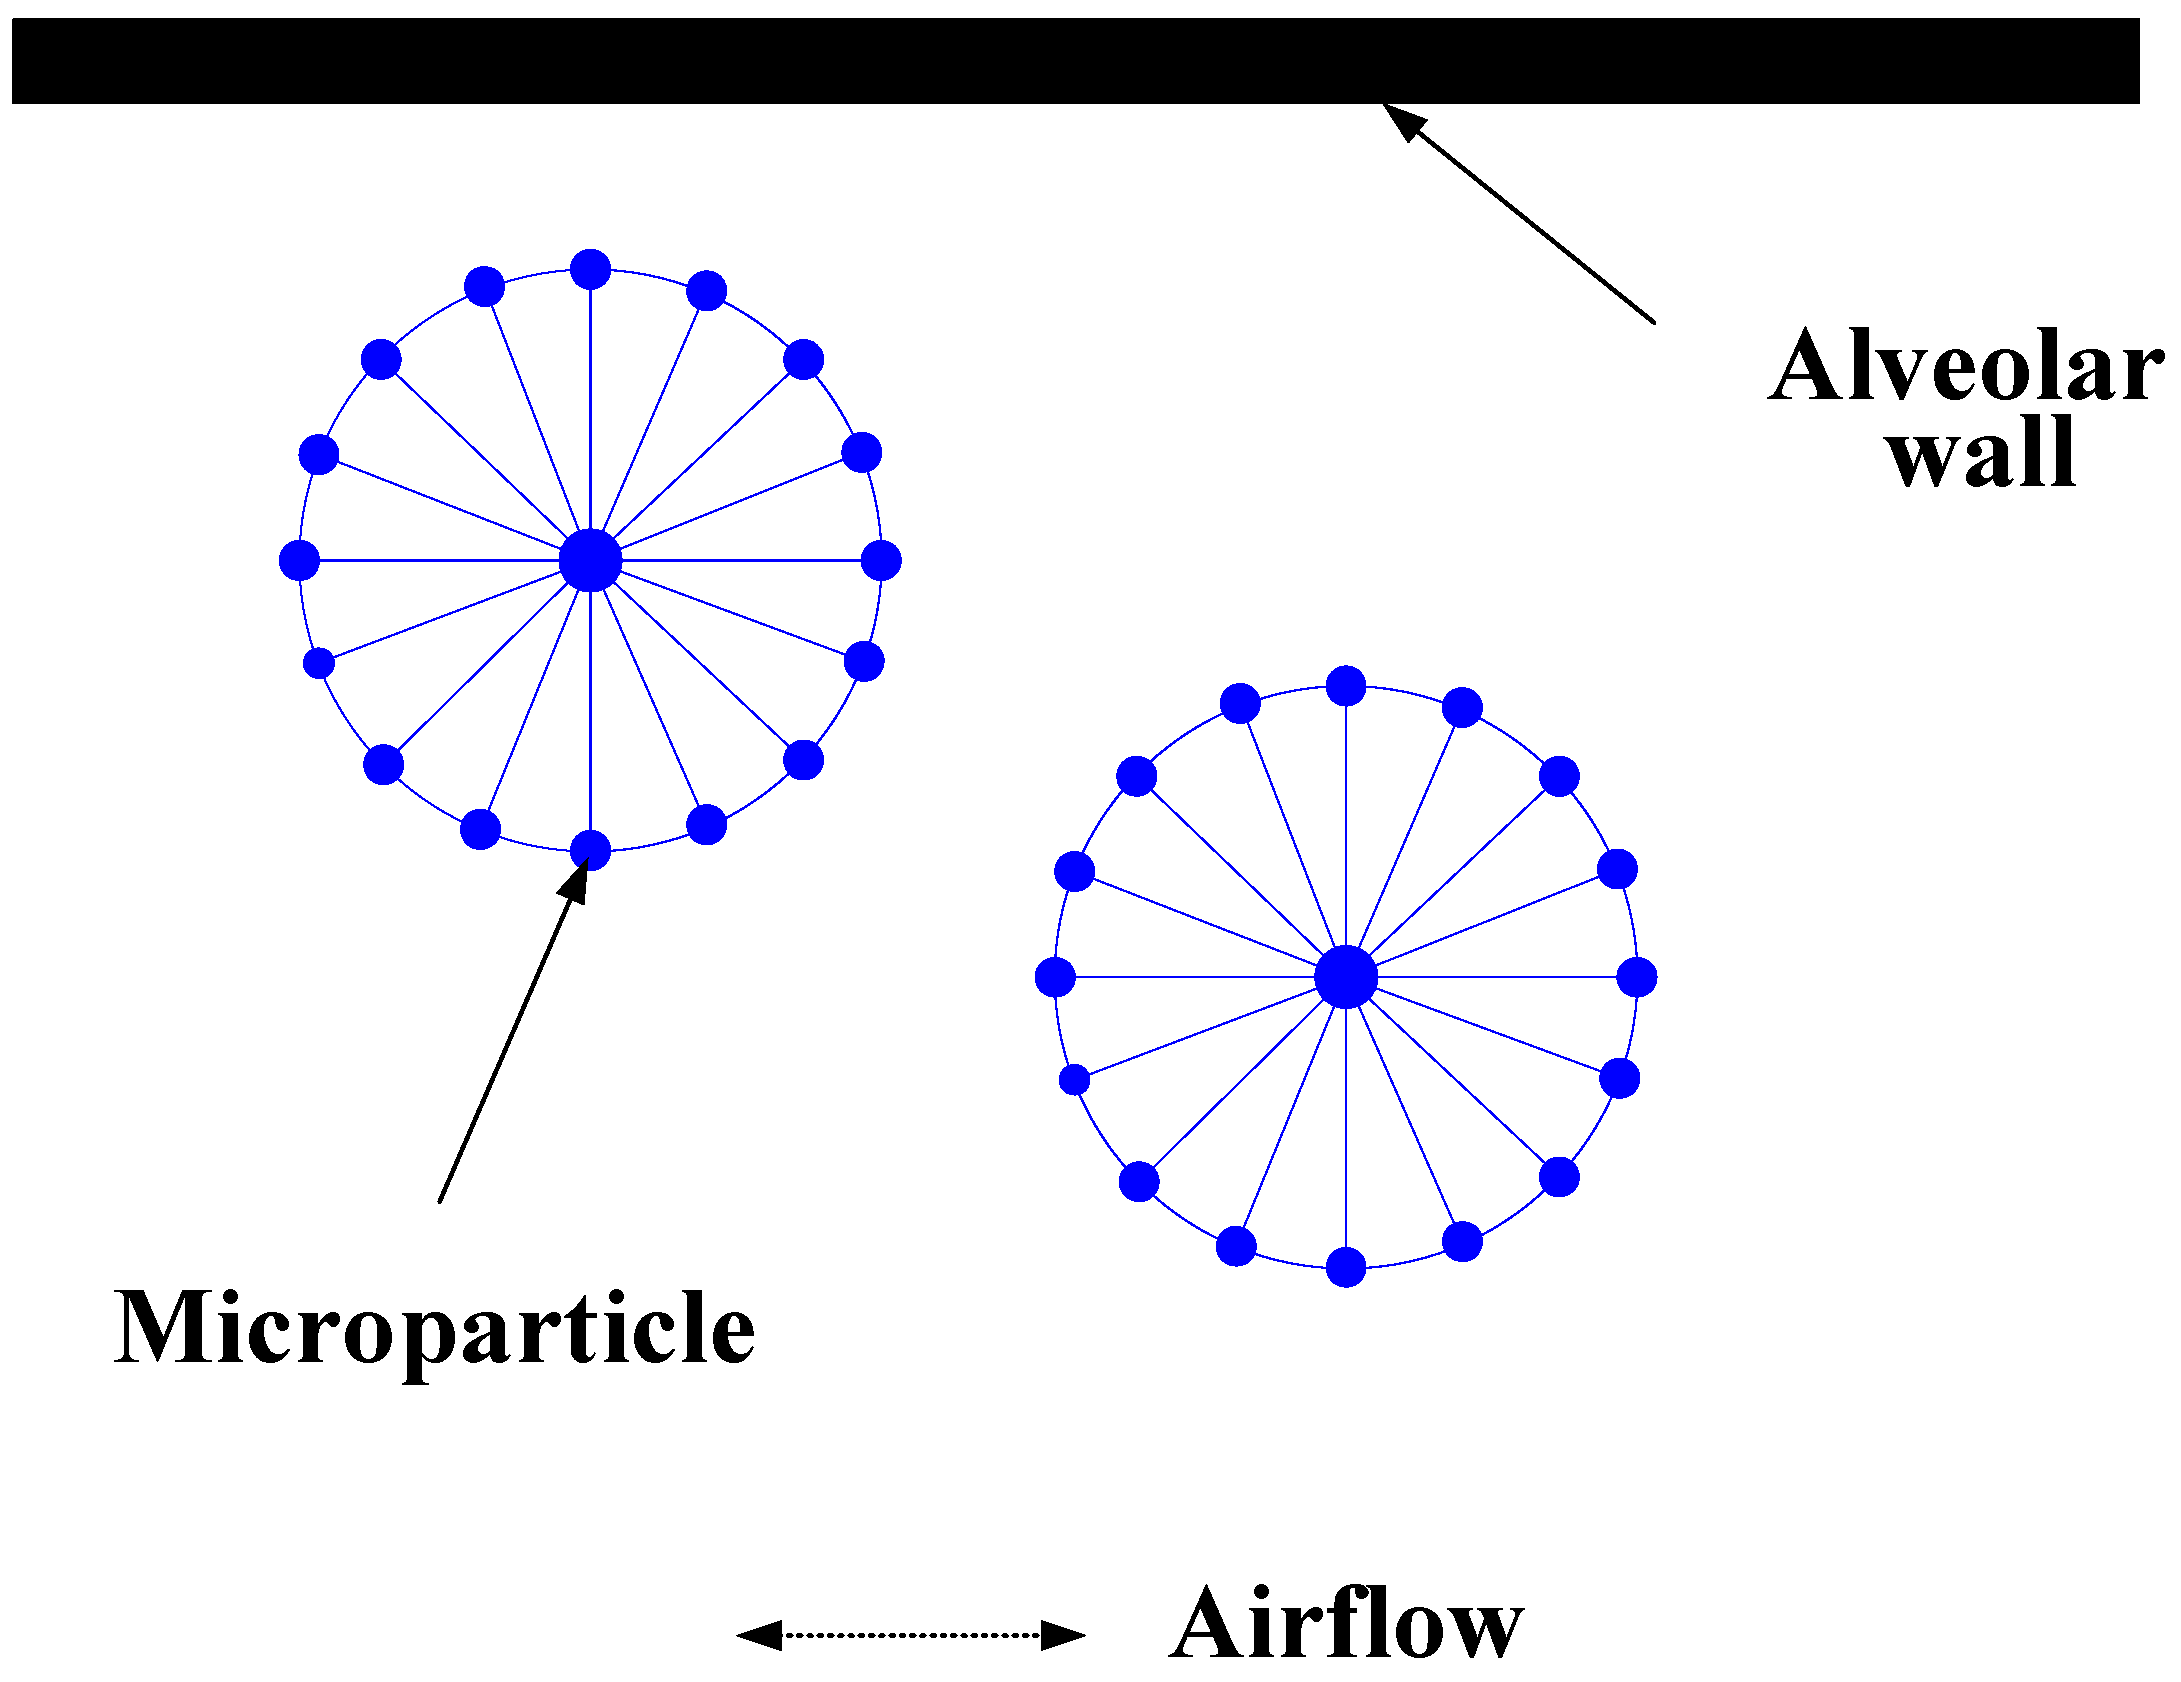
2.2. Microparticles Model
2.3. IB–LBM
3. Validation
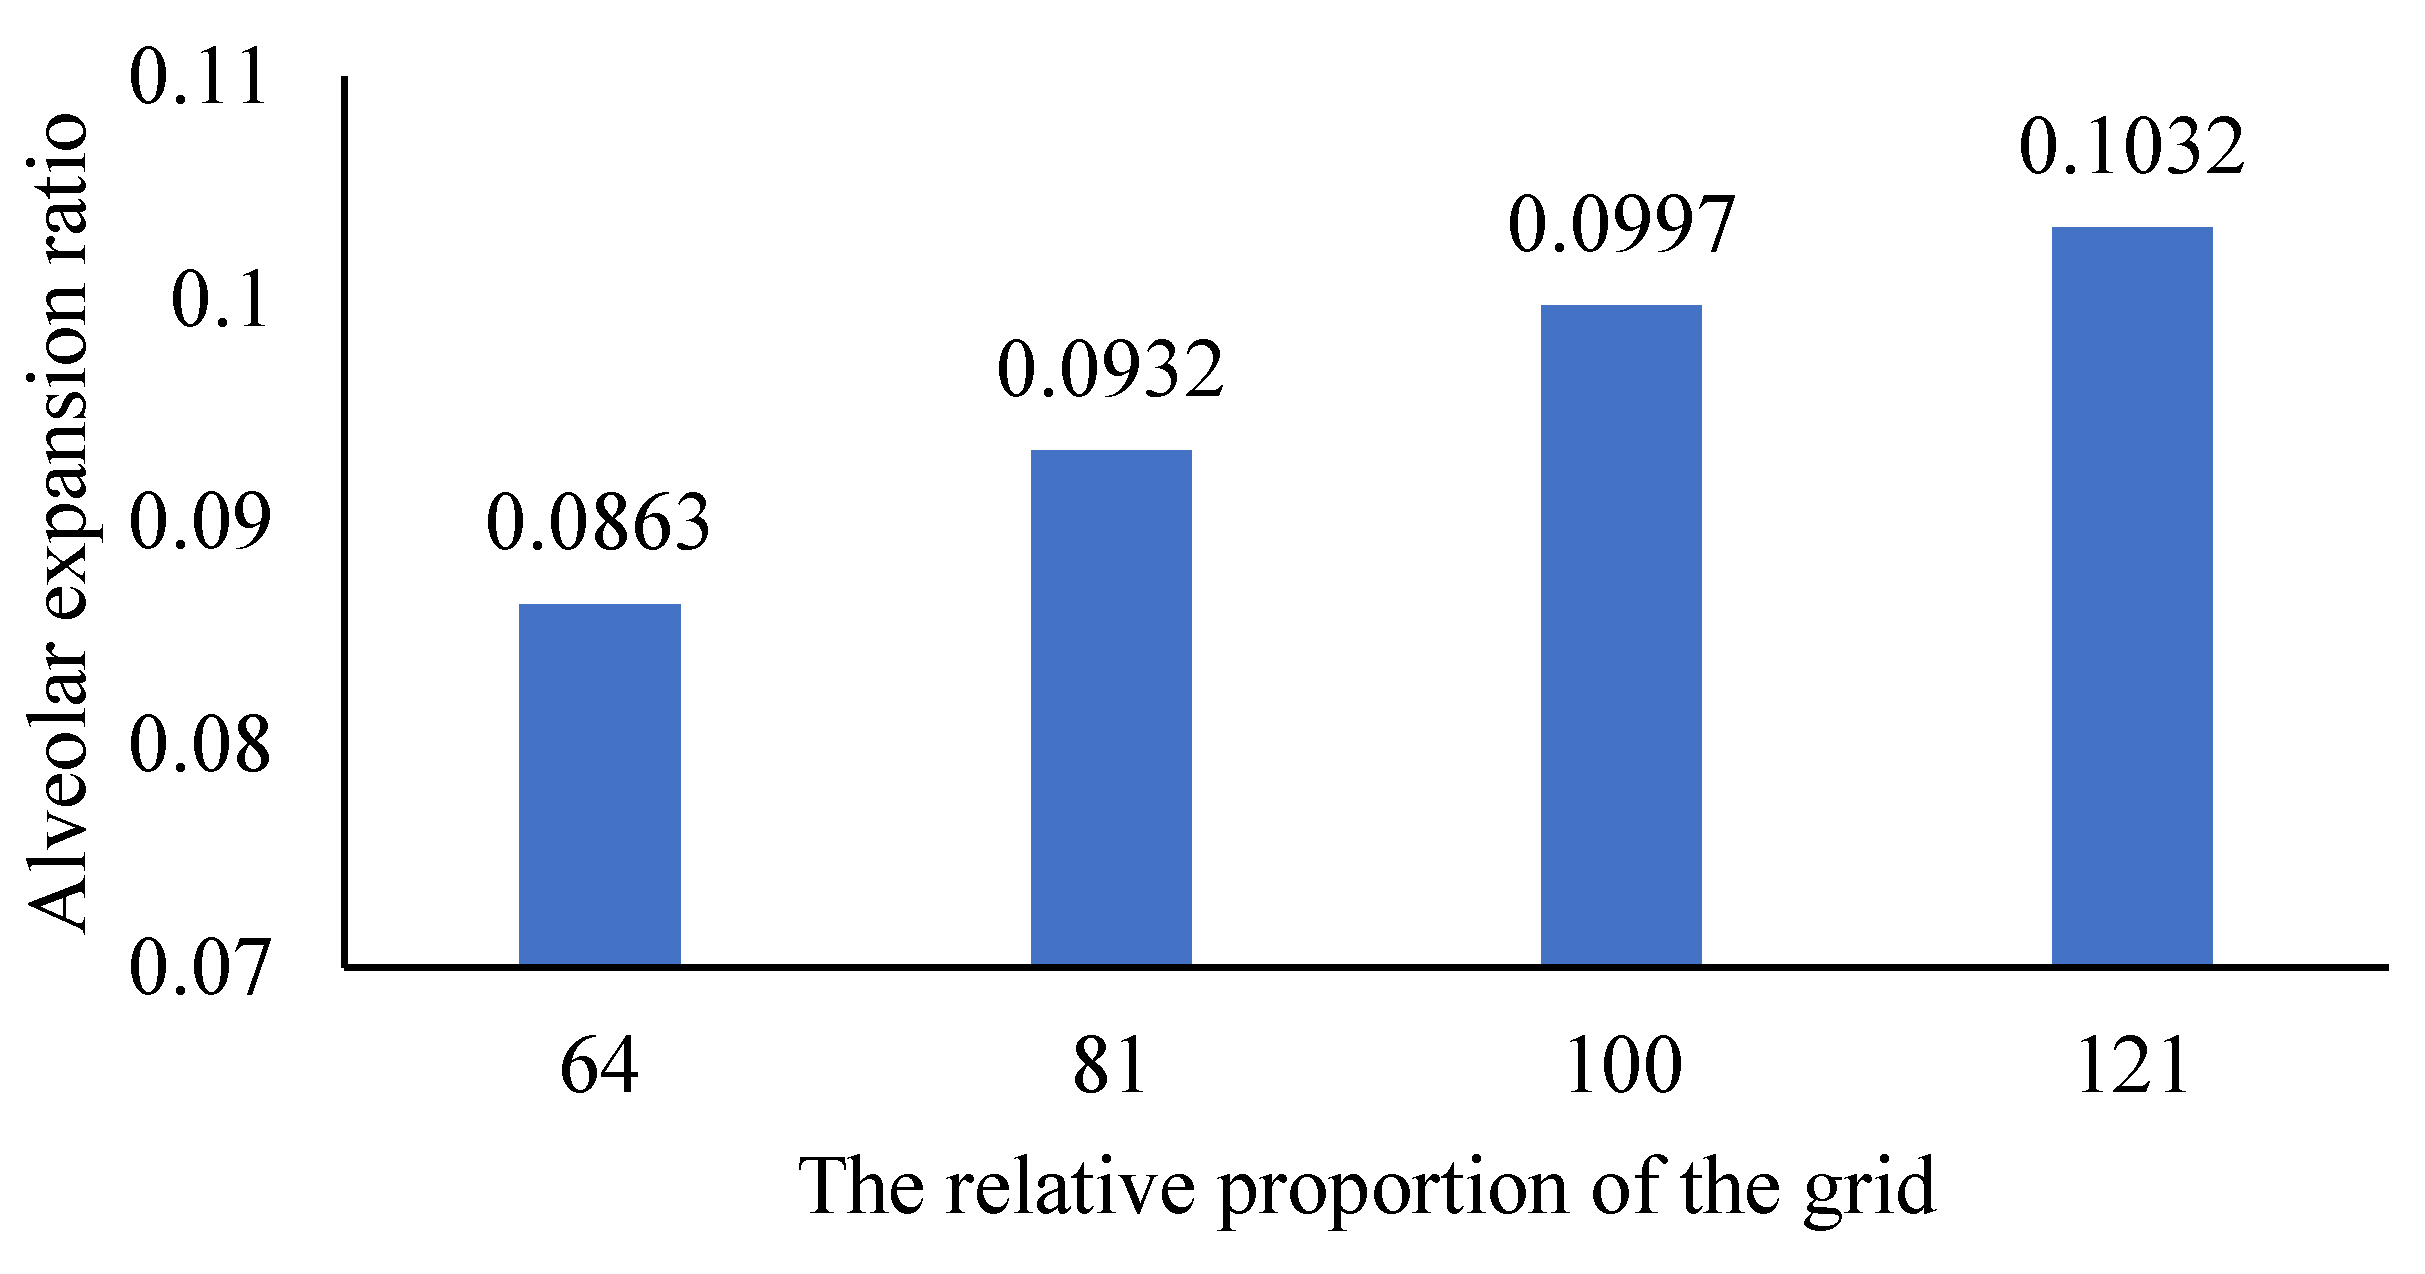
3.1. Grid Independence Validation
- In the initial state, the pressure difference between the alveolar inlet and the free flow boundary is 0. Calculate static pressure using the equation:where is initial density. The alveoli and supporting mesh are free of stress and deformation;
- Change the alveolar inlet pressure by the equation:where is inlet density. We can find the pressure difference by the equation:
- Record the volume of the alveolar expansion when the alveolar expansion reaches a steady state. Expansion ratio is calculated by the equation:where is the volume of the alveoli after expansion. is the volume of the alveoli without expansion. We use grid proportion to represent the variation of support grid, which is calculated by the equation:where is the number of grid points and is the number of alveolar membrane points.
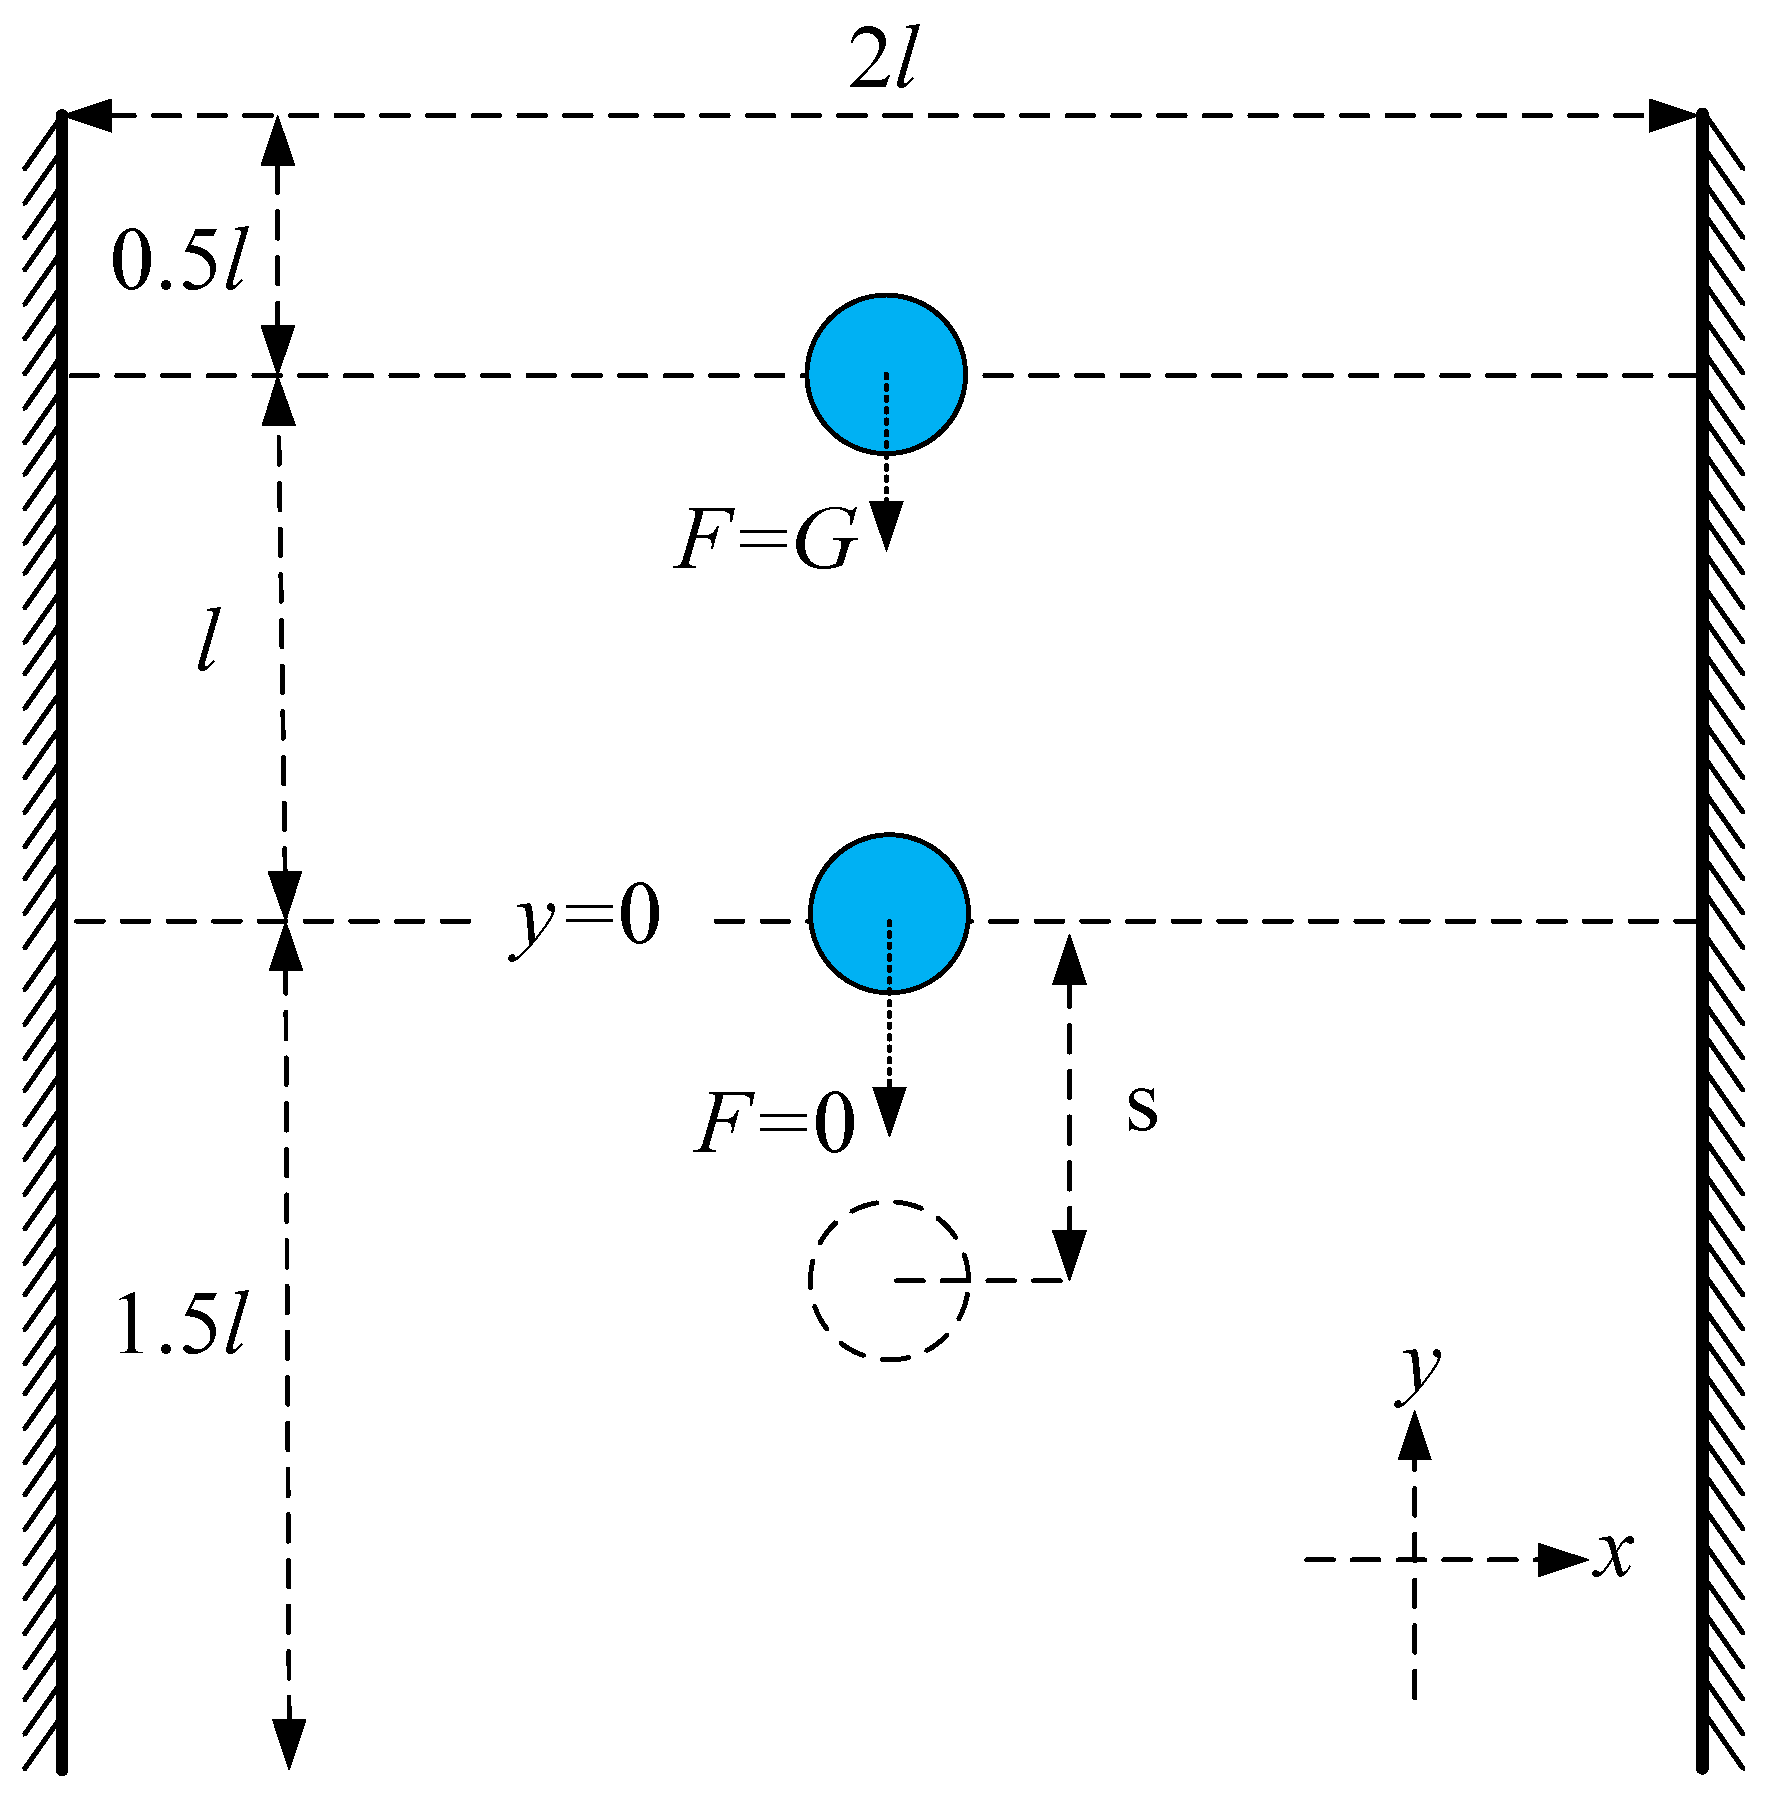
3.2. Validation of Microparticle Inertia Expression Model
4. Results and Discussion
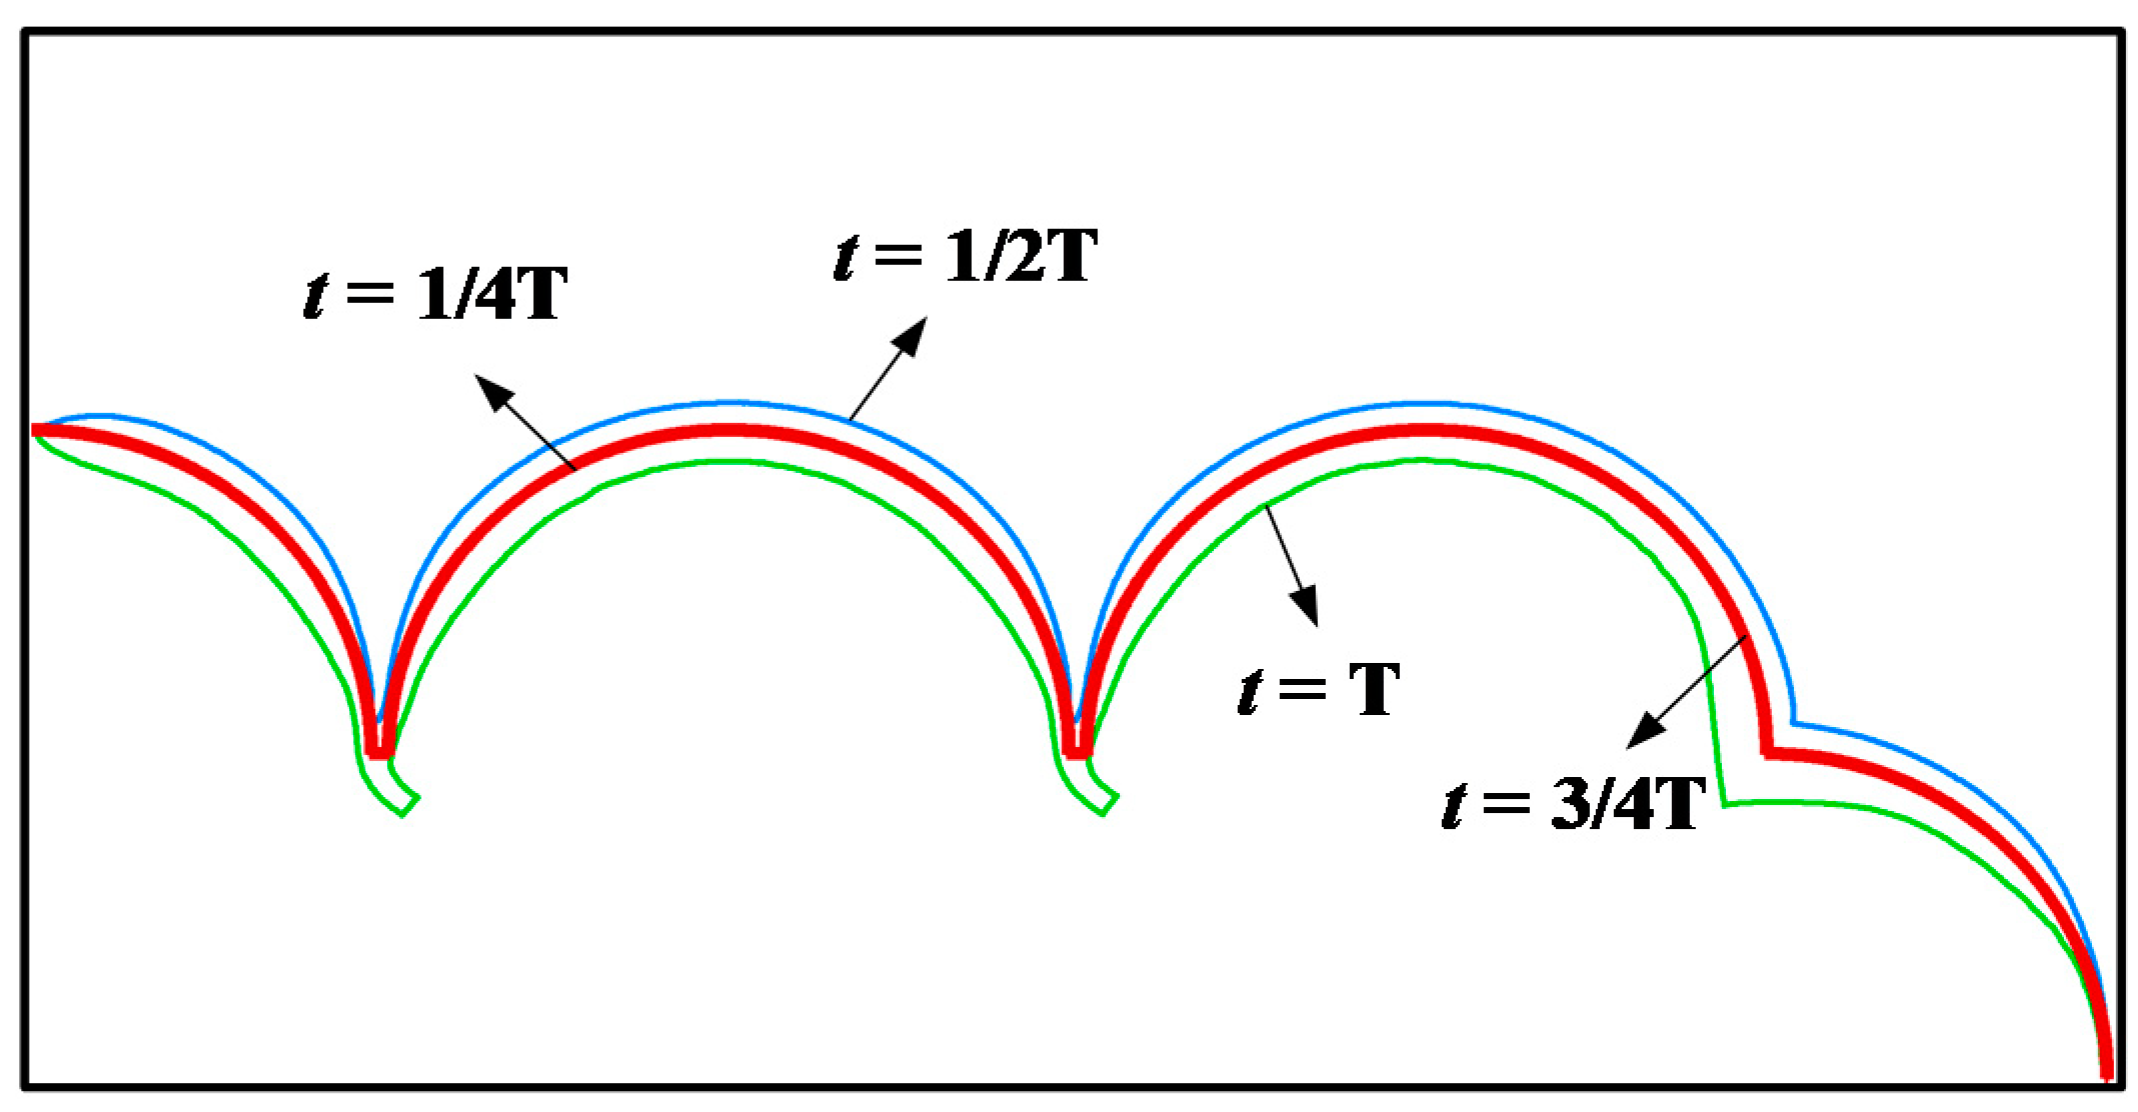
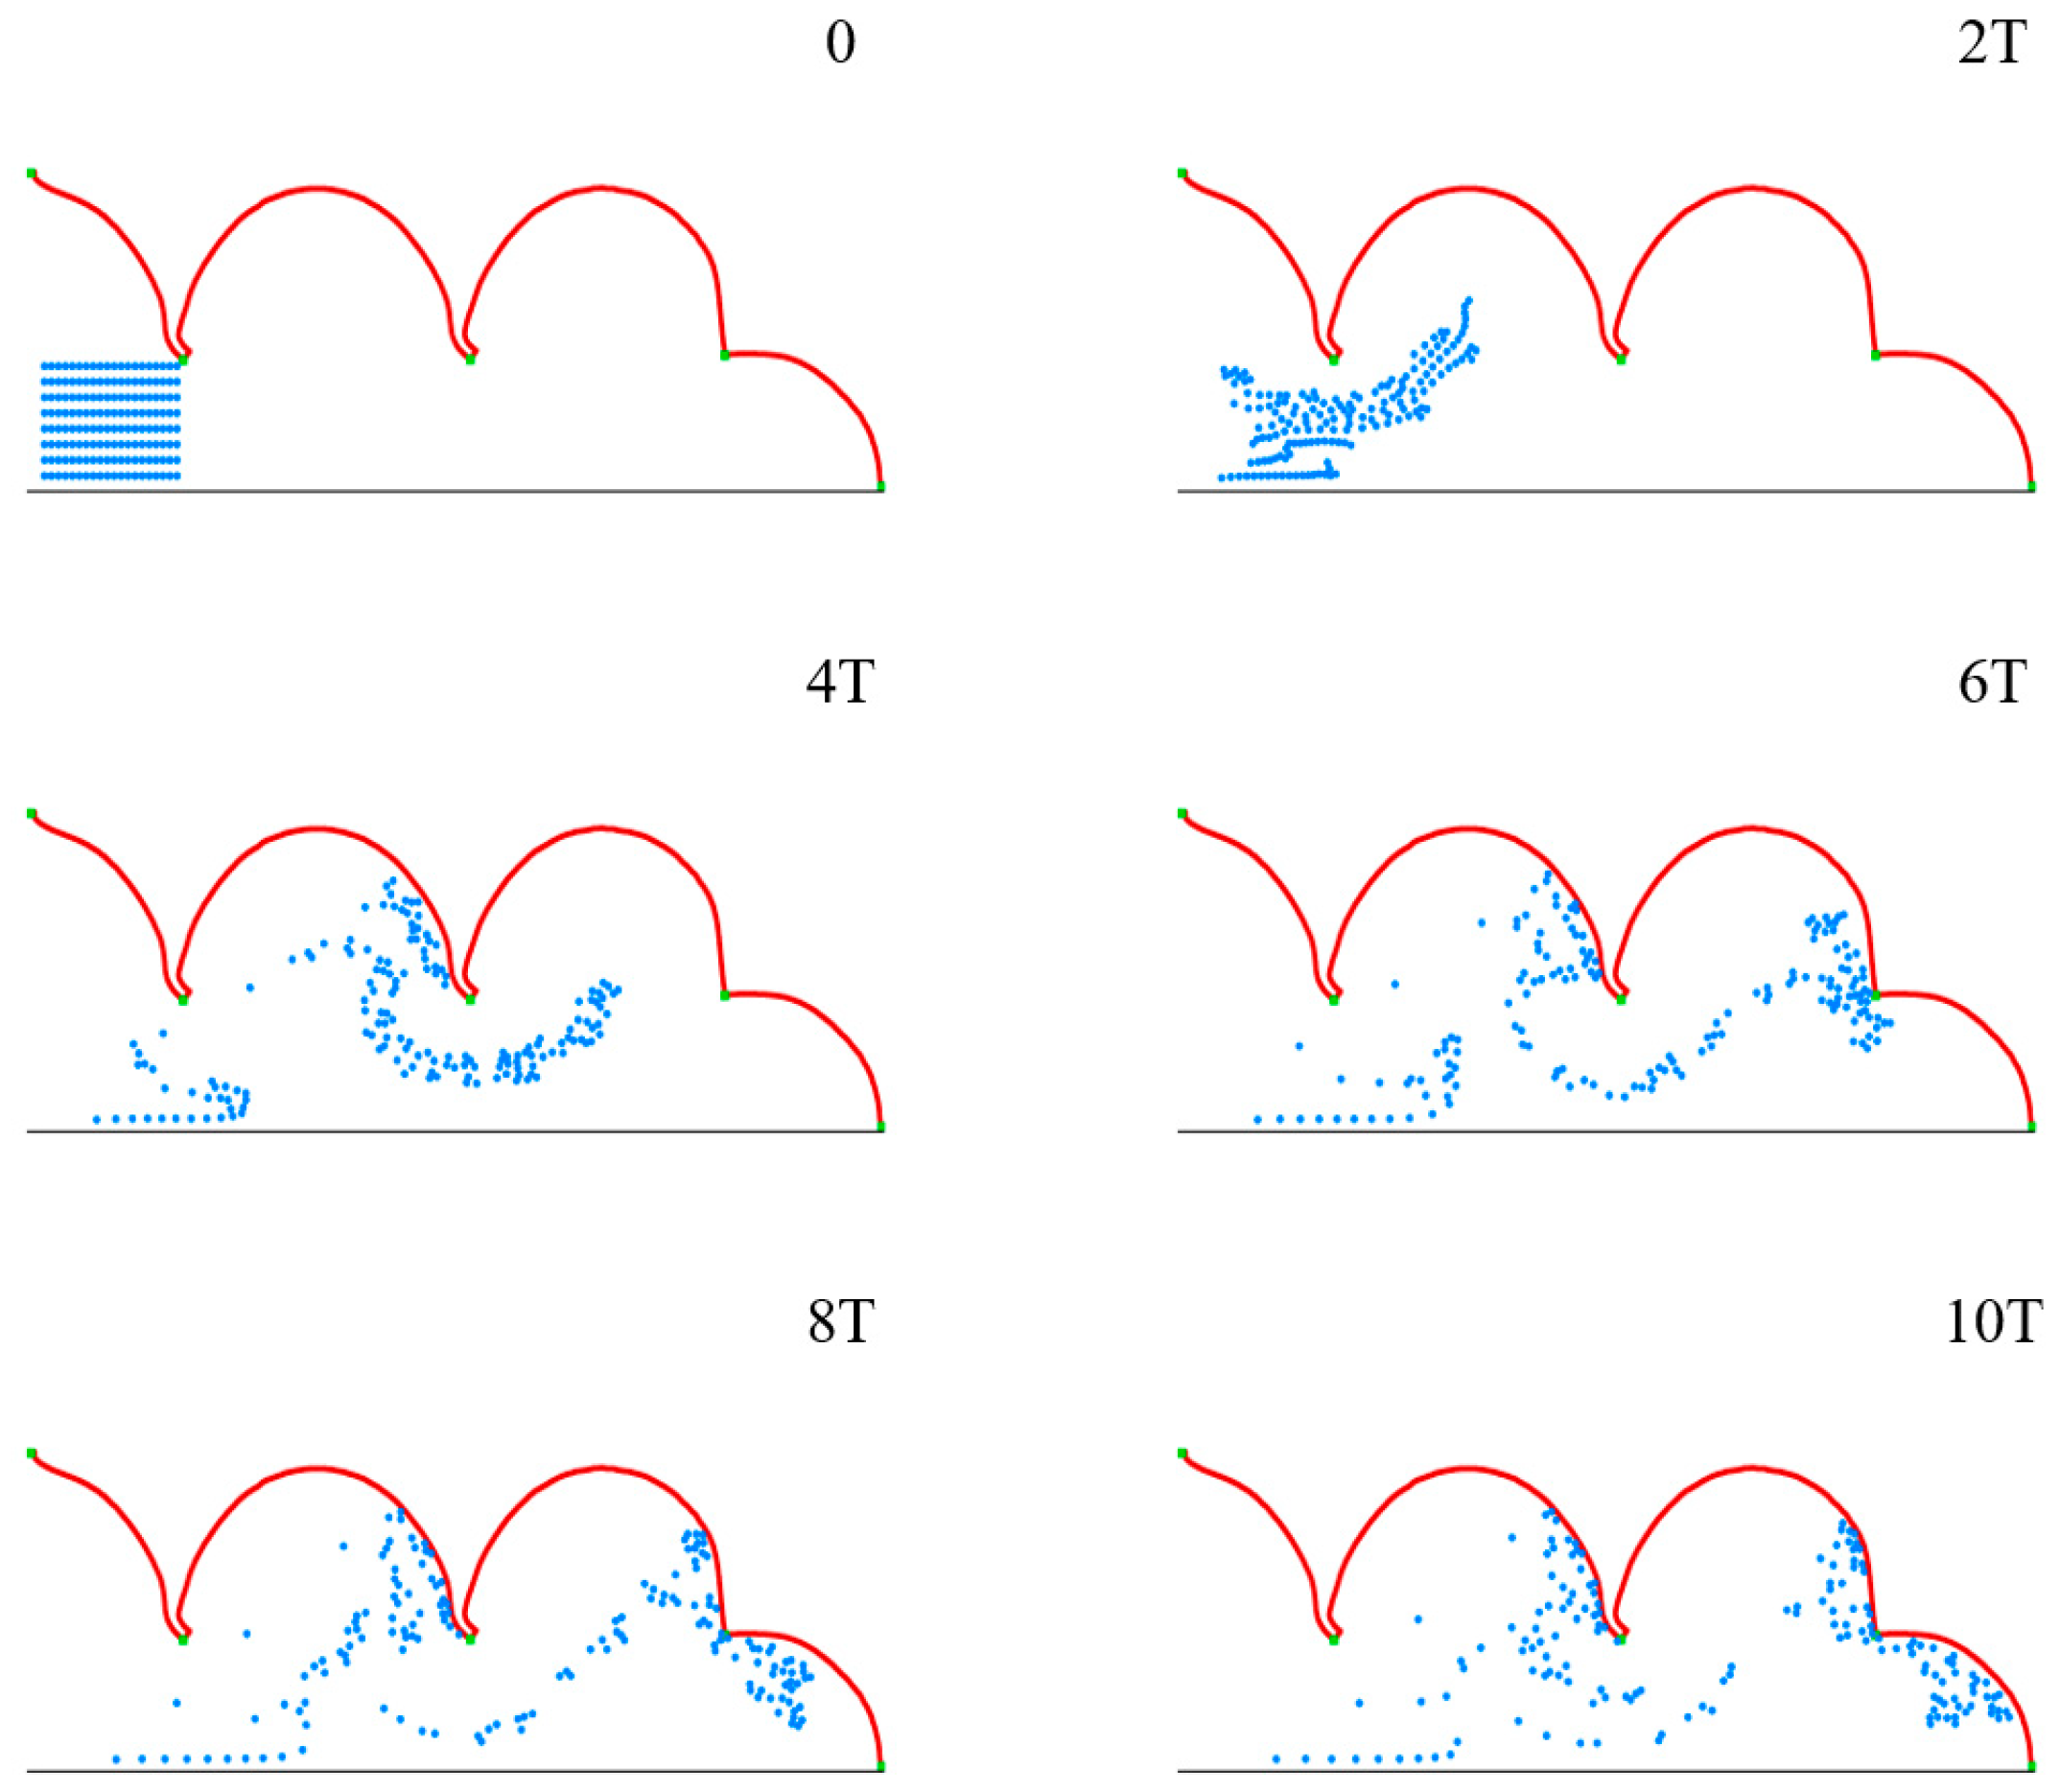
4.1. Respiratory Deformation and Microparticles Movement in Pulmonary Acini
4.2. Movement and Distribution of Microparticles in Pulmonary Acini
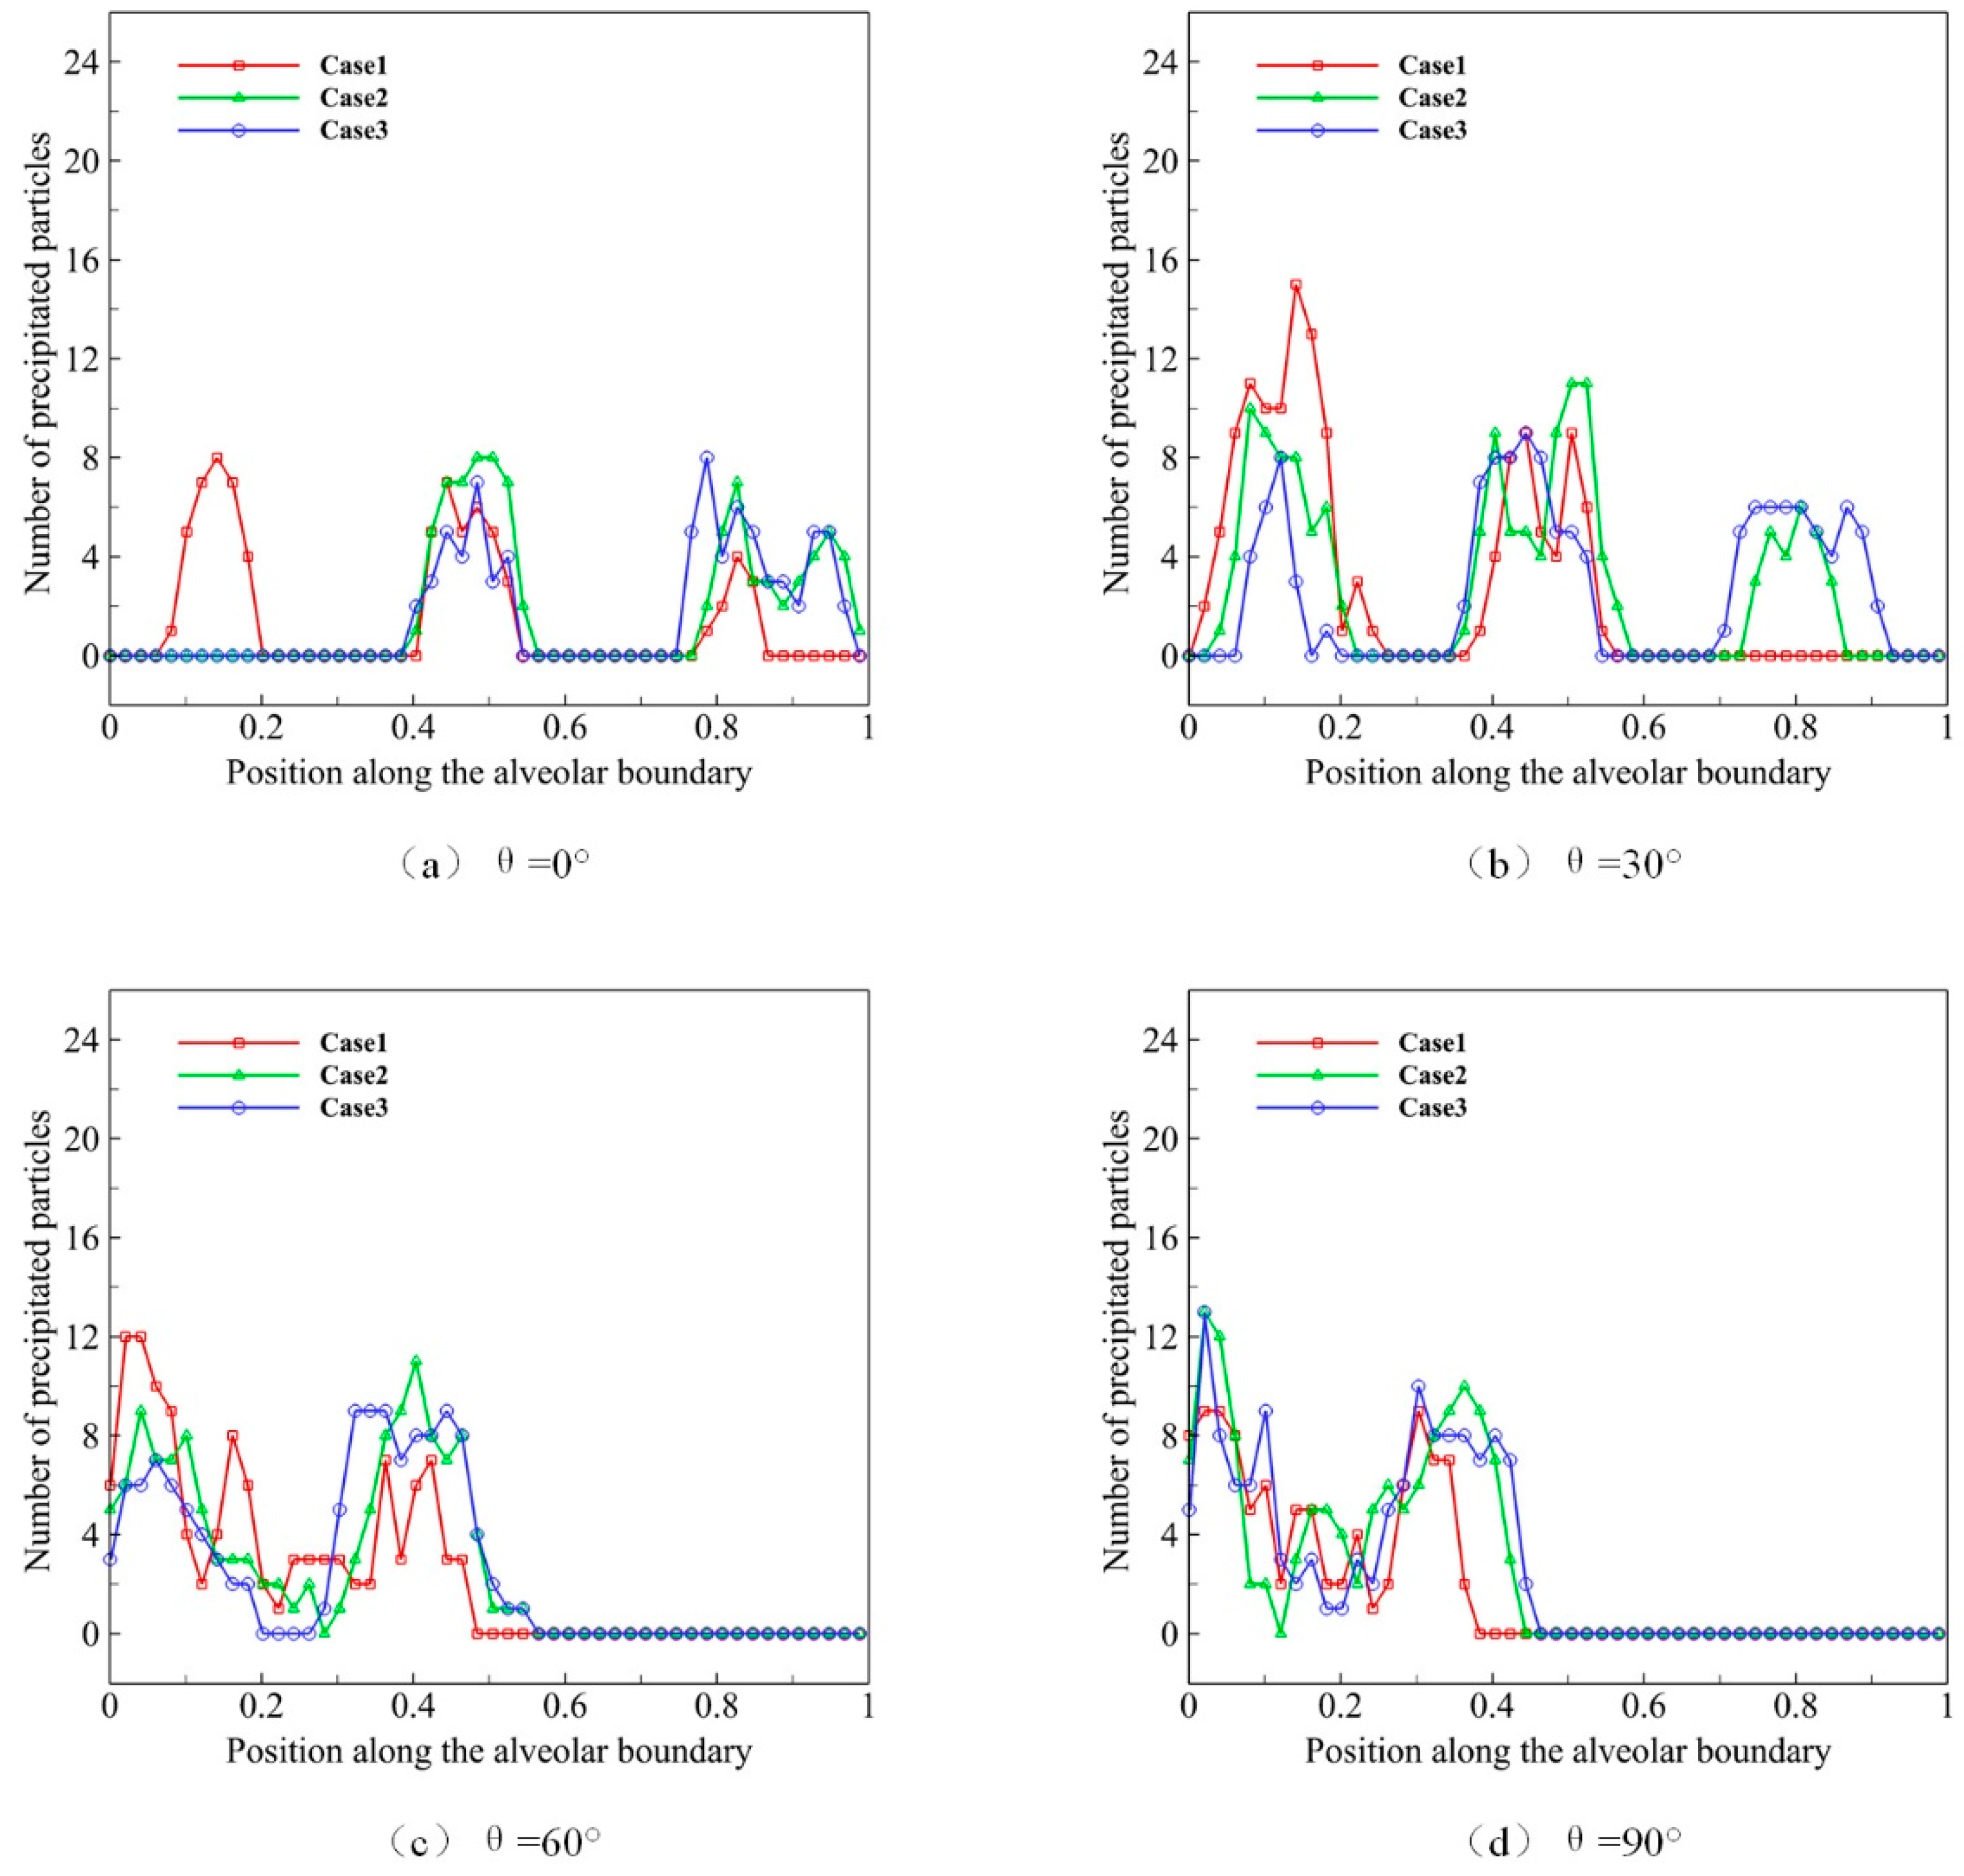
4.3. Effect of Respiratory Depth on Deposition and Distribution of Microparticles
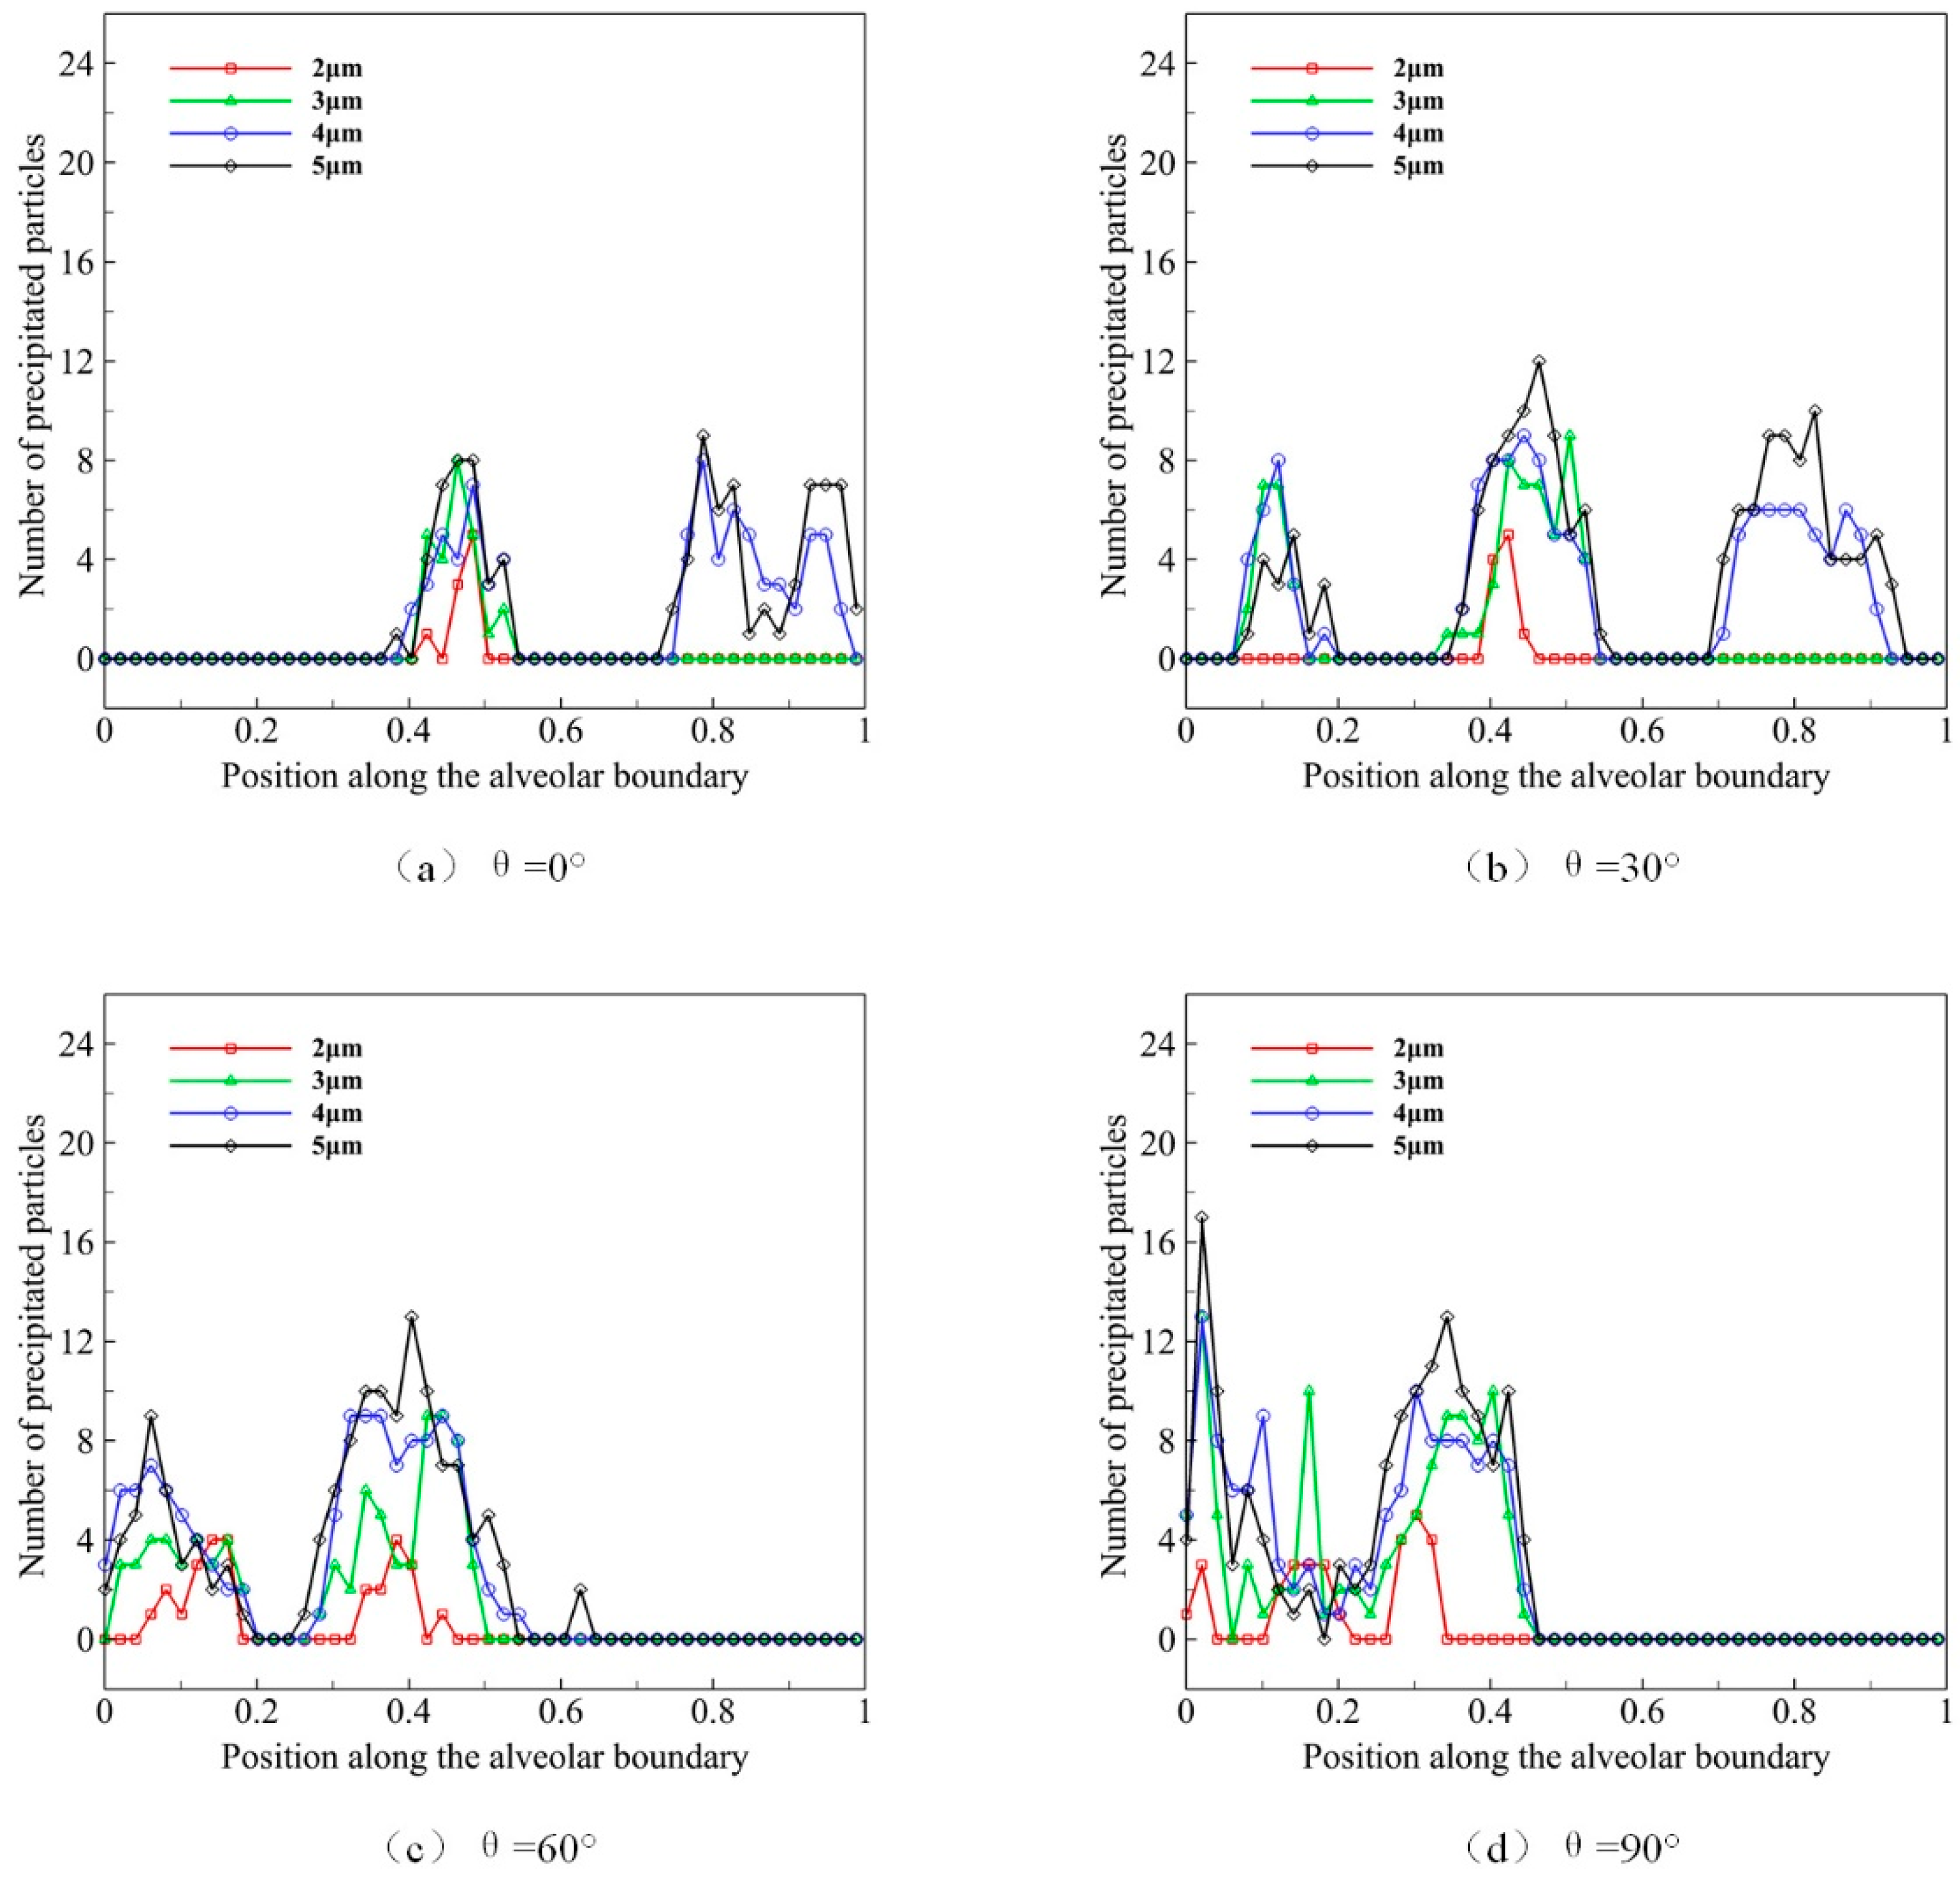
4.4. Effect of Microparticle Diameter on Deposition and Distribution of Microparticles
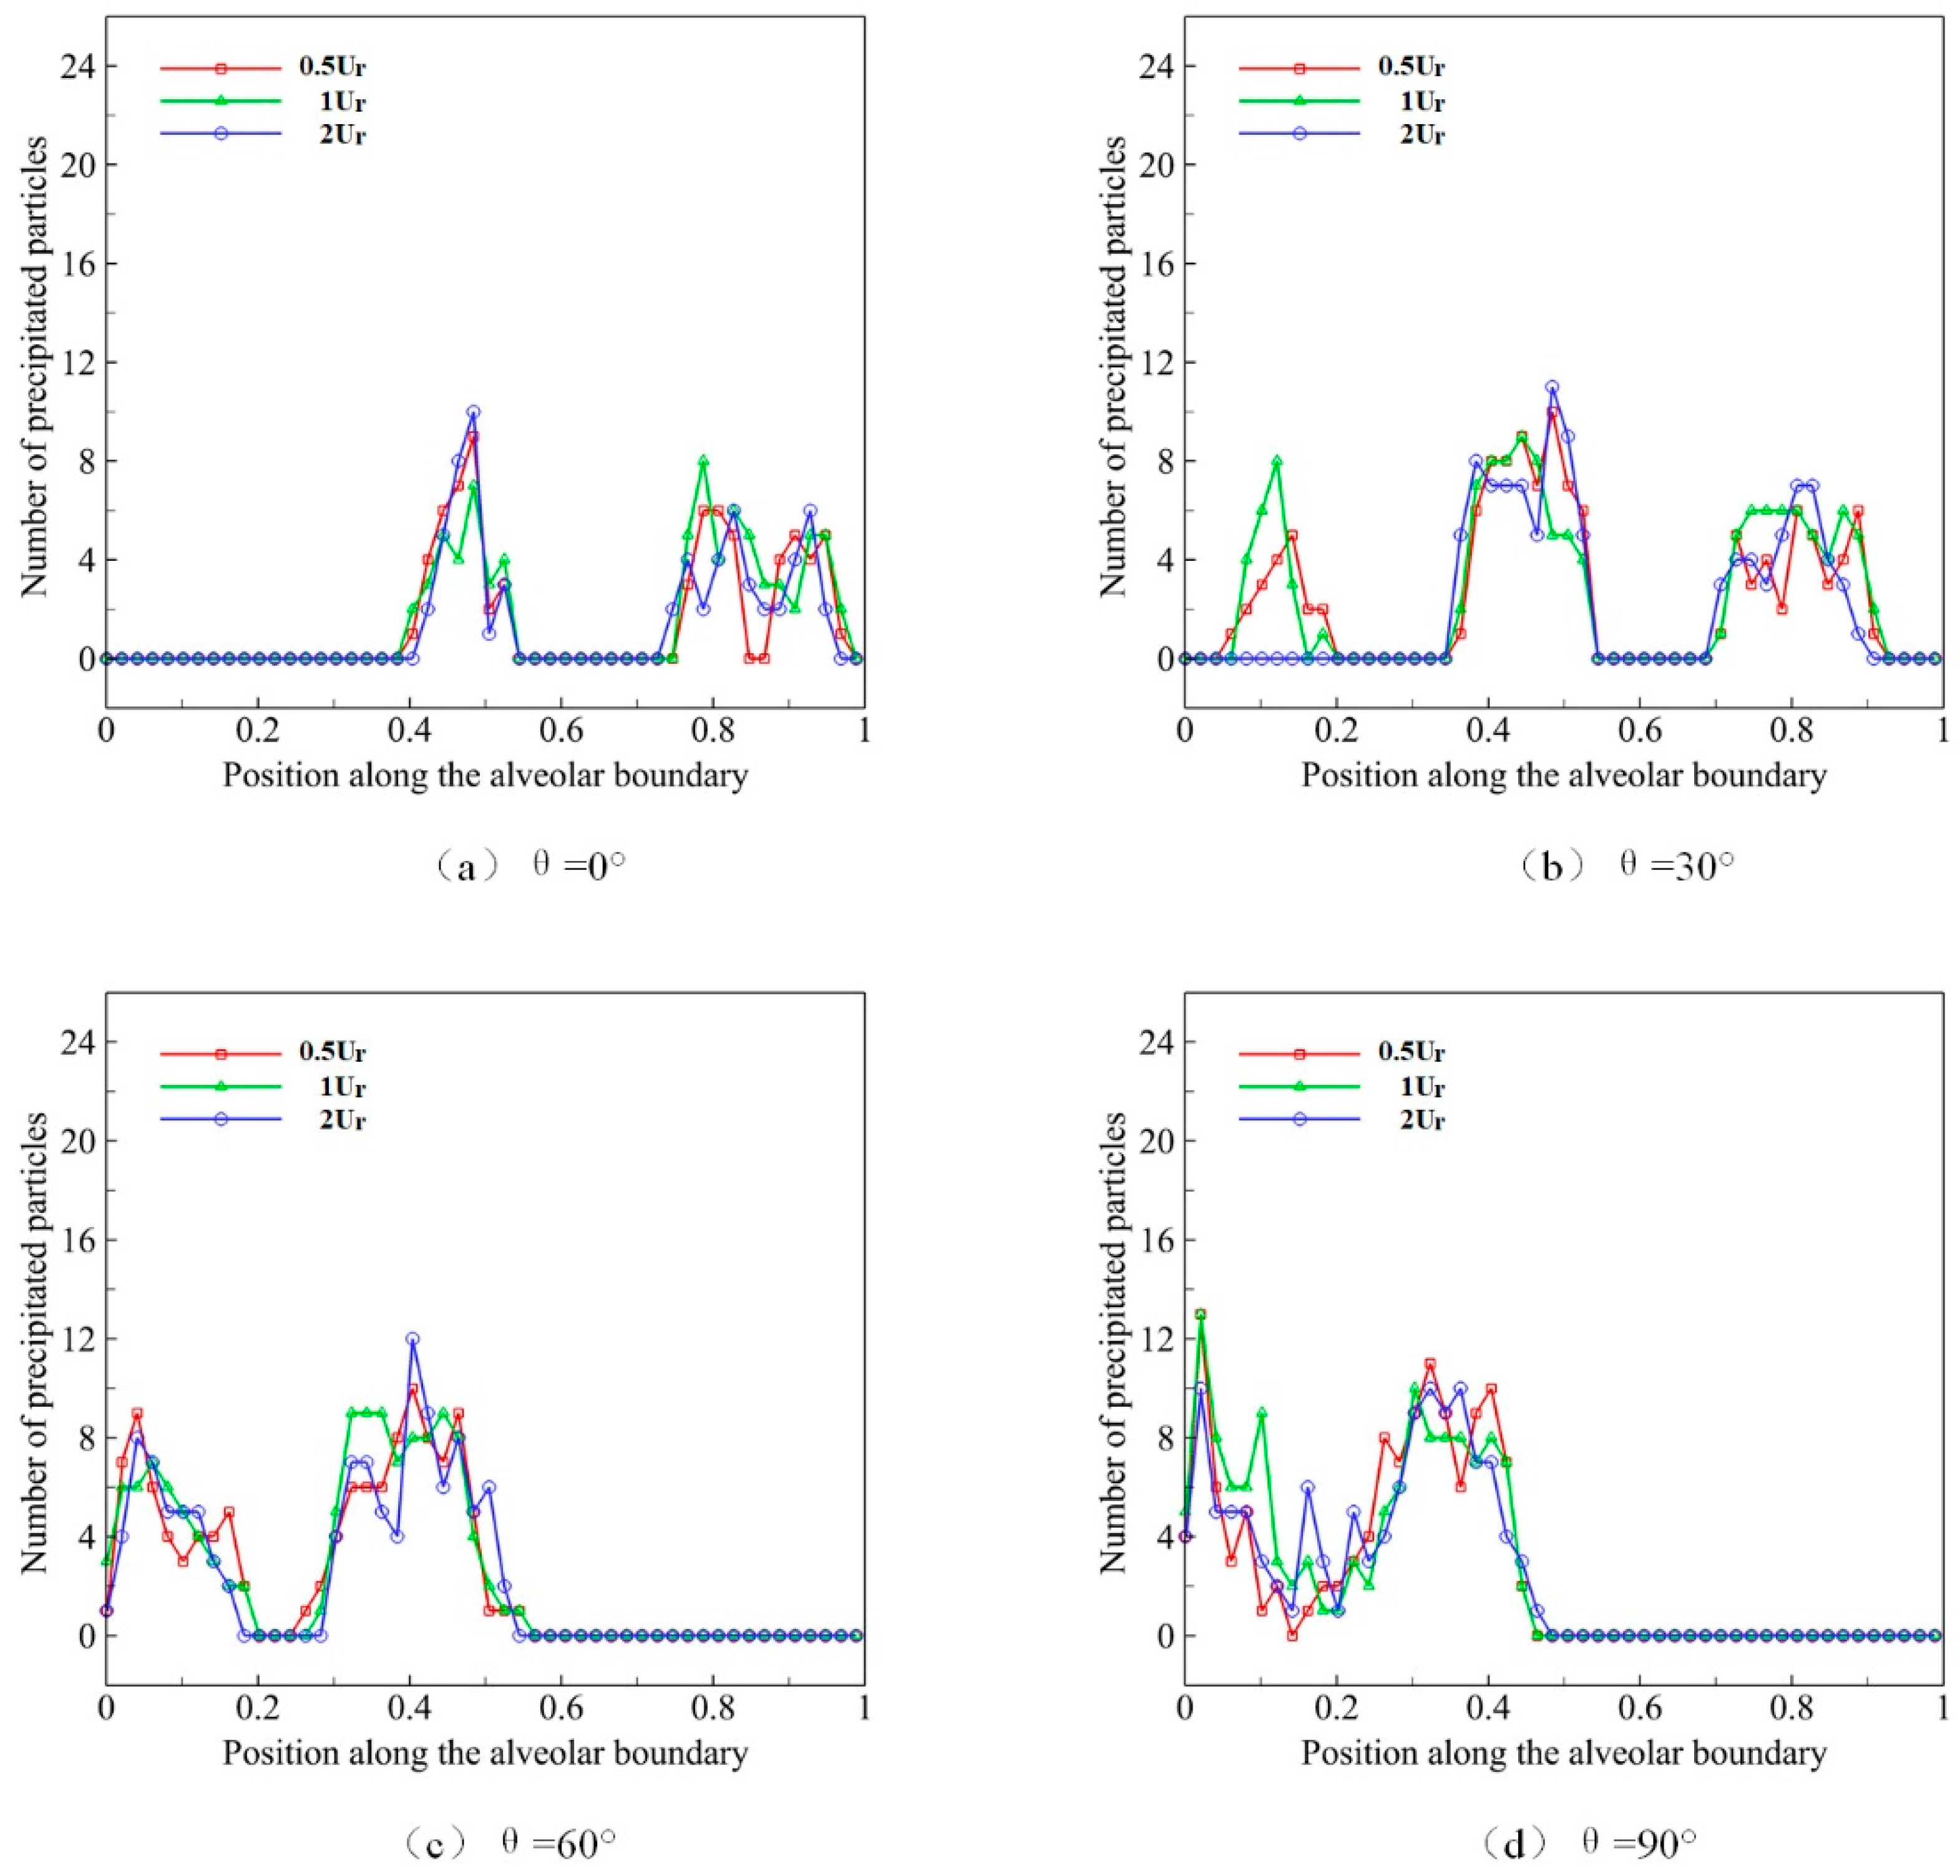
4.5. Effect of Respiratory Rate on Deposition and Distribution of Microparticles
5. Conclusions and Discussion
- (1)
- Large breathing depth is conducive to the movement and deposition of microparticles in pulmonary acini.
- (2)
- The microparticles with a larger diameter are easier to deposit after entering the alveoli.
- (3)
- The direction of gravity has a powerful effect on the deposition location of the microparticle.
- (4)
- In the same respiratory depth and gravity direction, the respiratory rate has little effect on the distribution of microparticles.
Author Contributions
Funding
Acknowledgments
Conflicts of Interest
References
- Ochs, M.; Nyengaard, J.R.; Jung, A.; Knudsen, L.; Voigt, M.; Wahlers, T.; Richter, J.; Gundersen, H.J.G. The number of alveoli in the human lung. Am. J. Respir. Crit. Care Med. 2004, 169, 120–124. [Google Scholar] [CrossRef]
- Knudsen, L.; Ochs, M. The micromechanics of lung alveoli: Structure and function of surfactant and tissue components. Histochem. Cell Biol. 2018, 150, 661–676. [Google Scholar] [CrossRef]
- Chhabra, S.; Prasad, A.K. Flow and particle dispersion in a pulmonary alveolus—Part I: Velocity measurements and convective particle transport. J. Biomech. Eng. 2010, 132, 051009. [Google Scholar] [CrossRef]
- Berend, N.; Rynell, A.; Ward, H. Structure of a human pulmonary acinus. Thorax 1991, 46, 117–121. [Google Scholar] [CrossRef]
- Weibel, E.R.; Sapoval, B.; Filoche, M. Design of peripheral airways for efficient gas exchange. Respir. Physiol. Neurobiol. 2005, 148, 3–21. [Google Scholar] [CrossRef] [PubMed]
- Islam, M.S.; Paul, G.; Ong, H.X.; Young, P.M.; Gu, Y.; Saha, S.C. A review of respiratory anatomical development, air flow characterization and particle deposition. Int. J. Environ. Res. Public Health 2020, 17, 380. [Google Scholar] [CrossRef]
- Inglesby, T.V.; Henderson, D.A.; Bartlett, J.G.; Ascher, M.S.; Eitzen, E.; Friedlander, A.M.; Hauer, J.; McDade, J.; Osterholm, M.T.; O’Toole, T. Anthrax as a biological weapon: Medical and public health management. Jama 1999, 281, 1735–1745. [Google Scholar] [CrossRef] [PubMed]
- Lee, T.-R.; Choi, M.; Kopacz, A.M.; Yun, S.-H.; Liu, W.K.; Decuzzi, P. On the near-wall accumulation of injectable particles in the microcirculation: Smaller is not better. Sci. Rep. 2013, 3, 2079. [Google Scholar] [CrossRef] [PubMed]
- Müller, K.; Fedosov, D.A.; Gompper, G. Margination of micro-and nano-particles in blood flow and its effect on drug delivery. Sci. Rep. 2014, 4, 4871. [Google Scholar] [CrossRef]
- Patton, J.S.; Byron, P.R. Inhaling medicines: Delivering drugs to the body through the lungs. Nat. Rev. Drug Discov. 2007, 6, 67–74. [Google Scholar] [CrossRef]
- Shachar-Berman, L.; Ostrovski, Y.; Koshiyama, K.; Wada, S.; Kassinos, S.C.; Sznitman, J. Targeting inhaled fibers to the pulmonary acinus: Opportunities for augmented delivery from in silico simulations. Eur. J. Pharm. Sci. 2019, 137, 105003. [Google Scholar] [CrossRef]
- Federspiel, W.J.; Fredberg, J.J. Axial dispersion in respiratory bronchioles and alveolar ducts. J. Appl. Physiol. 1988, 64, 2614–2621. [Google Scholar] [CrossRef]
- Karl, A.; Henry, F.S.; Tsuda, A. Low Reynolds number viscous flow in an alveolated duct. J. Biomech. Eng. 2004, 126, 420–429. [Google Scholar] [CrossRef]
- Tsuda, A.; Butler, J.P.; Fredberg, J.J. Effects of alveolated duct structure on aerosol kinetics. I. Diffusional deposition in the absence of gravity. J. Appl. Physiol. 1994, 76, 2497–2509. [Google Scholar] [CrossRef]
- Tsuda, A.; Henry, F.S.; Butler, J.P. Chaotic mixing of alveolated duct flow in rhythmically expanding pulmonary acinus. J. Appl. Physiol. 1995, 79, 1055–1063. [Google Scholar] [CrossRef] [PubMed]
- Haber, S.; Yitzhak, D.; Tsuda, A. Gravitational deposition in a rhythmically expanding and contracting alveolus. J. Appl. Physiol. 2003, 95, 657–671. [Google Scholar] [CrossRef]
- Balásházy, I.; Hofmann, W.; Farkas, Á.; Madas, B.G. Three-dimensional model for aerosol transport and deposition in expanding and contracting alveoli. Inhal. Toxicol. 2008, 20, 611–621. [Google Scholar] [CrossRef] [PubMed]
- Lee, D.Y.; Lee, J.W. Characteristics of particle transport in an expanding or contracting alveolated tube. J. Aerosol Sci. 2003, 34, 1193–1215. [Google Scholar] [CrossRef]
- Sznitman, J.; Heimsch, F.; Heimsch, T.; Rusch, D.; Rösgen, T. Three-dimensional convective alveolar flow induced by rhythmic breathing motion of the pulmonary acinus. J. Biomech. Eng. 2007, 129, 658–665. [Google Scholar] [CrossRef]
- Haber, S.; Butler, J.; Brenner, H.; Emanuel, I.; Tsuda, A. Shear flow over a self-similar expanding pulmonary alveolus during rhythmical breathing. J. Fluid Mech. 2000, 405, 243–268. [Google Scholar] [CrossRef]
- Tippe, A.; Tsuda, A. Recirculating flow in an expanding alveolar model: Experimental evidence of flow-induced mixing of aerosols in the pulmonary acinus. J. Aerosol Sci. 2000, 31, 979–986. [Google Scholar] [CrossRef]
- Tsuda, A.; Butler, J.P.; Fredberg, J.J. Aerosol deposition in the pulmonary acinus. J. Aerosol Sci. 1992, 23, 461–464. [Google Scholar] [CrossRef]
- Berg, E.J.; Robinson, R.J. Stereoscopic particle image velocimetry analysis of healthy and emphysemic alveolar sac models. J. Biomech. Eng. 2011, 133, 061004. [Google Scholar] [CrossRef] [PubMed]
- Harrington, L.; Prisk, G.K.; Darquenne, C. Importance of the bifurcation zone and branch orientation in simulated aerosol deposition in the alveolar zone of the human lung. J. Aerosol Sci. 2006, 37, 37–62. [Google Scholar] [CrossRef]
- Heyder, J. Deposition of inhaled particles in the human respiratory tract and consequences for regional targeting in respiratory drug delivery. Proc. Am. Thorac. Soc. 2004, 1, 315–320. [Google Scholar] [CrossRef] [PubMed]
- Heyder, J.; Gebhart, J.; Scheuch, G. Interaction of diffusional and gravitational particle transport in aerosols. Aerosol Sci. Technol. 1985, 4, 315–326. [Google Scholar] [CrossRef][Green Version]
- Henry, F.S.; Butler, J.P.; Tsuda, A. Kinematically irreversible acinar flow: A departure from classical dispersive aerosol transport theories. J. Appl. Physiol. 2002, 92, 835–845. [Google Scholar] [CrossRef]
- Ma, J.; Wang, Z.; Young, J.; Lai, J.C.; Sui, Y.; Tian, F.-B. An immersed boundary-lattice Boltzmann method for fluid-structure interaction problems involving viscoelastic fluids and complex geometries. J. Comput. Phys. 2020, 415, 109487. [Google Scholar] [CrossRef]
- Sui, Y.; Chew, Y.; Roy, P.; Low, H. Inertia effect on the transient deformation of elastic capsules in simple shear flow. Comput. Fluids 2009, 38, 49–59. [Google Scholar] [CrossRef]
- Tian, F.-B. Deformation of a capsule in a power-law shear flow. Comput. Math. Methods Med. 2016, 2016, 7981386. [Google Scholar] [CrossRef]
- Wang, Z.; Wei, Y.; Qian, Y. A bounce back-immersed boundary-lattice Boltzmann model for curved boundary. Appl. Math. Model. 2020, 81, 428–440. [Google Scholar] [CrossRef]
- Wei, Q.; Xu, Y.-Q.; Tang, X.-Y.; Tian, F.-B. An IB–LBM study of continuous cell sorting in deterministic lateral displacement arrays. Acta Mech. Sin. 2016, 32, 1023–1030. [Google Scholar] [CrossRef]
- Zhu, L.; Yu, X.; Liu, N.; Cheng, Y.; Lu, X. A deformable plate interacting with a non-Newtonian fluid in three dimensions. Phys. Fluids 2017, 29, 083101. [Google Scholar] [CrossRef]
- Sun, D.; Wang, Y.; Jiang, D.; Xiang, N.; Chen, K.; Ni, Z. Dynamic self-assembly of particles in an expanding channel flow. Appl. Phys. Lett. 2013, 103, 071905. [Google Scholar]
- Montessori, A.; Lauricella, M.; Tirelli, N.; Succi, S. Mesoscale modelling of near-contact interactions for complex flowing interfaces. J. Fluid Mech. 2019, 872, 327–347. [Google Scholar] [CrossRef]
- Montessori, A.; Prestininzi, P.; La Rocca, M.; Succi, S. Lattice Boltzmann approach for complex nonequilibrium flows. Phys. Rev. E 2015, 92, 043308. [Google Scholar] [CrossRef]
- Knudsen, L.; Lopez-Rodriguez, E.; Berndt, L.; Steffen, L.; Ruppert, C.; Bates, J.H.; Ochs, M.; Smith, B.J. Alveolar micromechanics in bleomycin-induced lung injury. Am. J. Respir. Cell Mol. Biol. 2018, 59, 757–769. [Google Scholar] [CrossRef] [PubMed]
- Oakes, J.M.; Day, S.; Weinstein, S.J.; Robinson, R.J. Flow field analysis in expanding healthy and emphysematous alveolar models using particle image velocimetry. J. Biomech. Eng. 2010, 132, 021008. [Google Scholar] [CrossRef] [PubMed]
- Charrier, J.; Shrivastava, S.; Wu, R. Free and constrained inflation of elastic membranes in relation to thermoforming—Non-axisymmetric problems. J. Strain Anal. Eng. Des. 1989, 24, 55–74. [Google Scholar] [CrossRef]
- Shrivastava, S.; Tang, J. Large deformation finite element analysis of non-linear viscoelastic membranes with reference to thermoforming. J. Strain Anal. Eng. Des. 1993, 28, 31–51. [Google Scholar] [CrossRef]
- Harrison, S.; Bush, M.; Petros, P. A pinch elastometer for soft tissue. Med. Eng. Phys. 2007, 29, 307–315. [Google Scholar] [CrossRef]
- Bagchi, P.; Johnson, P.C.; Popel, A.S. Computational fluid dynamic simulation of aggregation of deformable cells in a shear flow. J. Biomech. Eng. 2005, 127, 1070–1080. [Google Scholar] [CrossRef]
- Liu, Z.; Zhu, Y.; Clausen, J.R.; Lechman, J.B.; Rao, R.R.; Aidun, C.K. Multiscale method based on coupled lattice-Boltzmann and Langevin-dynamics for direct simulation of nanoscale particle/polymer suspensions in complex flows. Int. J. Numer. Methods Fluids 2019, 91, 228–246. [Google Scholar] [CrossRef]
- Liu, Z.; Clausen, J.R.; Rao, R.R.; Aidun, C.K. A unified analysis of nano-to-microscale particle dispersion in tubular blood flow. Phys. Fluids 2019, 31, 081903. [Google Scholar] [CrossRef]
- Lallemand, P.; Luo, L.-S. Theory of the lattice Boltzmann method: Dispersion, dissipation, isotropy, Galilean invariance, and stability. Phys. Rev. E 2000, 61, 6546. [Google Scholar] [CrossRef] [PubMed]
- Yan, W.; Wu, J.; Yang, S.; Wang, Y. Numerical investigation on characteristic flow regions for three staggered stationary circular cylinders. Eur. J. Mech. B Fluids 2016, 60, 48–61. [Google Scholar] [CrossRef]
- Guo, Z.; Zheng, C.; Shi, B. Discrete lattice effects on the forcing term in the lattice Boltzmann method. Phys. Rev. E 2002, 65, 046308. [Google Scholar] [CrossRef]
- Peskin, C.S. The immersed boundary method. ACTA Numer. 2002, 11, 479–517. [Google Scholar] [CrossRef]


| D | s |
|---|---|
| 3 μm | 2.22 μm |
| 4 μm | 5.66 μm |
| 5 μm | 11.37 μm |
| s | |
|---|---|
| 0 | 5.66 μm |
| 50 | 11.09 μm |
| 100 | 16.08 μm |
Publisher’s Note: MDPI stays neutral with regard to jurisdictional claims in published maps and institutional affiliations. |
© 2021 by the authors. Licensee MDPI, Basel, Switzerland. This article is an open access article distributed under the terms and conditions of the Creative Commons Attribution (CC BY) license (https://creativecommons.org/licenses/by/4.0/).
Share and Cite
Xu, D.-C.; Luo, Y.-X.; Xu, Y.-Q. Study on Deposition Characteristics of Microparticles in Terminal Pulmonary Acini by IB–LBM. Micromachines 2021, 12, 957. https://doi.org/10.3390/mi12080957
Xu D-C, Luo Y-X, Xu Y-Q. Study on Deposition Characteristics of Microparticles in Terminal Pulmonary Acini by IB–LBM. Micromachines. 2021; 12(8):957. https://doi.org/10.3390/mi12080957
Chicago/Turabian StyleXu, Du-Chang, Yu-Xiao Luo, and Yuan-Qing Xu. 2021. "Study on Deposition Characteristics of Microparticles in Terminal Pulmonary Acini by IB–LBM" Micromachines 12, no. 8: 957. https://doi.org/10.3390/mi12080957
APA StyleXu, D.-C., Luo, Y.-X., & Xu, Y.-Q. (2021). Study on Deposition Characteristics of Microparticles in Terminal Pulmonary Acini by IB–LBM. Micromachines, 12(8), 957. https://doi.org/10.3390/mi12080957