
Design and Mechanical Properties Verification of Gradient Voronoi Scaffold for Bone Tissue Engineering

 ,
,
Abstract
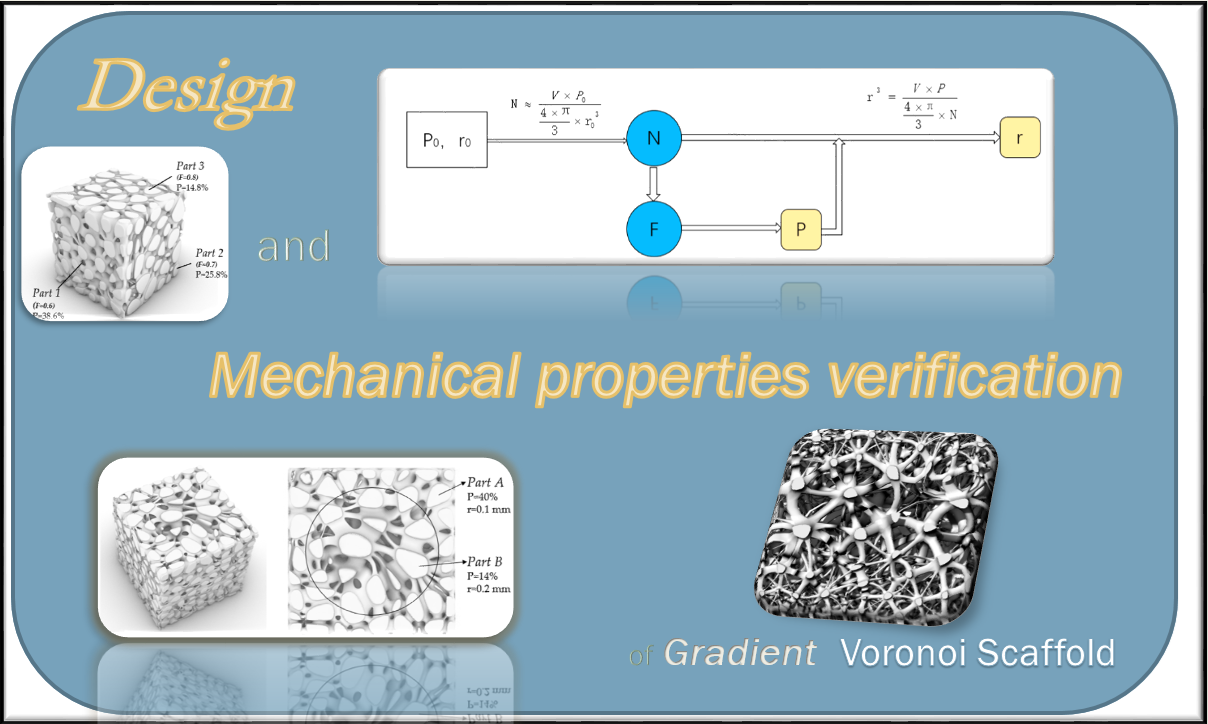
1. Introduction
2. Materials and Methods
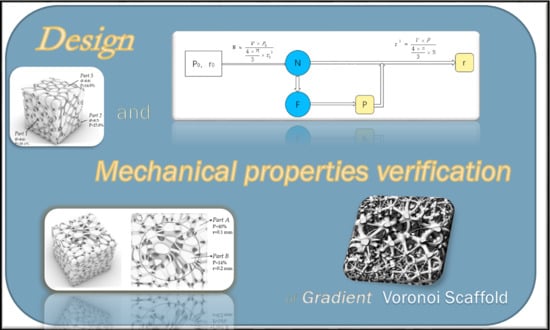
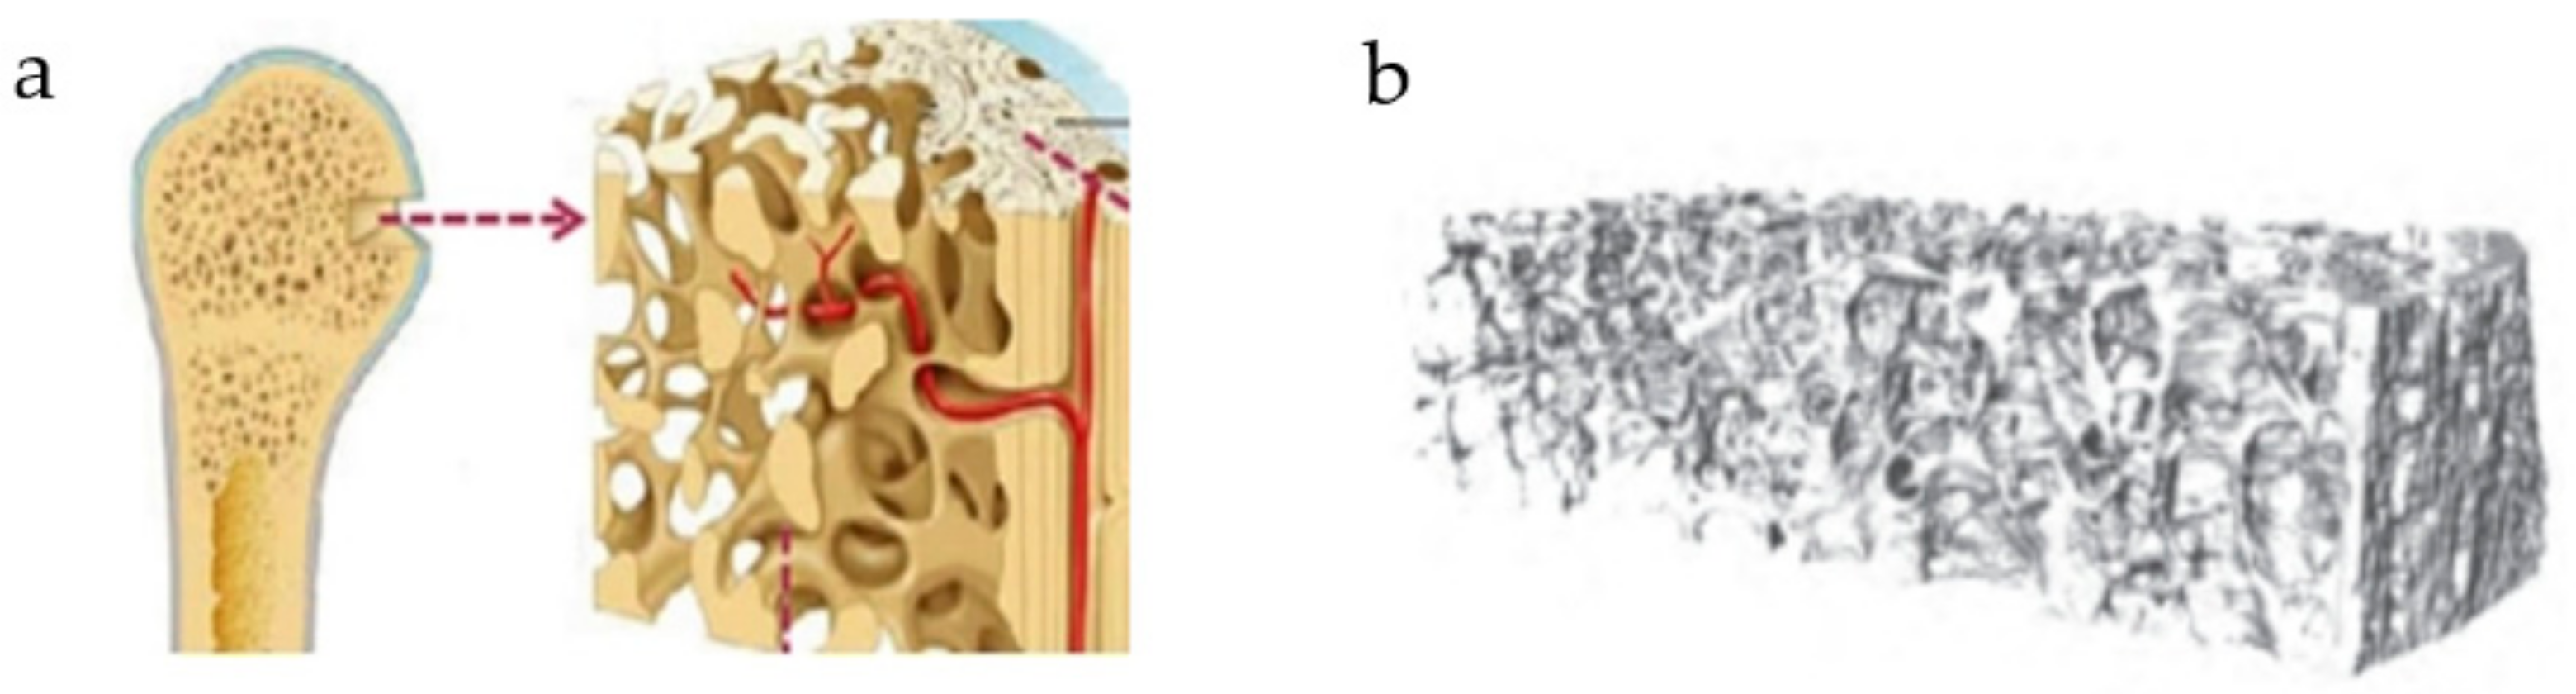
2.1. Design Method
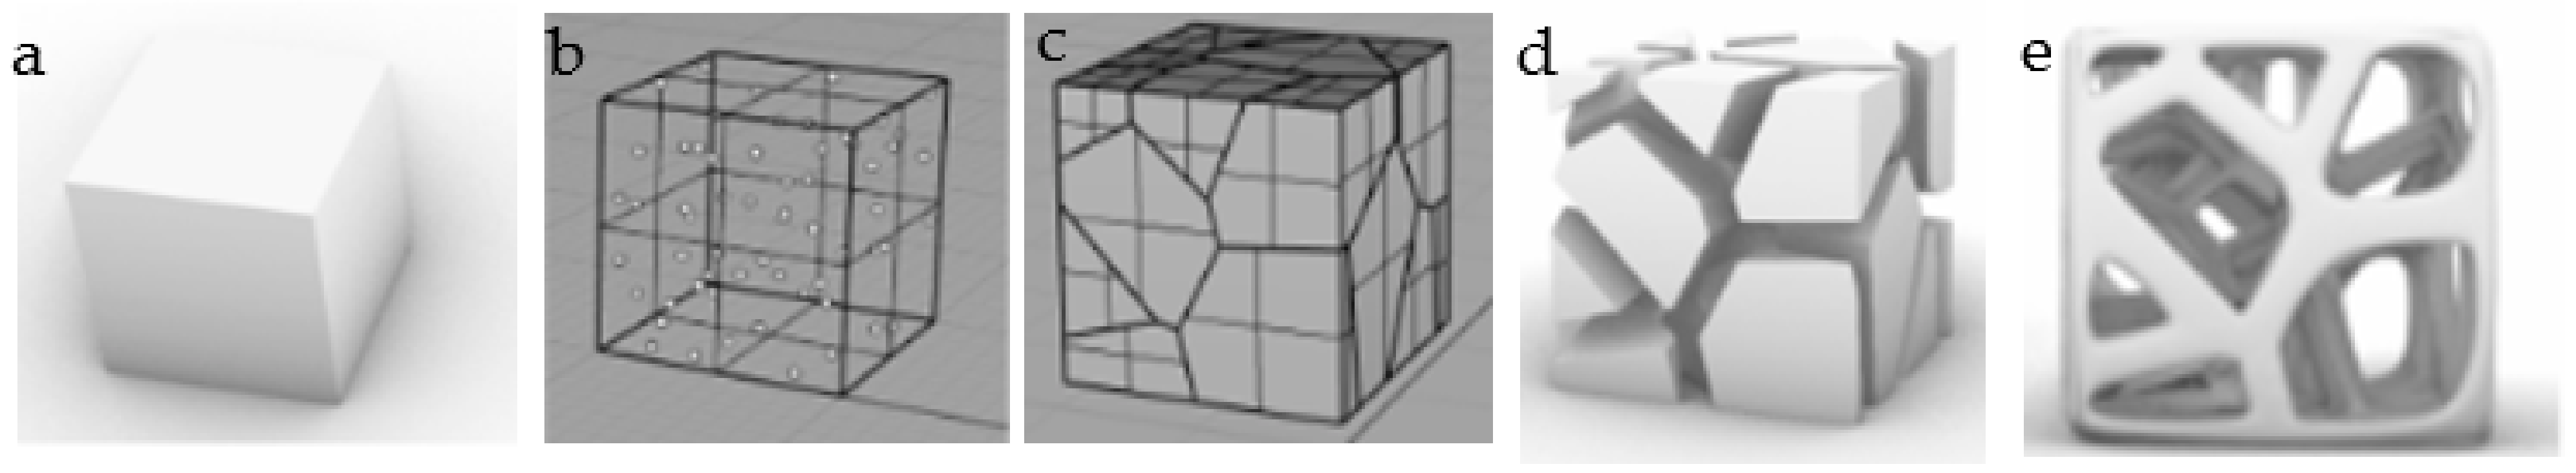
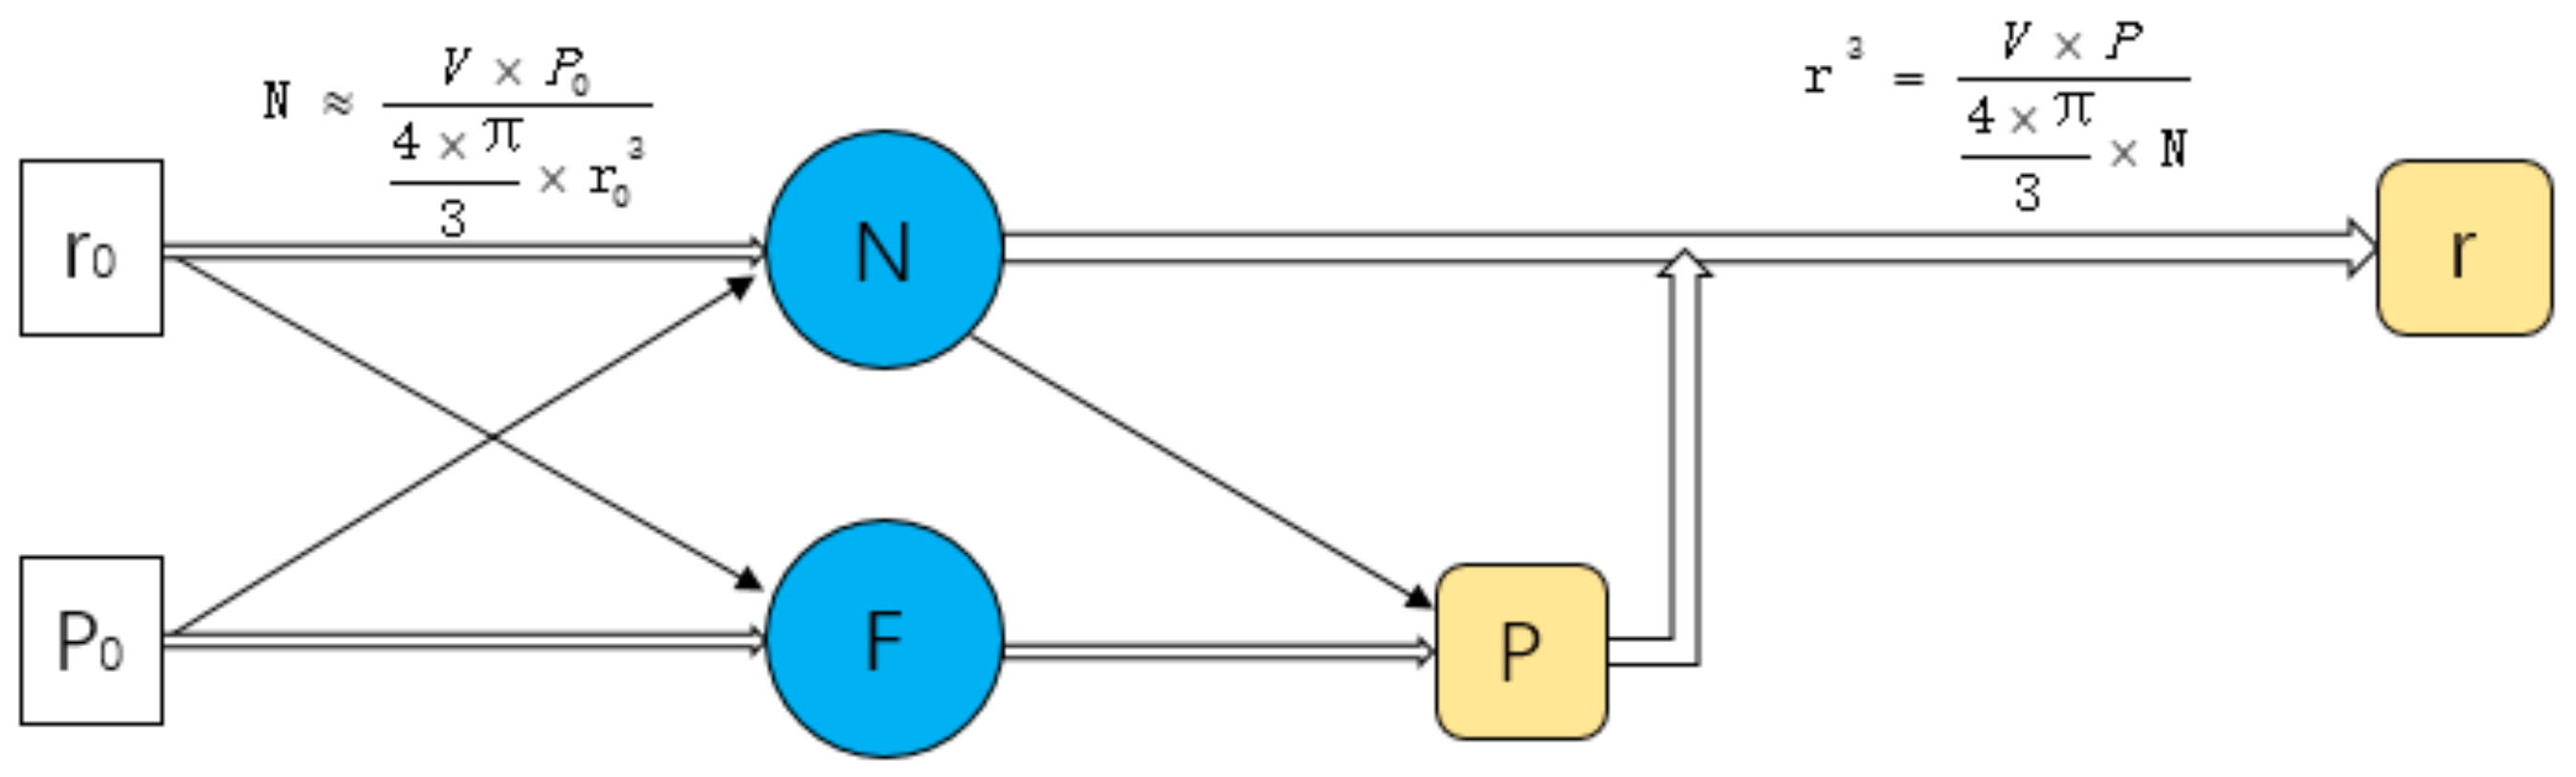
2.1.1. Design Principle
- Ω is a Voronoi-cell sub-region space in a specific space;
- Pi is the core of Ω;
- P is any point different from Pi in Ω;
- Pj is the core of other Voronoi-cell sub-regional spaces;
- D is the distance between two points;
- V stands for Voronoi-cell sub-area space.
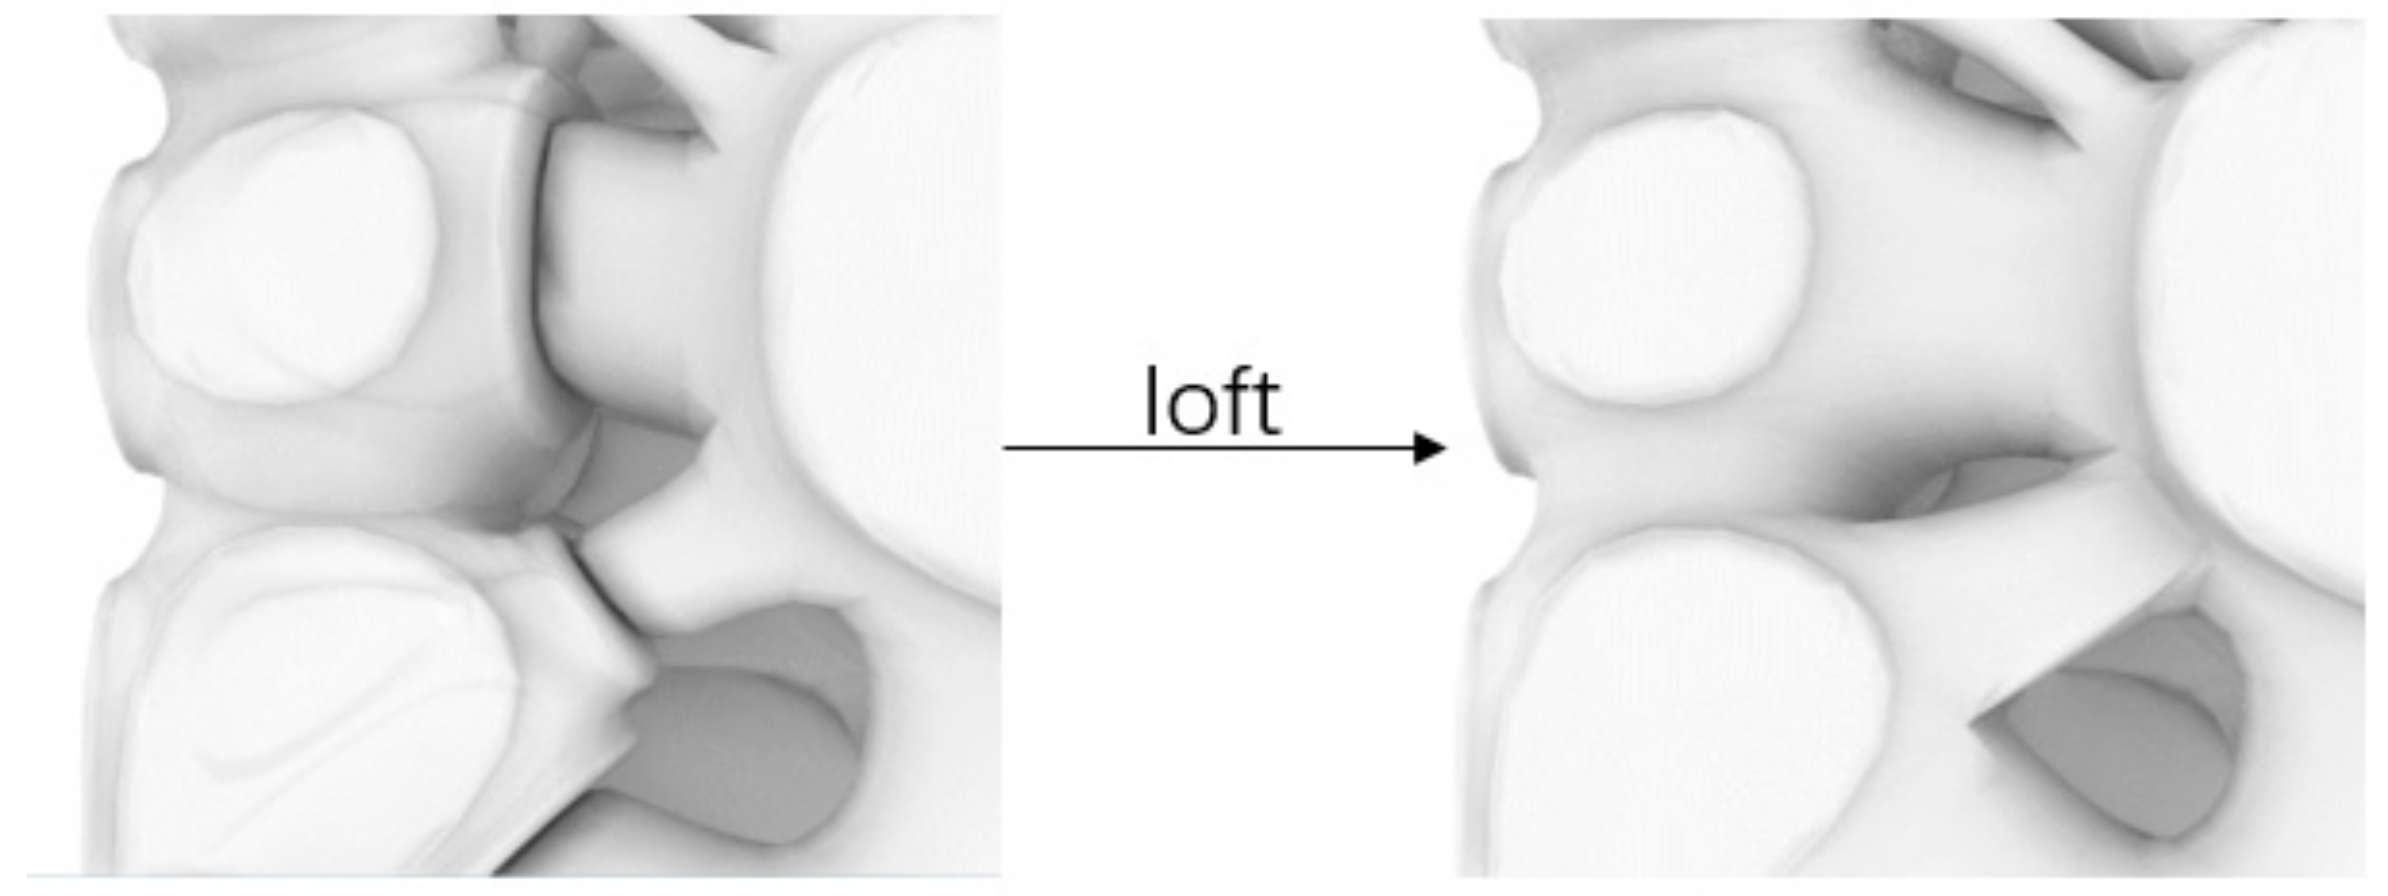
2.1.2. Design Method
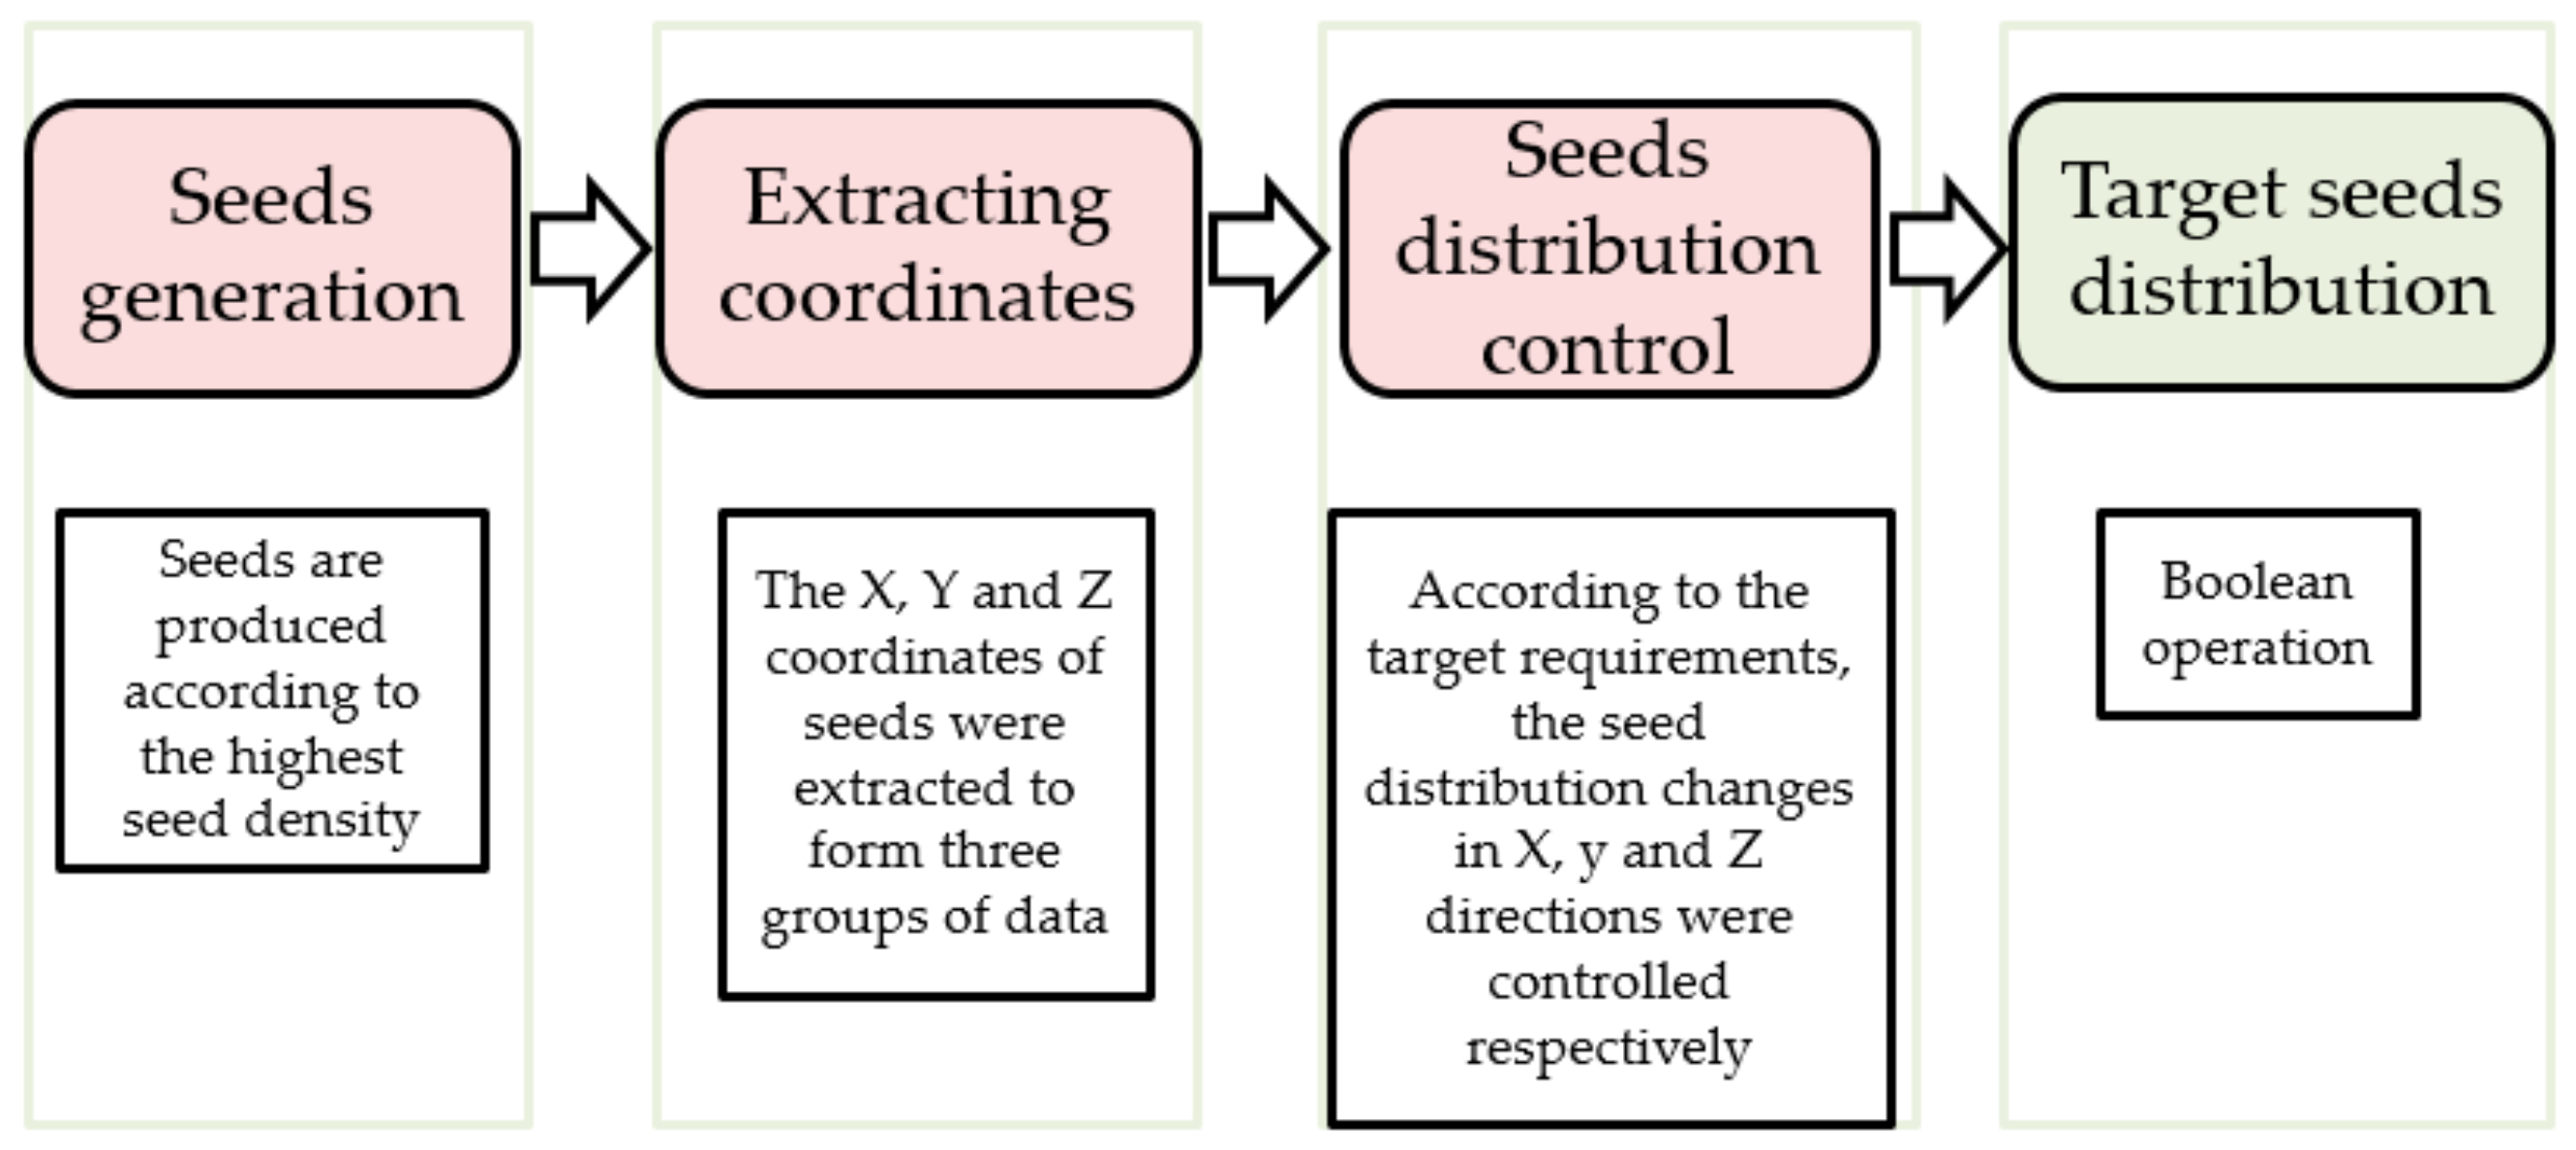
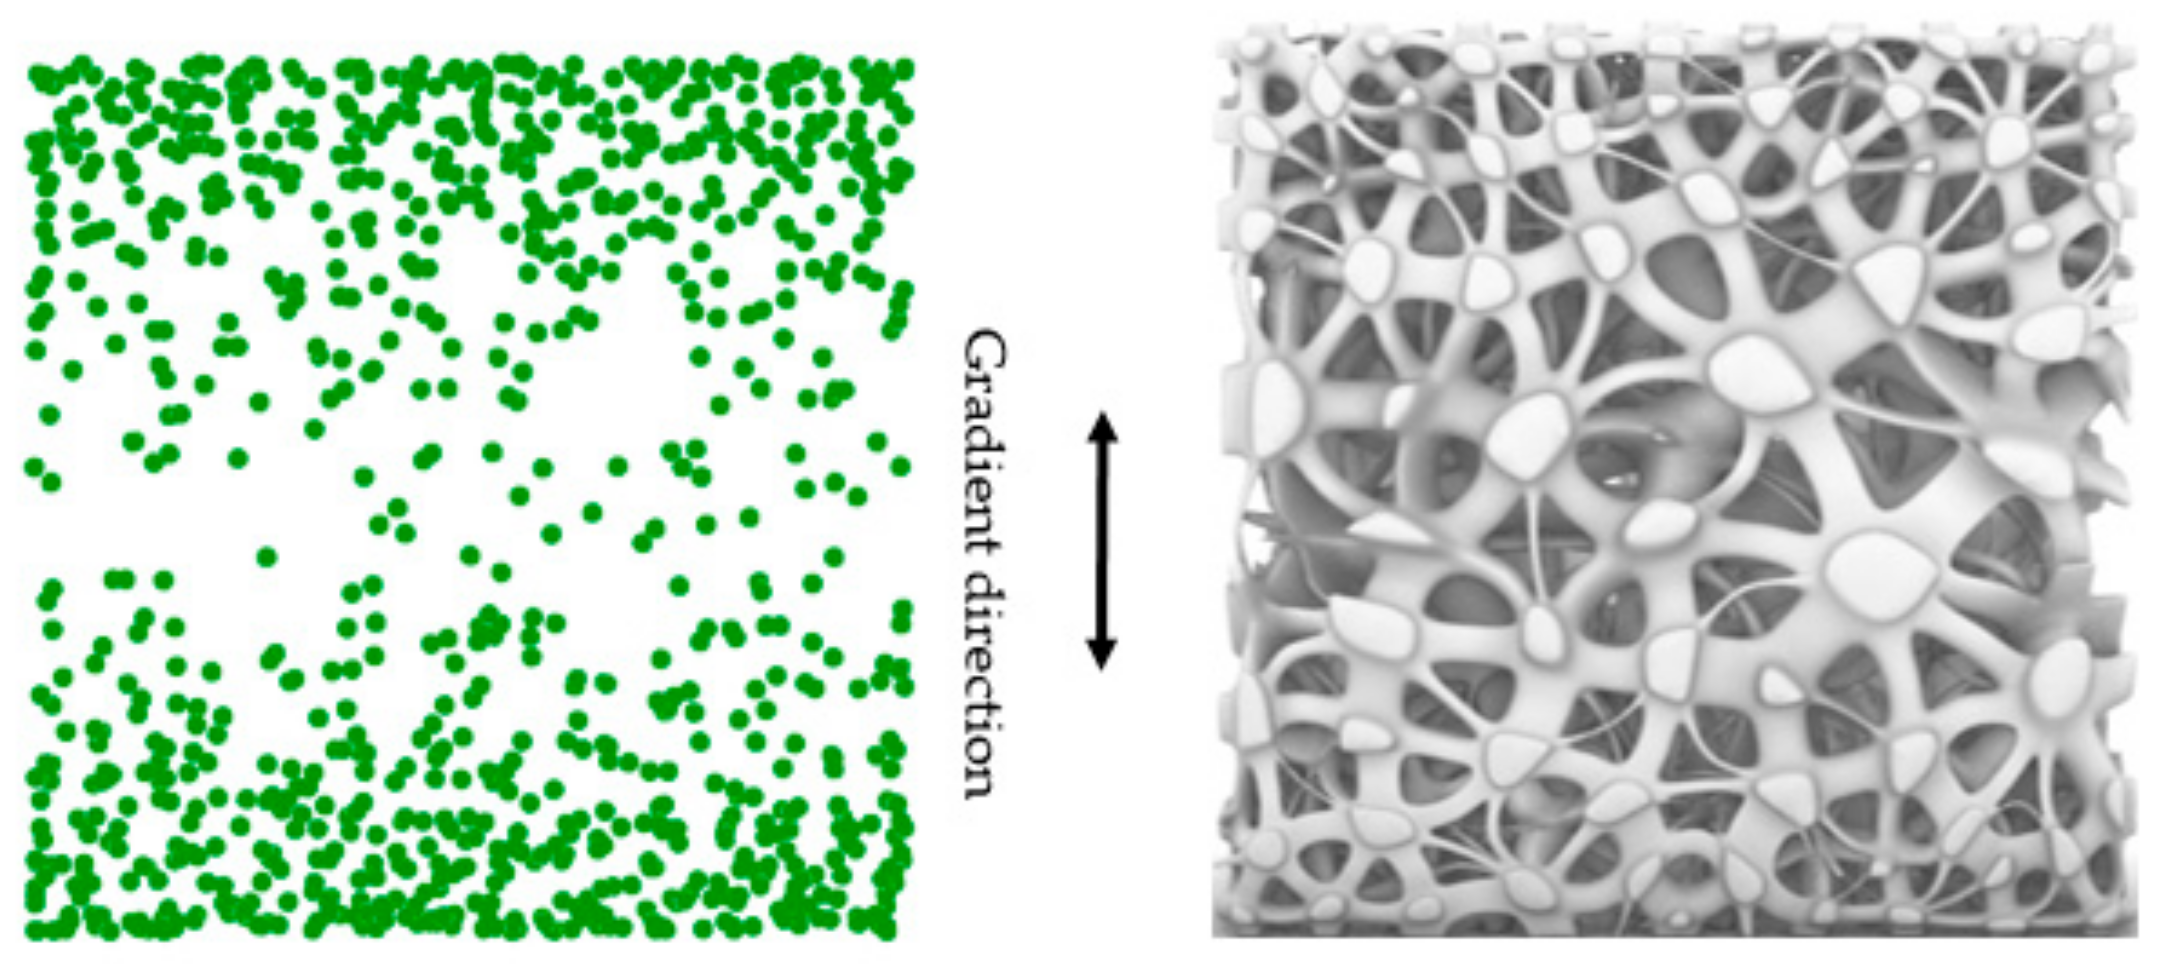
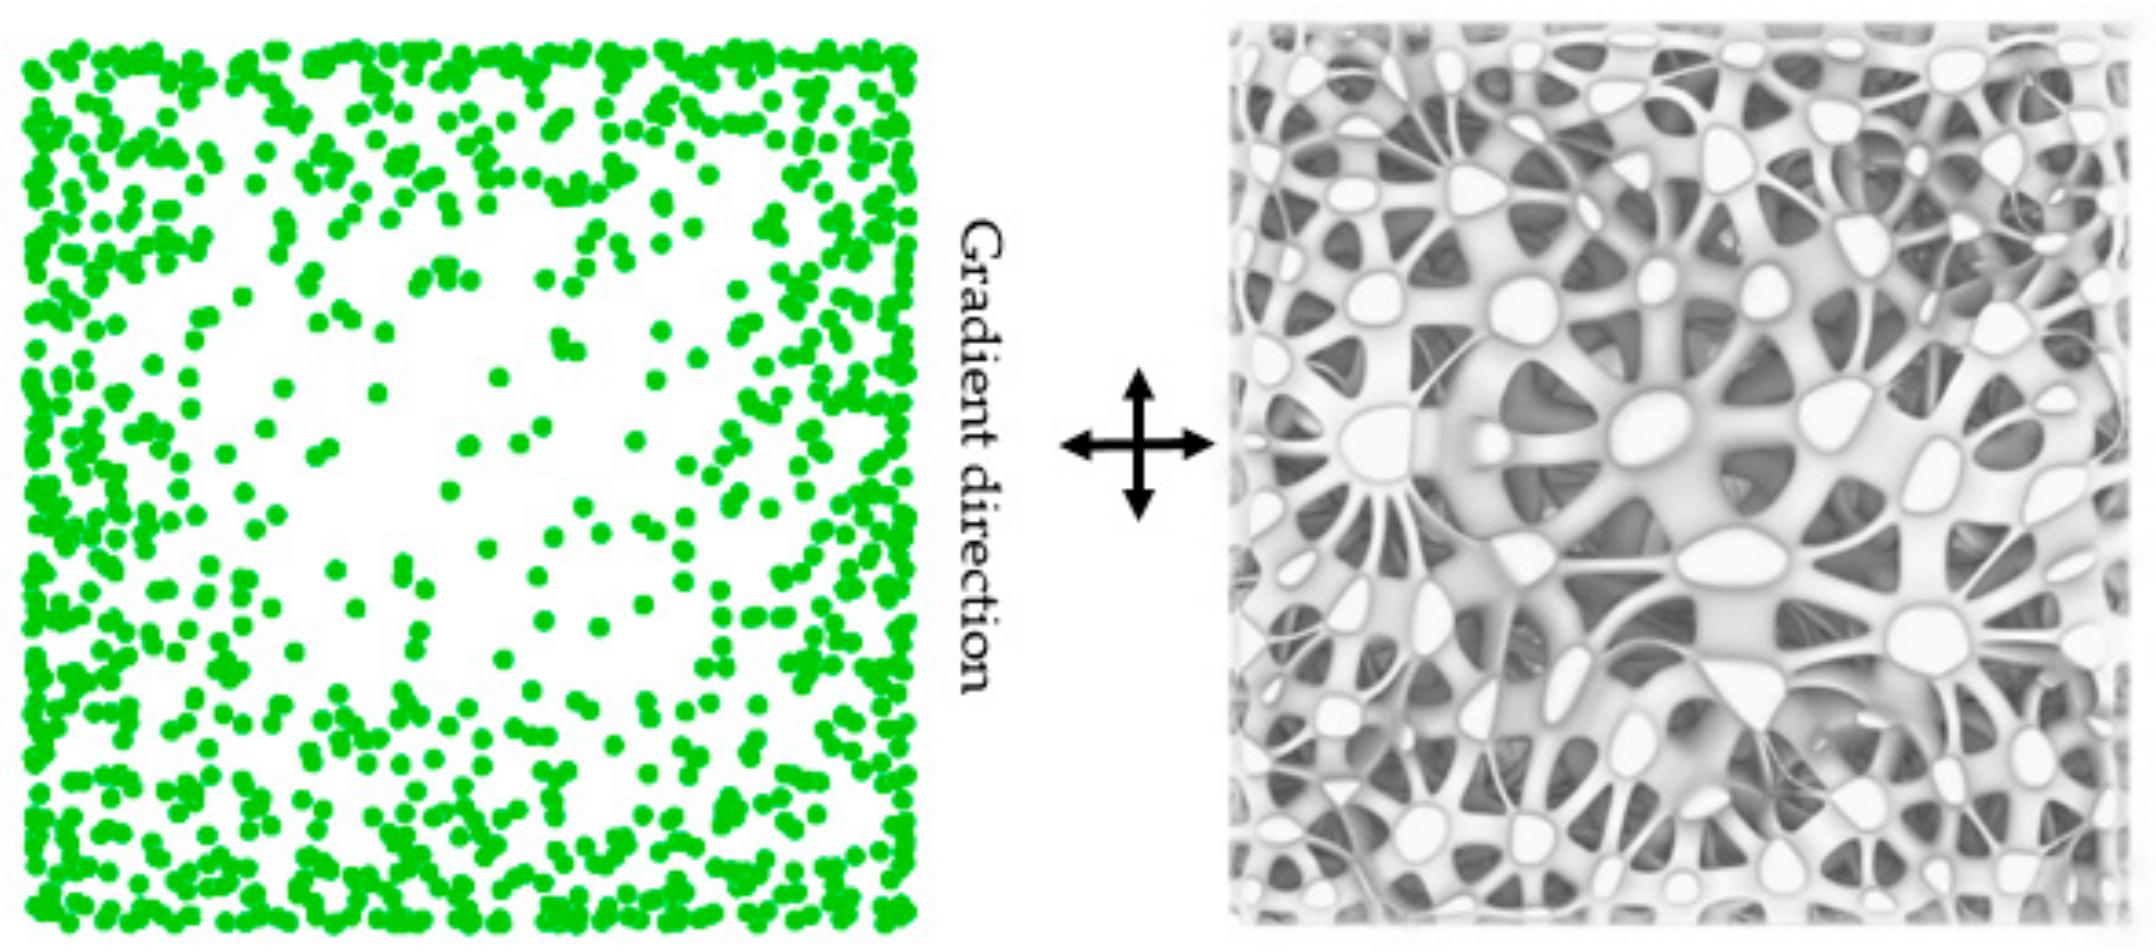
2.1.3. Seeds Control Method
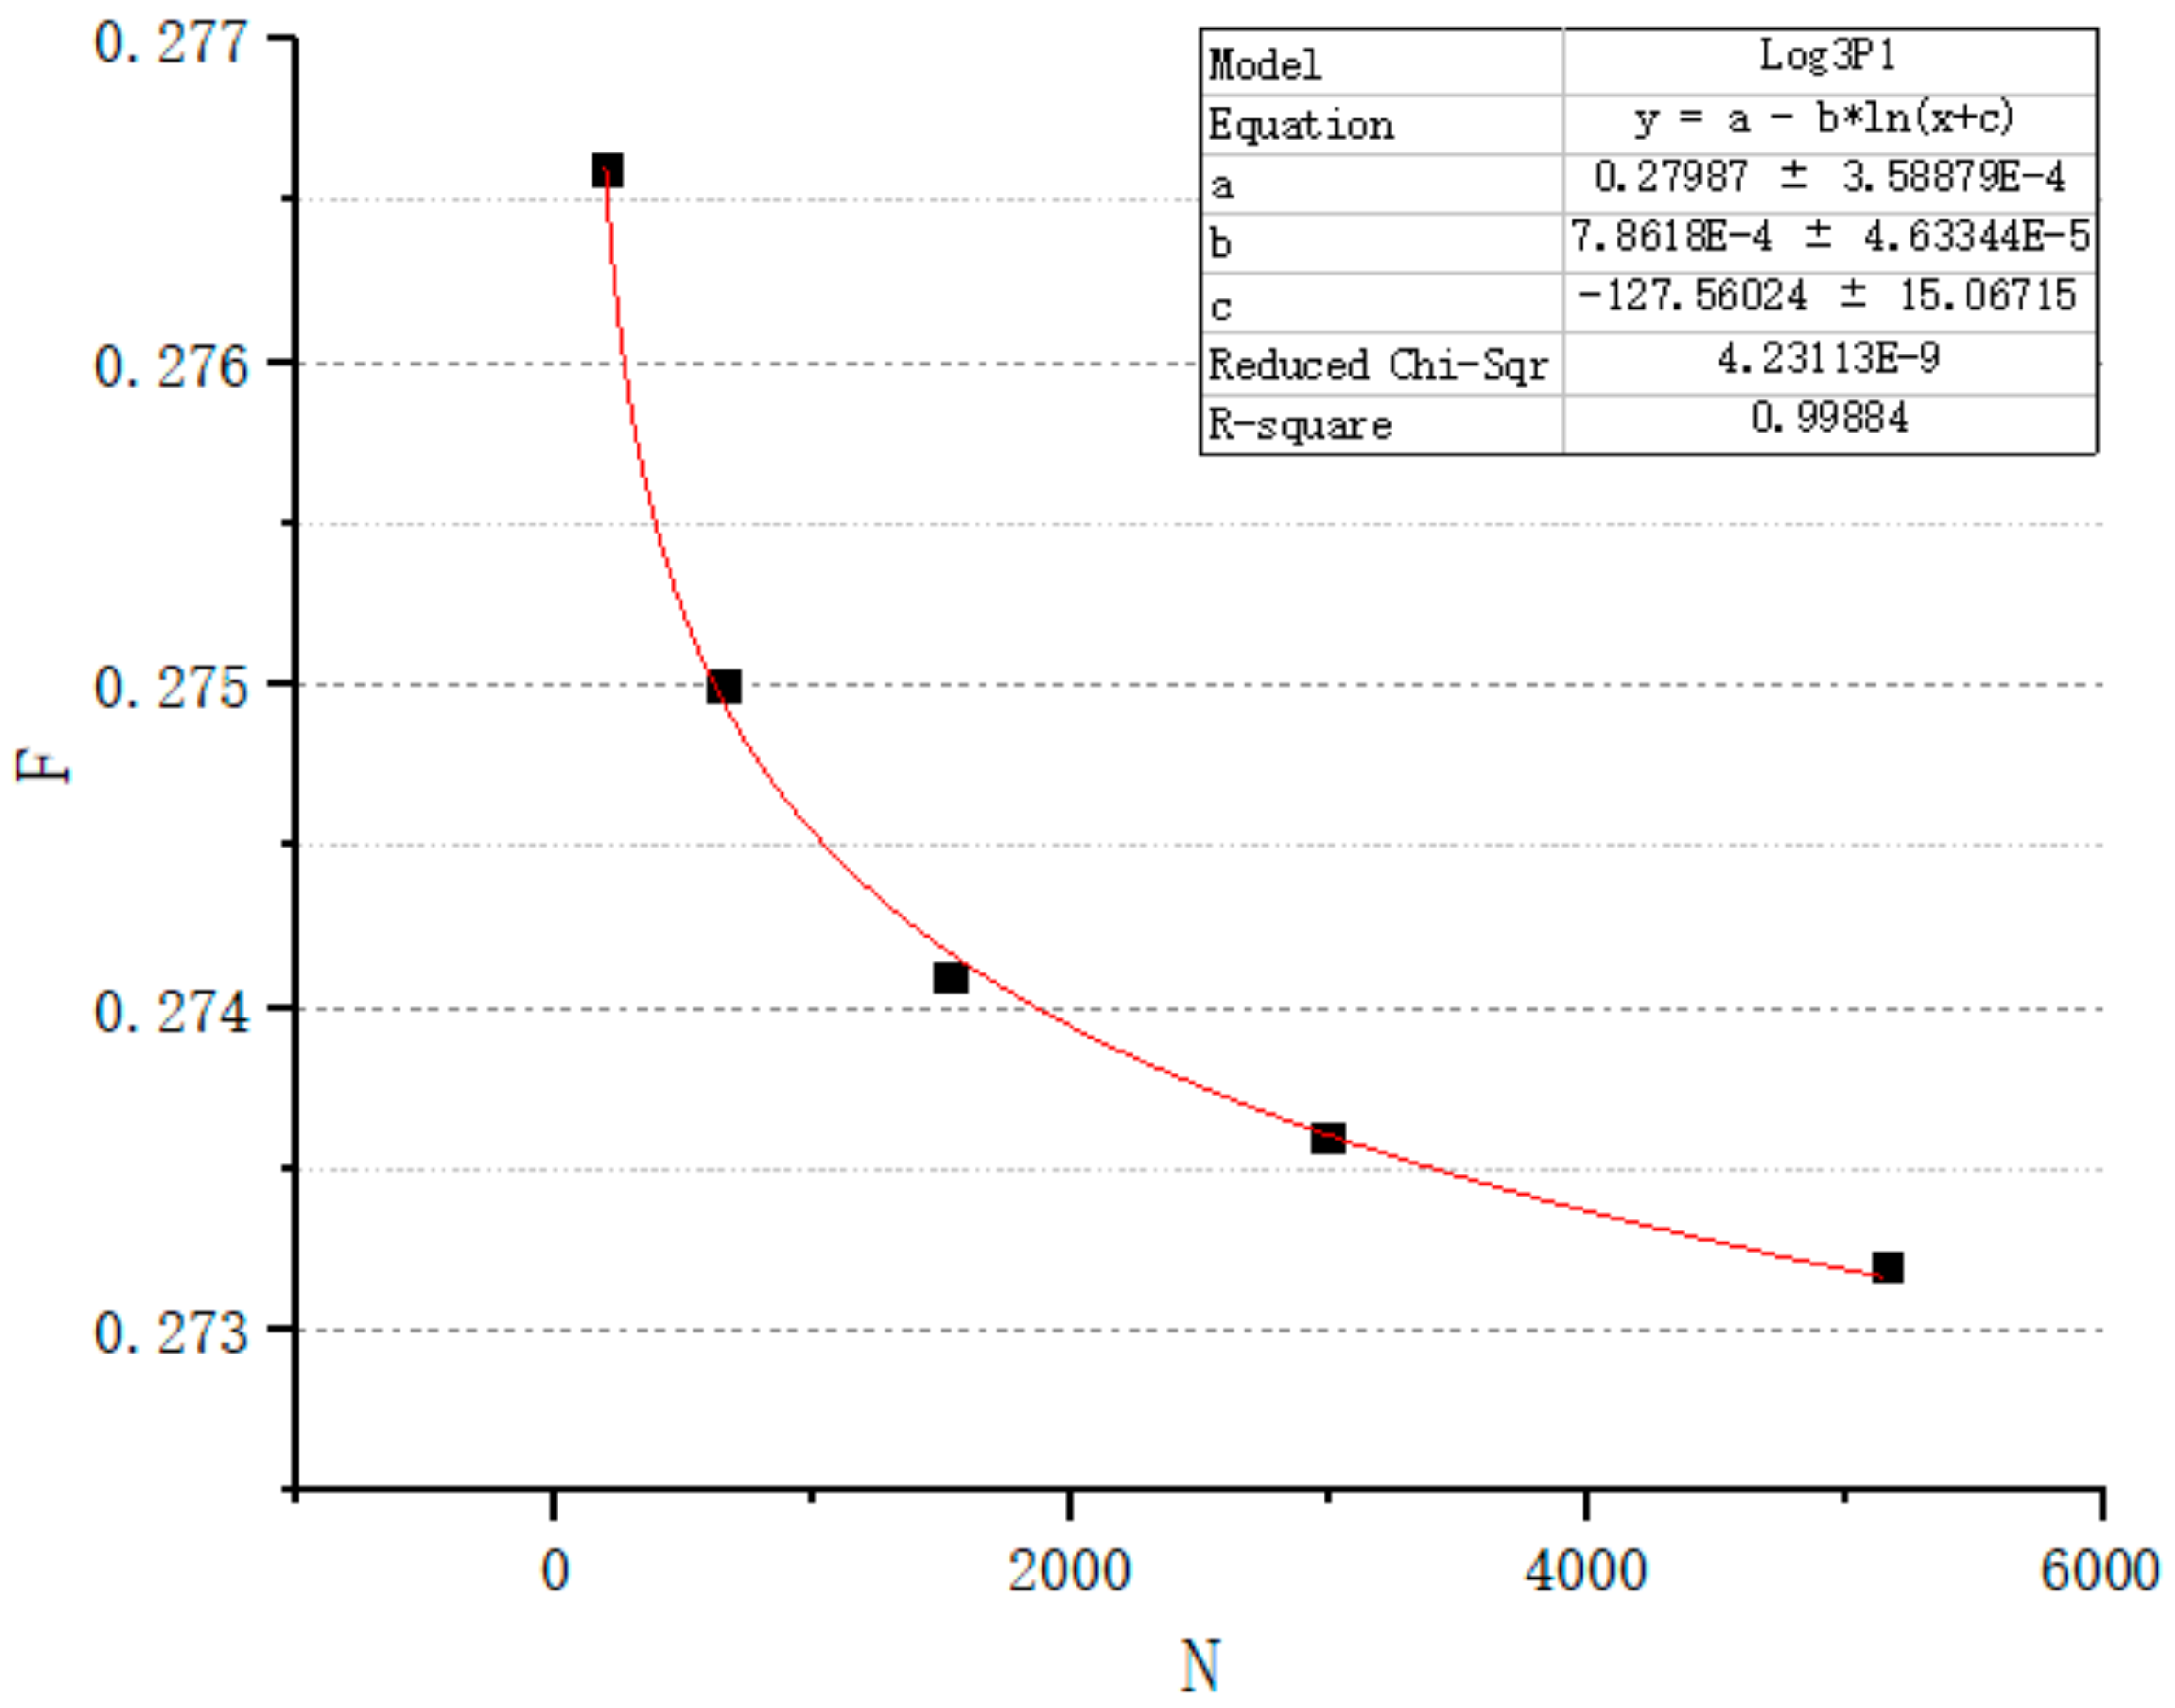
2.1.4. Porosity Control Method
2.2. Stability Verification Method
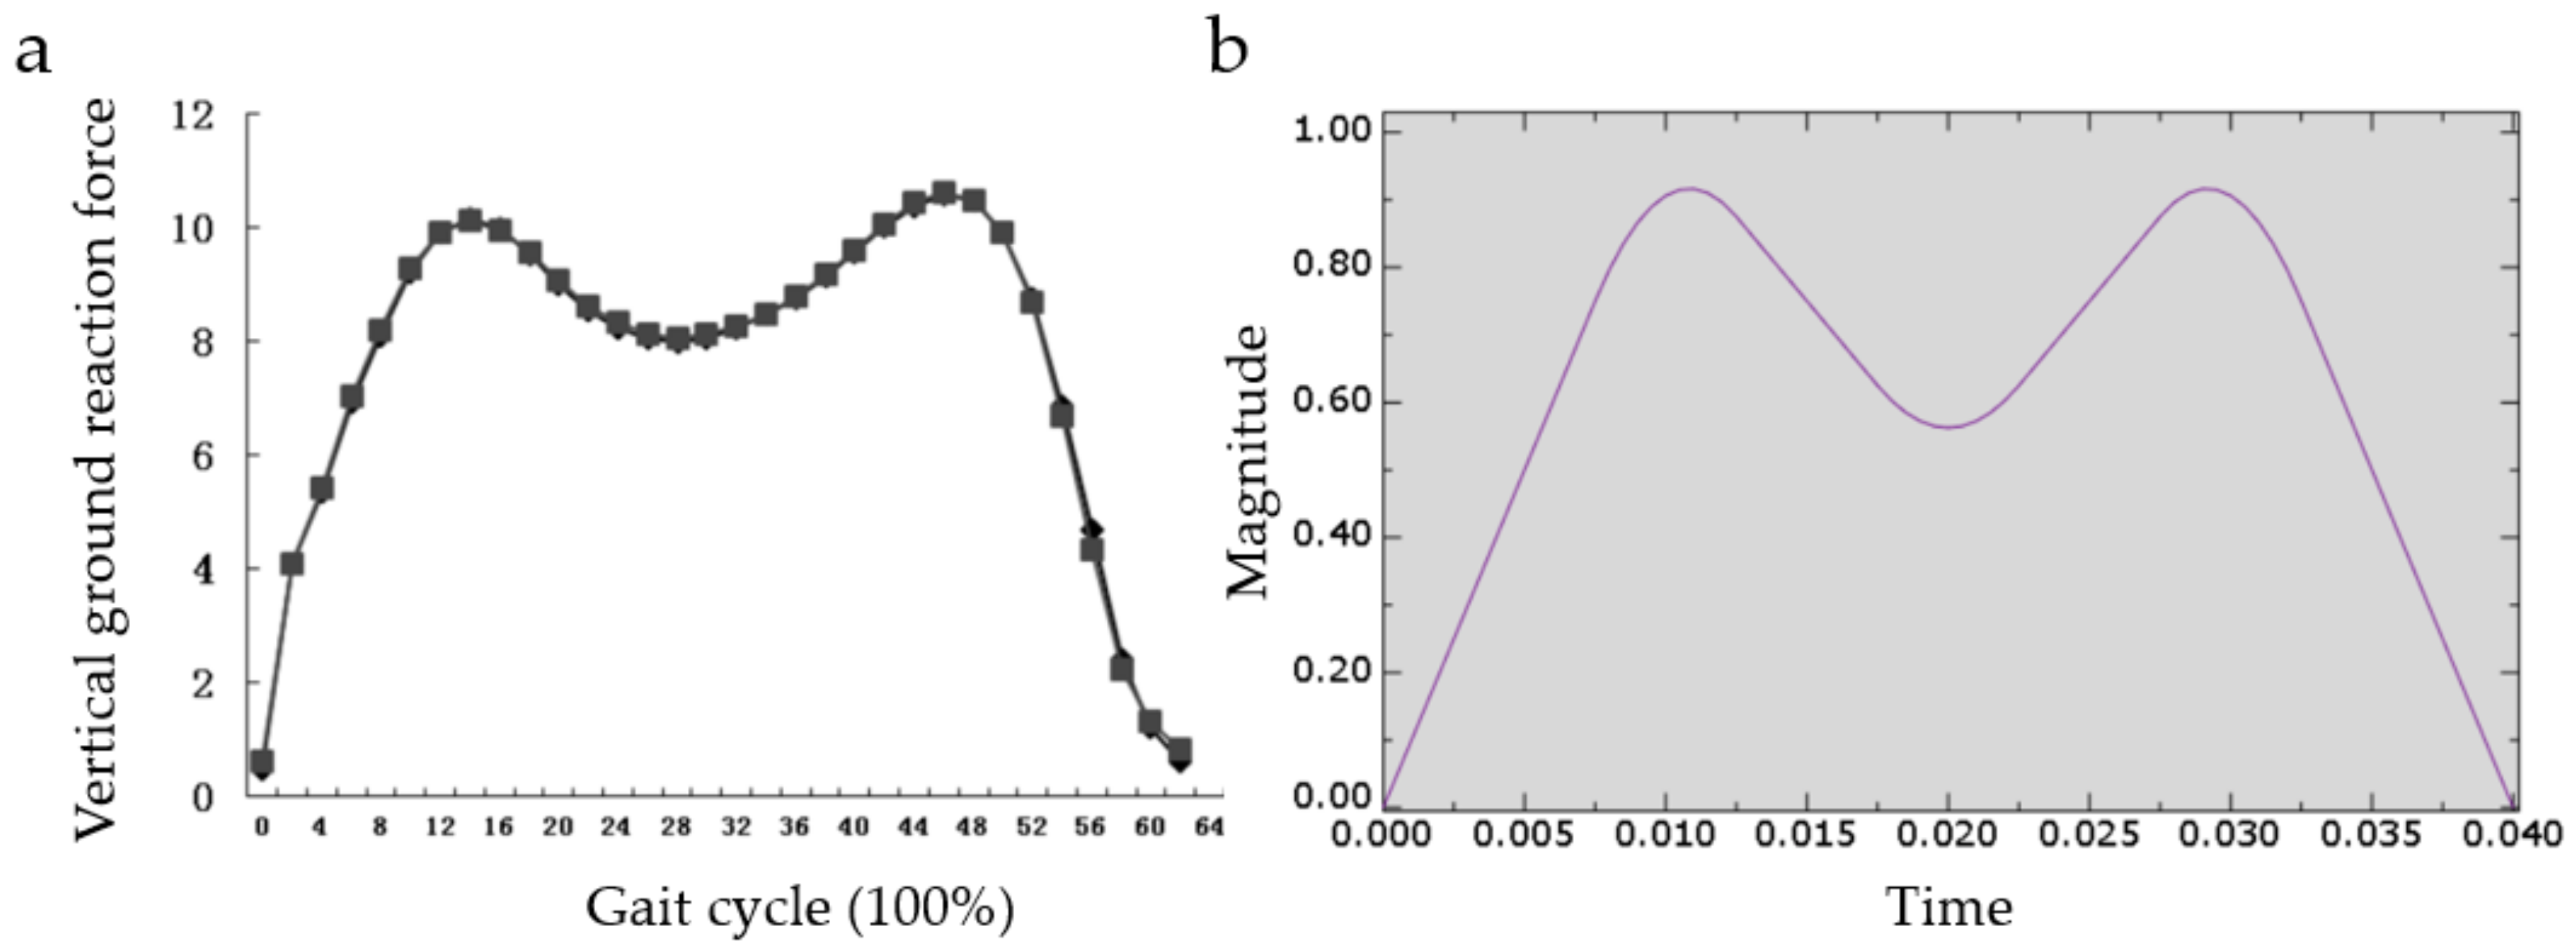
2.3. Impact Resistance Verification Method
3. Results and Discussion
3.1. Design Analysis
3.1.1. Analysis of Design Variables
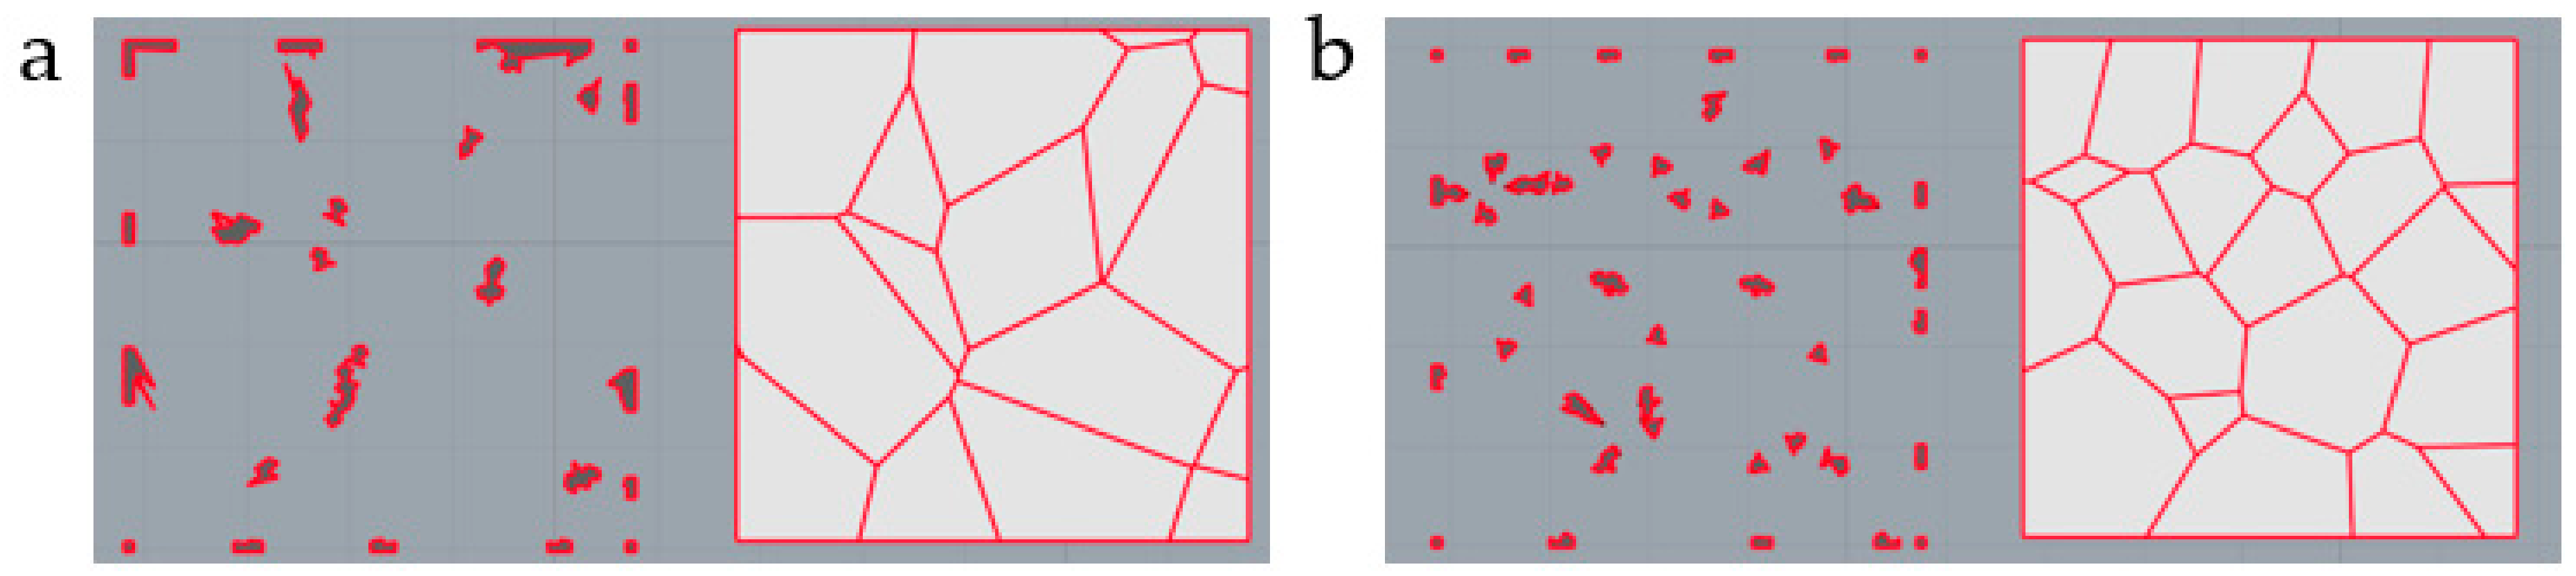
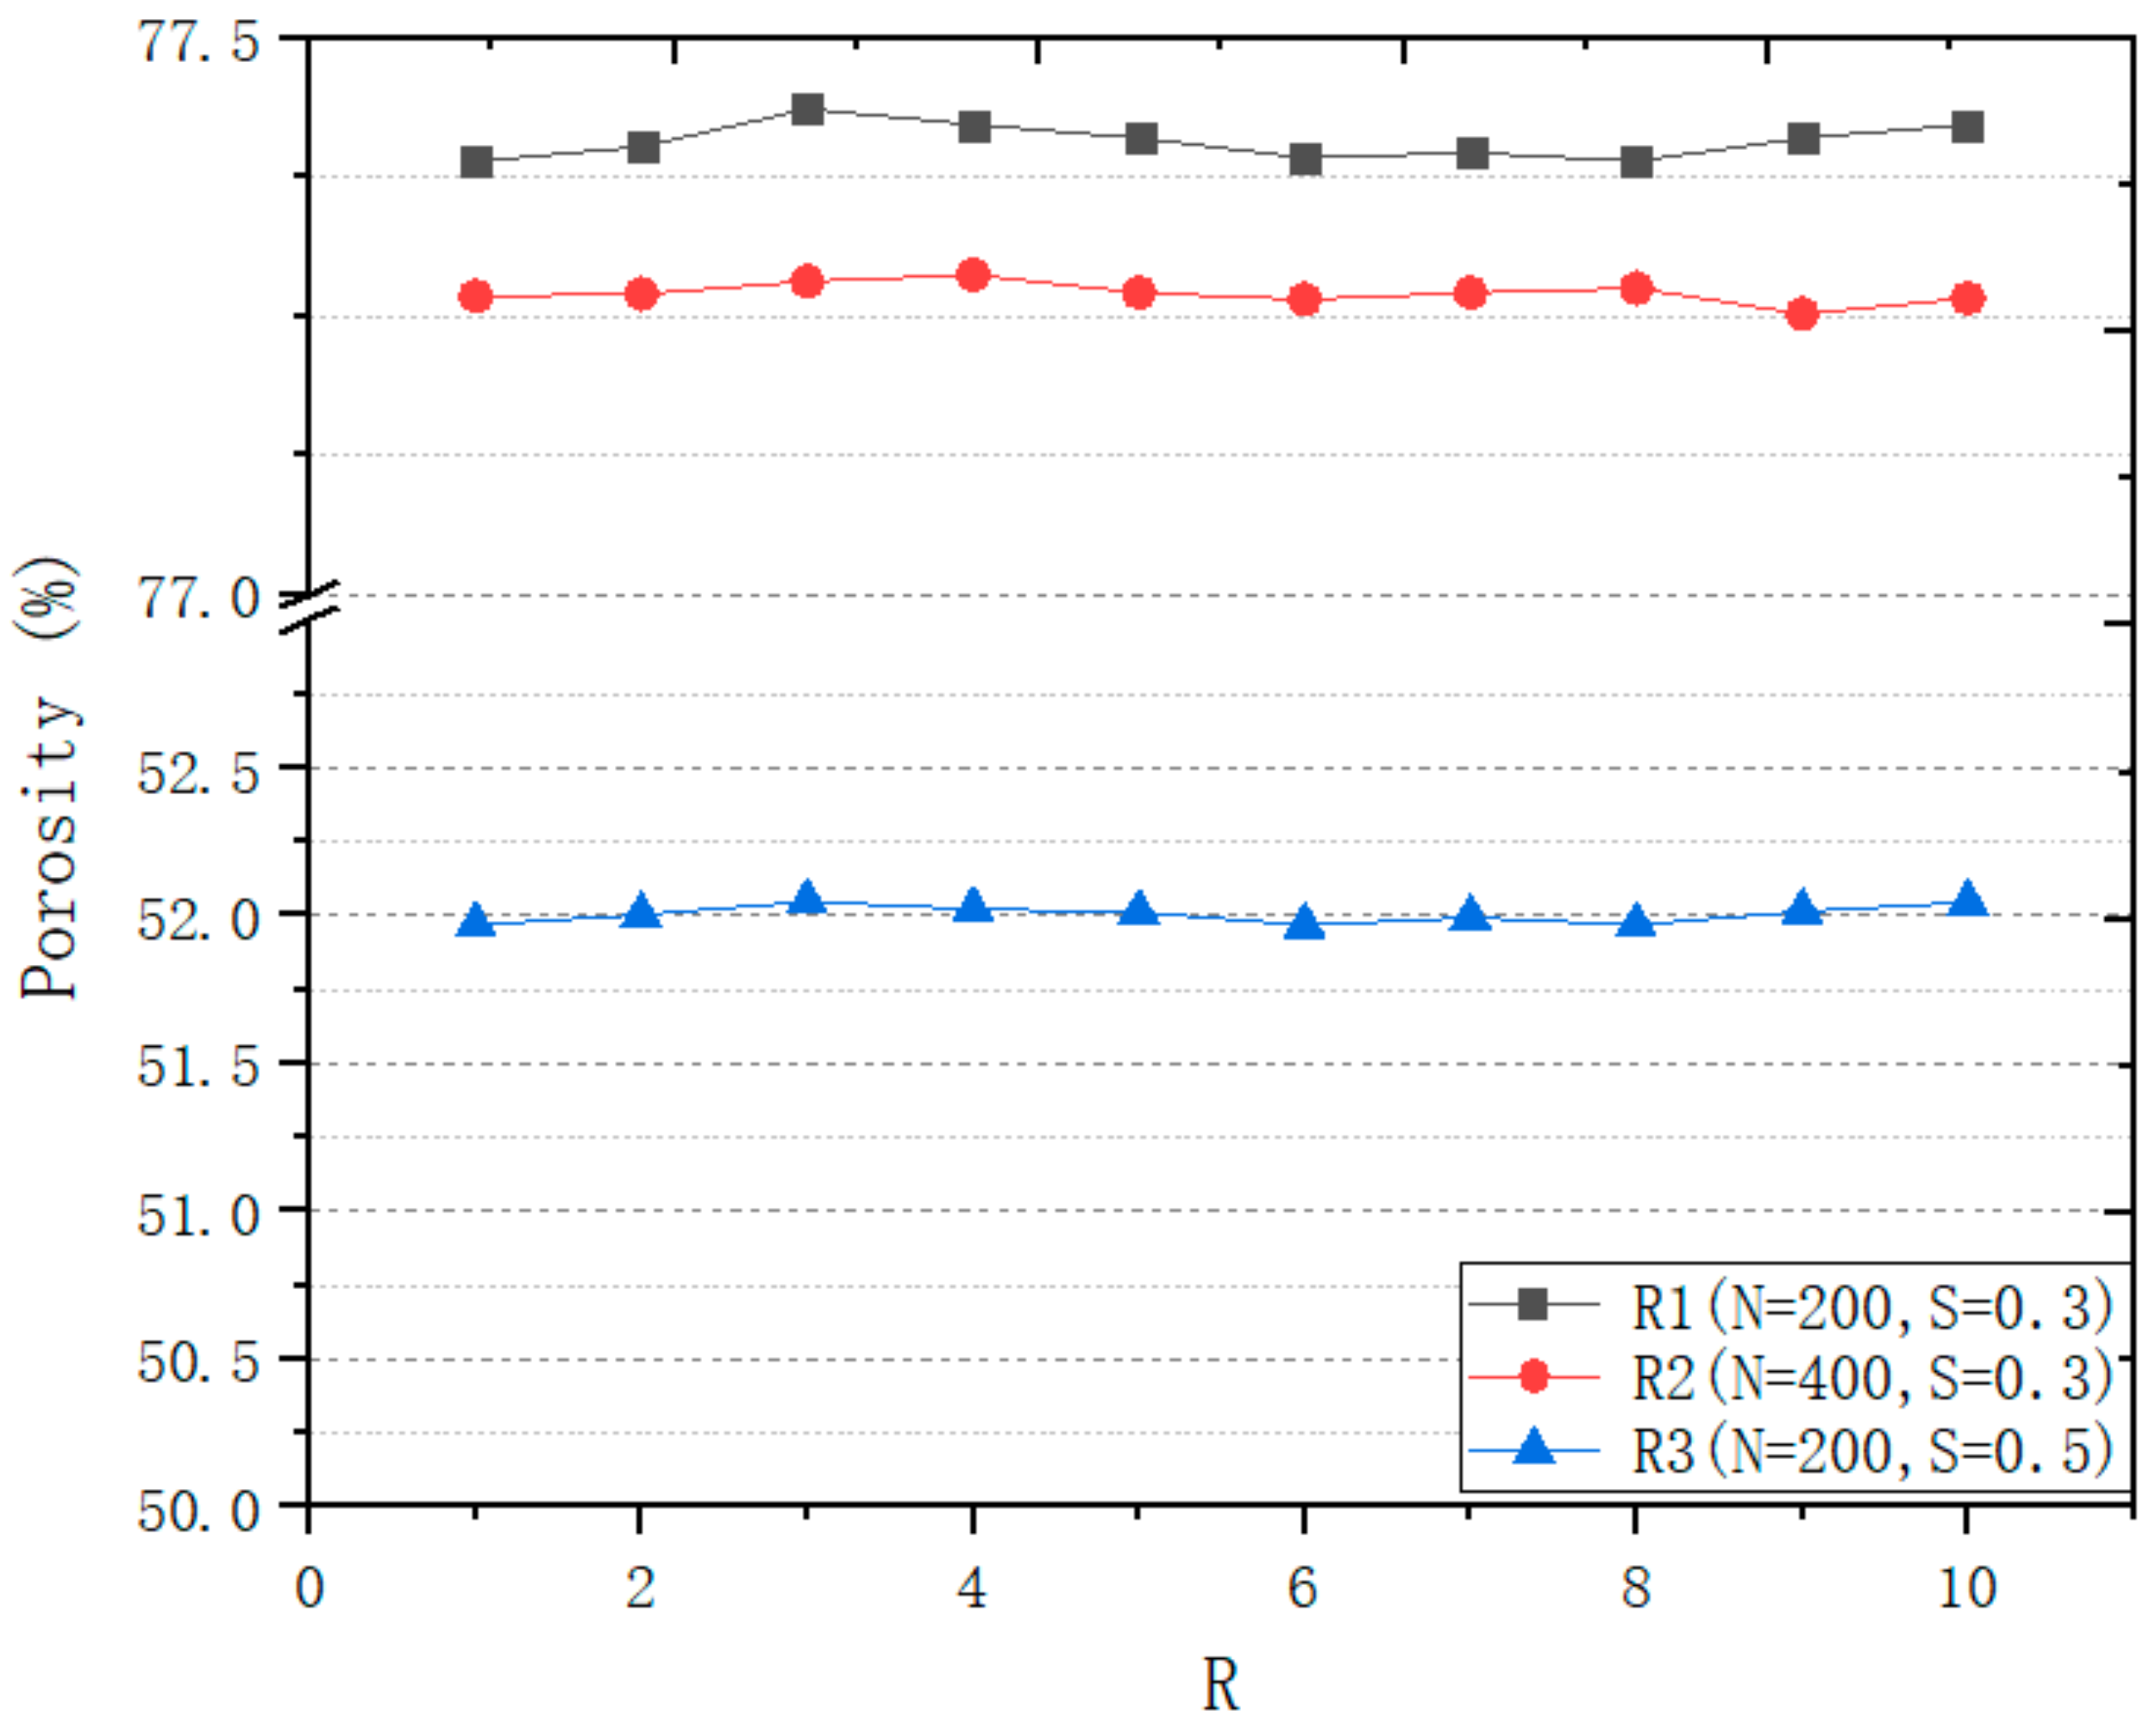
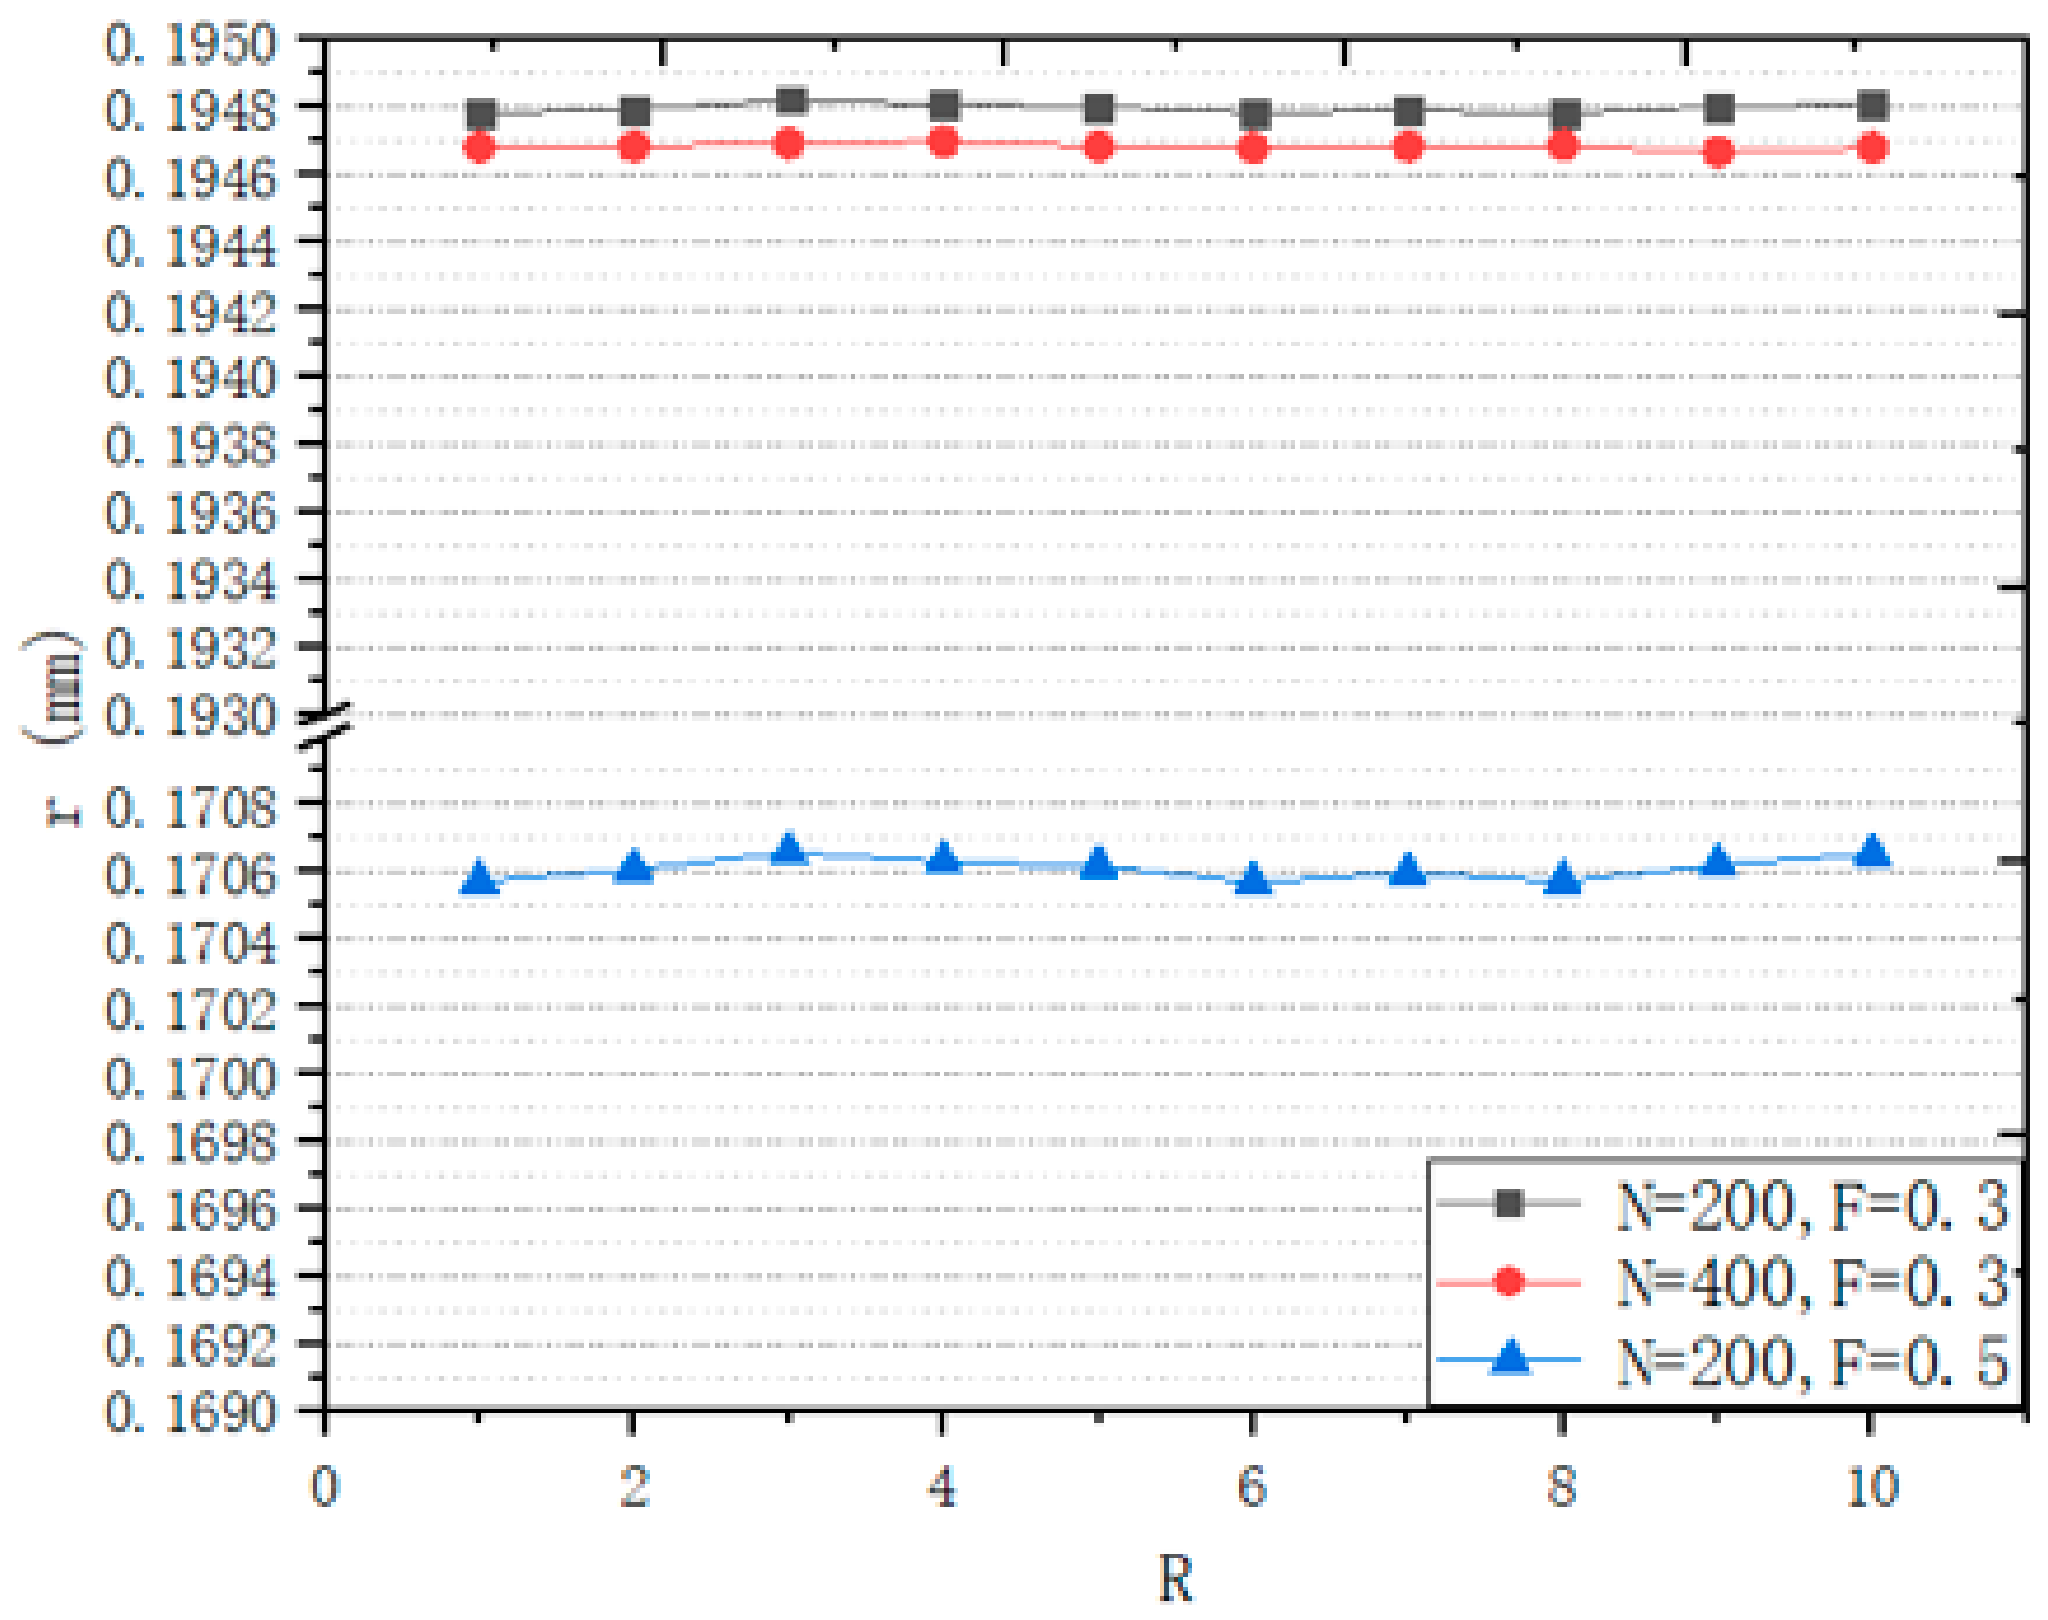
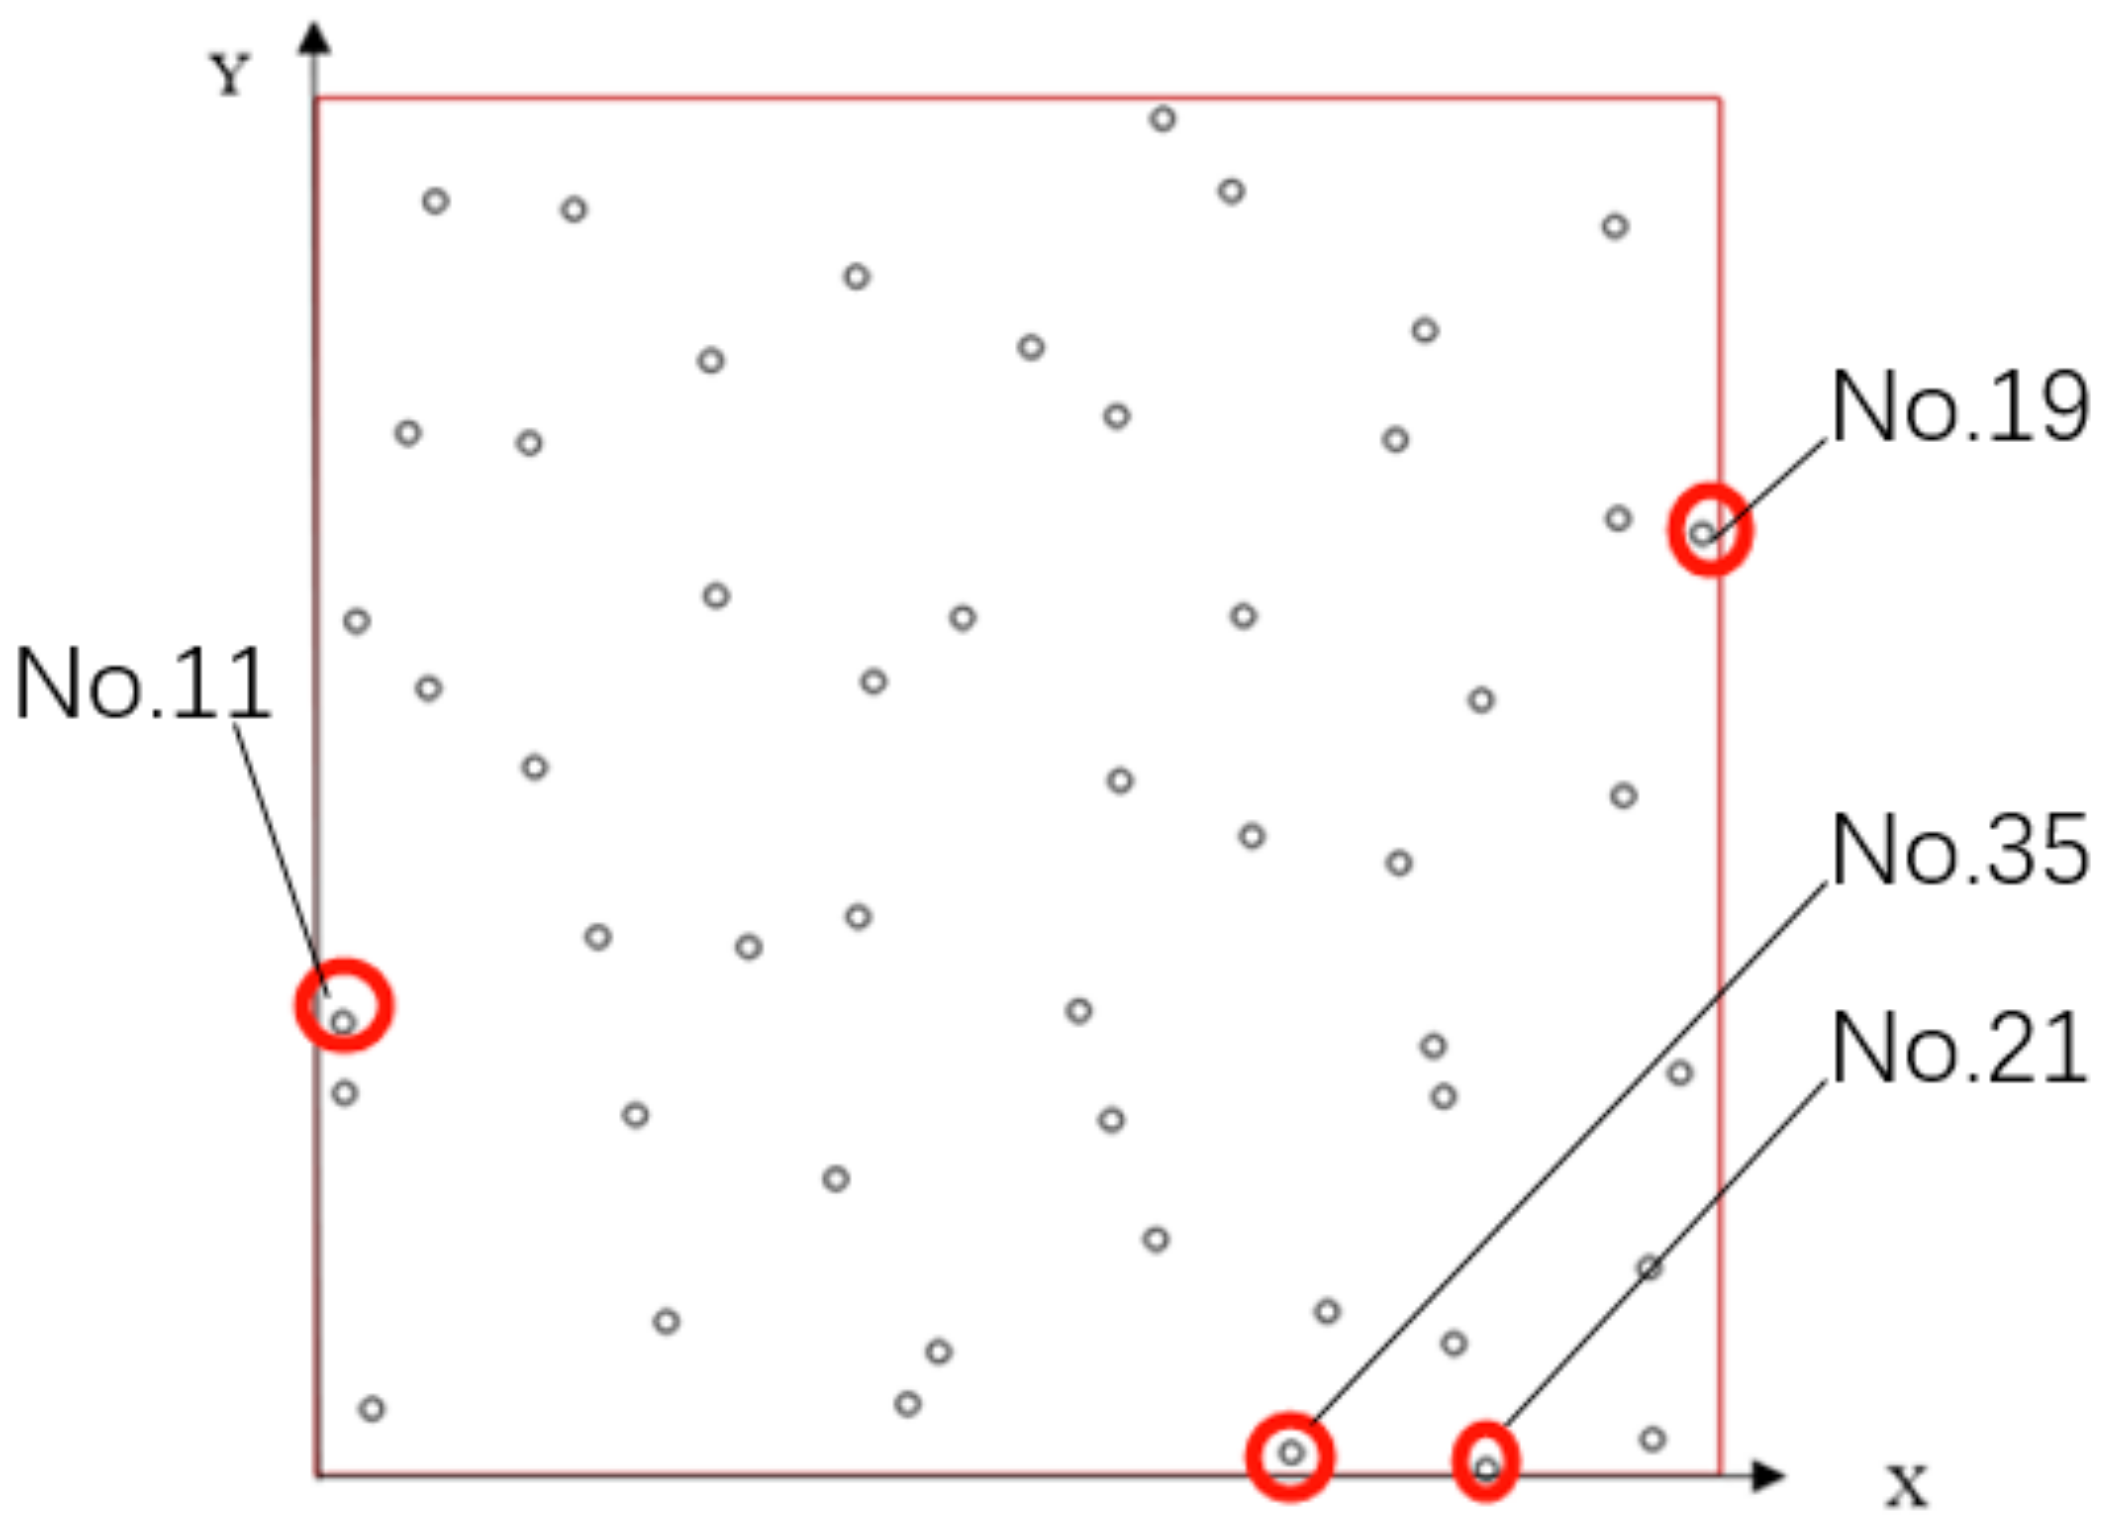
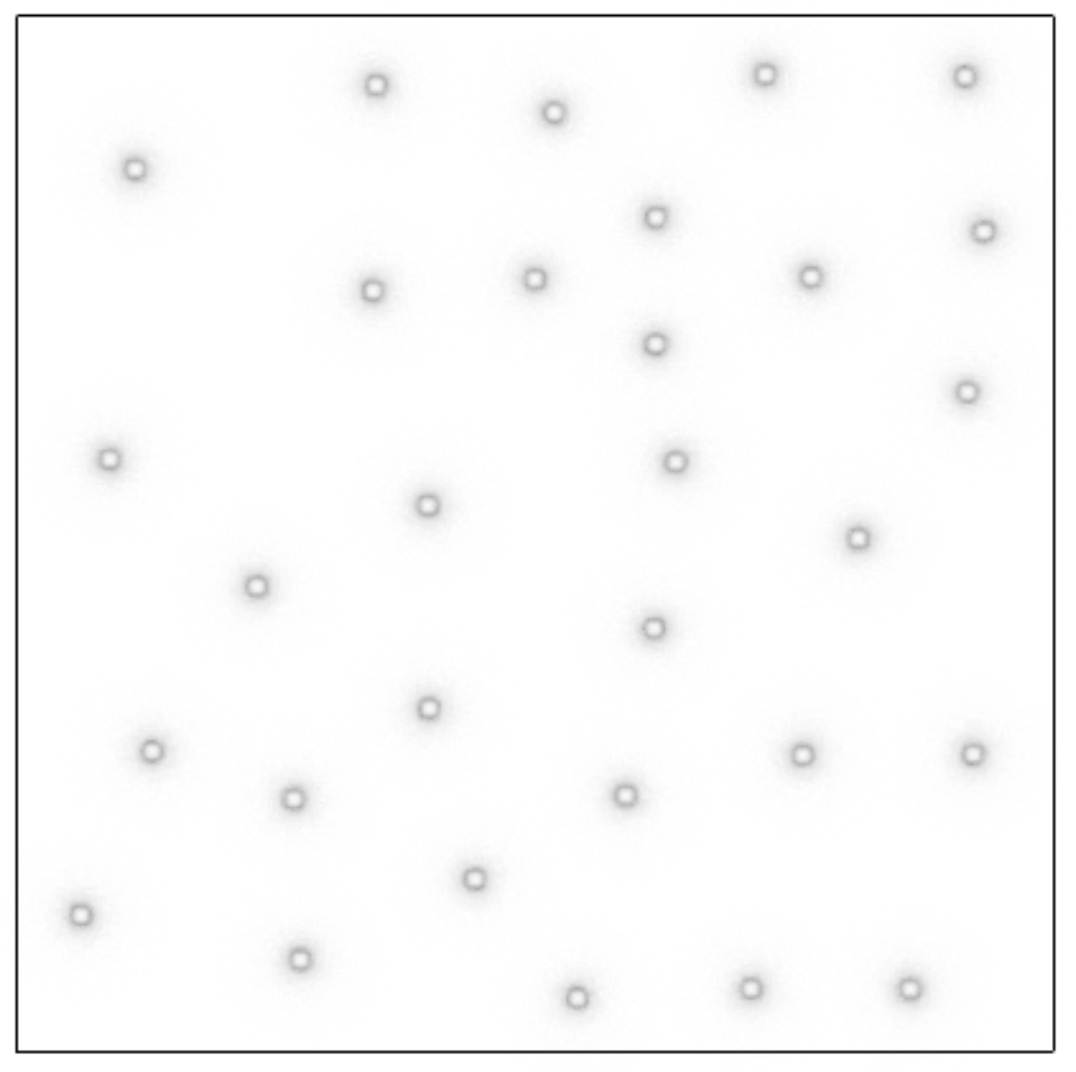
3.1.2. Seeds Control Analysis
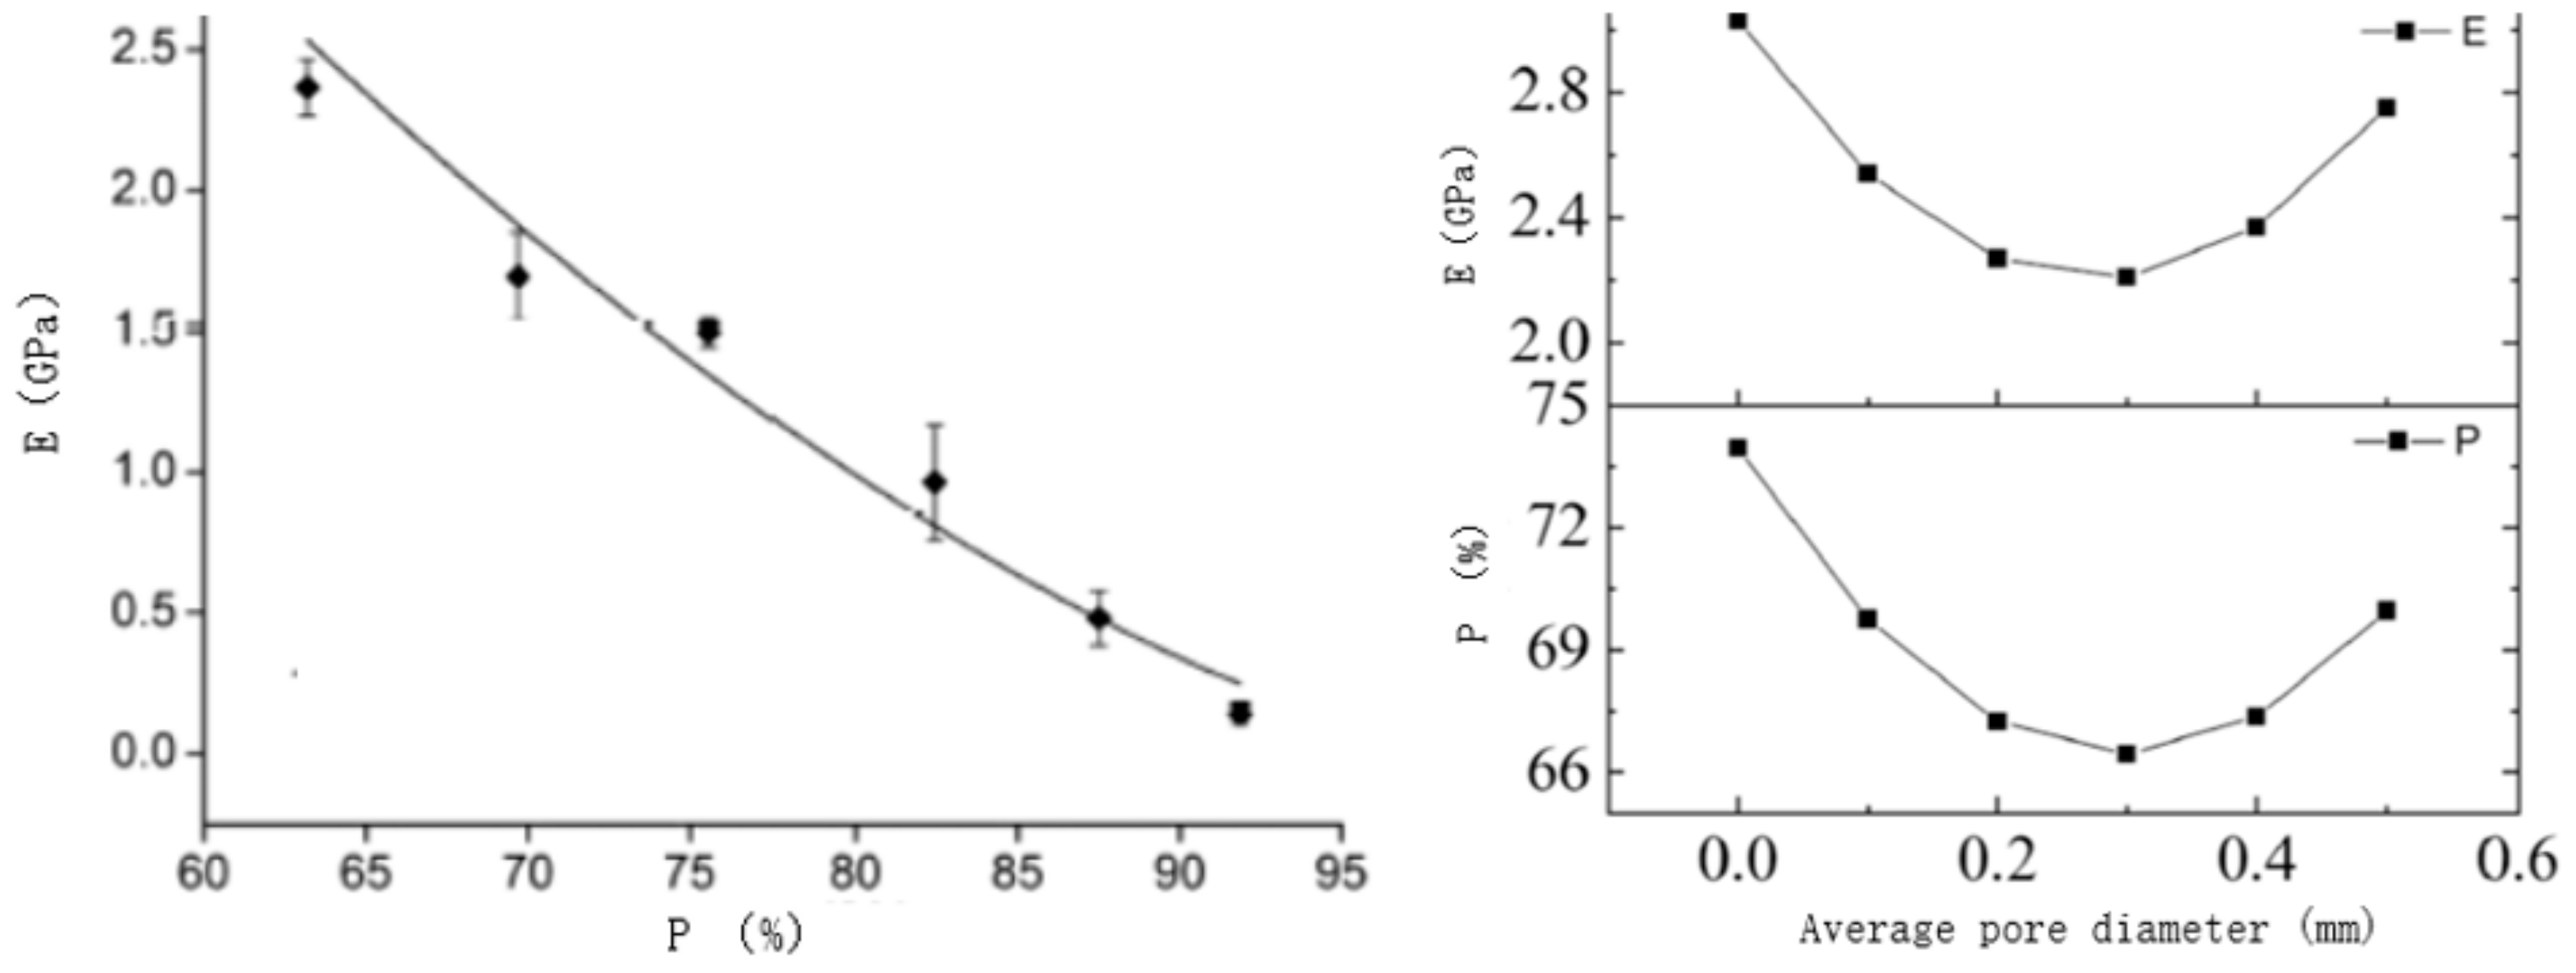
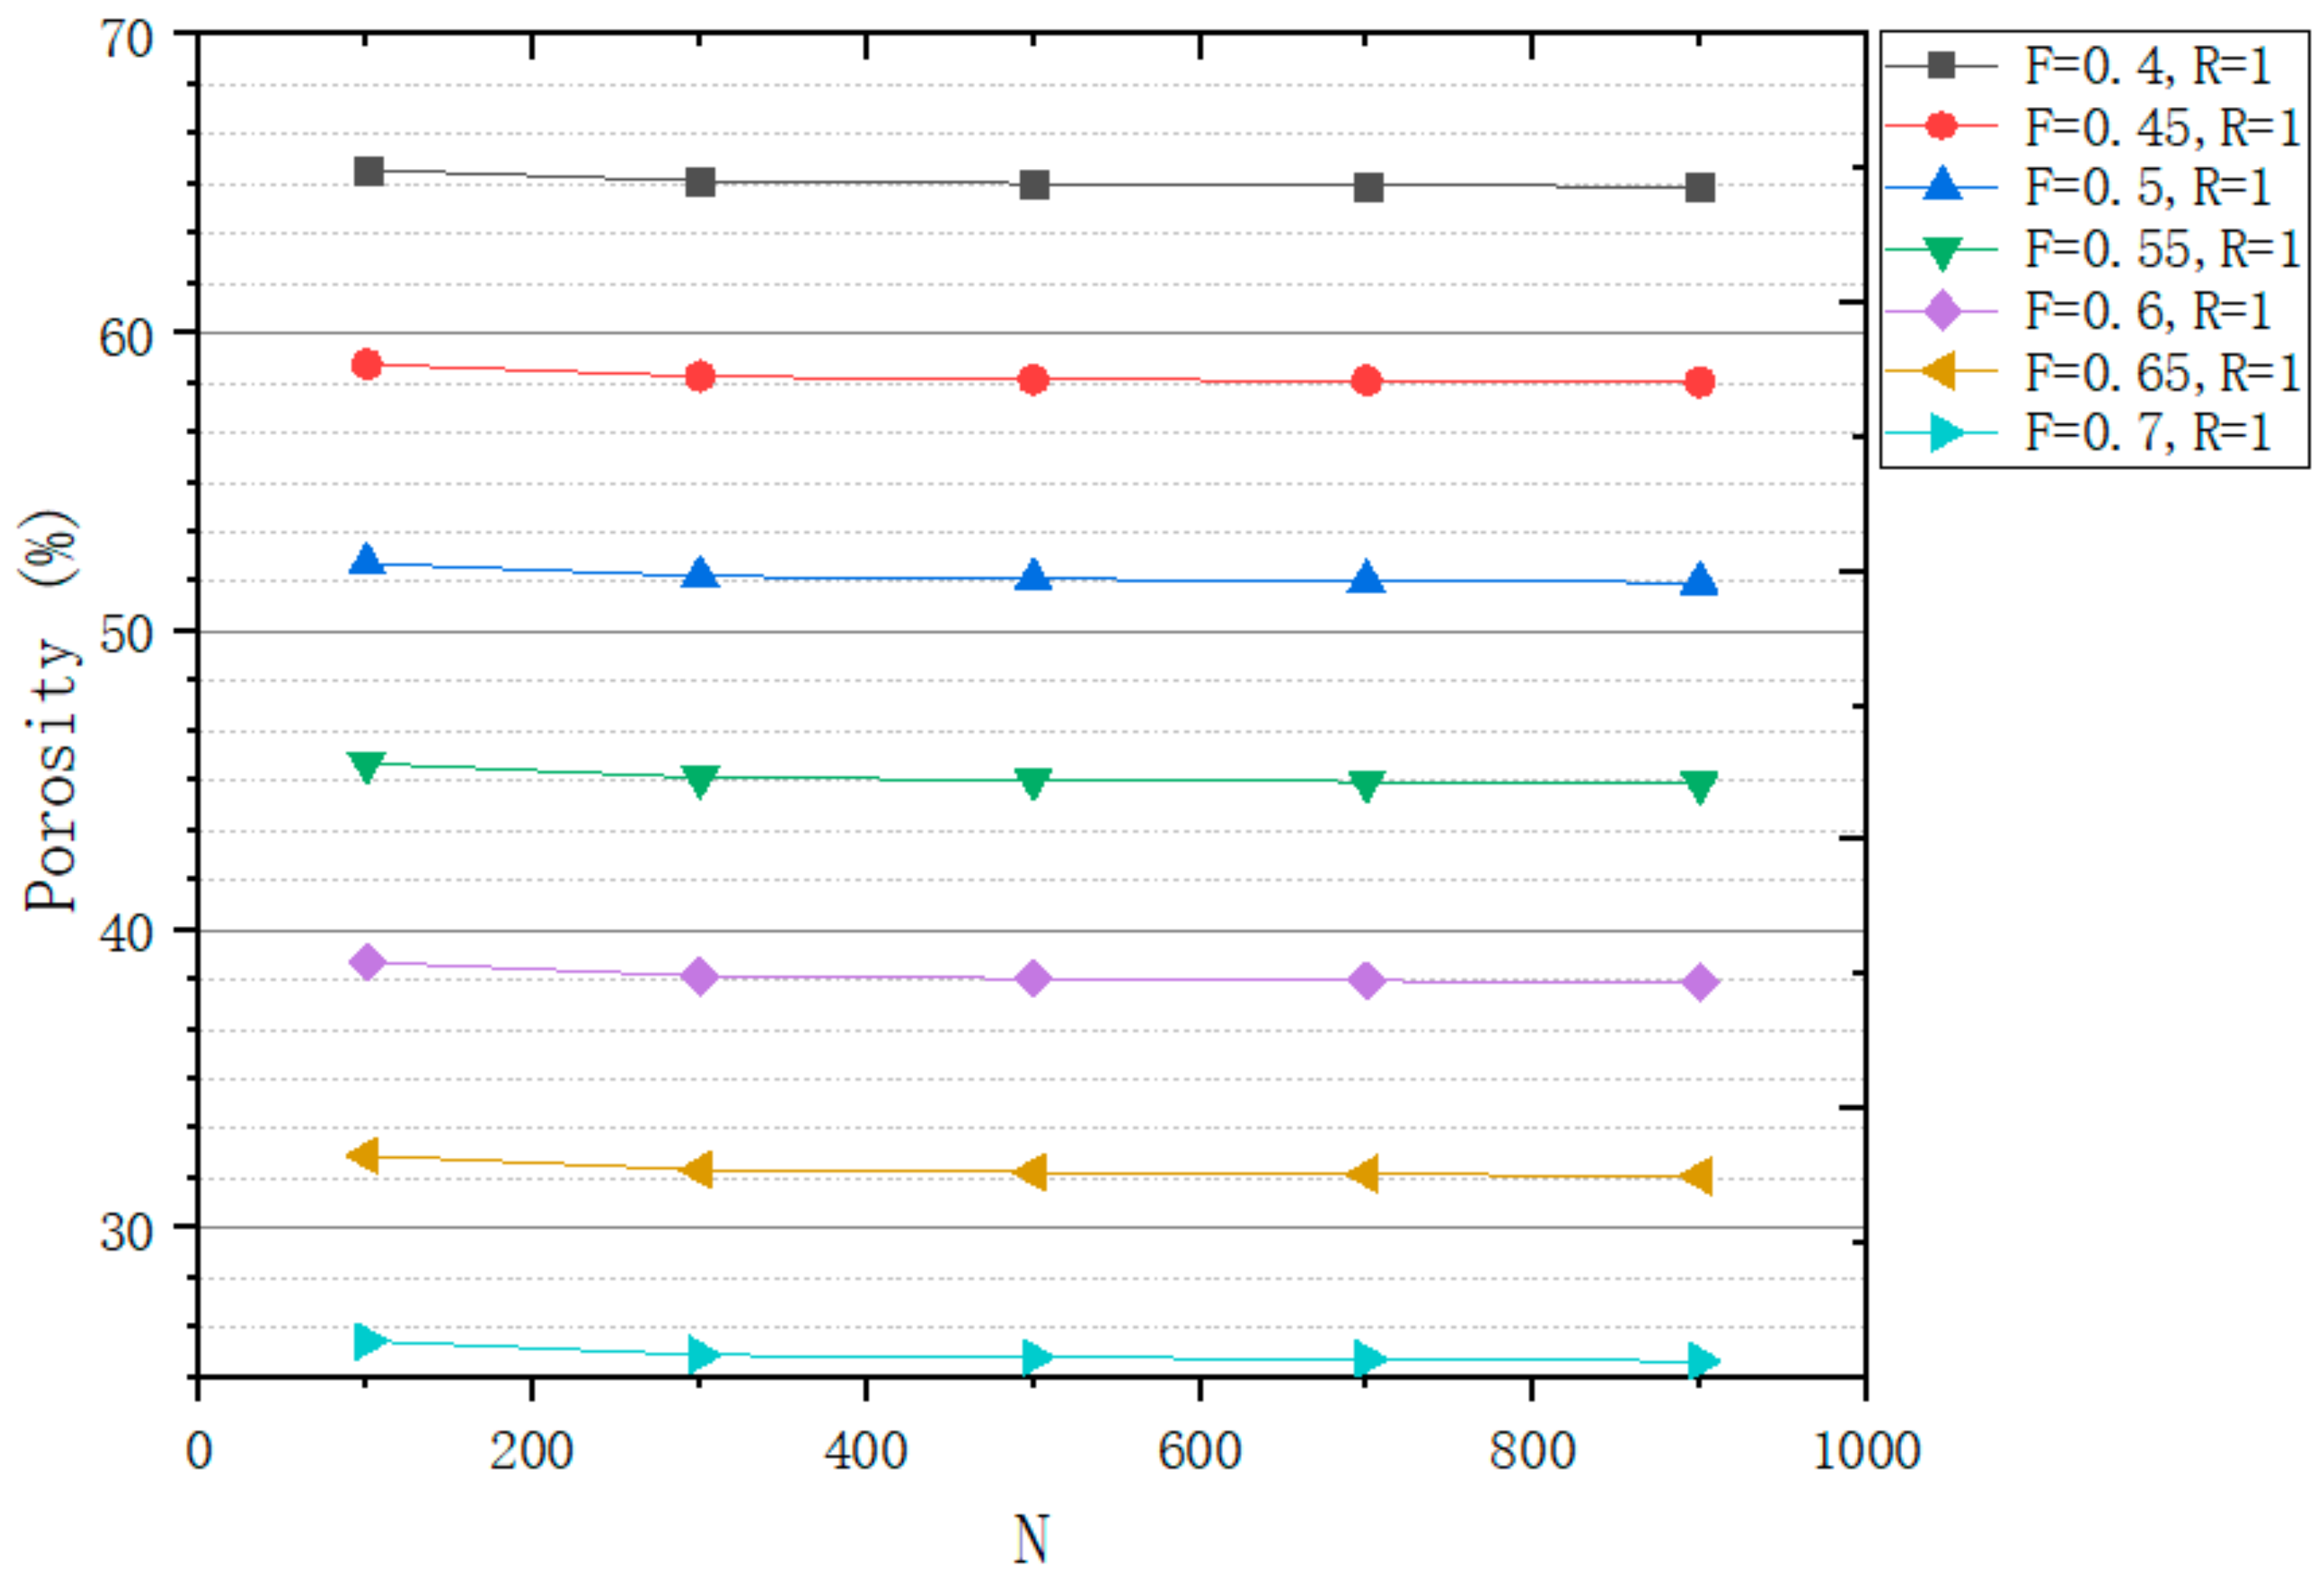
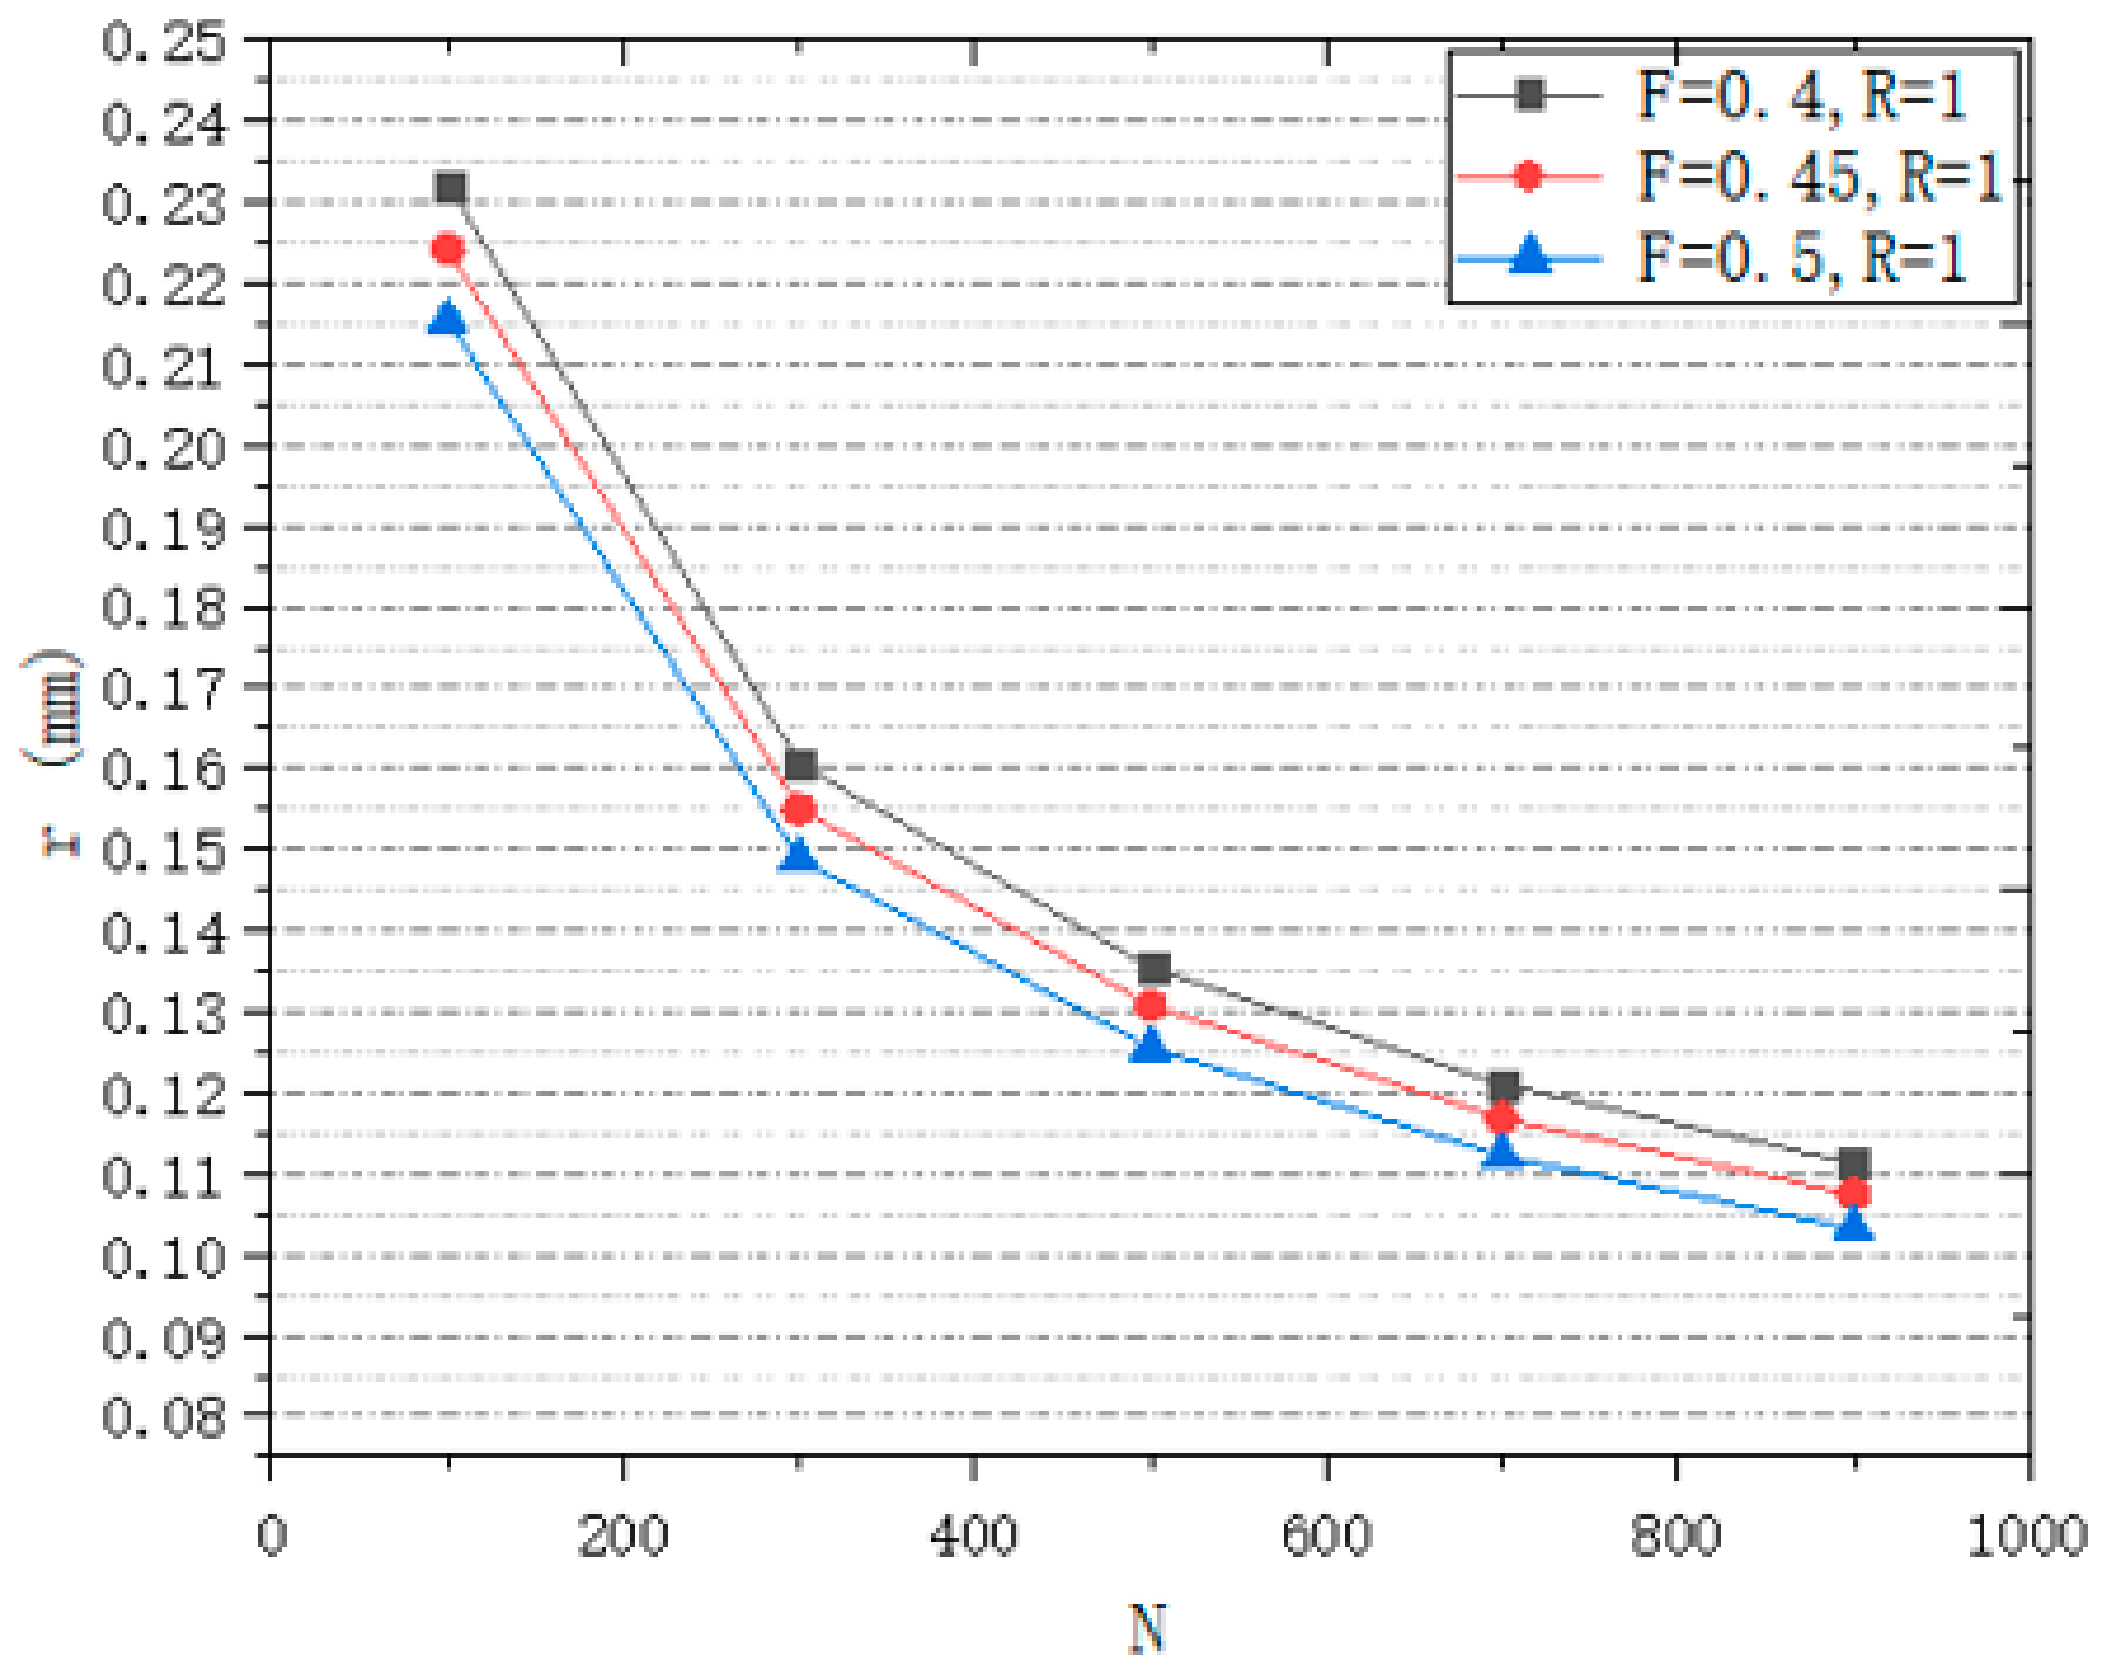
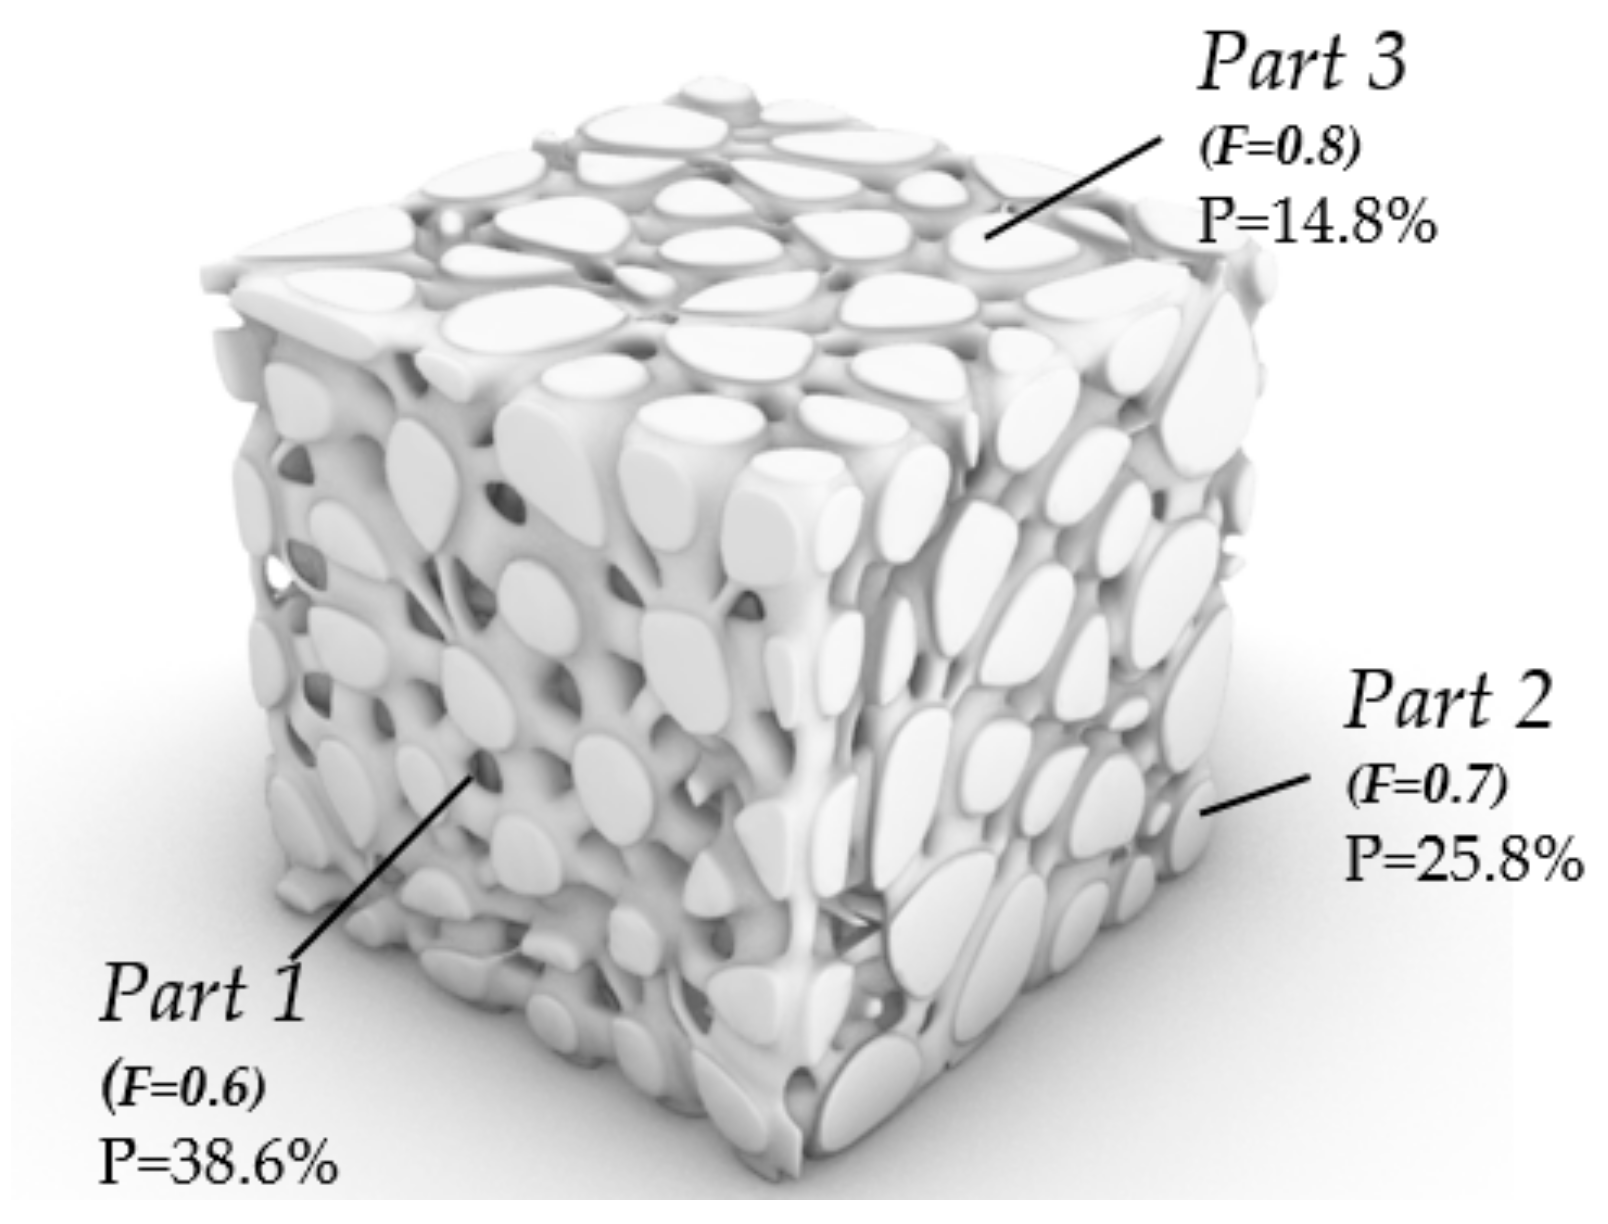
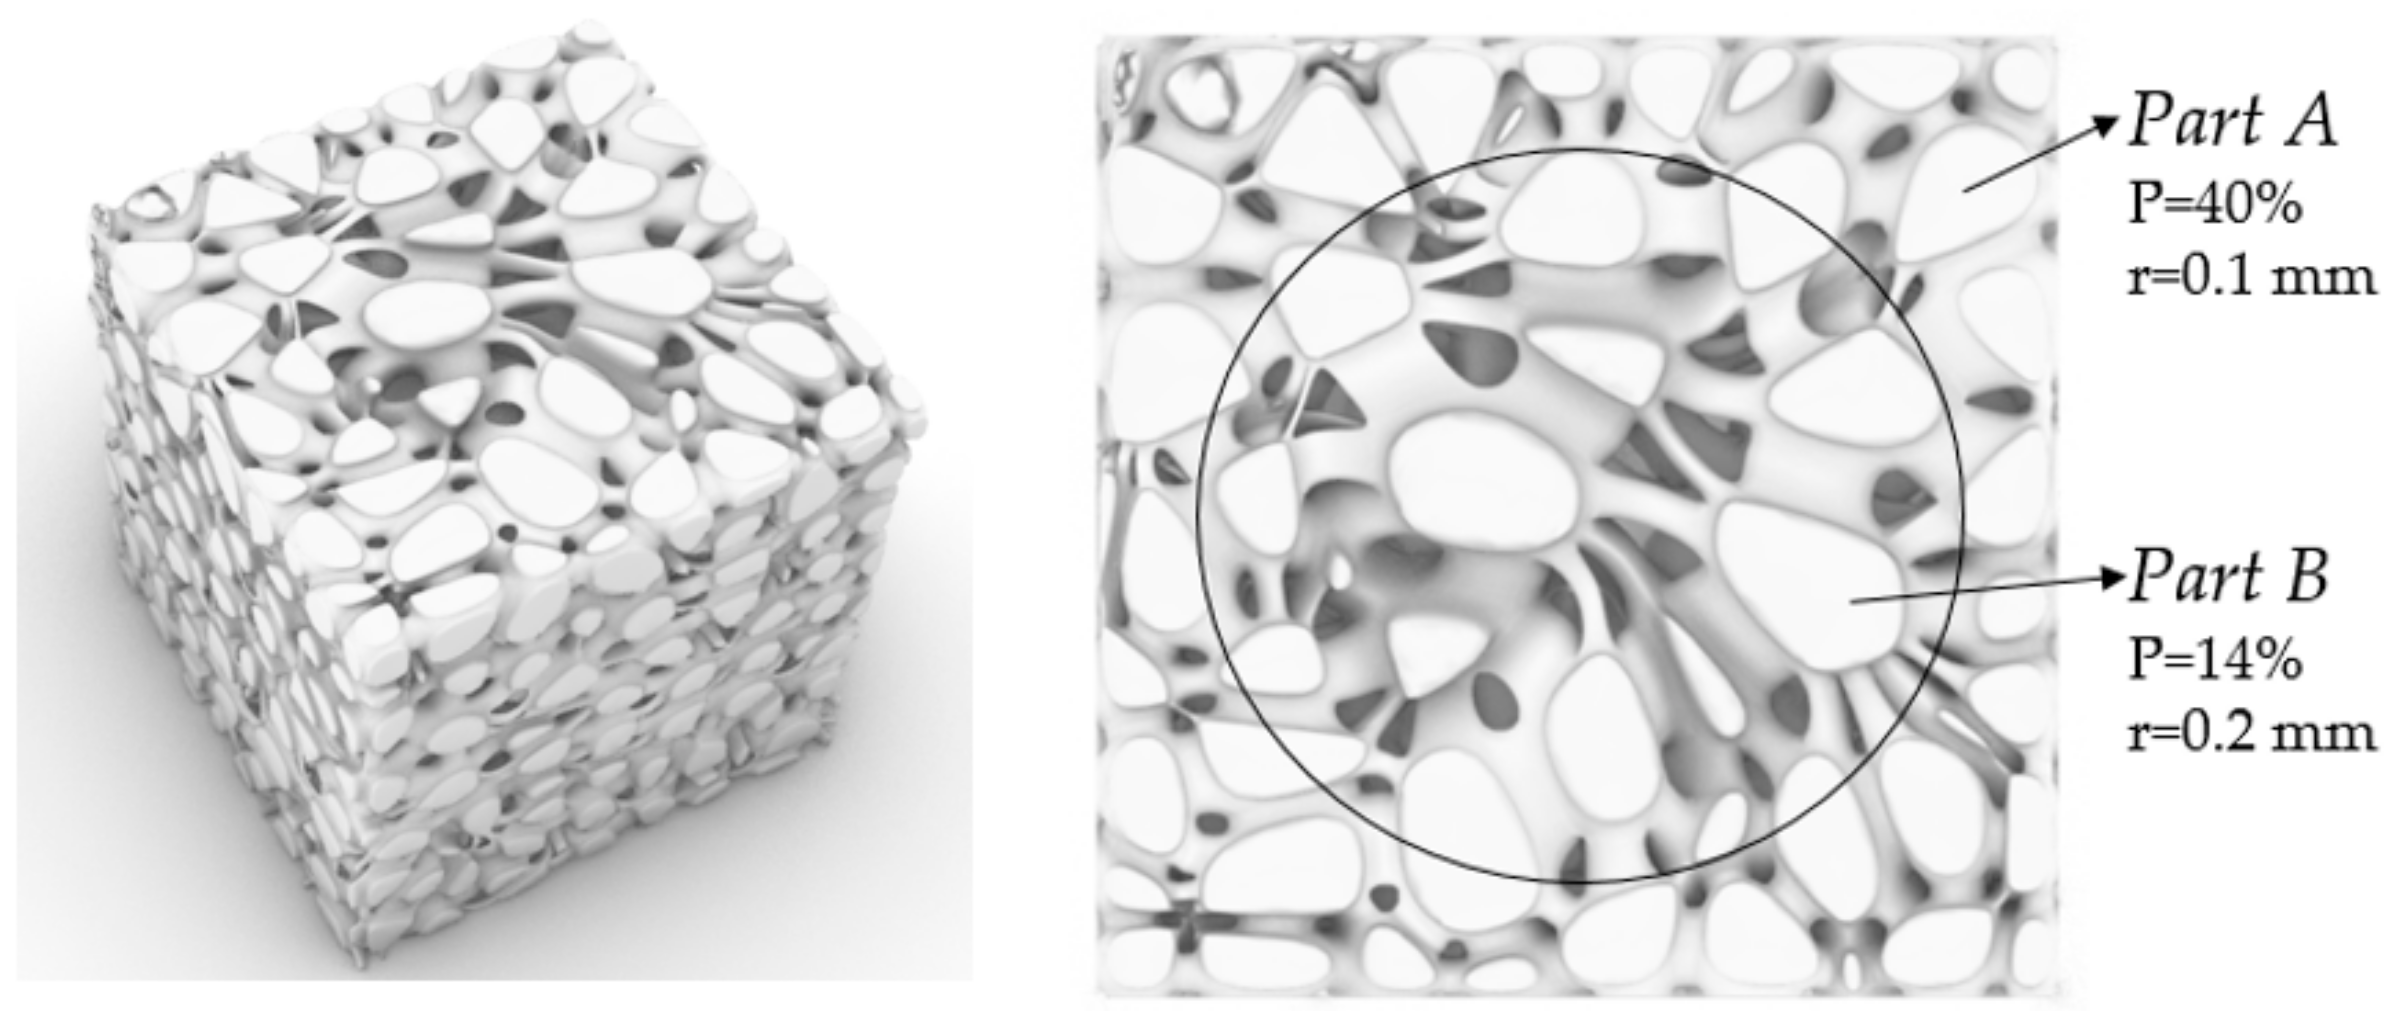
3.1.3. Porosity Control Analysis
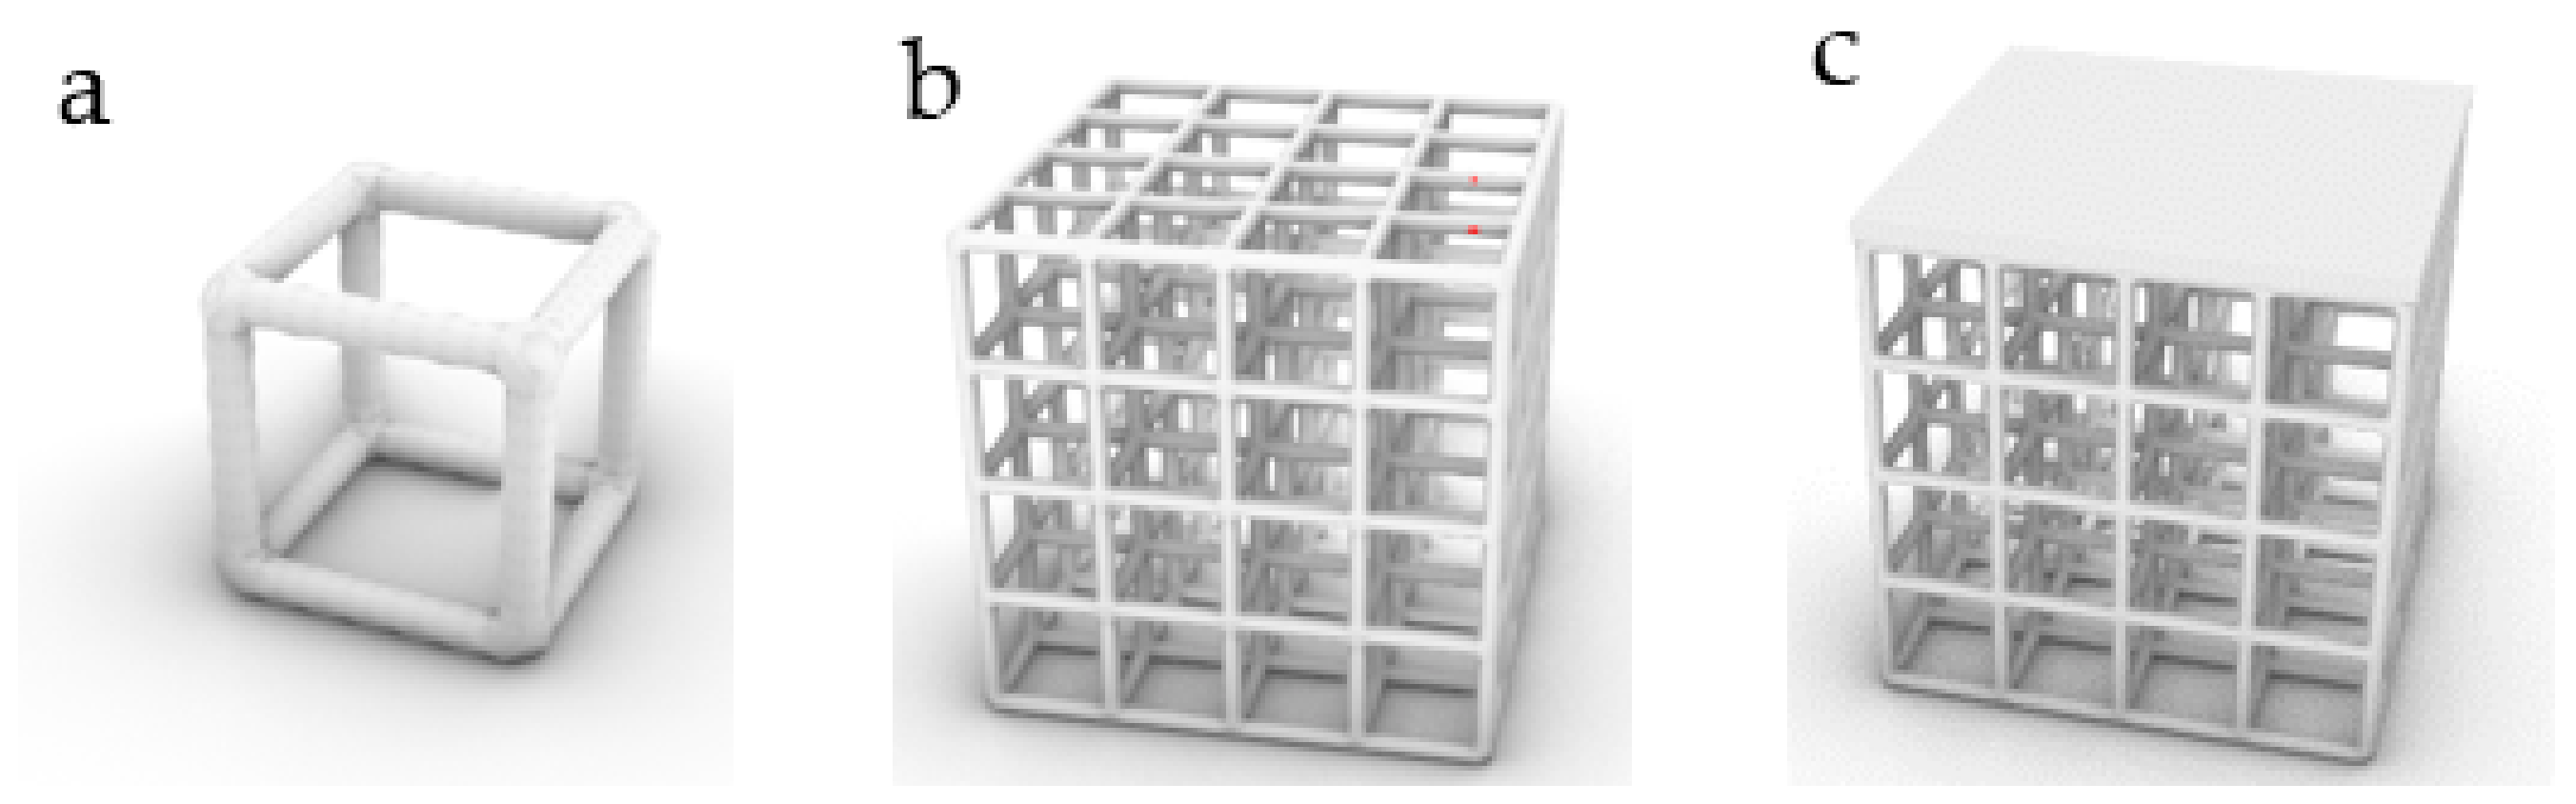
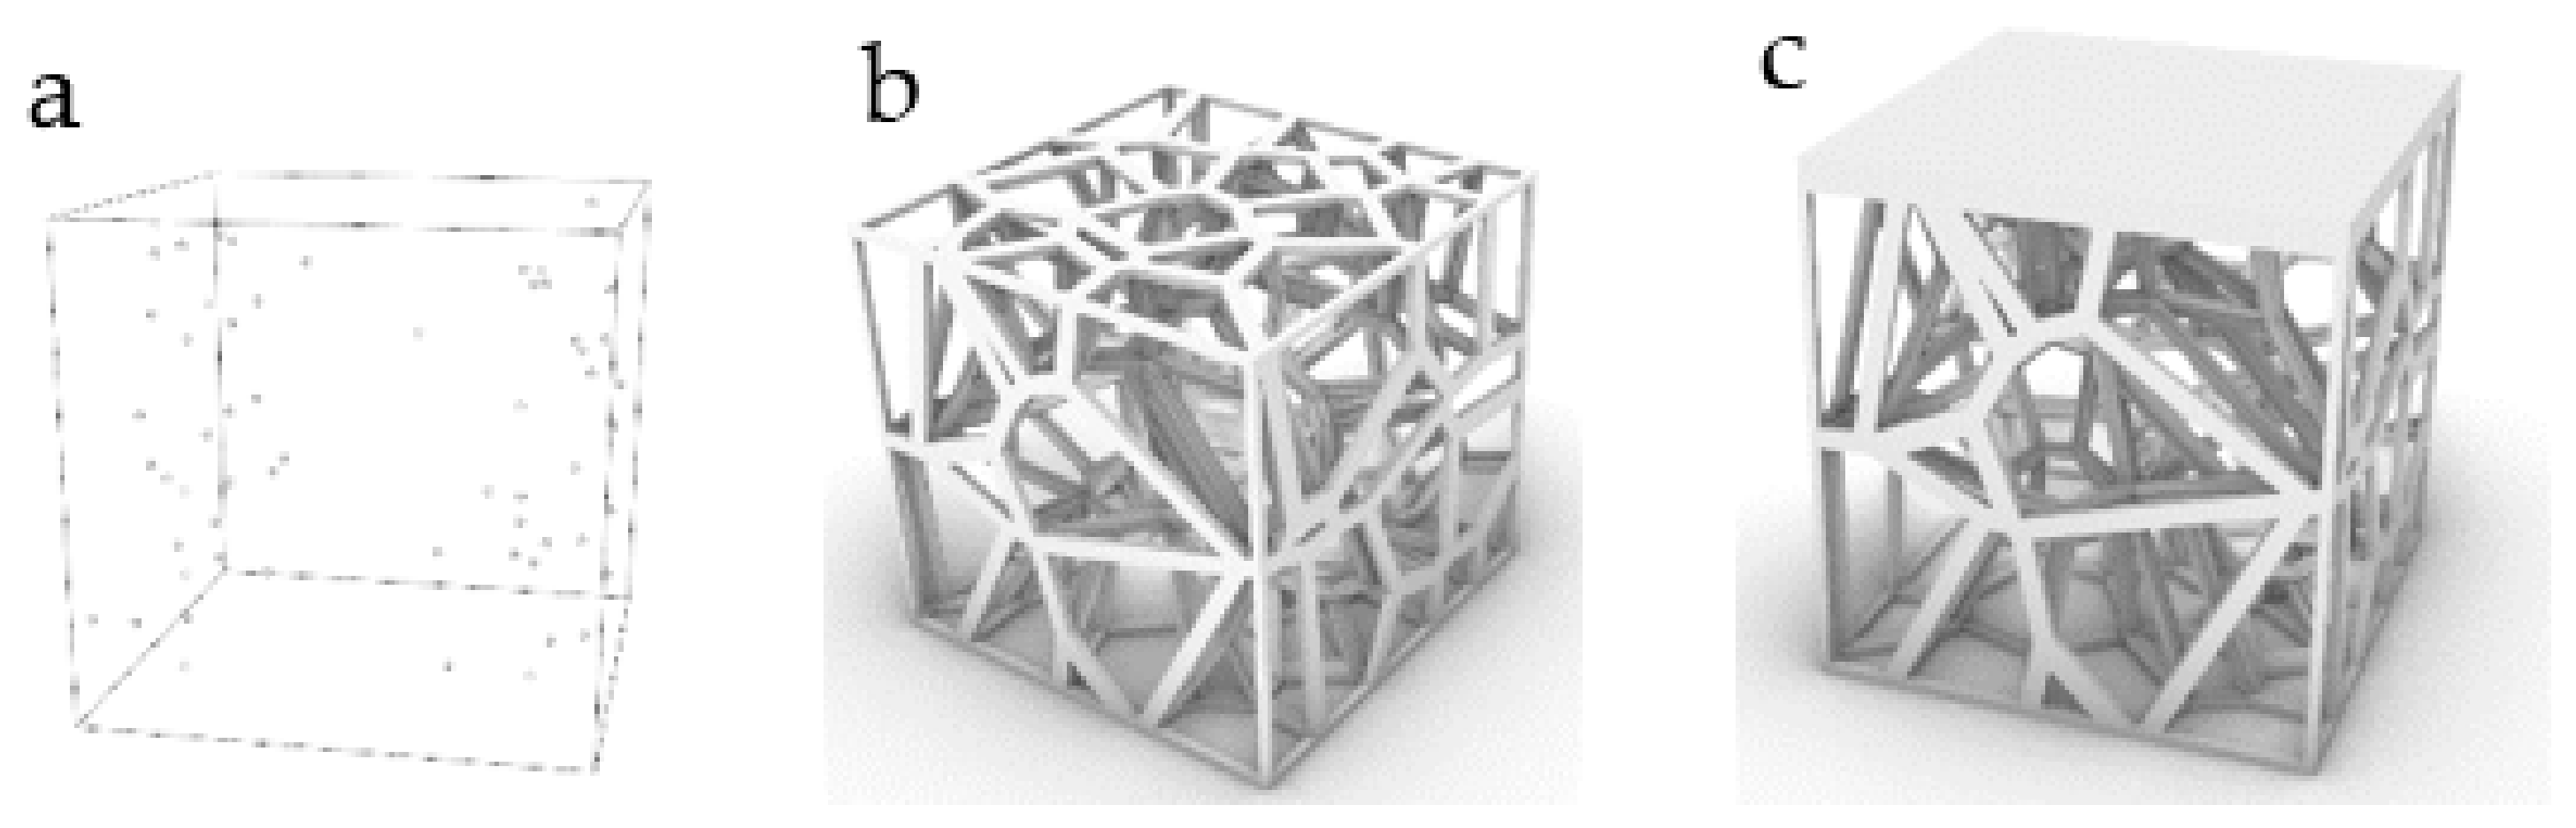
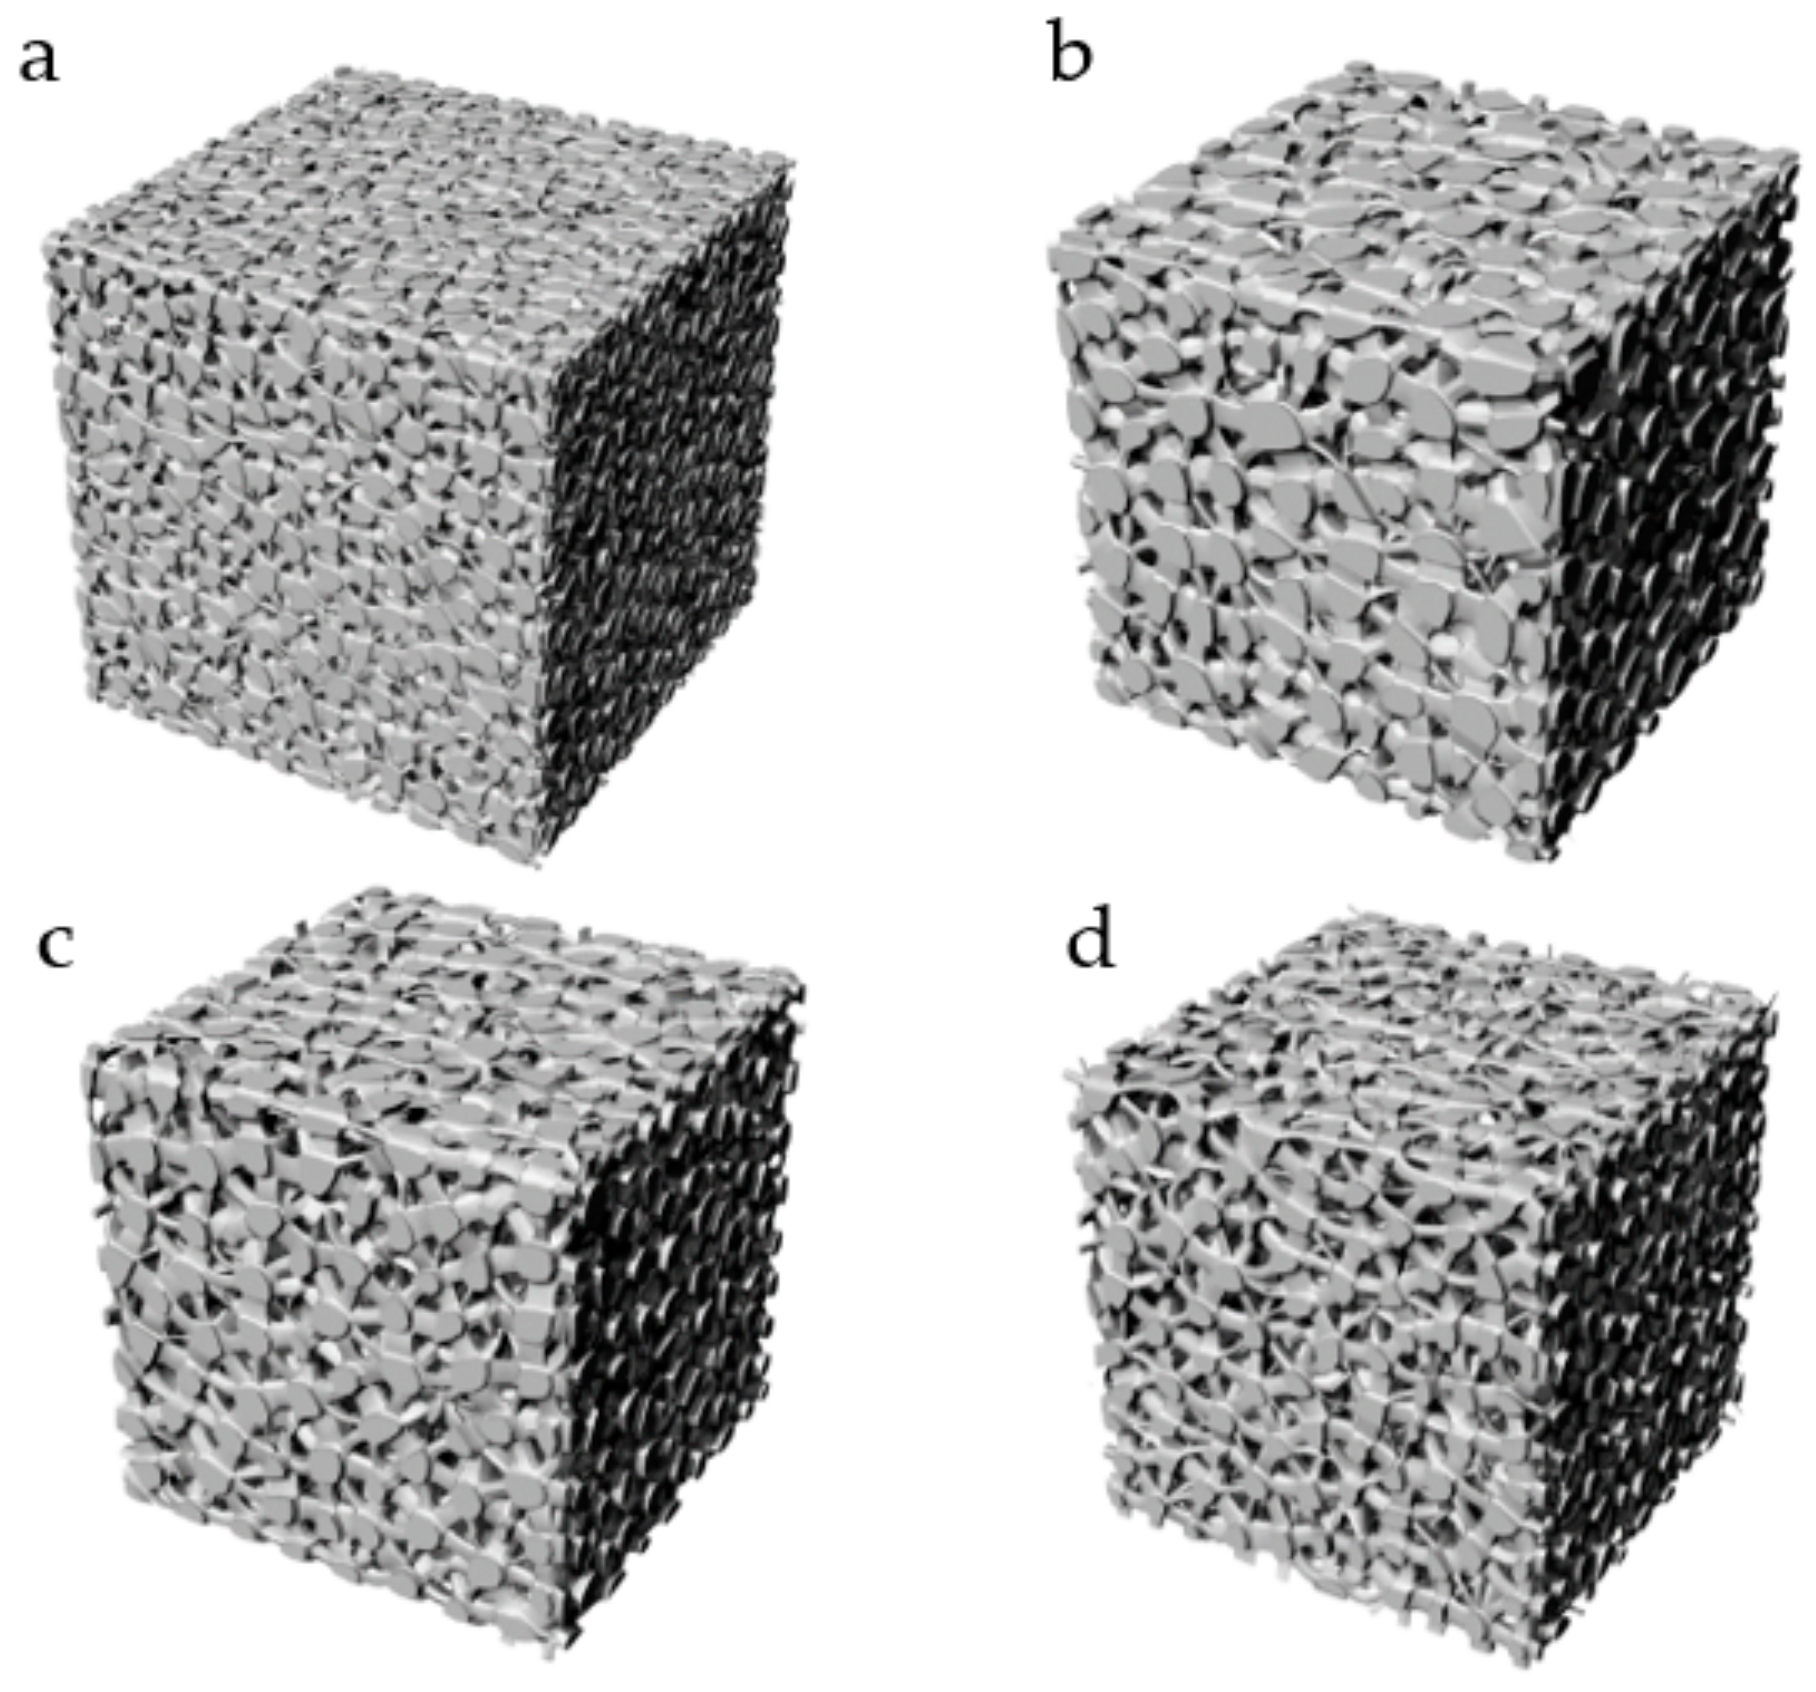
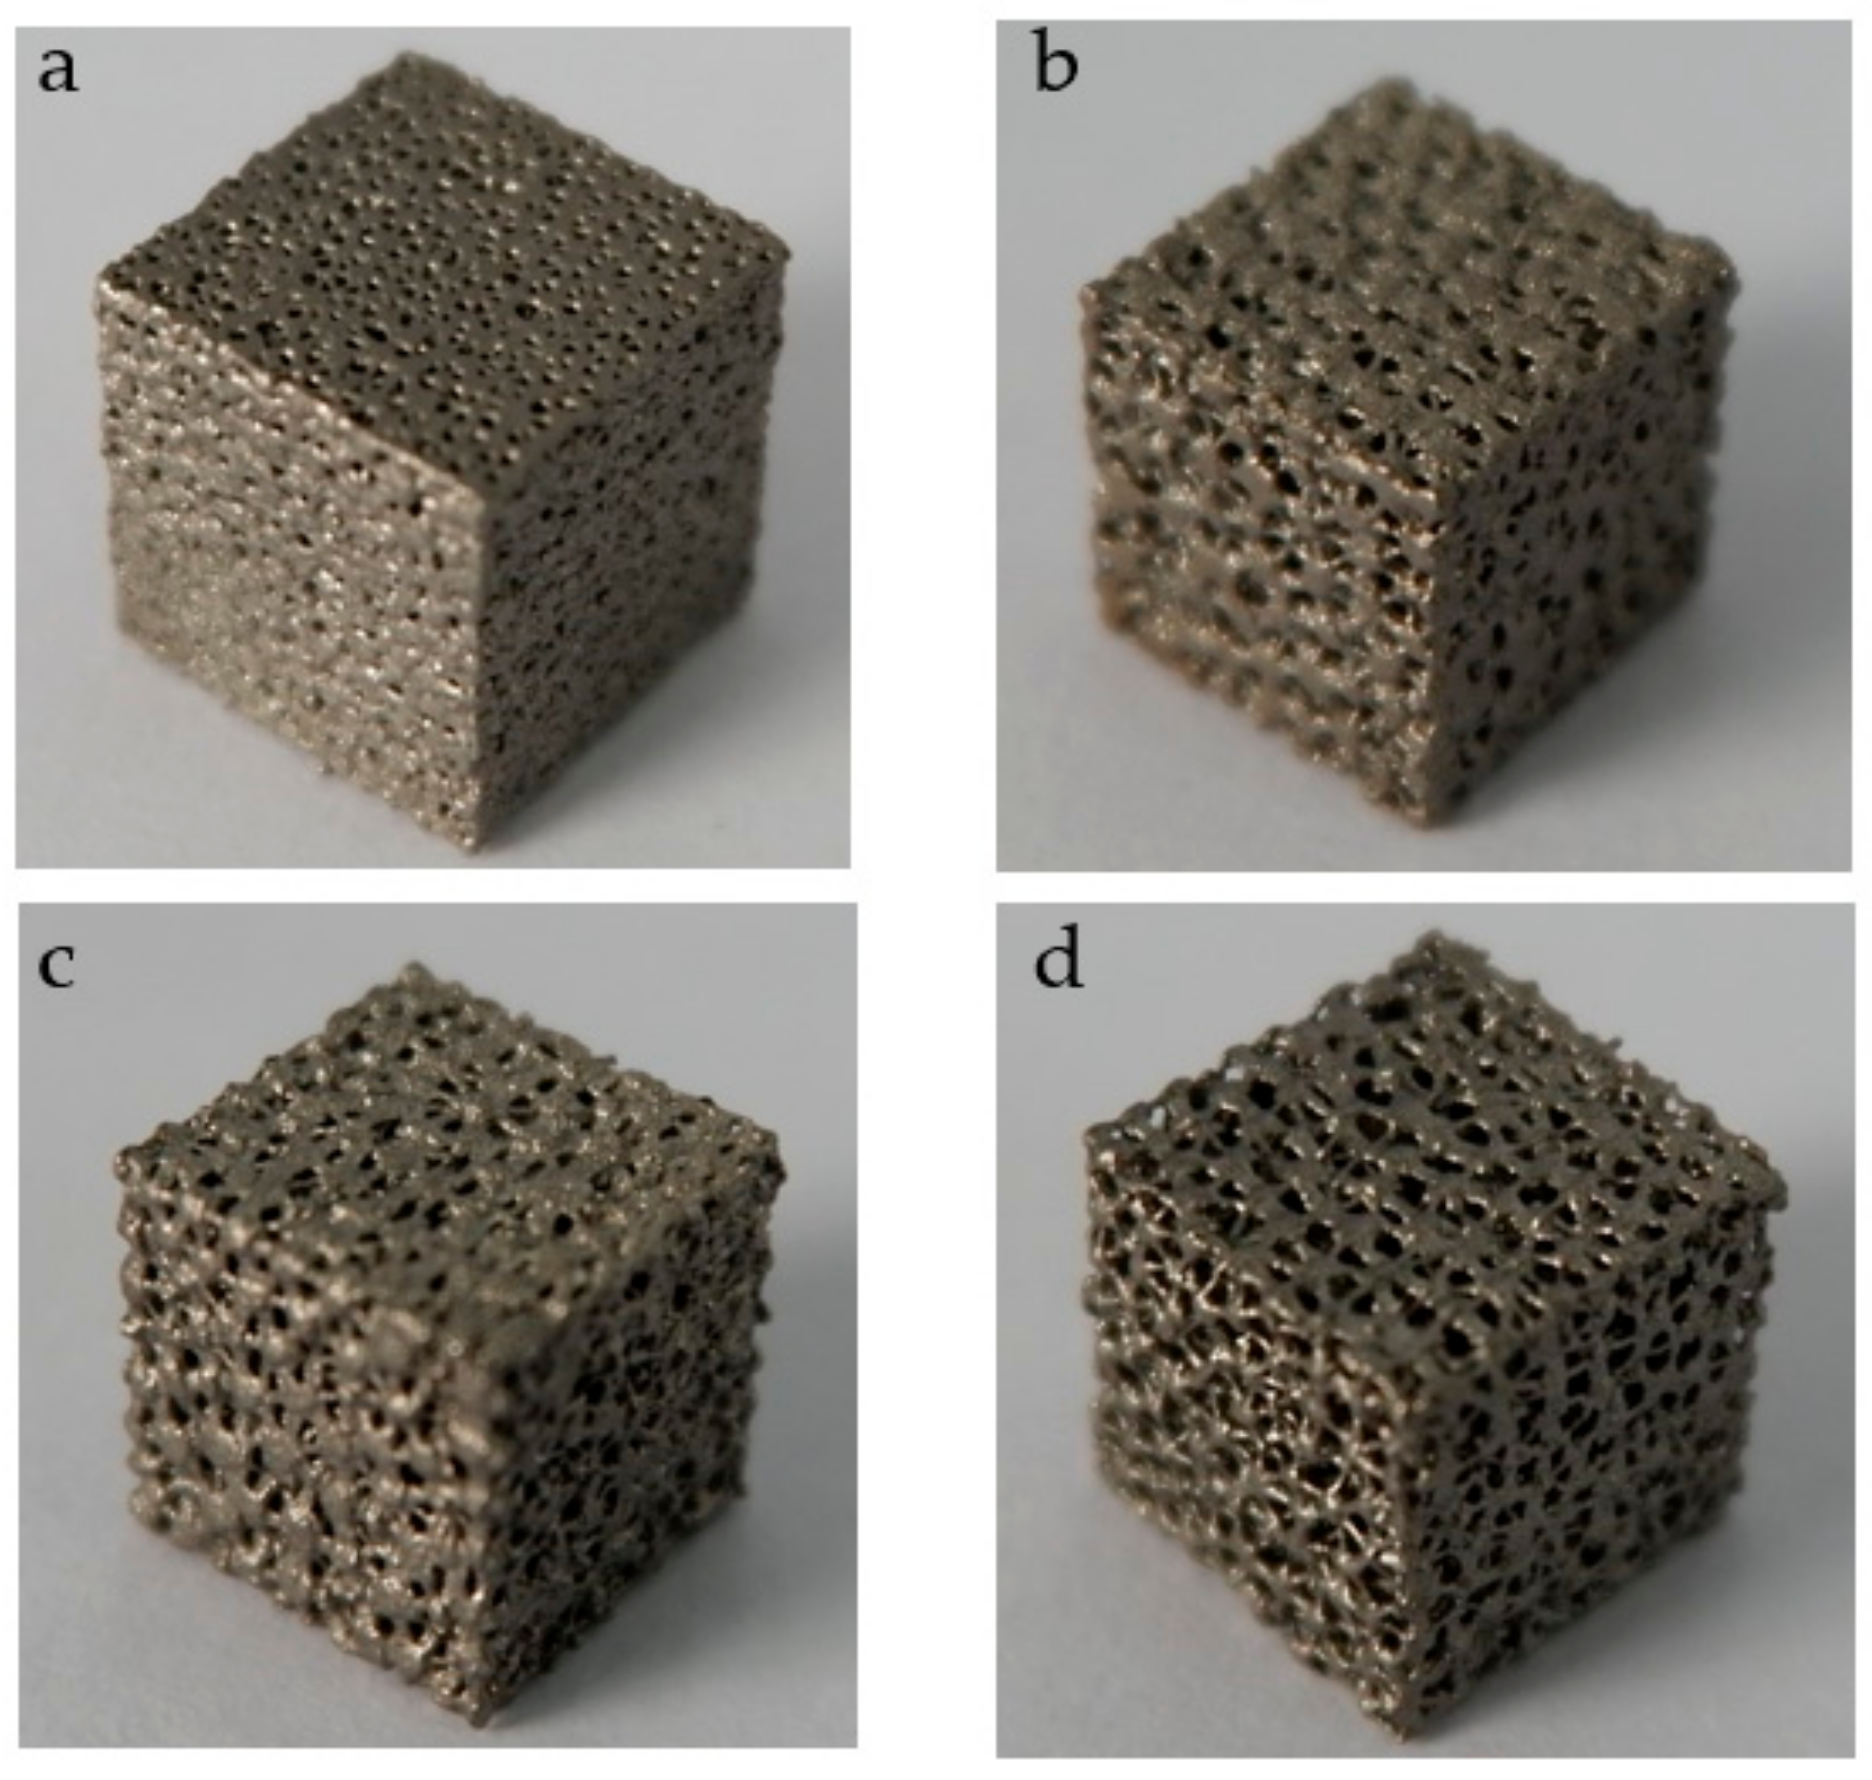
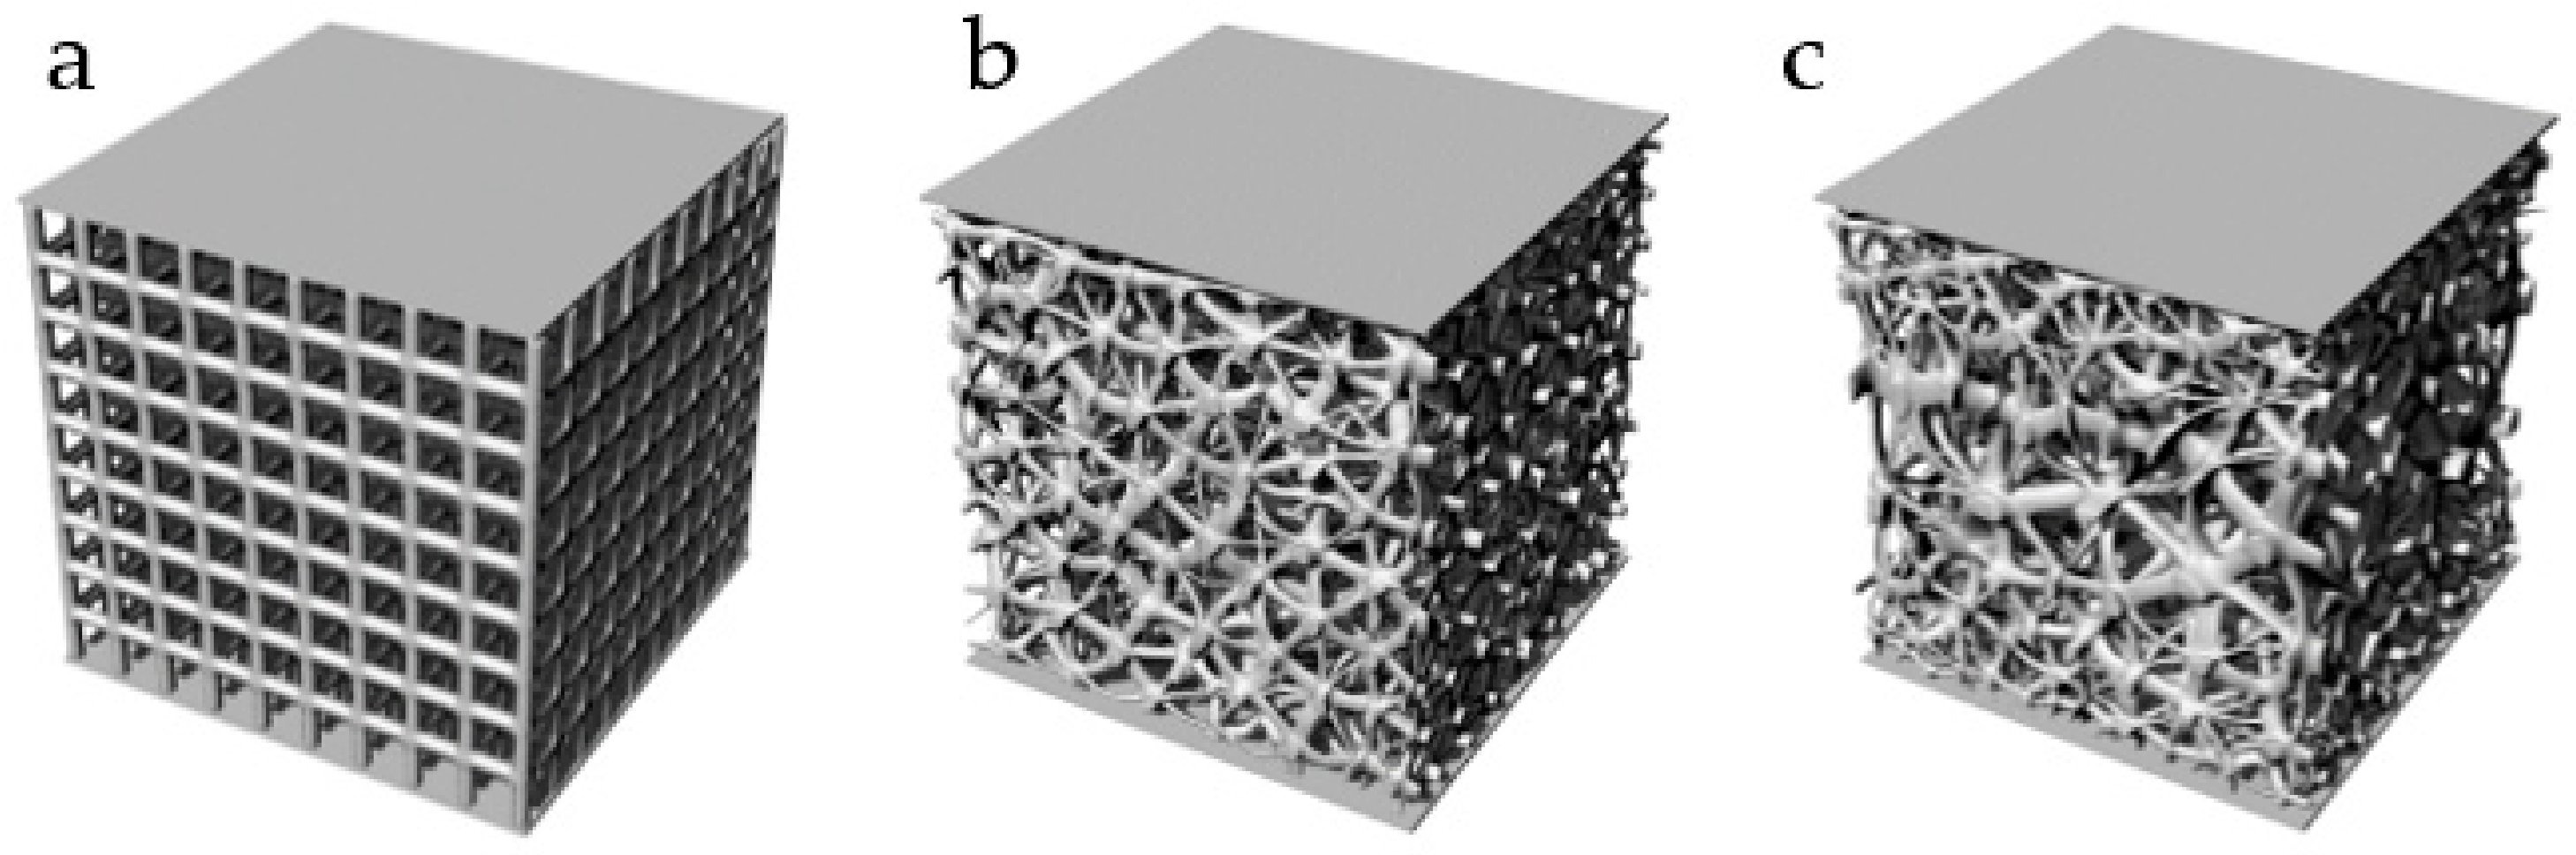
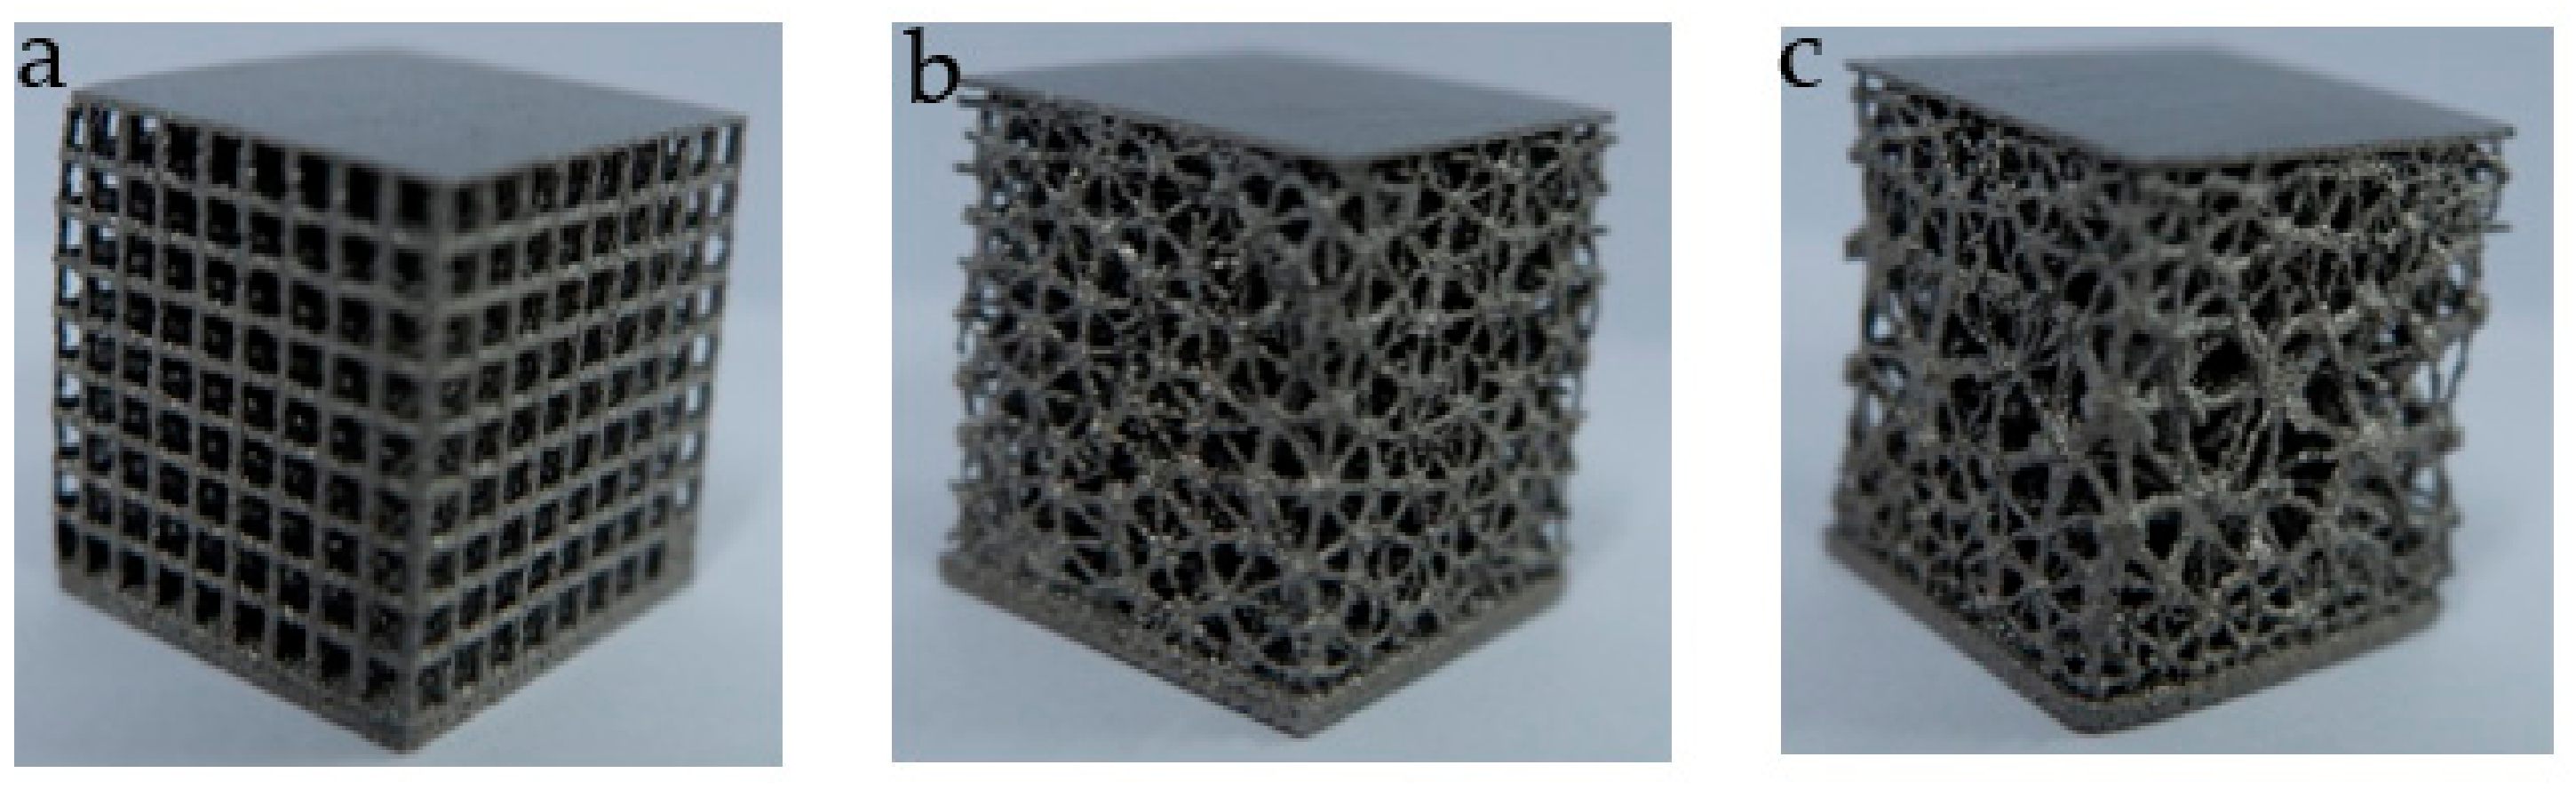
3.2. Additive Manufacturing of Structure
3.3. Stability Performance
3.3.1. FEA of Stability Performance
3.3.2. Experimental Verification of Stability Performance
3.4. Impact Resistance Performance
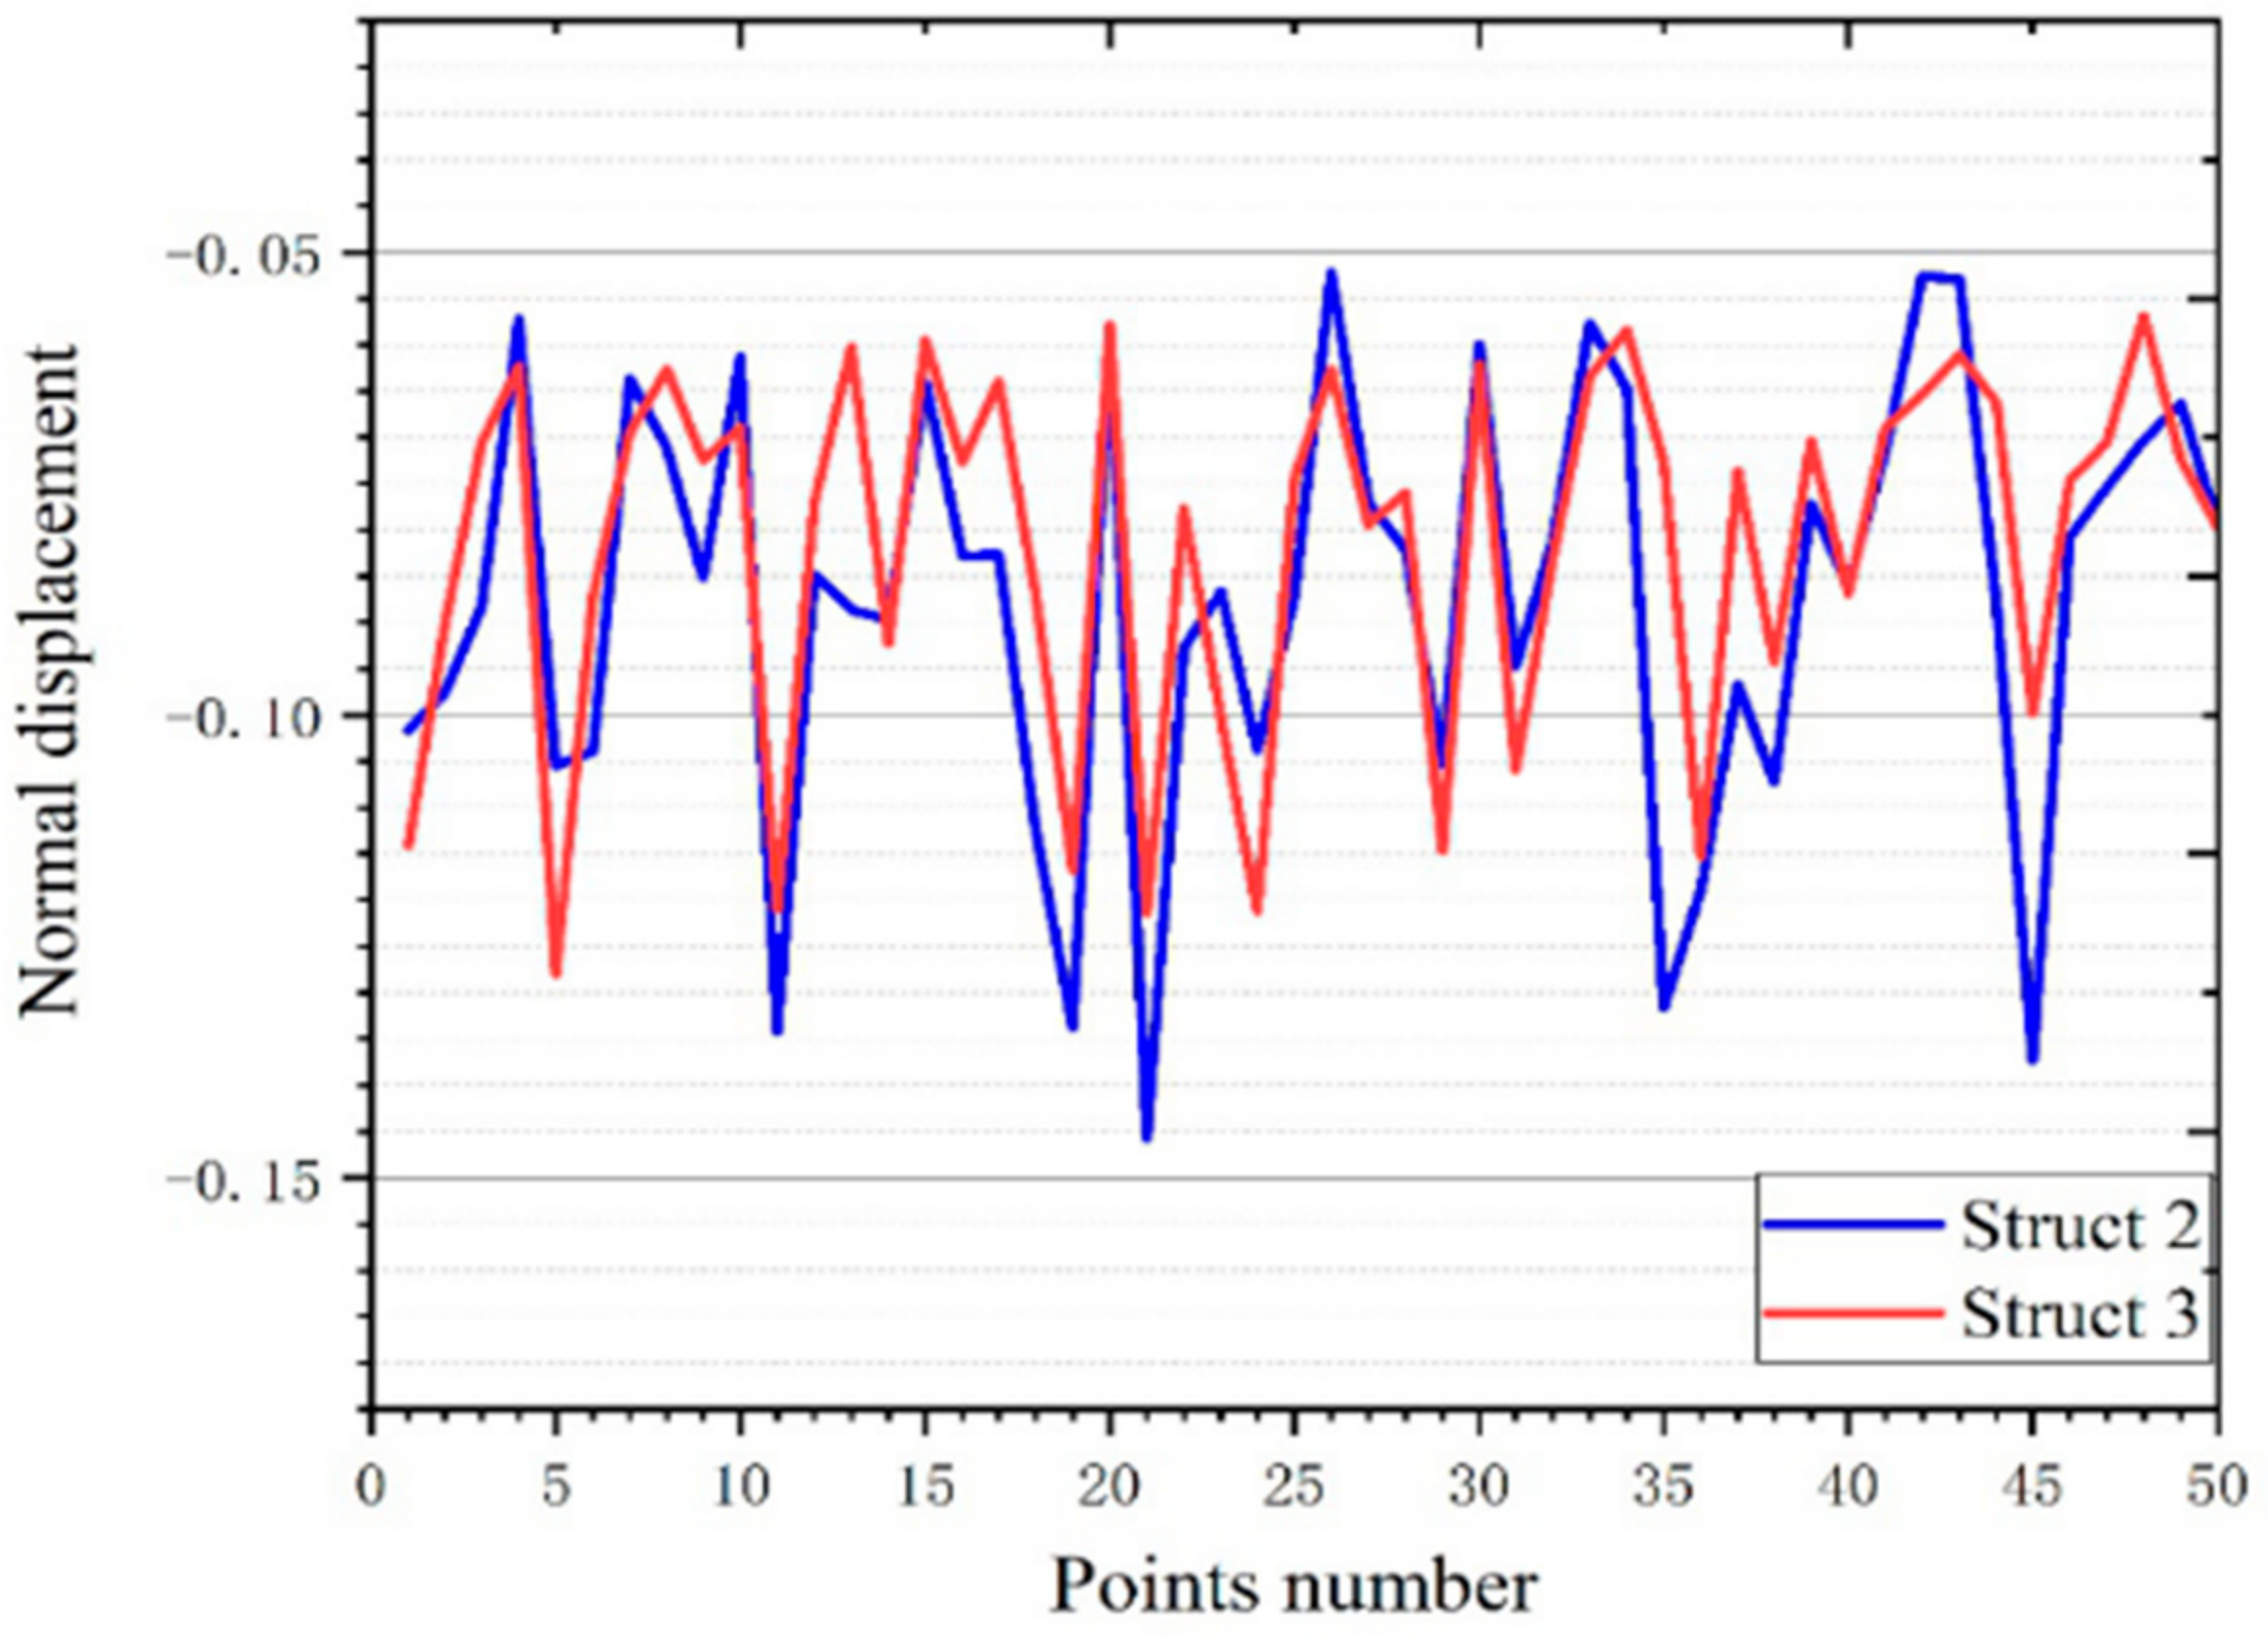
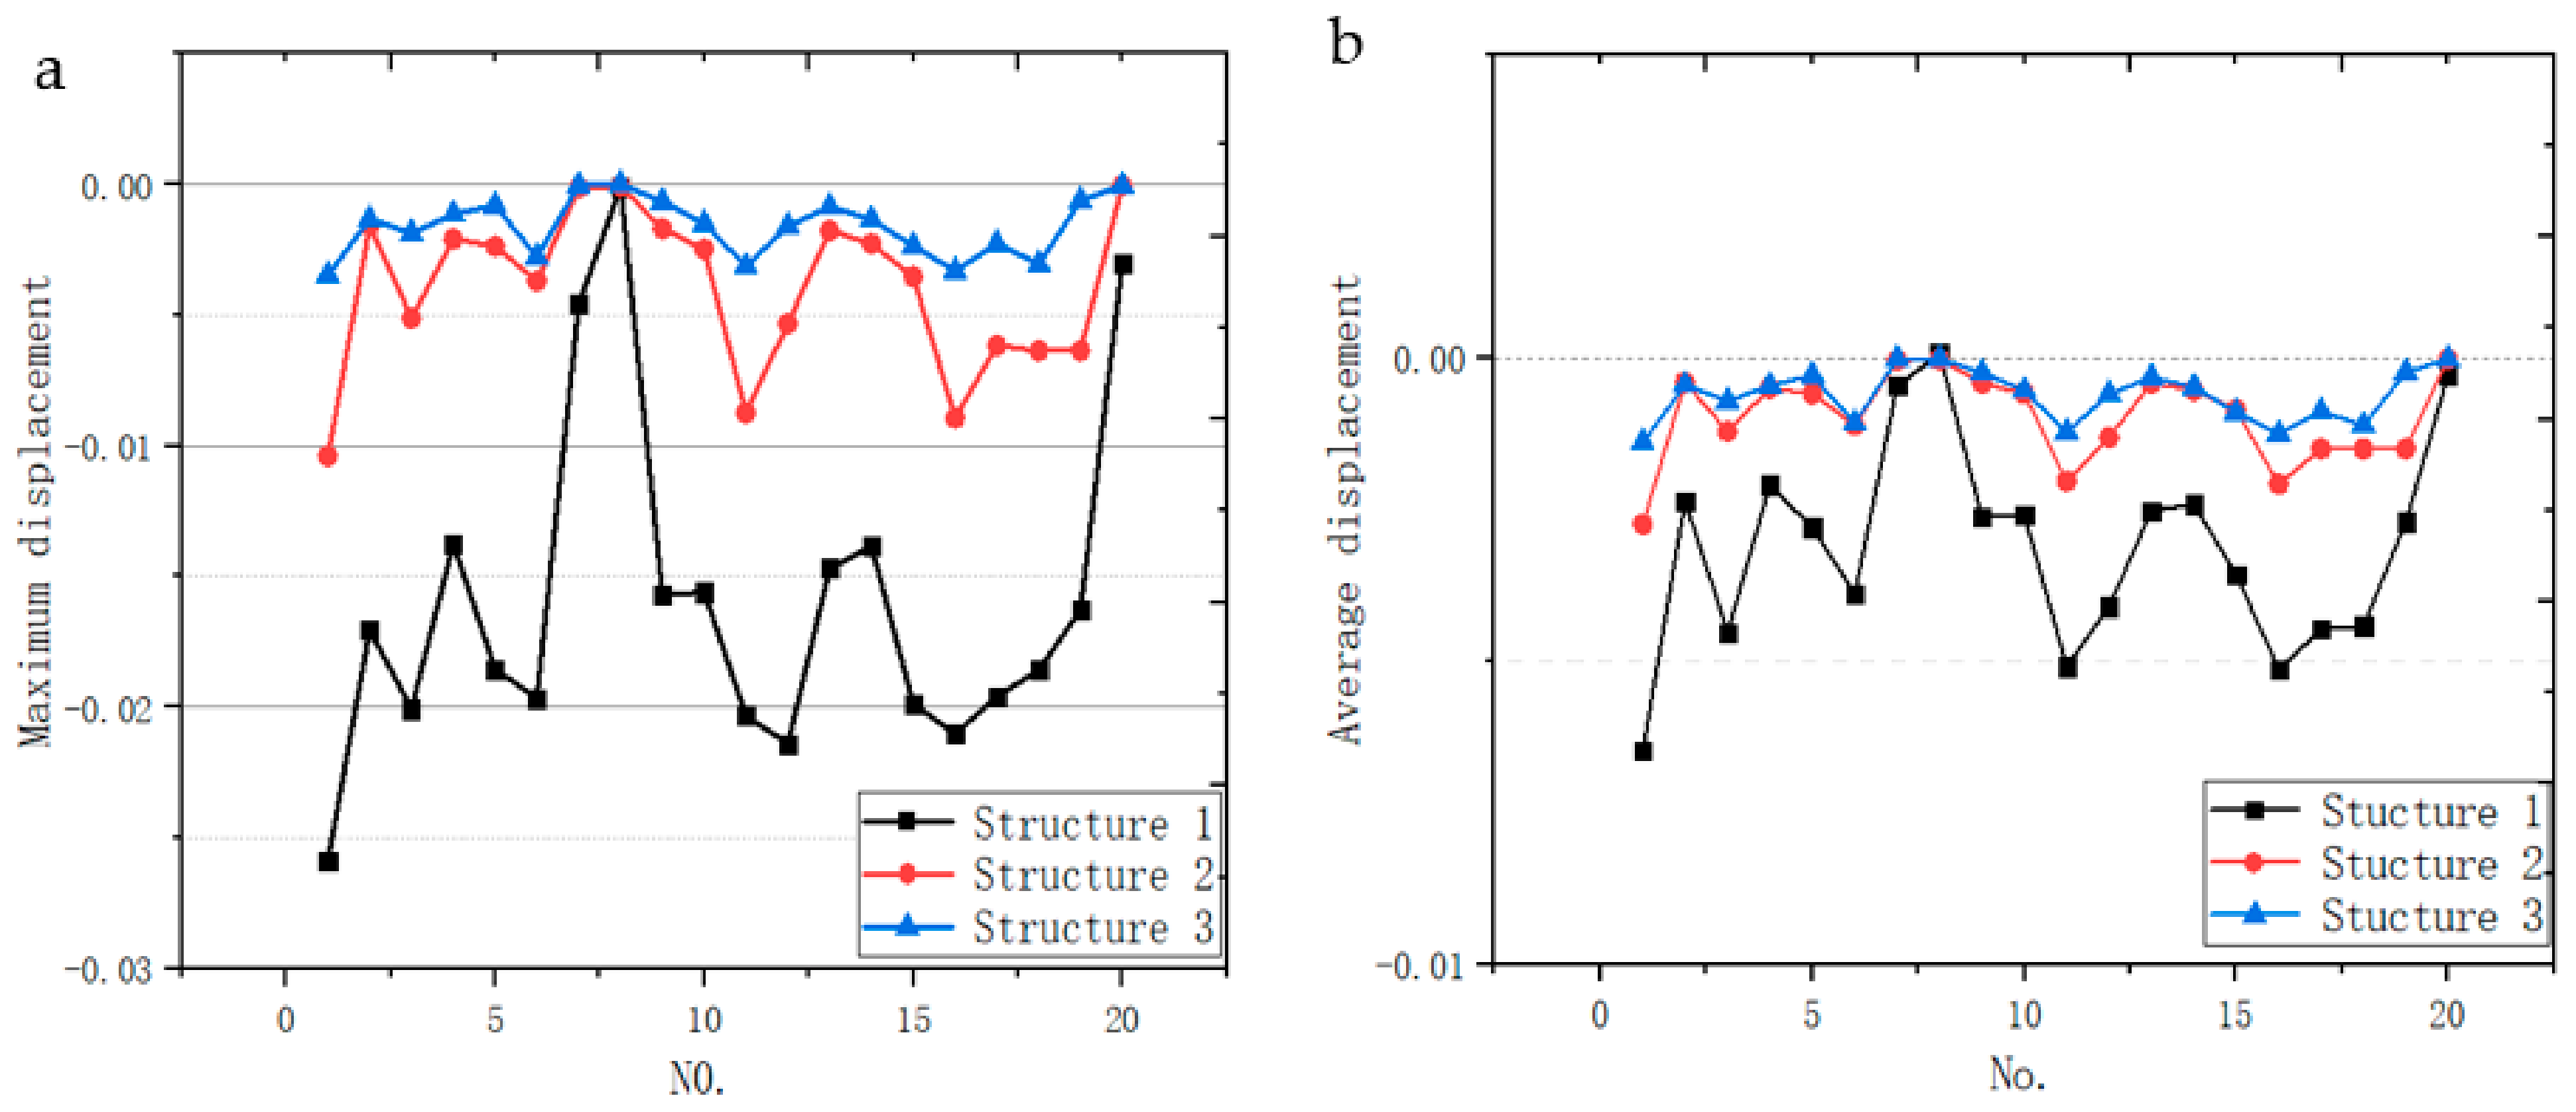
3.4.1. Deformation Displacement
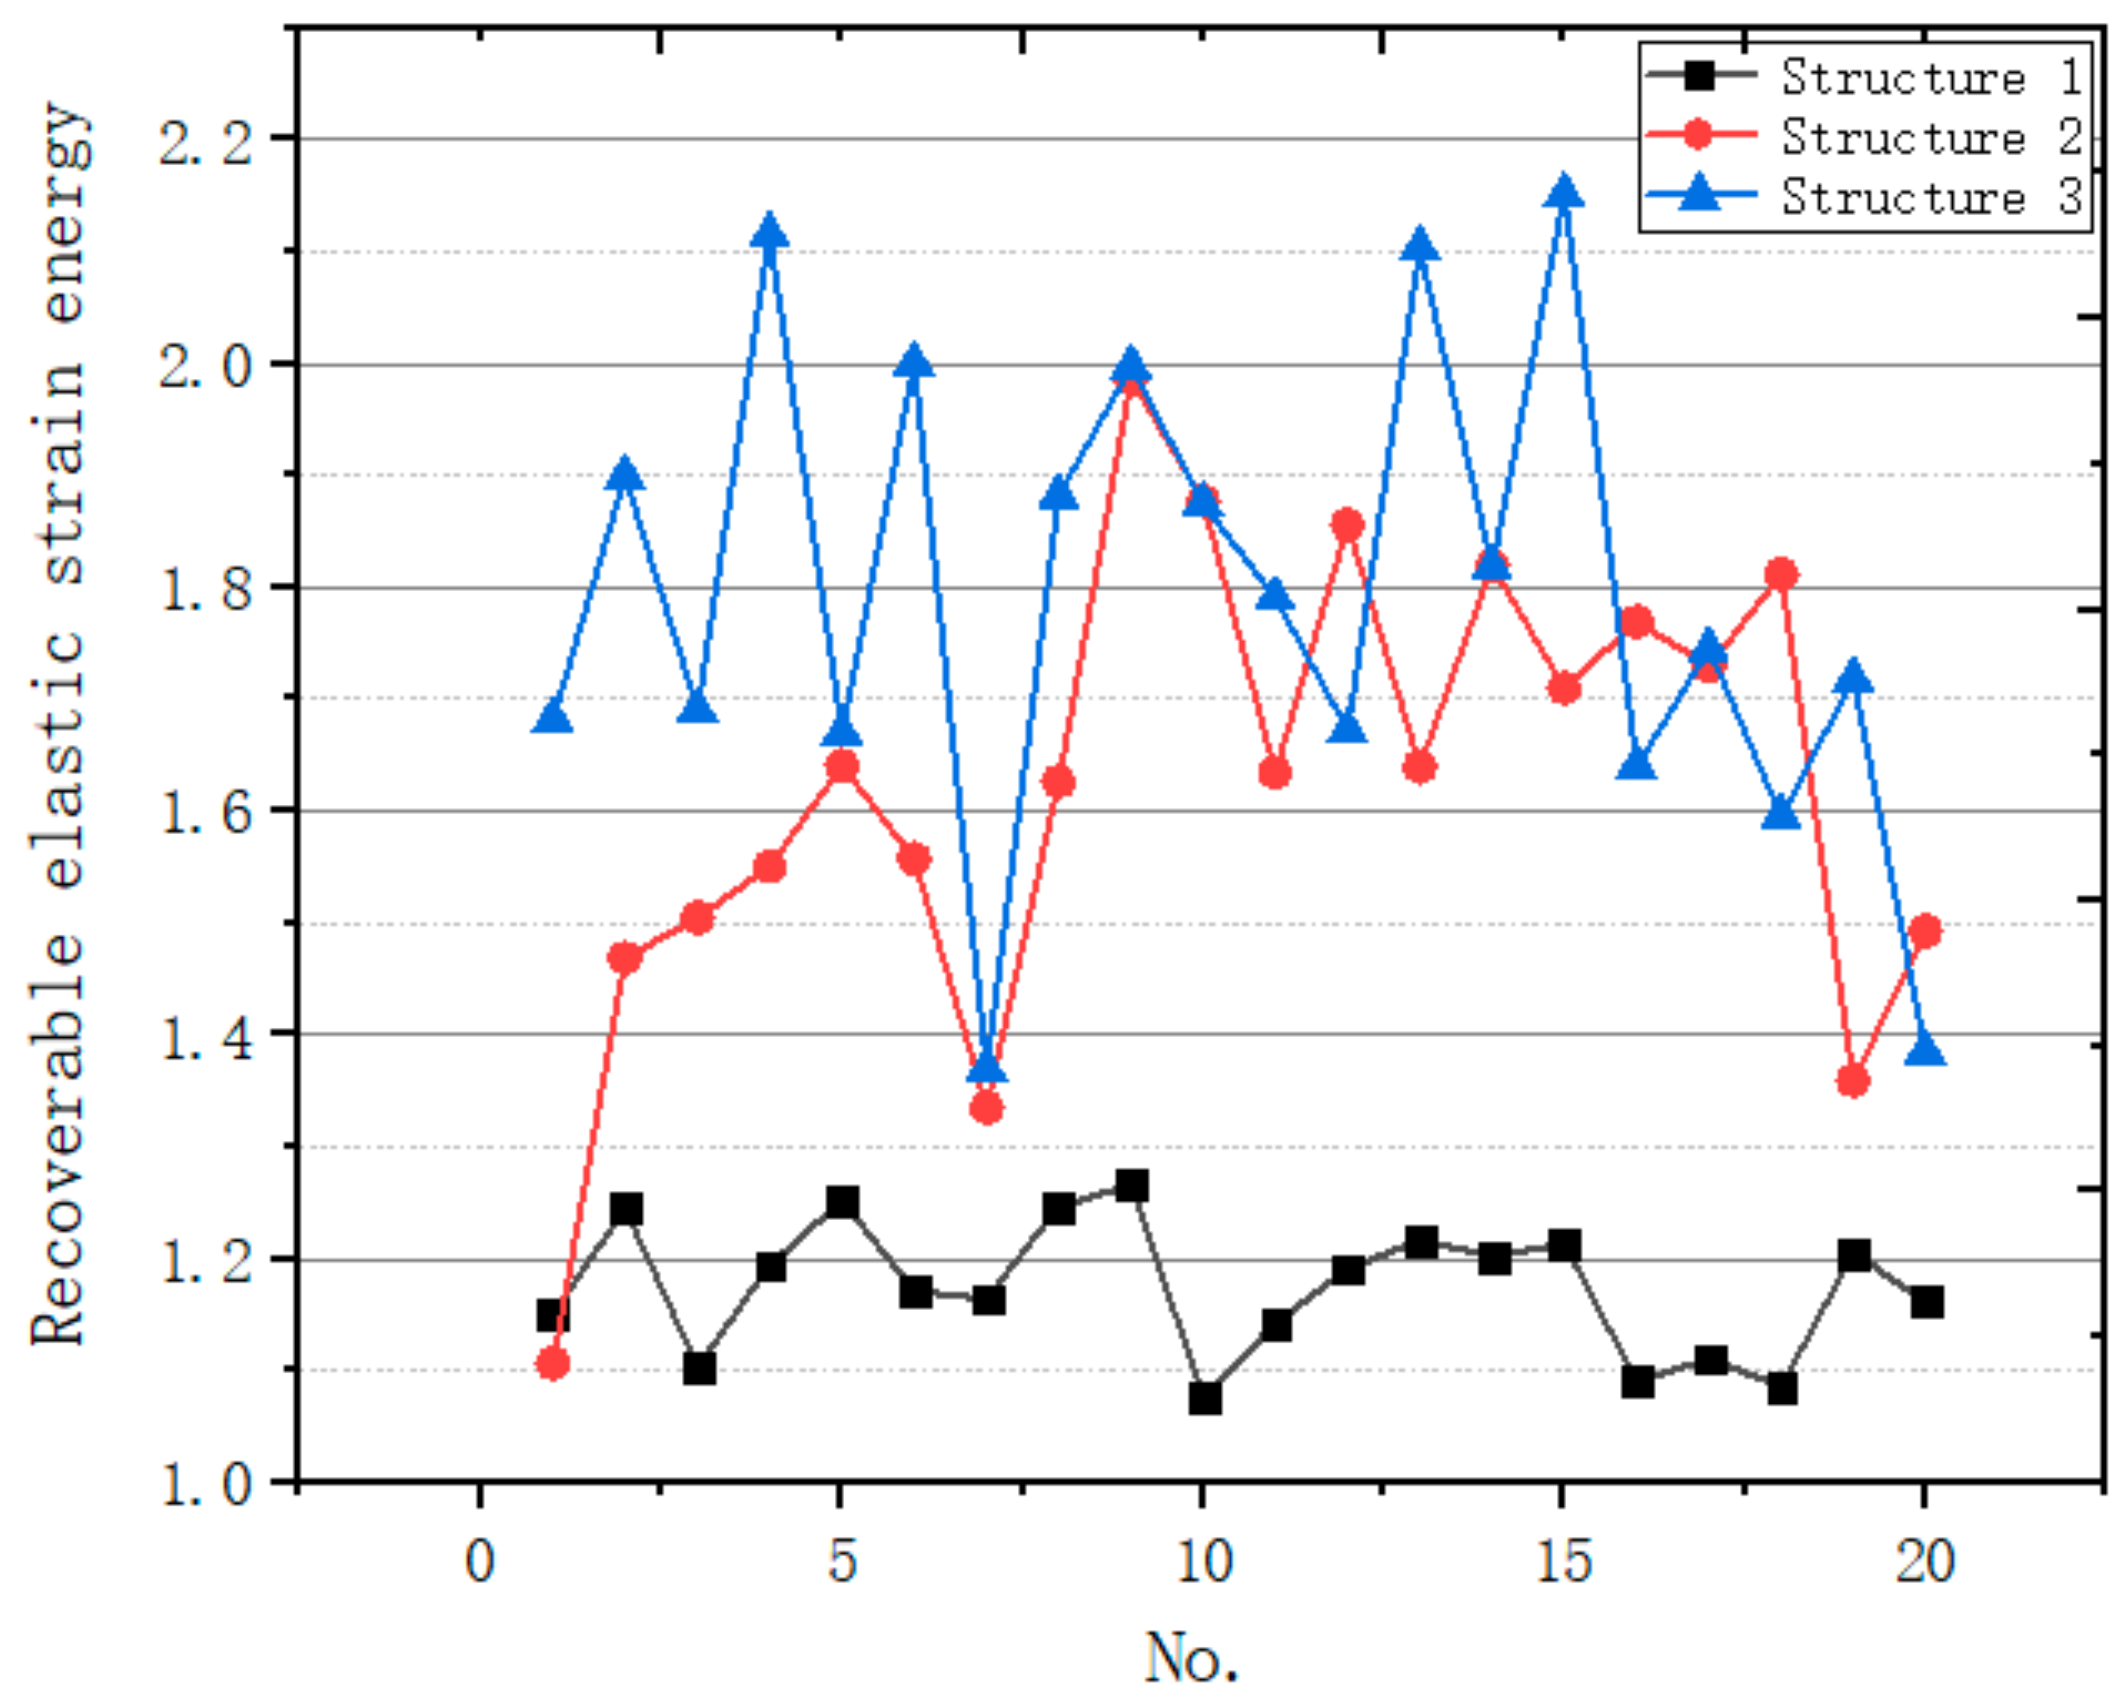
3.4.2. Energy Absorption
4. Conclusions
Author Contributions
Funding
Institutional Review Board Statement
Informed Consent Statement
Data Availability Statement
Acknowledgments
Conflicts of Interest
References
- Leach, J.K.; Mooney, D.J. Development of biocompatible synthetic extracellular matrices for tissue engineering. Trends Biotechnol. 1998, 16, 224. [Google Scholar]
- Borrelli, J.; Prickett, W.D.; Ricci, W.M. Treatment of Nonunions and Osseous Defects with Bone Graft and Calcium Sulfate. Clin. Orthop. Relat. Res. 2003, 411, 245–254. [Google Scholar] [CrossRef] [PubMed]
- Giannitelli, S.M.; Accoto, D.; Trombetta, M.; Rainer, A. Current Trends in the Design of Scaffolds for Computer-Aided Tissue Engineering. Acta Biomater. 2014, 10, 580–594. [Google Scholar] [CrossRef] [PubMed]
- Ferry, P.W.; Neves, M.A.; Travis, J.; Paulo, J. Additive Manufacturing of Tissues and Organs. Prog. Polym. Sci. 2012, 37, 1079–1104. [Google Scholar]
- Bose, S.; Vahabzadeh, S.; Bandyopadhyay, A. Bone Tissue Engineering Using 3D Printing. Mater. Today 2013, 16, 496–504. [Google Scholar] [CrossRef]
- Liu, Y.; Lim, J.; Teoh, S.H. Review: Development of Clinically Relevant Scaffolds for Vascularised Bone Tissue Engineering. Biotechnol. Adv. 2013, 31, 688–705. [Google Scholar] [CrossRef] [PubMed]
- Van Bael, S.; Chai, Y.C.; Truscello, S.; Moesen, M.; Kerckhofs, G.; Van Oosterwyck, H. The Effect of Pore Geometry on the in Vitro Biological Behavior of Human Periosteum-Derived Cells Seeded on Selective Laser-Melted Ti6Al4V Bone Scaffolds. Acta Biomater. 2012, 8, 2824–2834. [Google Scholar] [CrossRef]
- Wang, X.; Xu, S.; Zhou, S.; Xu, W.; Leary, M.; Choong, P.; Qian, M.; Brandt, M.; Xie, Y.M. Topological Design and Additive Manufacturing of Porous Metals for Bone Scaffolds and Orthopaedic Implants: A Review. Biomaterials 2016, 83, 127–141. [Google Scholar] [CrossRef]
- Gibson, L.J. Biomechanics of Cellular Solids. J. Biomech. 2005, 38, 377–399. [Google Scholar] [CrossRef]
- Keaveny, T.M.; Morgan, E.F.; Niebur, G.L.; Yeh, O.C. Biomechanics of Trabecular Bone. Annu. Rev. Biomed. Eng. 2001, 3, 307–333. [Google Scholar] [CrossRef] [PubMed]
- Gómez, S.; Vlad, M.D.; López, J.; Fernández, E. Design and Properties of 3D Scaffolds for Bone Tissue Engineering. Acta Biomater. 2016, 42, 341–350. [Google Scholar] [CrossRef]
- Wubneh, A.; Tsekoura, E.; Ayranci, C.; Uludağ, H. Current State of Fabrication Technologies and Materials for Bone Tissue Engineering. Acta Biomater. 2018, 80, 1–30. [Google Scholar] [CrossRef] [PubMed]
- Ryan, G.; Pandit, A.; Apatsidis, D.P. Fabrication Methods of Porous Metals for Use in Orthopaedic Applications. Biomaterials 2006, 27, 2651–2670. [Google Scholar] [CrossRef] [PubMed]
- Shi, J.; Liang, H.; Jiang, J.; Tang, W.; Yang, J. Design and Performance Evaluation of Porous Titanium Alloy Structures for Bone Implantation. Math. Probl. Eng. 2019, 2019, 5268280. [Google Scholar] [CrossRef]
- Xiao, F.; Yin, X. Geometry Models of Porous Media Based on Voronoi Tessellations and Their Porosity-Permeability Relations. Comput. Math. Appl. 2016, 72, 328–348. [Google Scholar] [CrossRef]
- Arabnejad, S.; Johnston, B.; Tanzer, M.; Pasini, D. Fully porous 3d printed titanium femoral stem to reduce stress-shielding following total hip arthroplasty. J. Orthop. Res. 2017, 35, 1774–1783. [Google Scholar] [CrossRef]
- Nappi, F.; Carotenuto, A.R.; Di Vito, D.; Spadaccio, C.; Acar, C.; Fraldi, M. Stress-shielding, growth and remodeling of pulmonary artery reinforced with copolymer scaffold and transposed into aortic position. Biomech. Model. Mechanobiol. 2016, 15, 1141–1157. [Google Scholar] [CrossRef] [PubMed]
- Wang, G.; Shen, L.; Zhao, J.; Liang, H.; Xie, D.; Tian, Z.; Wang, C. Design and Compressive Behavior of Controllable Irregular Porous Scaffolds: Based on Voronoi-Tessellation and for Additive Manufacturing. ACS Biomater. Sci. Eng. 2018, 4, 719–727. [Google Scholar] [CrossRef] [PubMed]
- Du, Y.; Liang, H.; Xie, D.; Mao, N.; Zhao, J.; Tian, Z.; Wang, C.; Shen, L. Design and statistical analysis of irregular porous scaffolds for orthopedic reconstruction based on voronoi tessellation and fabricated via selective laser melting (SLM). Mater. Chem. Phys. 2020, 239, 121968. [Google Scholar] [CrossRef]
- Afewerki, S.; Bassous, N.; Harb, S.; Palo-Nieto, C.; Ruiz-esparza, G.U.; Marciano, F.R.; Webster, T.J.; Sales, A.; Furtado, A.; Anderson, O. Advances in Dual Functional Antimicrobial and Osteoinductive Biomaterials for Orthopedic Applications. Nanomed. Nanotechnol. Biol. Med. 2019, 24, 102143. [Google Scholar] [CrossRef]
- Zhang, L.; Yang, G.; Johnson, B.N.; Jia, X. Acta Biomaterialia Three-Dimensional (3D) Printed Scaffold and Material Selection for Bone Repair. Acta Biomater. 2019, 84, 16–33. [Google Scholar] [CrossRef]
- Bandyopadhyay, A.; Espana, F.; Balla, V.K.; Bose, S.; Ohgami, Y.; Davies, N.M. Influence of Porosity on Mechanical Properties and in Vivo Response of Ti6Al4V Implants. Acta Biomater. 2010, 6, 1640–1648. [Google Scholar] [CrossRef]
- Bing, L.; Yoda, N.; Sato, E.; Shigemitsu, R. Effect of Peri-Implant Bone Resorption on Mechanical Stress in the Implant Body: In Vivo Measured Load-Based Finite Element Analysis. J. Oral Rehabil. 2020, 47, 1566–1573. [Google Scholar] [CrossRef]
- Woiczinski, M.; Steinbrück, A.; Weber, P.; Müller, P.E.; Jansson, V.; Schröder, C.; Steinbrück, A.; Weber, P.; Müller, P.E.; Jansson, V. Engineering Development and Validation of a Weight-Bearing Finite Element Model for Total Knee Replacement. Comput. Methods Biomech. Biomed. Eng. 2016, 19, 1033–1045. [Google Scholar] [CrossRef] [PubMed]
- Ping, H.; Hui-min, Z.; Bo, C.; Jin, Q.; Nian-dong, Q.; Lian-fu, D.; Hospital, S.R. Three-dimensional gait analysis in normal young adults: Temporal, kinematic and mechanical parameters. J. Clin. Rehabil. Tissue Eng. Res. 2015, 24, 3882–3888. [Google Scholar]
- Fu, W.; Fang, Y.; Liu, D.M.S.; Wang, L.; Ren, S.; Liu, Y. Surface effects on in-shoe plantar pressure and tibial impact during running. J. Sport Health Sci. 2015, 4, 384–390. [Google Scholar] [CrossRef]
- Wang, M.; Yang, N. Three-Dimensional Computational Model Simulating the Fracture Healing Process with Both Biphasic Poroelastic Finite Element Analysis and Fuzzy Logic Control. Sci. Rep. 2018, 8, 6744. [Google Scholar] [CrossRef] [PubMed]
- Wang, M.; Yang, N.; Wang, X. A Review of Computational Models of Bone Fracture Healing. Med. Biol. Eng. Comput. 2017, 55, 1–20. [Google Scholar] [CrossRef] [PubMed]
- Epari, D.R.; Taylor, W.R.; Heller, M.O.; Duda, G.N. Mechanical Conditions in the Initial Phase of Bone Healing. Clin. Biomech. 2006, 21, 646–655. [Google Scholar] [CrossRef]


| No. | Coordinate | No. | Coordinate | No. | Coordinate |
|---|---|---|---|---|---|
| 1 | {4.168322, 0.018732} | 21 | {4.168322, 0.018732} | 41 | {2.847754, 3.846355} |
| 2 | {1.916102, 4.356278} | 22 | {1.916102, 4.356278} | 42 | {1.924213, 2.023893} |
| 3 | {4.761867, 0.12438} | 23 | {4.761867, 0.12438} | 43 | {2.860703, 2.517847} |
| 4 | {0.1905, 0.236104} | 24 | {0.1905, 0.236104} | 44 | {4.053635, 0.474514} |
| 5 | {4.624188, 4.534302} | 25 | {4.624188, 4.534302} | 45 | {0.137717, 3.099845} |
| 6 | {2.710723, 1.68053} | 26 | {2.710723, 1.68053} | 46 | {4.858988, 1.457464} |
| 7 | {4.655686, 2.465611} | 27 | {4.655686, 2.465611} | 47 | {2.986517, 0.852671} |
| 8 | {0.770162, 2.565942} | 28 | {0.770162, 2.565942} | 48 | {3.85815, 2.217037} |
| 9 | {2.10183, 0.251383} | 29 | {2.10183, 0.251383} | 49 | {0.999095, 1.950896} |
| 10 | {3.299956, 3.113036} | 30 | {3.299956, 3.113036} | 50 | {1.845819, 1.070618} |
| 11 | {0.094996, 1.382577} | 31 | {3.256359, 4.662494} | ||
| 12 | {3.948792, 4.156852} | 32 | {1.130099, 1.30636} | ||
| 13 | {3.597641, 0.589451} | 33 | {1.977037, 2.874706} | ||
| 14 | {2.211046, 0.441559} | 34 | {4.014768, 1.36867} | ||
| 15 | {3.329278, 2.313848} | 35 | {3.4652, 0.079034} | ||
| 16 | {2.538373, 4.098269} | 36 | {0.085785, 1.639095} | ||
| 17 | {1.416367, 3.189073} | 37 | {0.755195, 3.747541} | ||
| 18 | {0.322663, 3.78601} | 38 | {4.63717, 3.476797} | ||
| 19 | {4.939515, 3.423519} | 39 | {3.847277, 3.762397} | ||
| 20 | {3.980097, 1.554705} | 40 | {0.909925, 4.59761} |
| No. | Coordinates | No. | Coordinates |
|---|---|---|---|
| 1 | {2.496821,2.501216,0} | 11 | {1.840198, 2.191361, 0} |
| 2 | {1.012634,1.123176,0} | 12 | {3.518079, 3.569665, 0} |
| 3 | {2.100246,3.506155,0} | 13 | {0.706907, 3.262782, 0} |
| 4 | {4.402913,1.523841,0} | 14 | {0.647487, 1.881901, 0} |
| 5 | {3.799921,4.100211,0} | 15 | {4.083439, 2.707272, 0} |
| 6 | {3.855469, 2.020813, 0} | 16 | {2.280039, 1.804911, 0} |
| 7 | {0.366727, 4.477109, 0} | 17 | {3.493572, 3.065361, 0} |
| 8 | {4.877725, 4.826198, 0} | 18 | {3.086525, 1.606976, 0} |
| 9 | {2.460168, 4.462378, 0} | 19 | {1.582868, 4.209732, 0} |
| 10 | {2.547036, 0.568136, 0} | 20 | {4.69689, 0.445073, 0} |
| V (mm3) | 8 | 27 | 64 | 125 | 216 |
|---|---|---|---|---|---|
| N | 191 | 645 | 1528 | 2985 | 5157 |
| F | 0.2766 | 0.275 | 0.274 | 0.2736 | 0.2732 |
| P | 80.003% | 80.005% | 79.998% | 80.004% | 79.998% |
| r | 0.199998 | 0.19996 | 0.199993 | 0.199984 | 0.199993 |
| Structure | a | b | c | d |
|---|---|---|---|---|
| P | 40% | 40% | 50% | 60% |
| r (mm) | 0.3 | 0.5 | 0.5 | 0.5 |
| Volume (mm3) | Quality (10–5 kg) | Average Displacement (mm) | Variance | |
|---|---|---|---|---|
| Structure 1 | 13.30 | 5.89 | −0.14016 | 0.005063 |
| Structure 2 | 13.30 | 5.89 | −0.08699 | 0.000541 |
| Structure 3 | 13.30 | 5.89 | −0.08127 | 0.000403 |
| Structures | Mean Value (μm) | Variance Value |
|---|---|---|
| Irregular porous structure | 4.526667 | 0.178685 |
| Regular porous structure | 4.505 | 0.203792 |
| Gradient irregular porous structure | 4.406238 | 0.111739 |
| No. | Max Displacements | Ave Displacements | ||||
|---|---|---|---|---|---|---|
| Structure 1 | Structure 2 | Structure 3 | Structure 1 | Structure 2 | Structure 3 | |
| 1 | −0.025865313 | −0.010407655 | −0.00349243 | −0.006474 | −0.002738 | −0.001383 |
| 2 | −0.017054364 | −0.001593933 | −0.00134111 | −0.002355 | −0.000394 | −0.000438 |
| 3 | −0.02006232 | −0.005133115 | −0.00187291 | −0.004522 | −0.001203 | −0.000708 |
| 4 | −0.013765119 | −0.002104803 | −0.00115216 | −0.002092 | −0.000498 | −0.000448 |
| 5 | −0.018555669 | −0.002373617 | −0.00081490 | −0.002789 | −0.000586 | −0.000278 |
| 6 | −0.019666893 | −0.003702455 | −0.00278609 | −0.003882 | −0.001011 | −0.001074 |
| 7 | −0.004564771 | −0.000147287 | −4.5075 × 10⁻⁸ | −0.000454 | −3.2 × 10⁻⁵ | −1.4 × 10⁻⁵ |
| 8 | −0.000111257 | −9.33554 × 10⁻⁵ | −1.6733 × 10⁻⁸ | −7.2 × 10⁻⁵ | −2.2 × 10⁻⁵ | −8.00 × 10⁻⁵ |
| 9 | −0.015718957 | −0.001704743 | −0.00067792 | −0.002621 | −0.000411 | −0.000238 |
| 10 | −0.01560978 | −0.002497677 | −0.00150531 | −0.002576 | −0.000581 | −0.000531 |
| 11 | −0.020331565 | −0.008744049 | −0.00314237 | −0.005078 | −0.002024 | −0.001216 |
| 12 | −0.021405157 | −0.005330172 | −0.00161022 | −0.004096 | −0.001302 | −0.000592 |
| 13 | −0.014698667 | −0.001771639 | −0.00086958 | −0.002514 | −0.000412 | −0.000316 |
| 14 | −0.013848106 | −0.002285997 | −0.00134816 | −0.002408 | −0.000528 | −0.000476 |
| 15 | −0.019885683 | −0.003542745 | −0.00236954 | −0.003574 | −0.000854 | −0.000891 |
| 16 | −0.021027157 | −0.008946069 | −0.00331503 | −0.005126 | −0.002074 | −0.001246 |
| 17 | −0.019596884 | −0.006173599 | −0.00227502 | −0.004471 | −0.001495 | −0.000874 |
| 18 | −0.018581722 | −0.006368216 | −0.00305709 | −0.004416 | −0.006368 | −0.001102 |
| 19 | −0.016262516 | −0.006368216 | −0.00063789 | −0.002713 | −0.003461 | −0.000228 |
| 20 | −0.003053466 | −5.70507 × 10⁻⁵ | −4.6086 × 10⁻⁵ | −0.000266 | −1.3578 × 10⁻⁵ | −1.434 × 10⁻⁵ |
Publisher’s Note: MDPI stays neutral with regard to jurisdictional claims in published maps and institutional affiliations. |
© 2021 by the authors. Licensee MDPI, Basel, Switzerland. This article is an open access article distributed under the terms and conditions of the Creative Commons Attribution (CC BY) license (https://creativecommons.org/licenses/by/4.0/).
Share and Cite
Zhao, H.; Han, Y.; Pan, C.; Yang, D.; Wang, H.; Wang, T.; Zeng, X.; Su, P. Design and Mechanical Properties Verification of Gradient Voronoi Scaffold for Bone Tissue Engineering. Micromachines 2021, 12, 664. https://doi.org/10.3390/mi12060664
Zhao H, Han Y, Pan C, Yang D, Wang H, Wang T, Zeng X, Su P. Design and Mechanical Properties Verification of Gradient Voronoi Scaffold for Bone Tissue Engineering. Micromachines. 2021; 12(6):664. https://doi.org/10.3390/mi12060664
Chicago/Turabian StyleZhao, Haiyuan, Yafeng Han, Chen Pan, Ding Yang, Haotian Wang, Tingyu Wang, Xinyun Zeng, and Penglei Su. 2021. "Design and Mechanical Properties Verification of Gradient Voronoi Scaffold for Bone Tissue Engineering" Micromachines 12, no. 6: 664. https://doi.org/10.3390/mi12060664
APA StyleZhao, H., Han, Y., Pan, C., Yang, D., Wang, H., Wang, T., Zeng, X., & Su, P. (2021). Design and Mechanical Properties Verification of Gradient Voronoi Scaffold for Bone Tissue Engineering. Micromachines, 12(6), 664. https://doi.org/10.3390/mi12060664