Numerical Simulation of Effect of Different Initial Morphologies on Melt Hydrodynamics in Laser Polishing of Ti6Al4V
Abstract
1. Introduction
2. Numerical Simulation
2.1. Governing Equations
- (a)
- The property of fluid phase fluid is treated as incompressible Newtonian laminar flow.
- (b)
- The material distribution satisfies continuity and isotropy.
- (c)
- The laser incident energy is considered as the surface heat flux.
- (d)
- Due to the ratio of the density of the liquid Ti6Al4V and the dynamic viscosity argon gas of is large, the influence of gas flow on the free surface evolution can be neglected.
2.2. Model Geometry
2.3. Boundary Conditions
- (1)
- Heat transfer boundary condition
- (2)
- Momentum boundary condition
- (3)
- Free surface boundary condition
2.4. Laser Moving Heat Source
2.5. Moving Mesh
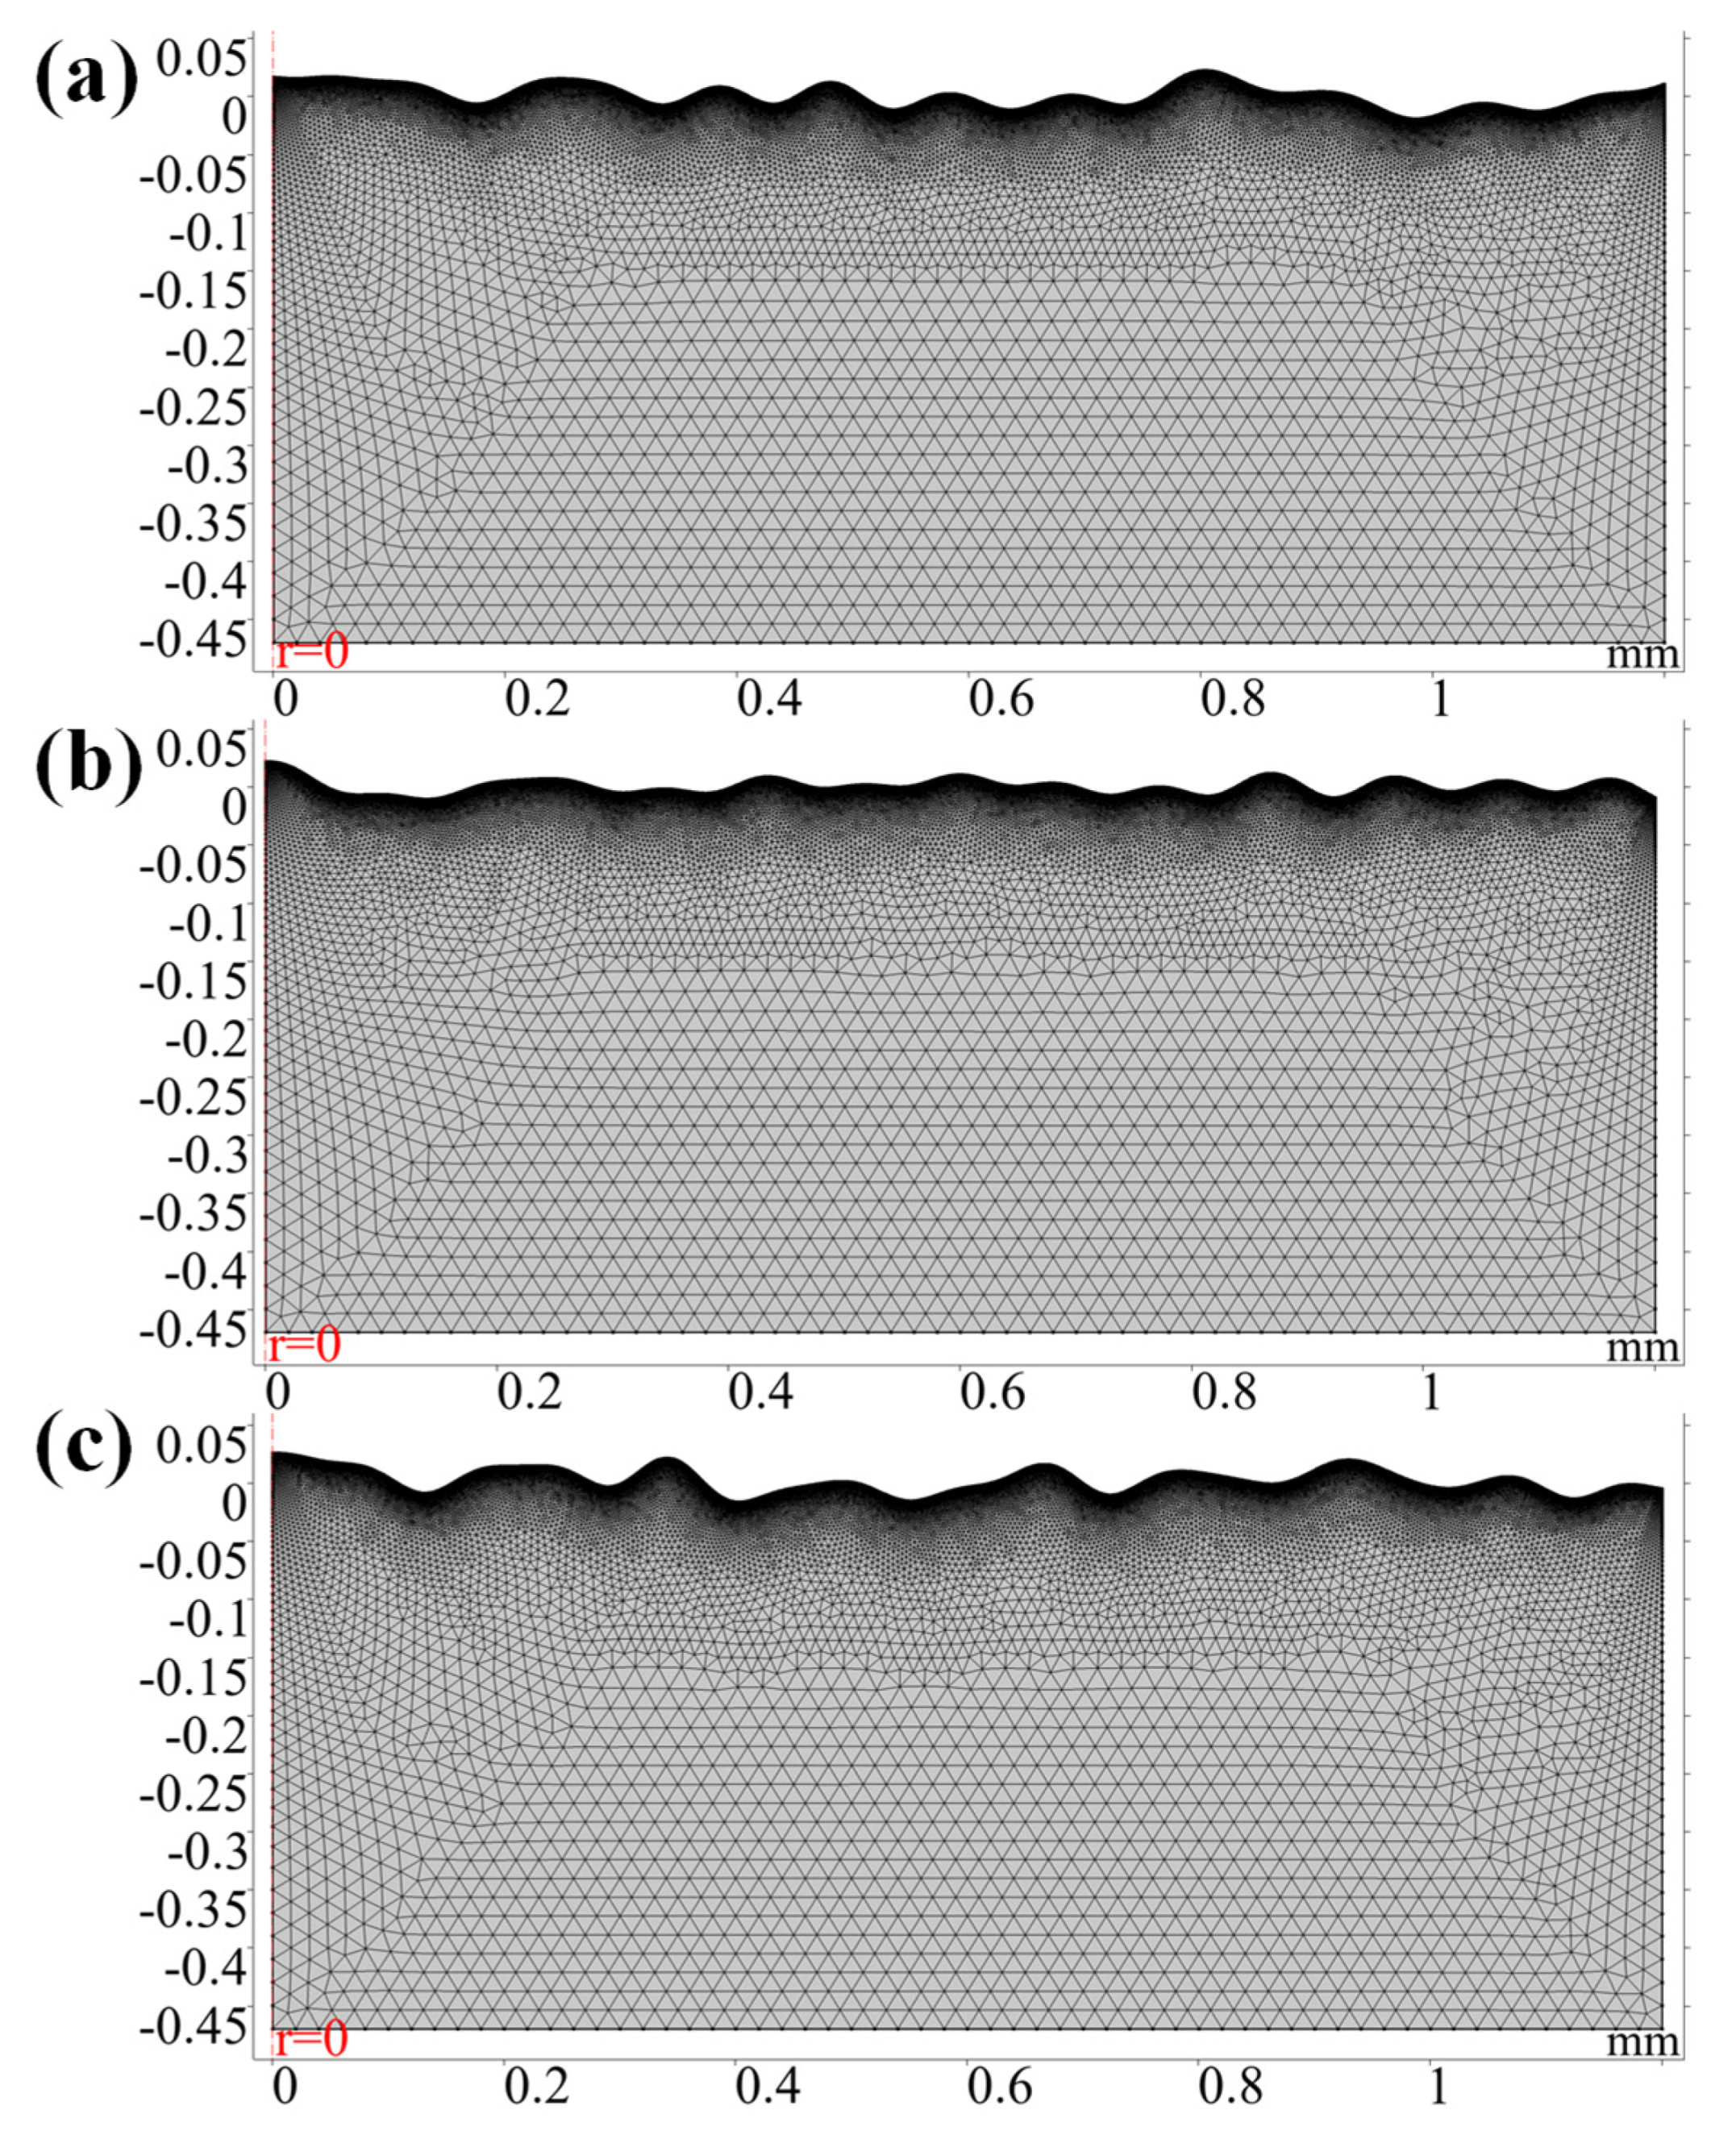
2.6. Mesh and Configurations
3. Experimental Setup and Methods
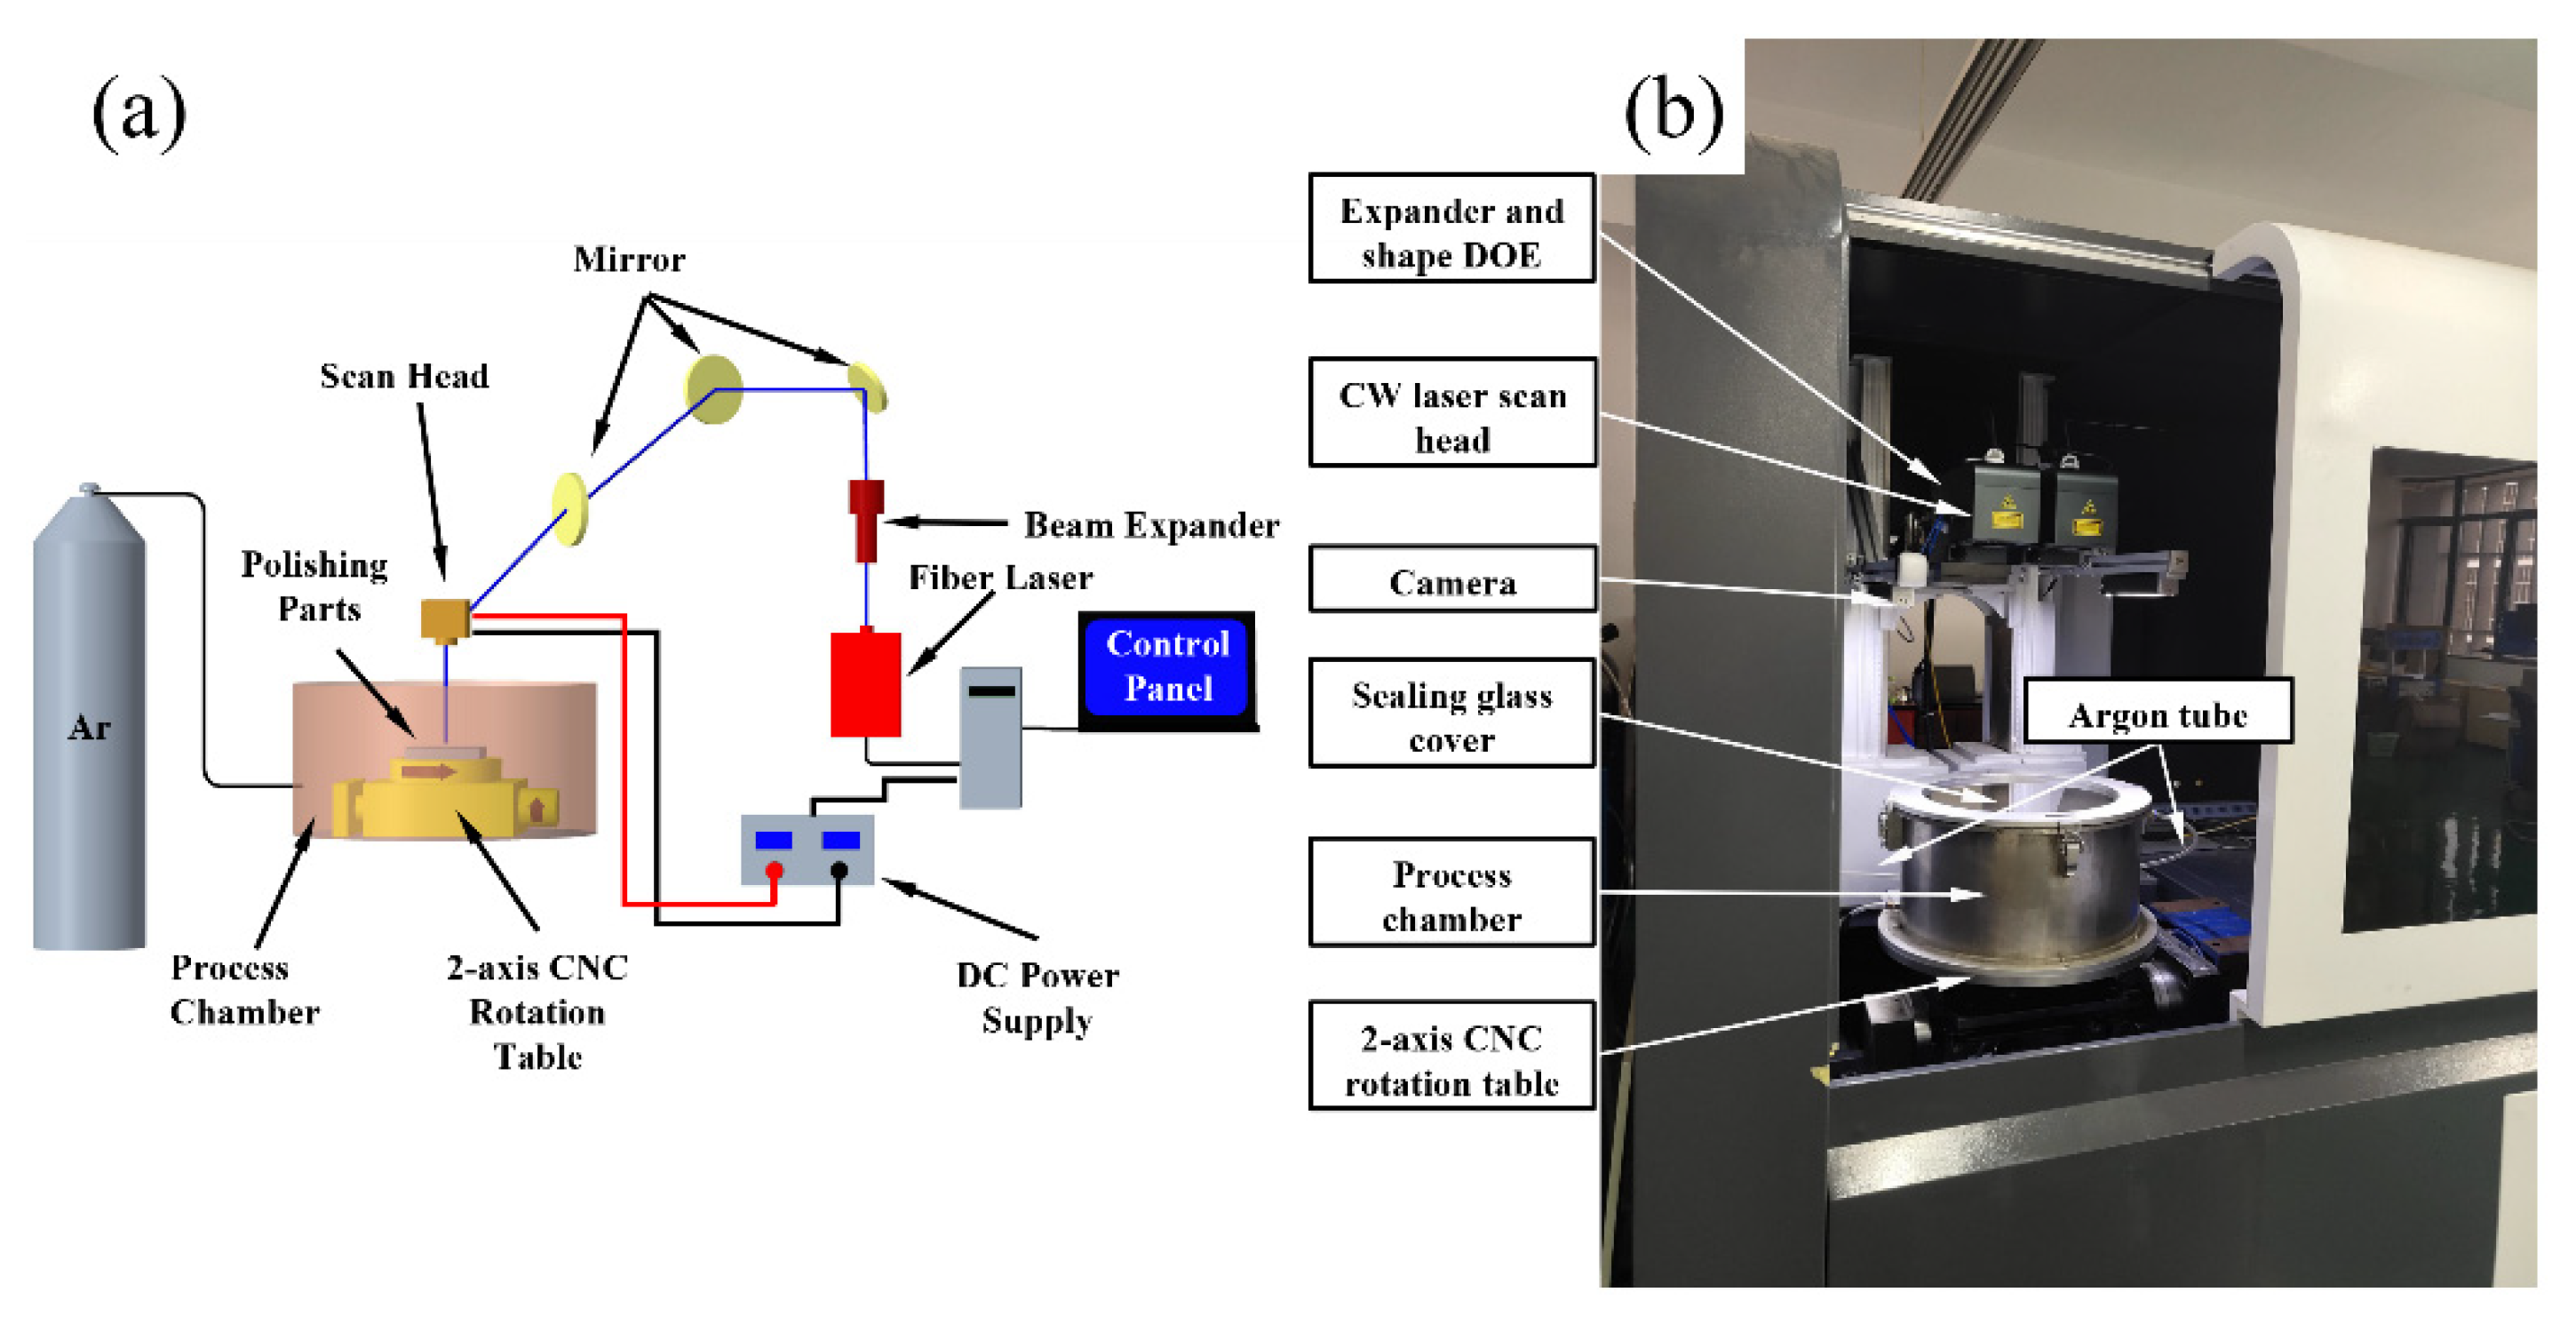
3.1. Polishing Experimental Setup
3.2. Experimental Methods
4. Results and Discussion
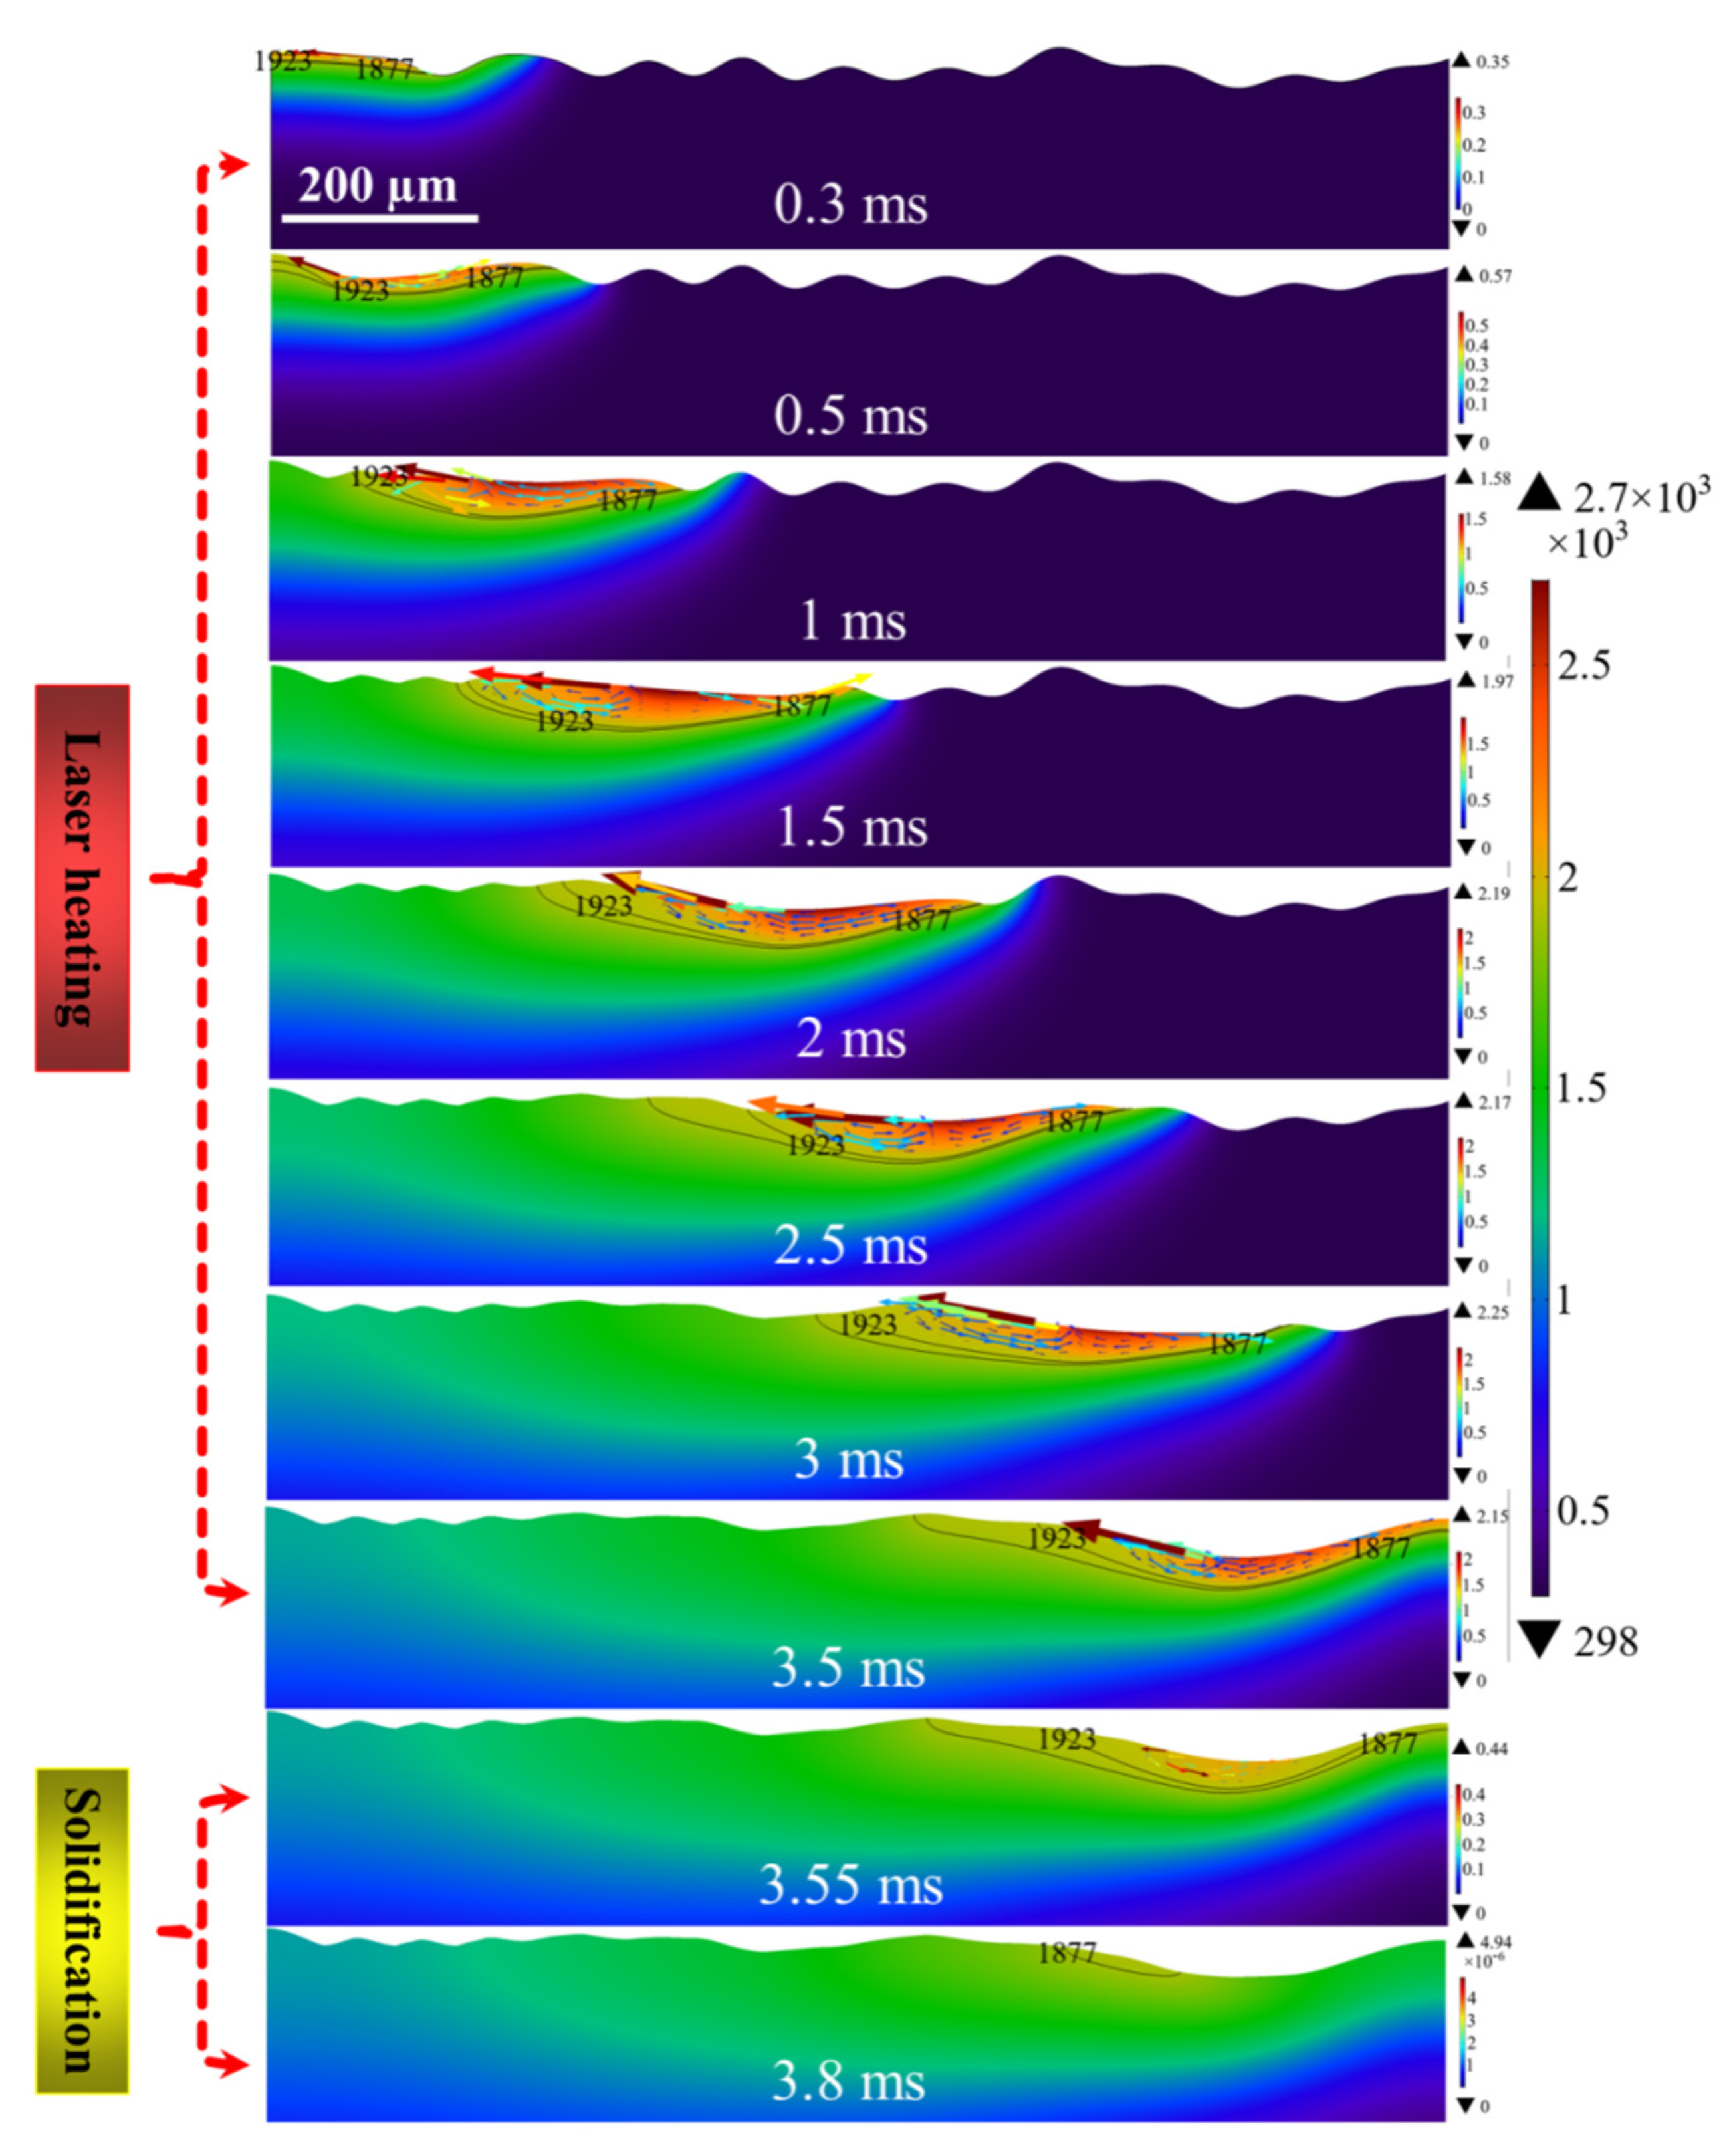
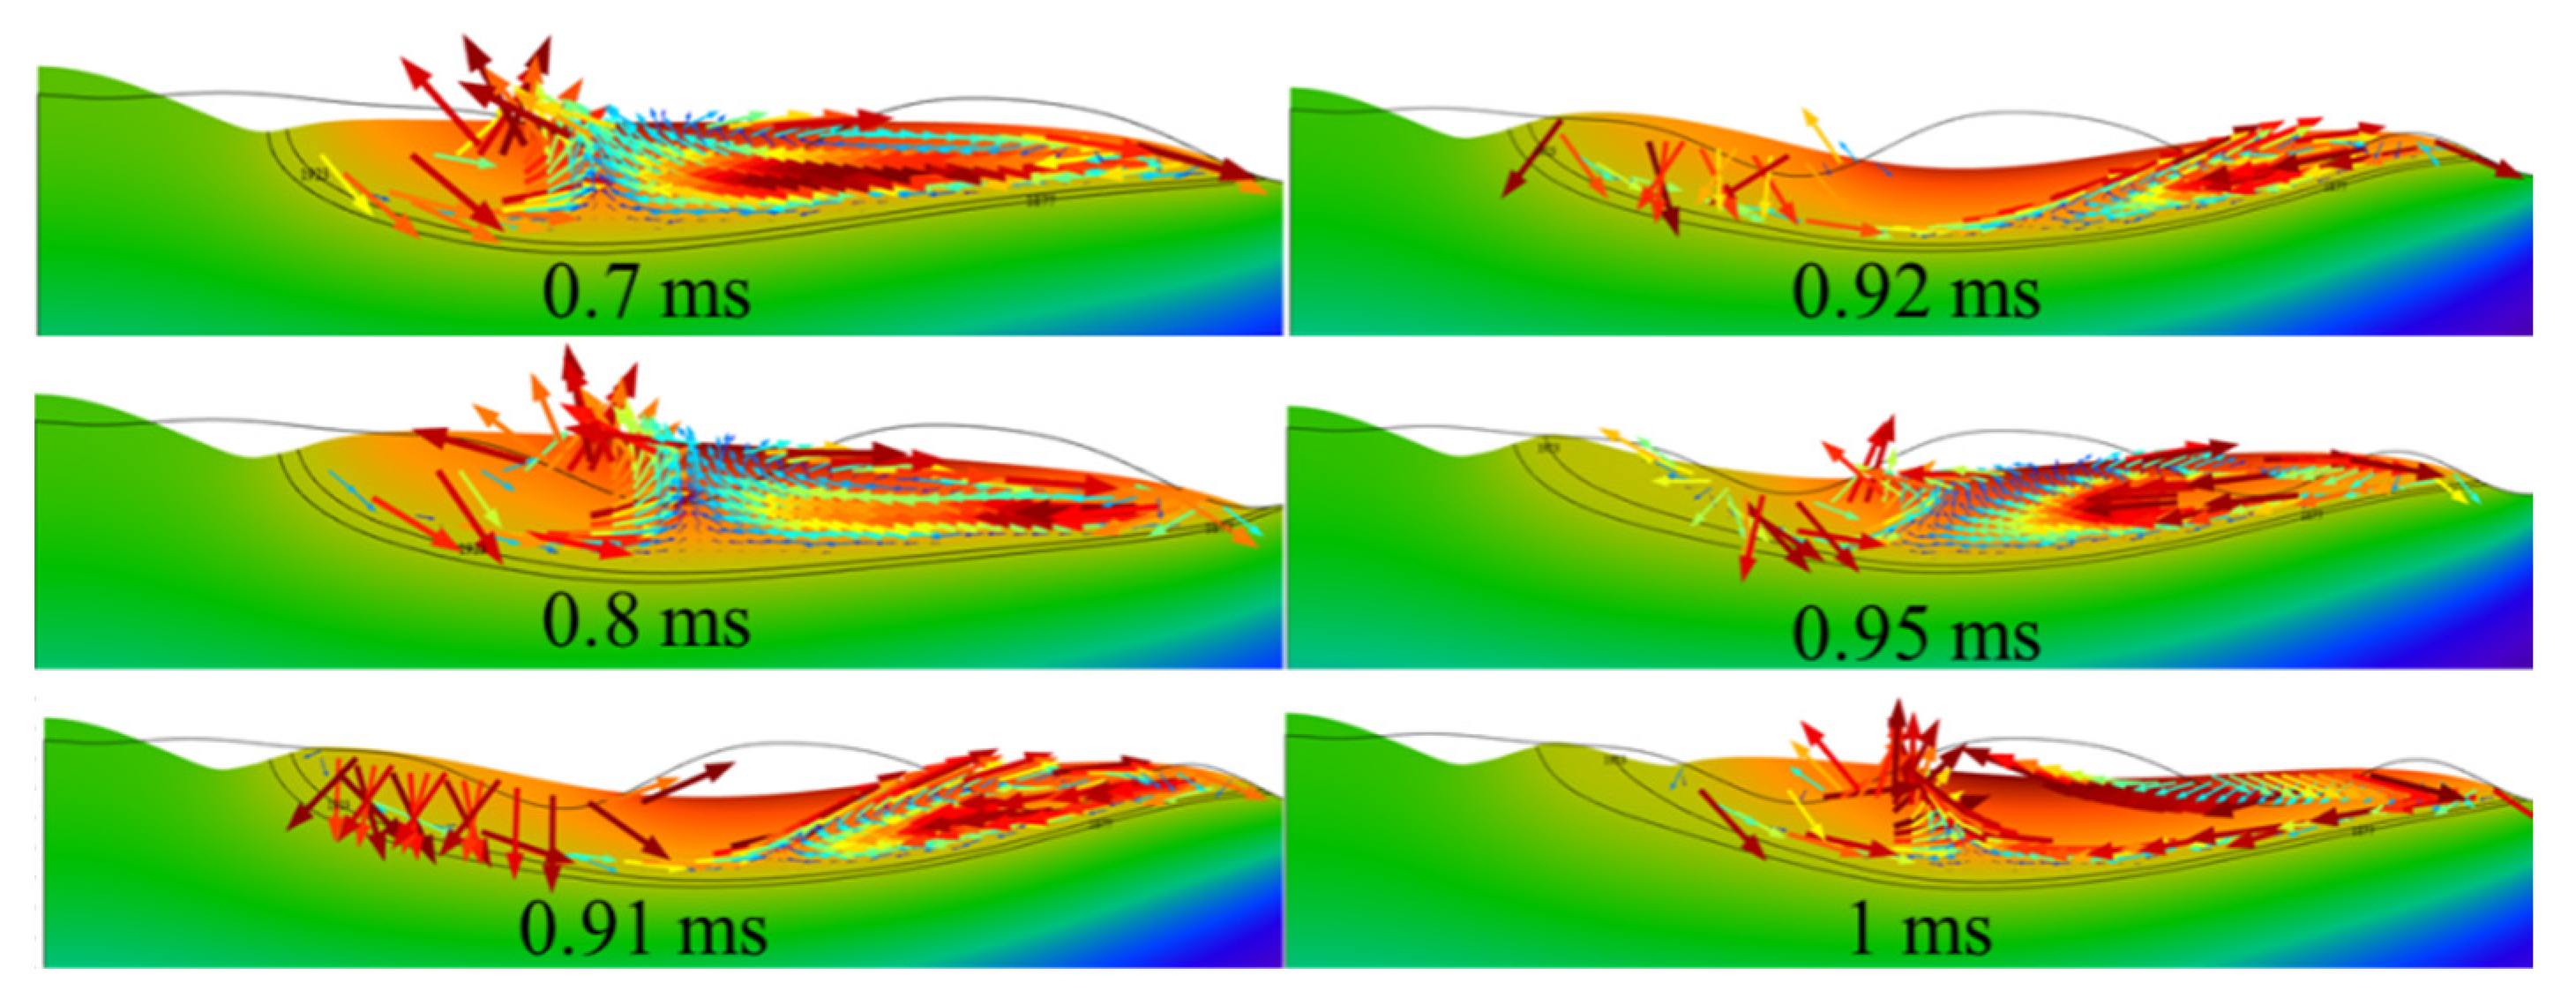
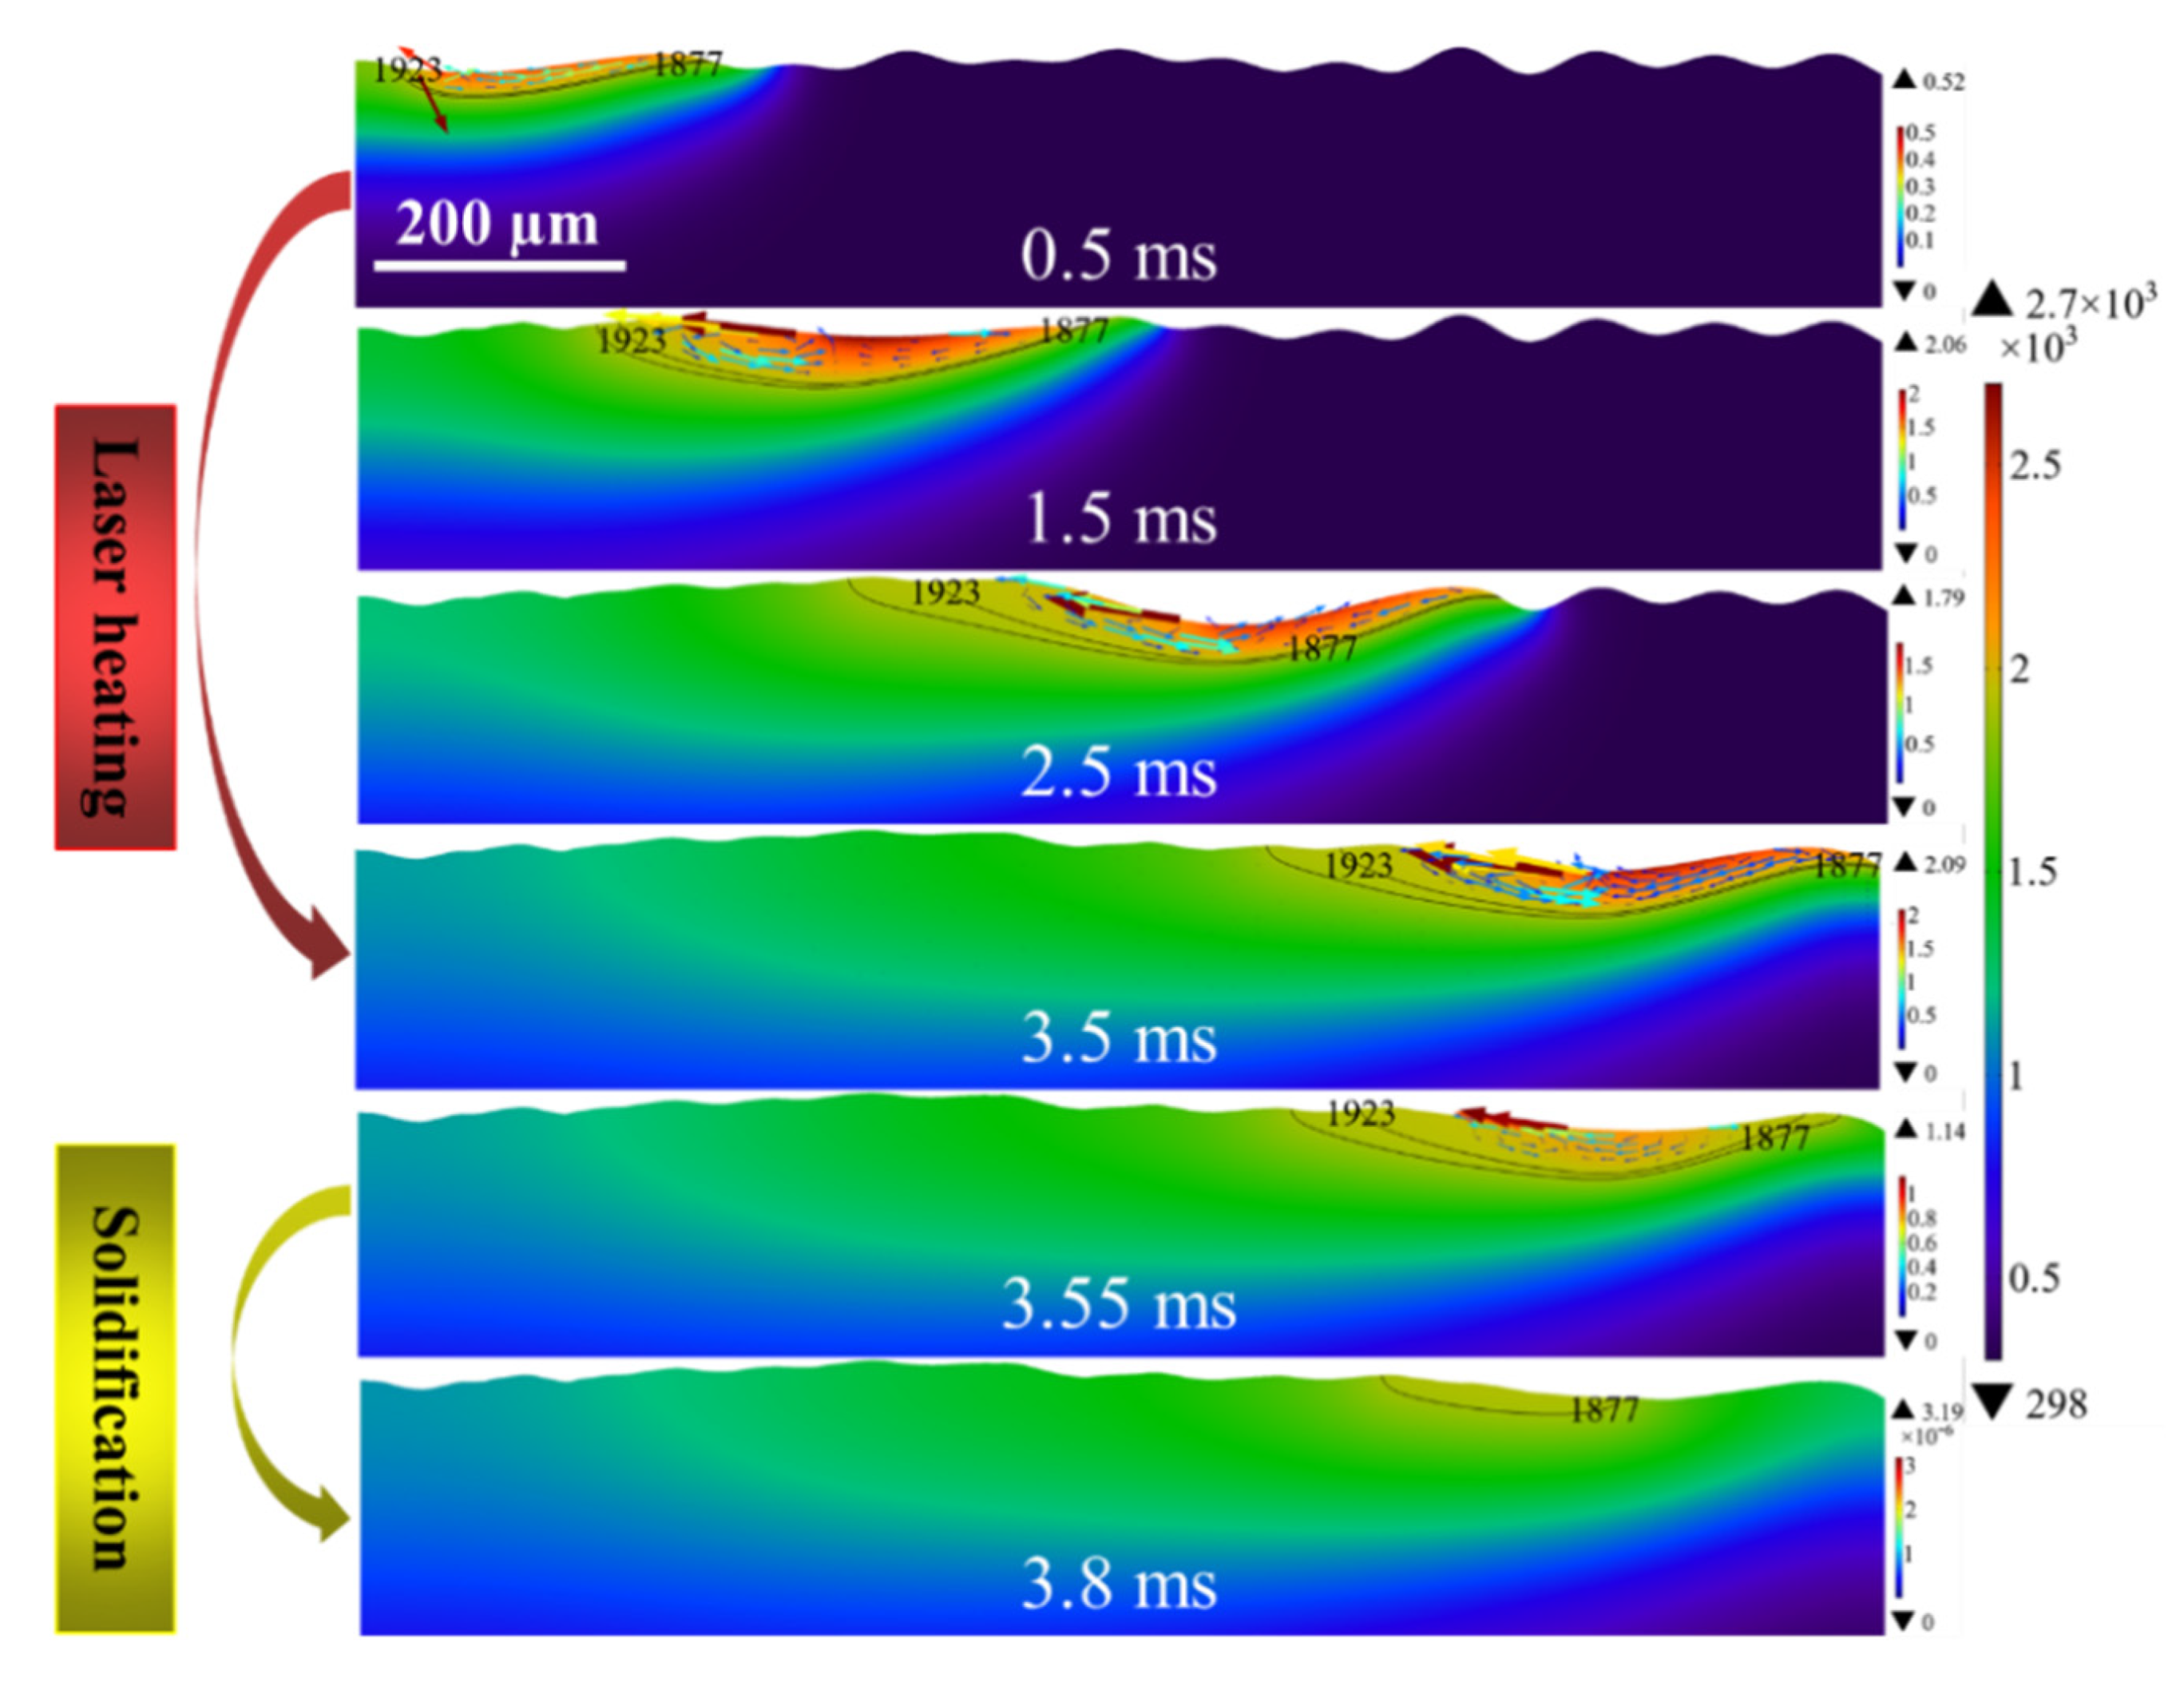
4.1. Molten Flow Behavior of Model 1
4.2. Analysis of Temperature Field
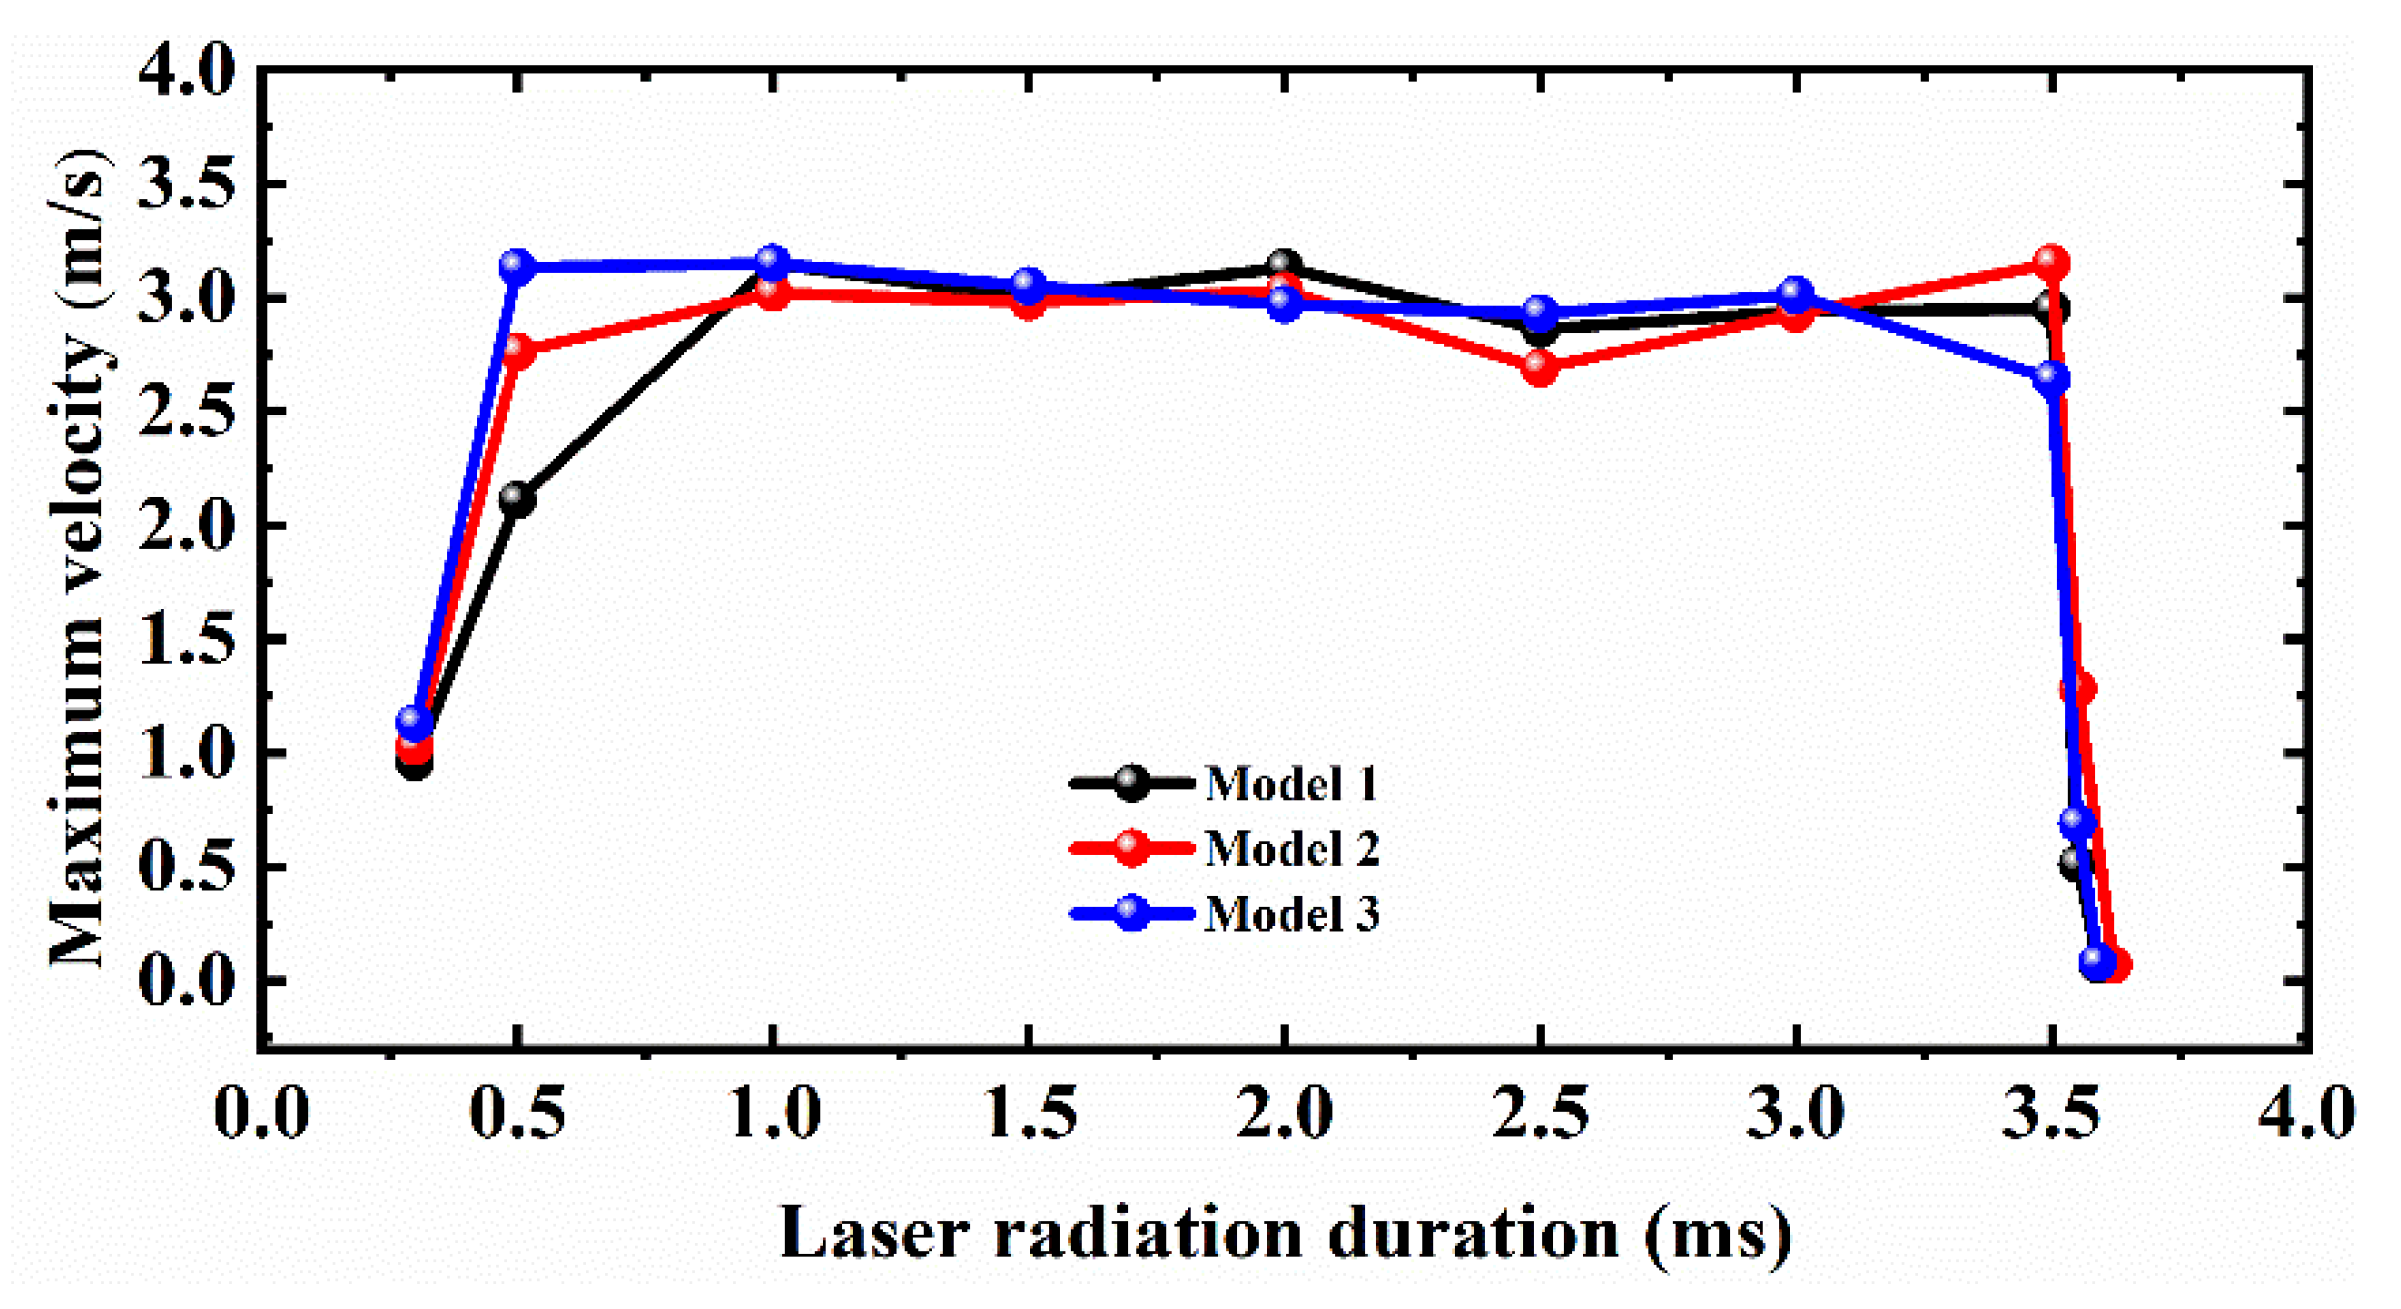
4.3. Analysis of Velocity Field
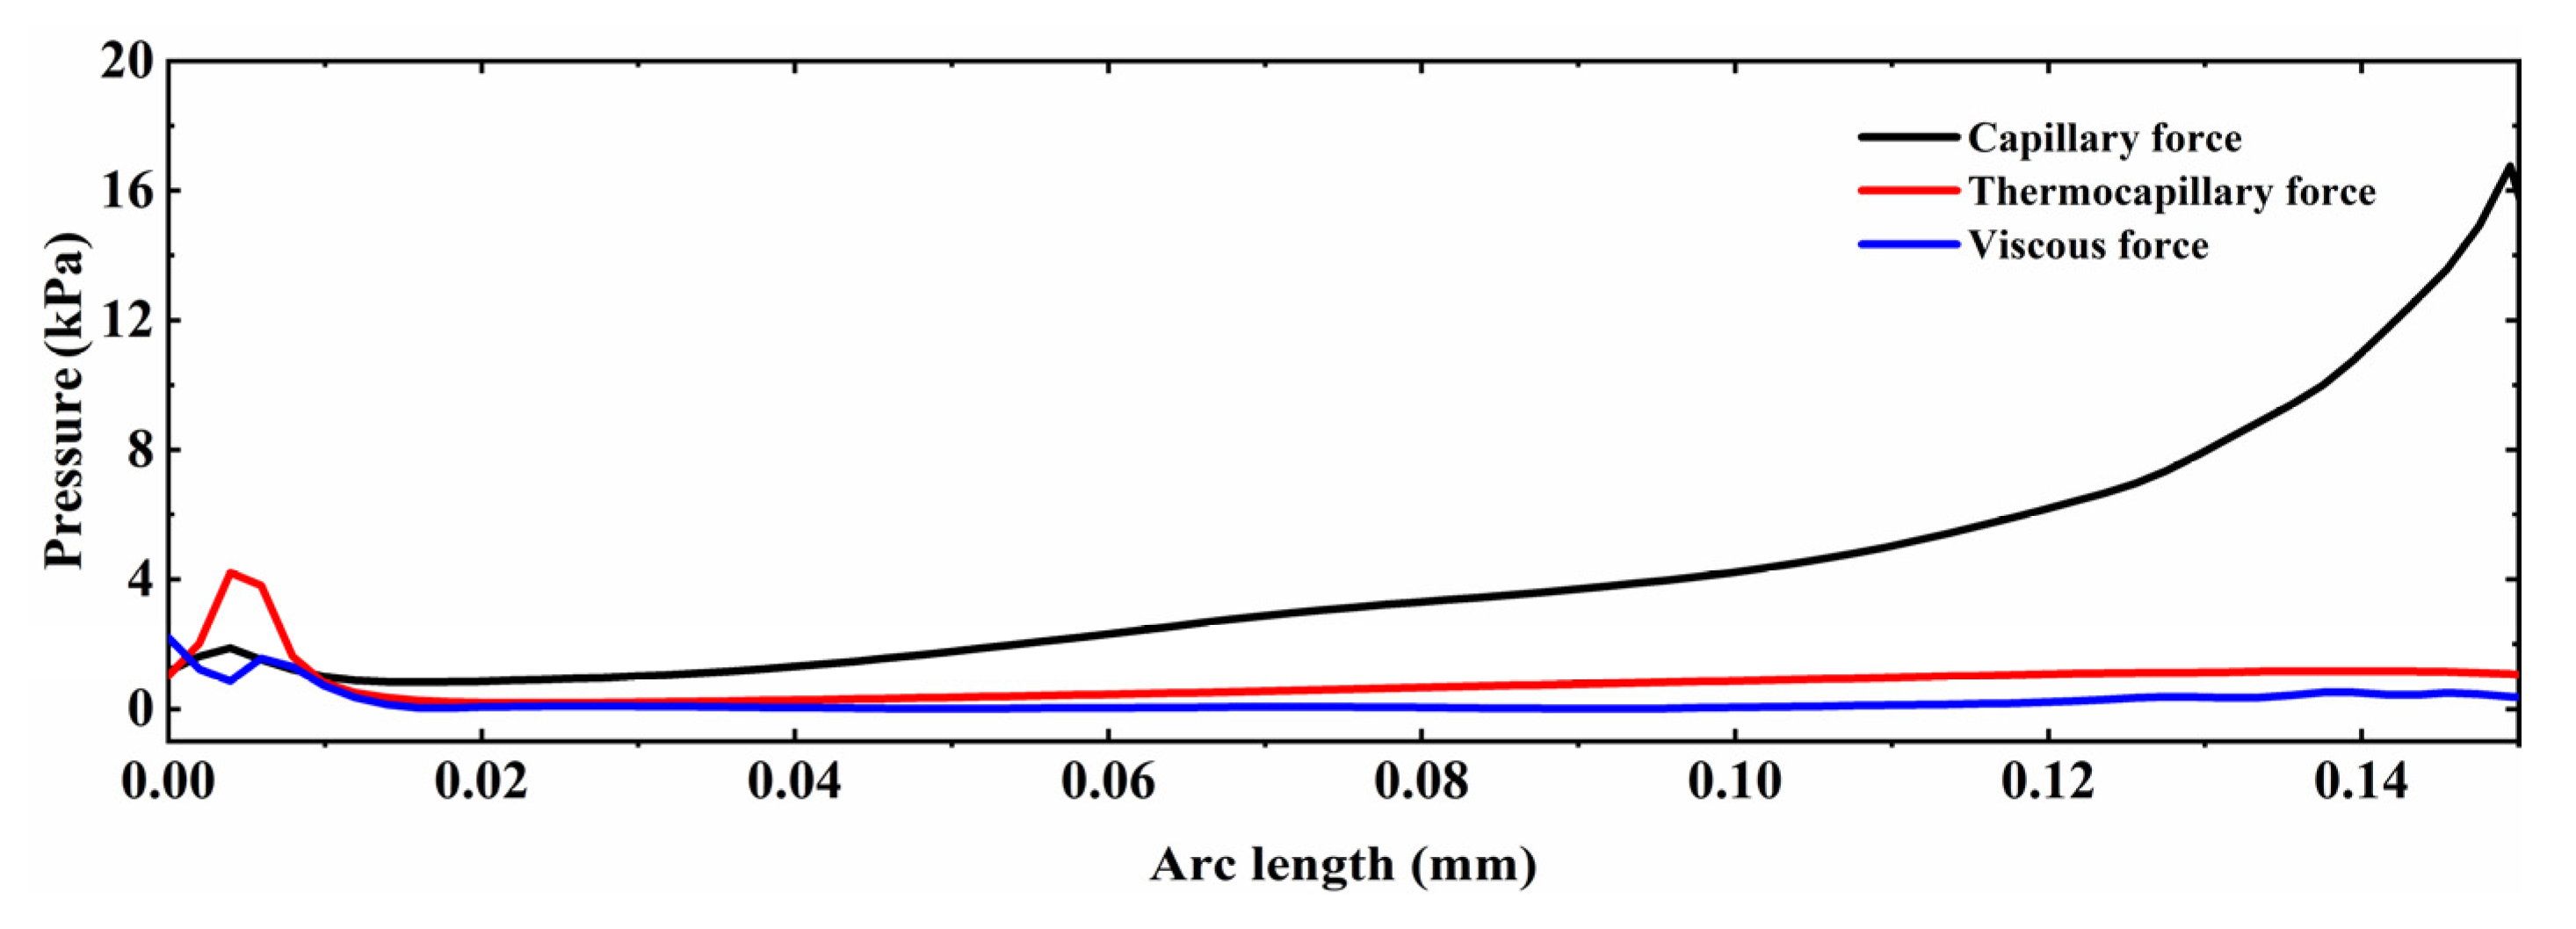
4.4. Analysis of Free Surface Evolution
4.5. Analysis of Secondary Surface Bumps Formed
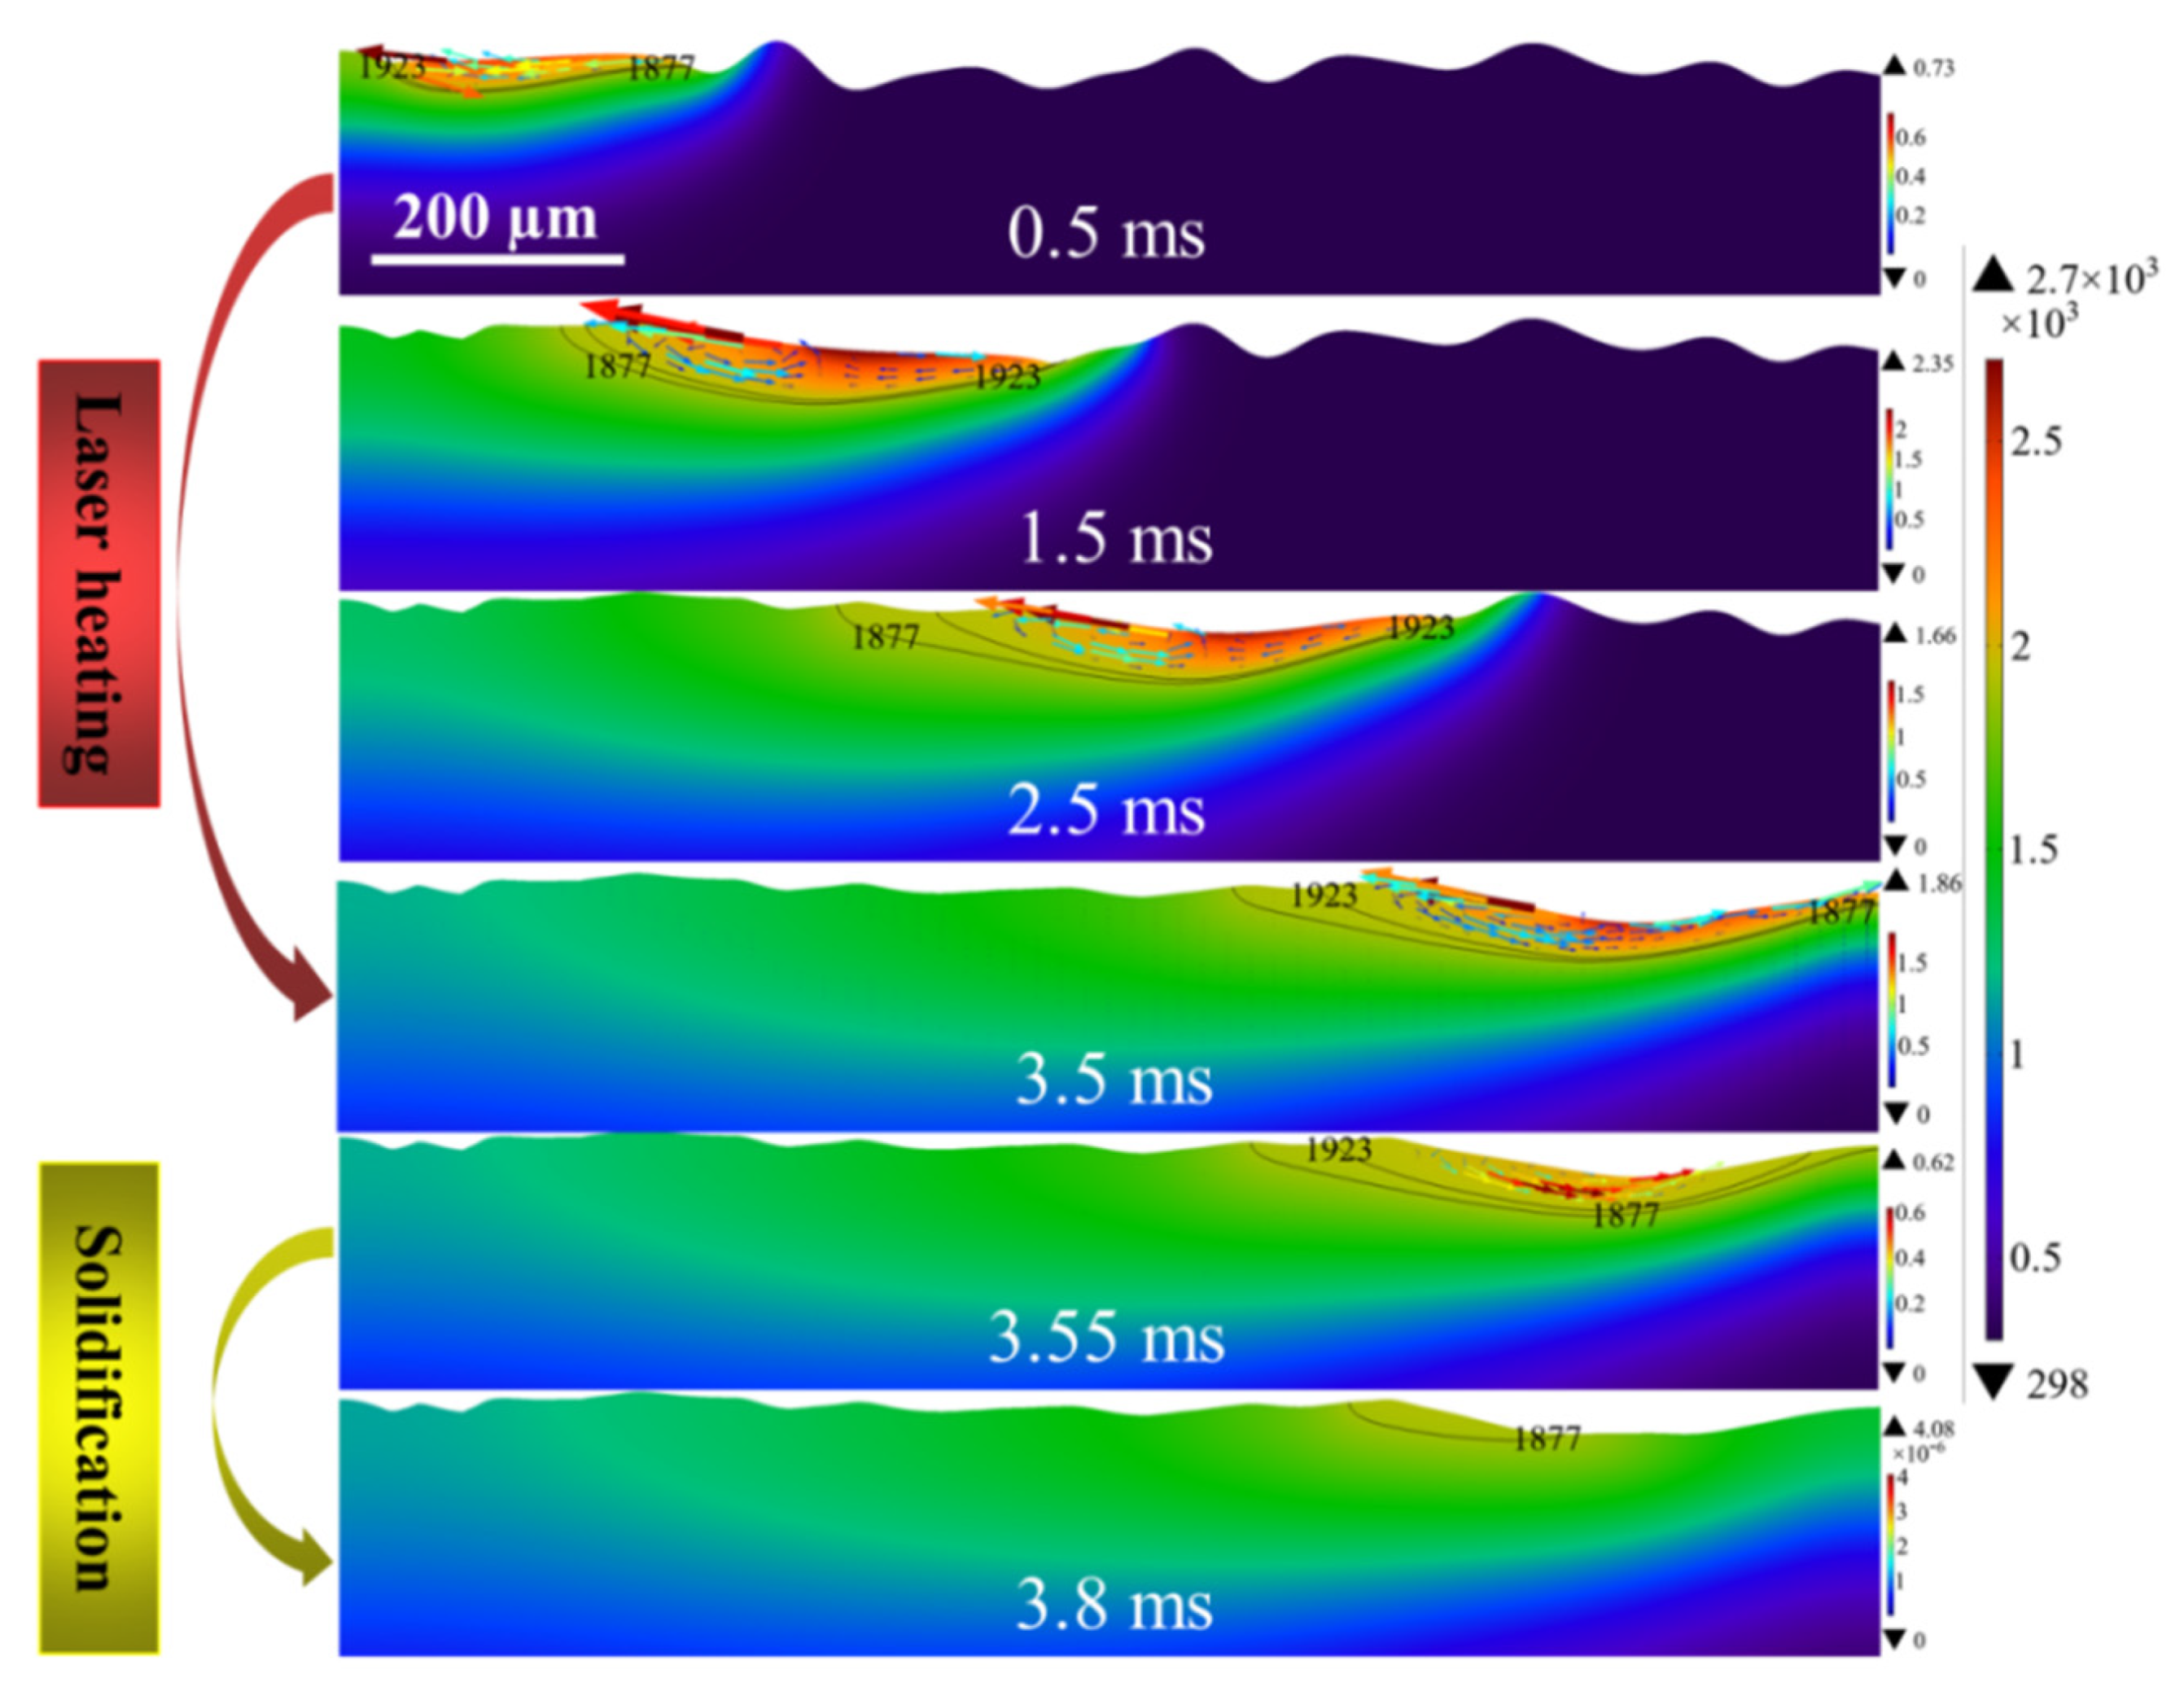
4.6. Molten Flow Behavior of Models 2 and 3
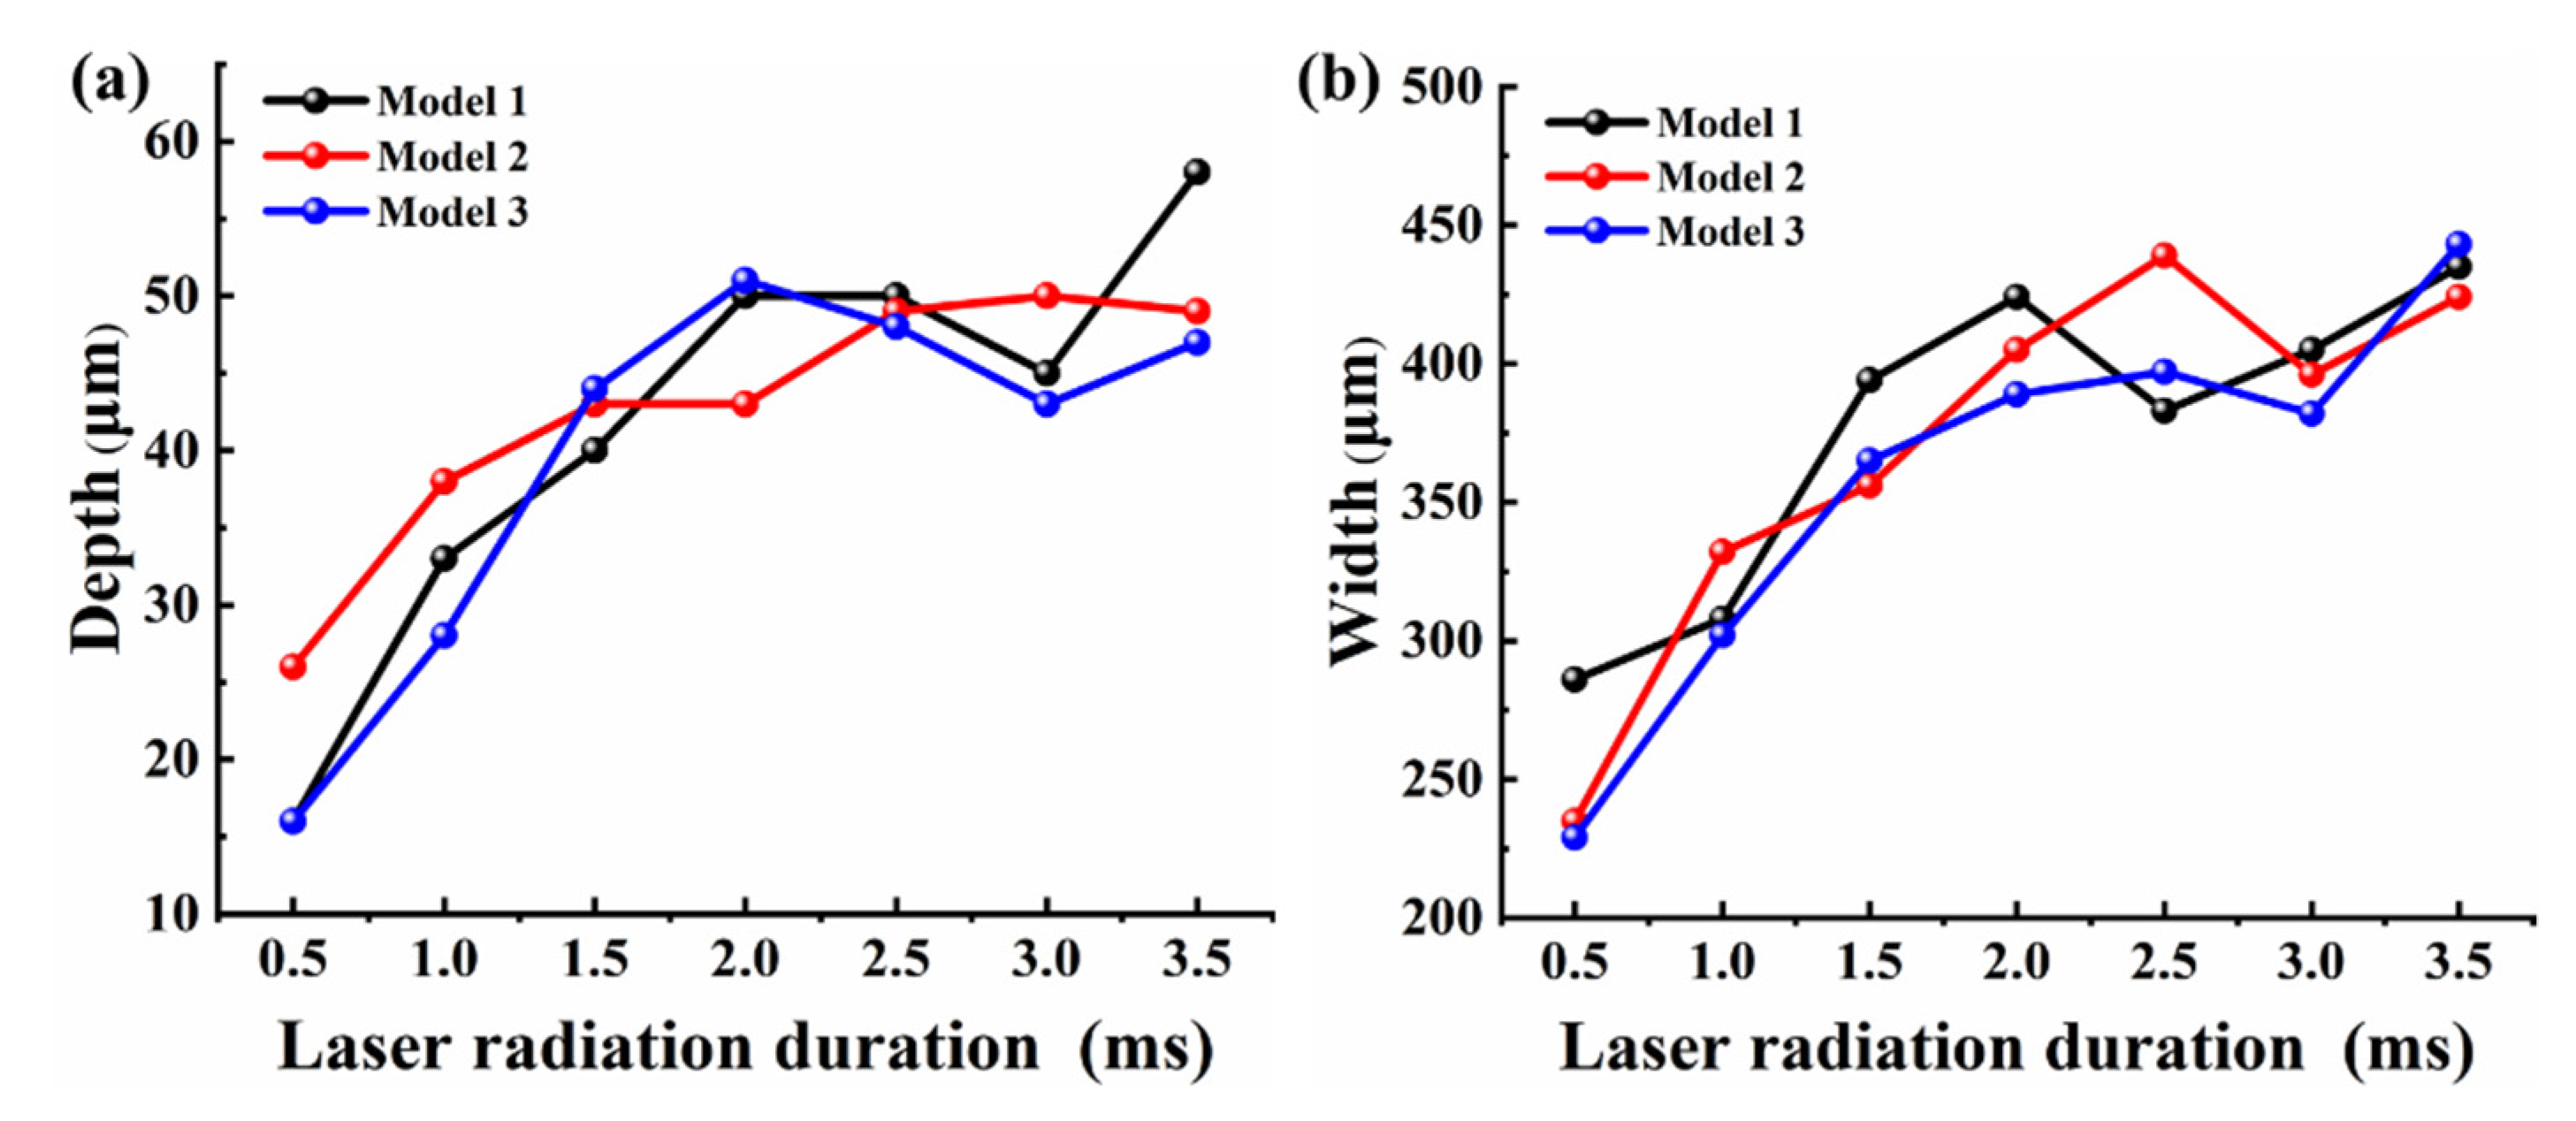
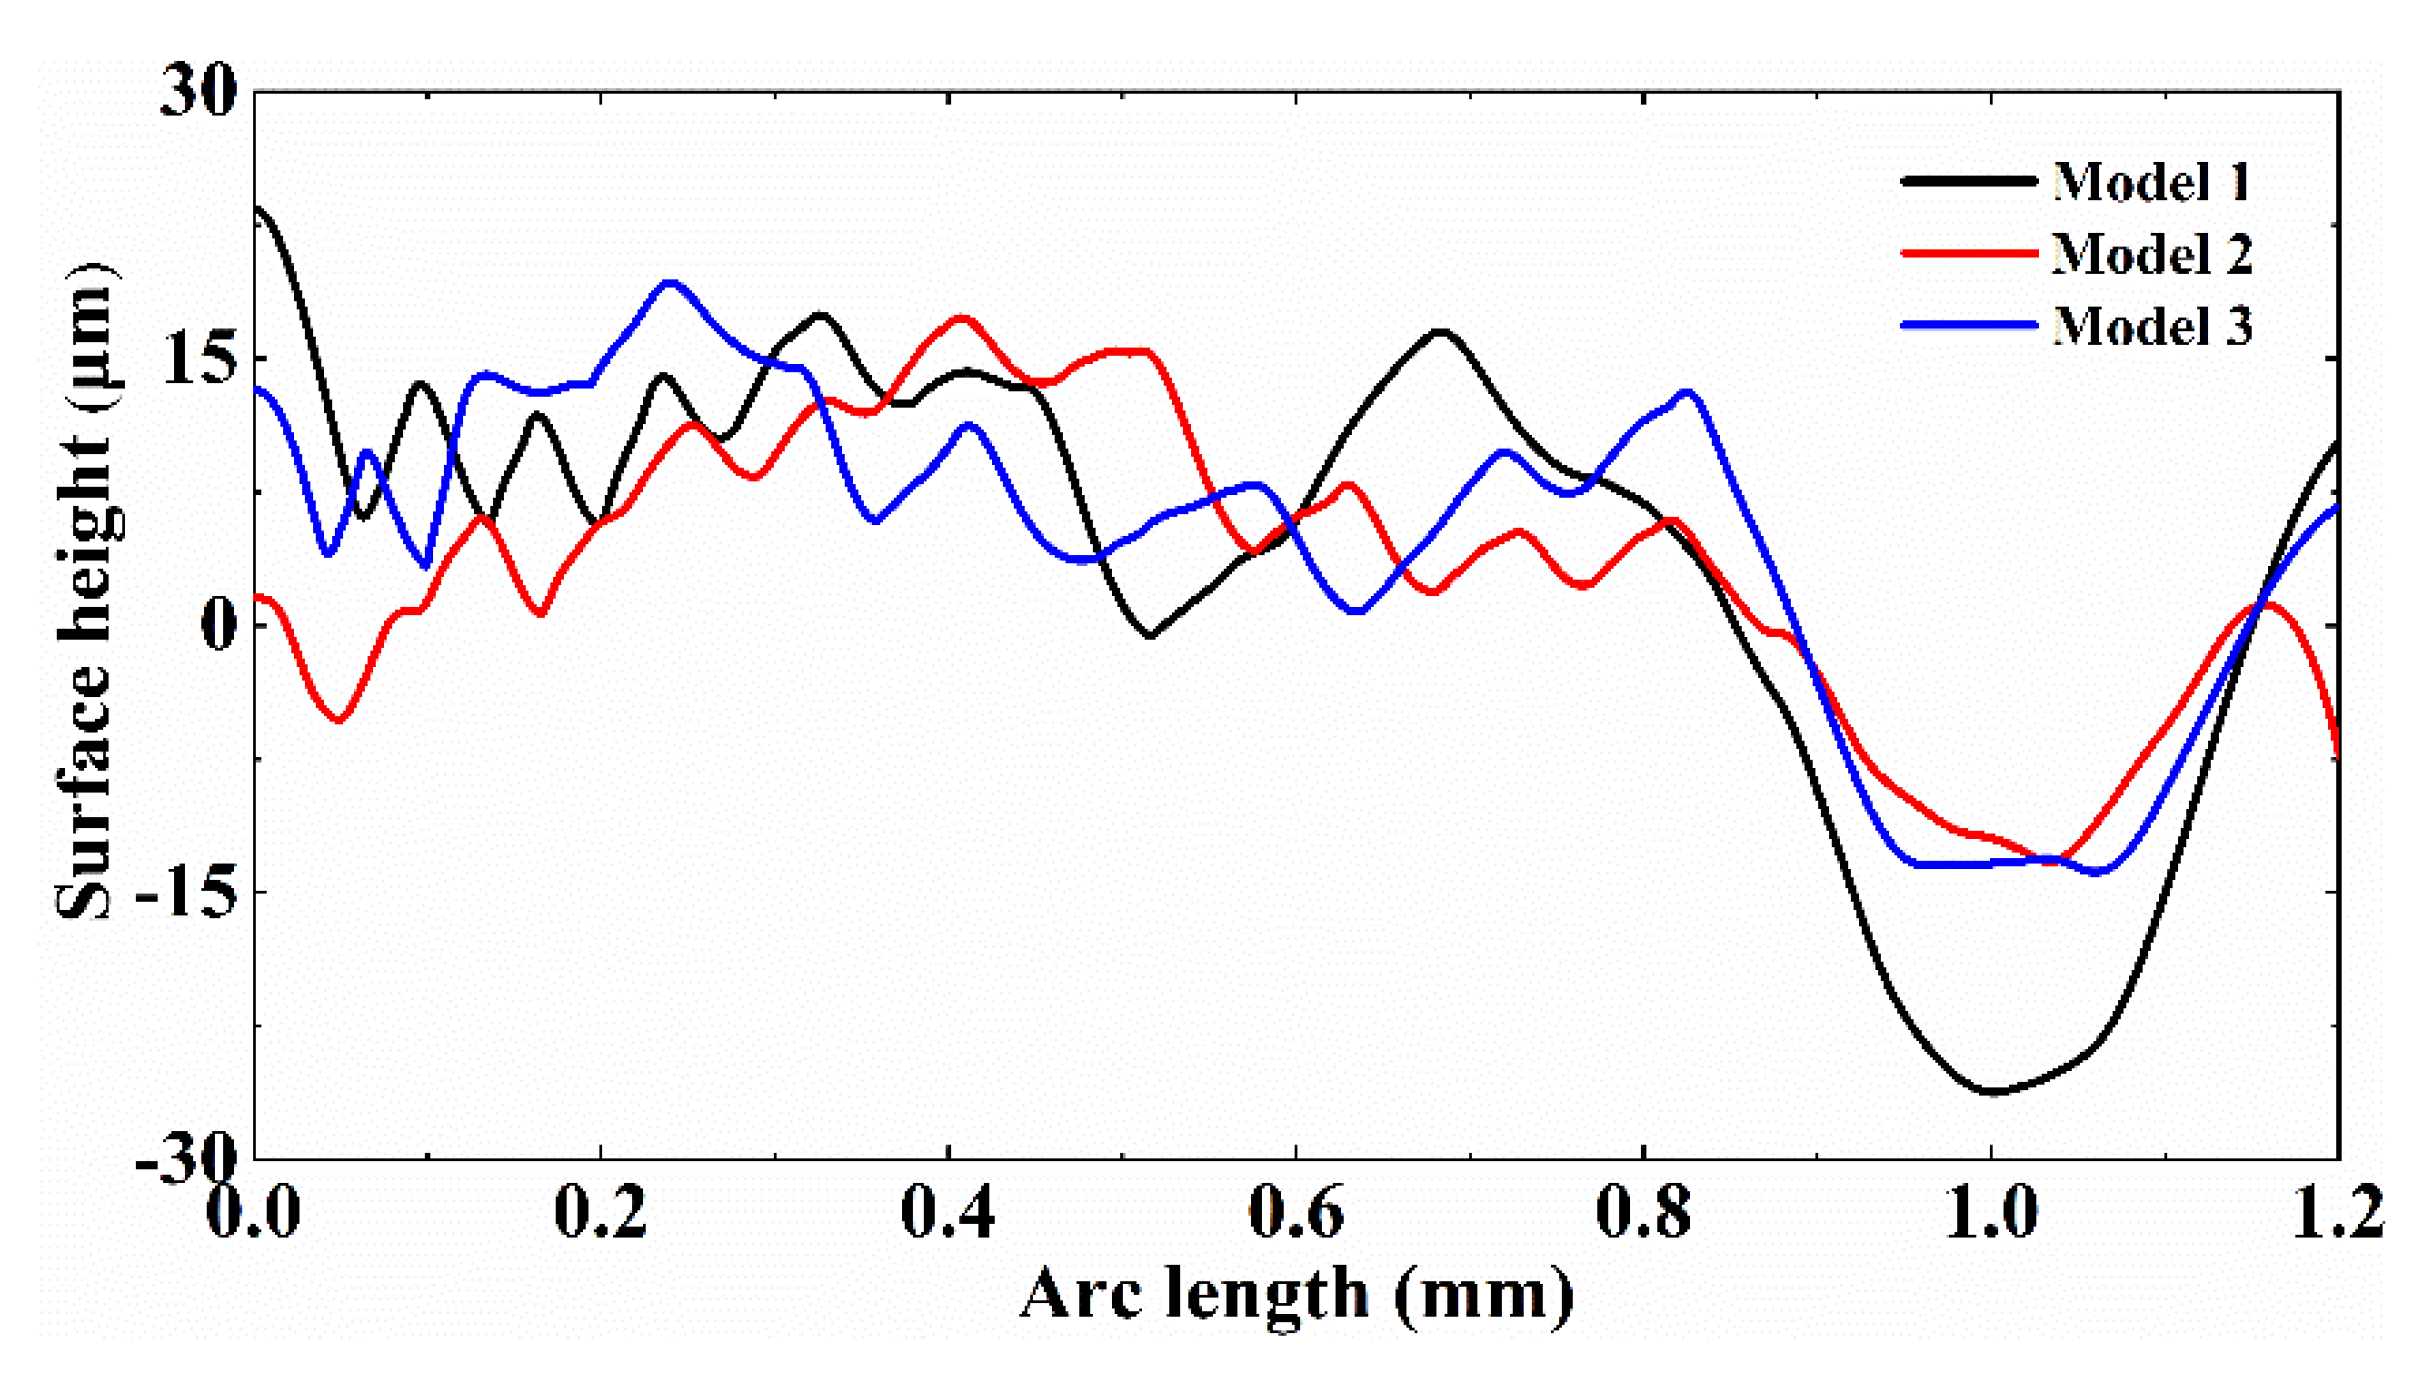
4.7. Evolution of Melt Hydrodynamics for Models 1, 2 and 3
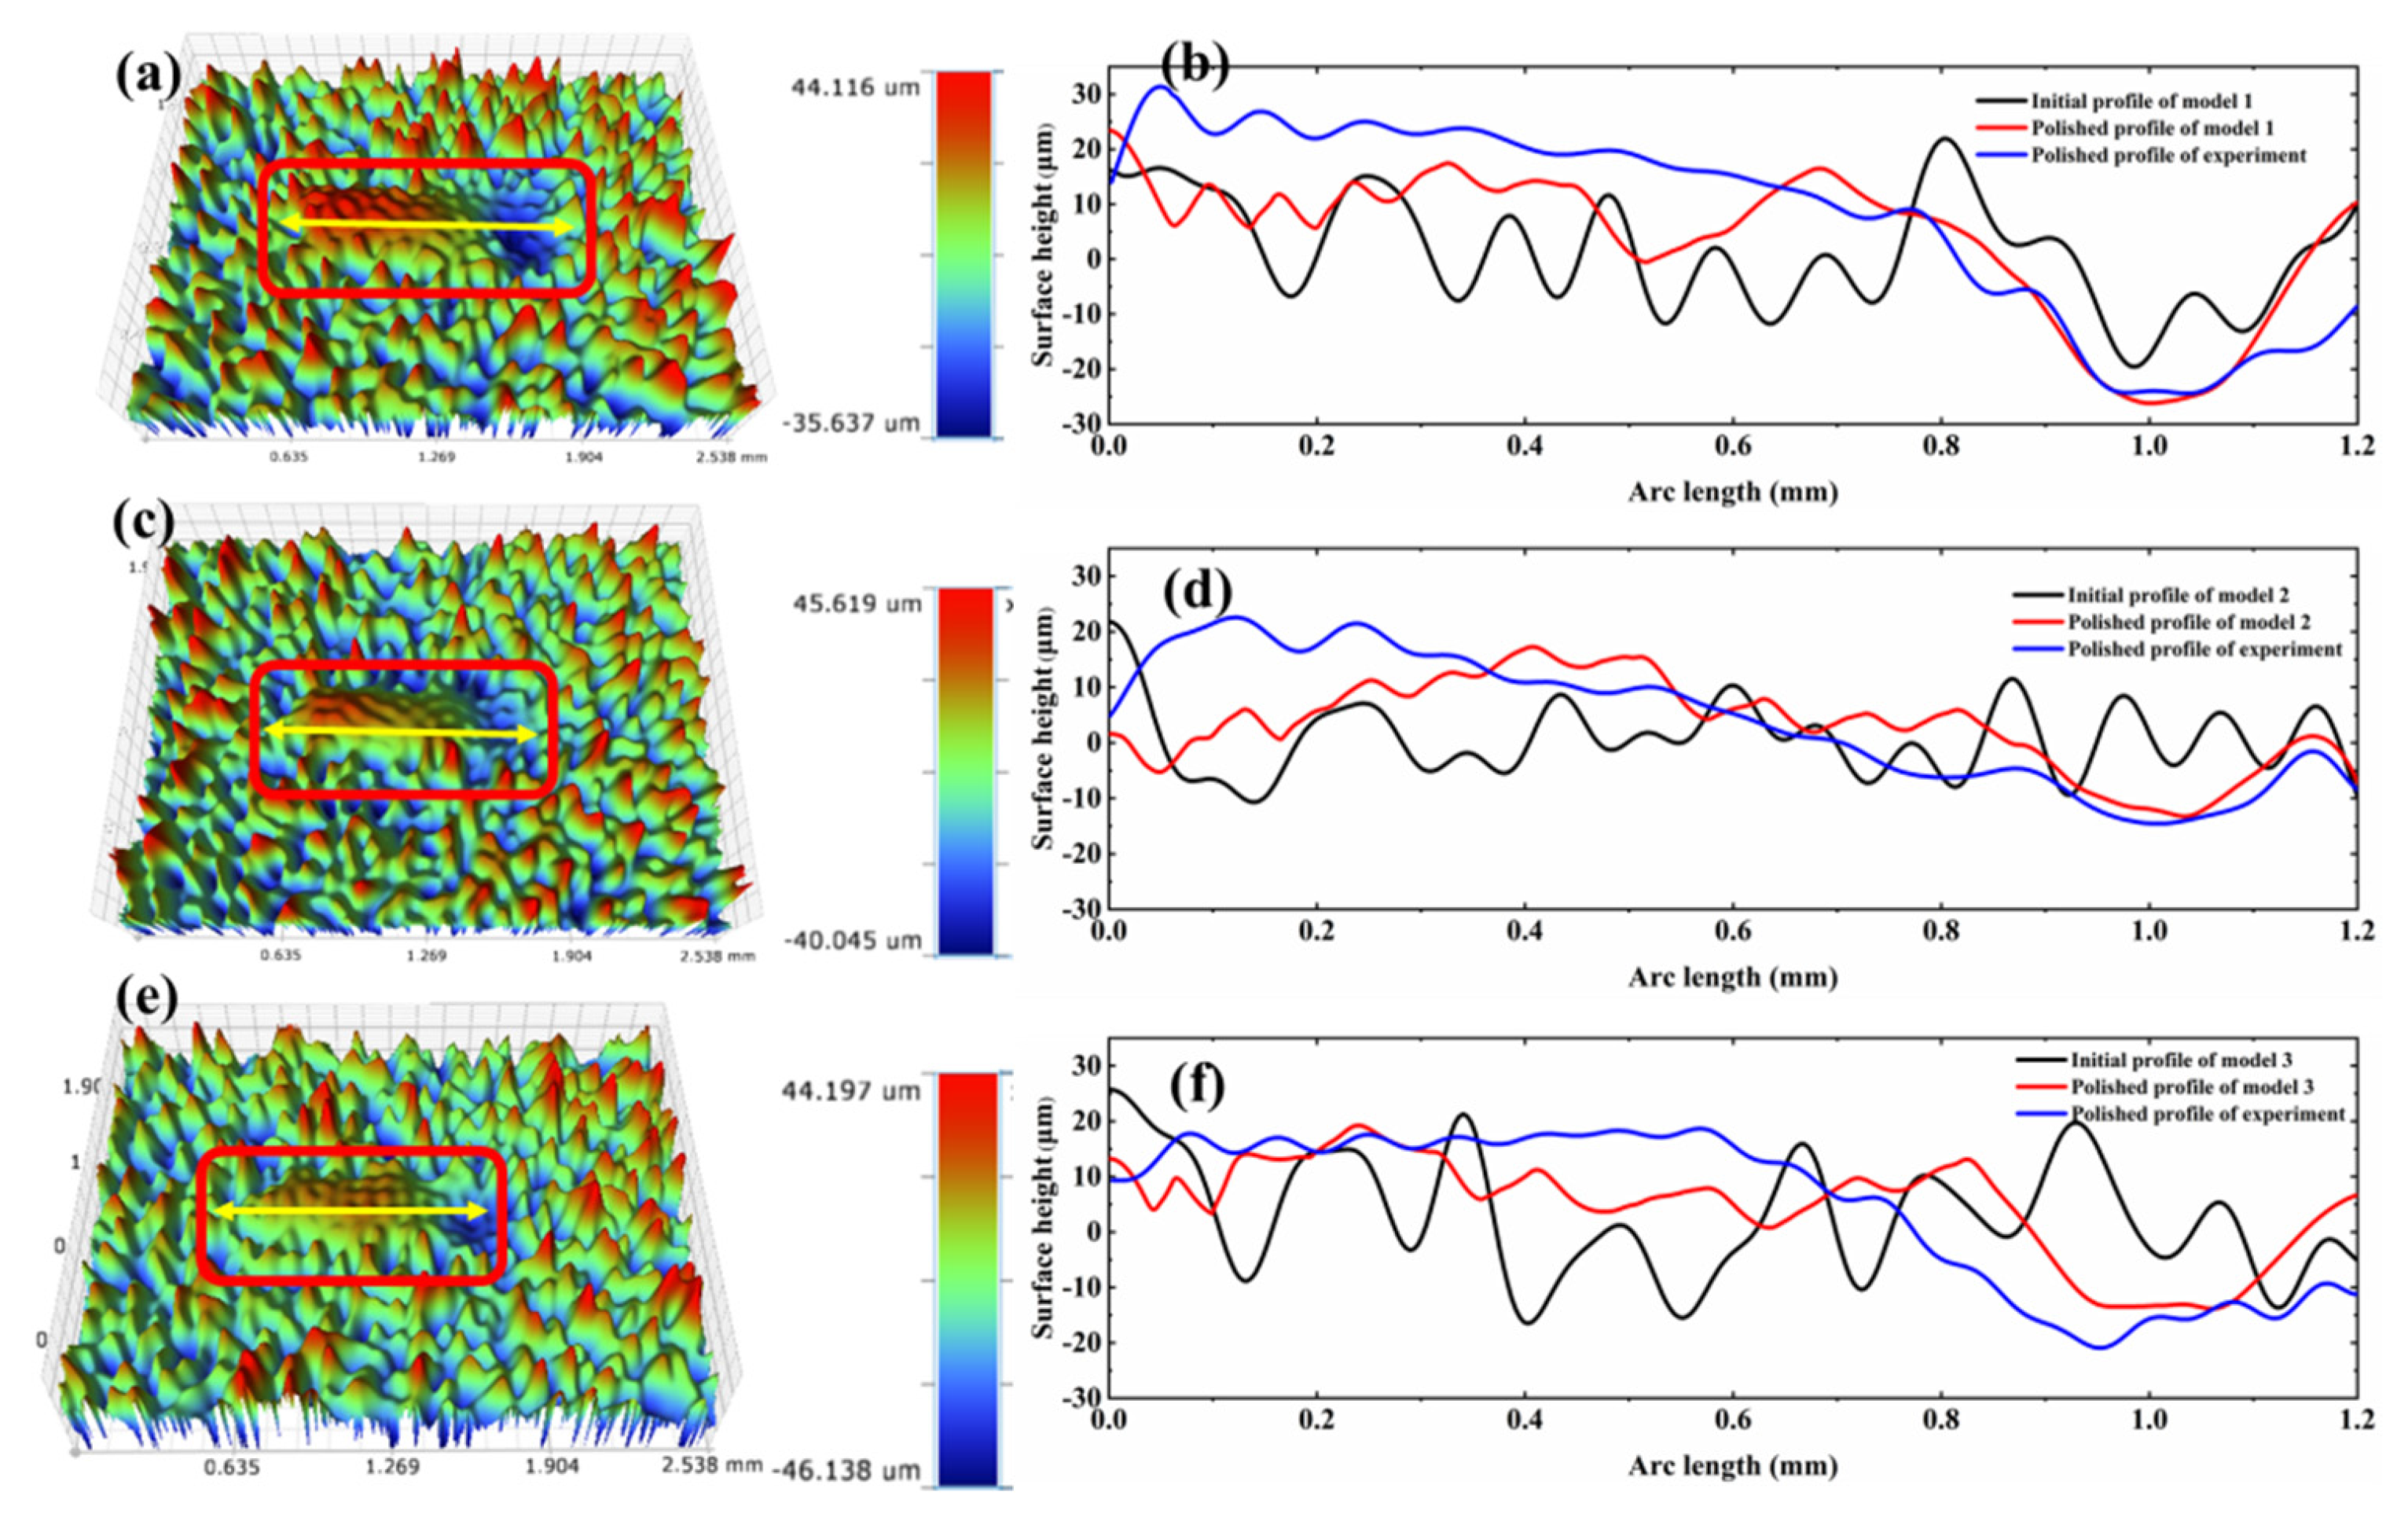
4.8. Experimental Validation
5. Conclusions
- (1)
- The model demonstrated that the complex evolution of the melt hydrodynamics involving heat conduction, thermal convection, thermal radiation, melting and solidification during laser polishing.
- (2)
- The uniformity of the initial surface peaks and valleys distribution is positively correlated with the smoothing quality of the polished surface, but has less effect on temperature field, velocity field, as well as melt depth and width of the molten pool.
- (3)
- The surface rough profiles are not completely eliminated by capillary and thermocapillary forces due to the high cooling rate of the molten pool, resulting in the formation of secondary surface roughness. It was revealed that the short lifetime of the molten pool is the main reason why the surface bumps are not completely eliminated.
- (4)
- The numerical prediction of the depressions for Models 1, 2 and 3 are approximate 26 μm, 12 μm and 13 μm at about 1 mm on the polished surface. Accordingly, the experimental molten pool depths are about 24 μm, 14 μm and 15 μm as well as the errors are approximately 8.3%, 14.3% and 13.3%, respectively.
- (5)
- The model not only predicts the morphological evolution of different surfaces from rough to smooth in laser polishing, but also can be suitable for guiding the optimization of polishing parameters such as laser power and scanning speed. Additionally, this model can be applied to most metallic materials in laser polishing.
Author Contributions
Funding
Data Availability Statement
Conflicts of Interest
Nomenclature
| LP | Laser polishing |
| PAM | Plasma assisted milling |
| FEM | Finite element method |
| ALE | Arbitrary Lagrangian-Eulerian |
| SSM | Surface shallow melting |
| 2D | Two dimensional |
| fcr | Critical frequency (Hz) |
| ρ | Density (kg m−3) |
| t | Laser radiation duration (ms) |
| T | Temperature (K) |
| Velocity (m s−1) | |
| K | Thermal conductivity (Wm−1 K−1) |
| Mesh velocity | |
| umat | Material velocity (m s−1) |
| p | Pressure (Pa) |
| I | Identity matrix |
| Μ | Dynamic viscosity (Pa s) |
| FV | Body force (N m−3) |
| Tref | Reference temperature (K) |
| ρref | Reference density (kg m−3) |
| β | Thermal expansion coefficient (K−1) |
| g | Gravity constant (N kg−1) |
| Cp | Specific heat (Jkg−1 K−1) |
| fL | Liquid fraction |
| Ts | Solidus temperature (K) |
| Tl | Liquidus temperature (K) |
| Tm | Melting temperature (K) |
| Tb | Boiling temperature (K) |
| Ta | Ambient temperature (K) |
| ρs | Solidus density (kg m−3) |
| ρl | Liquidus density (kg m−3) |
| ks | Solidus thermal conductivity (Wm−1 K−1) |
| kl | Liquidus thermal conductivity (Wm−1 K−1) |
| Cp-s | Solidus specific heat (Jkg−1 K−1) |
| Cp-l | Liquidus specific heat (Jkg−1 K−1) |
| H | Convective coefficient (Wm−2 K−1) |
| ∂γ/∂T | Temperature derivative of surface tension (Nm−1 K−1) |
| Lm | Latent heat of melting (Jkg−1) |
| Ε | Emissivity |
| α0 | Absorptivity |
| σ | Stefan-Boltzmann constant |
| ur | Fluid flow velocity along the r direction |
| uz | Fluid flow velocity along the z direction |
| γ | Surface tension coefficient (N m−1) |
| κ | Surface curvature (m−1) |
| Normal vector | |
| Tangential vector | |
| P | Laser power (W) |
| r0 | Laser beam radius (m) |
| M2 | Laser beam quality |
| R | The r-component in the cylindrical coordinate system |
| V | Laser moving velocity (mm s−1) |
| f(r*) | Laser radiation area |
| Qs | Stationary laser energy density (J cm−2) |
| Qm | Moving laser energy density (J cm−2) |
| th | Laser heating duration (ms) |
| tc | Cooling duration (ms) |
References
- Singh, P.; Pungotra, H.; Kalsi, N.S. On the characteristics of titanium alloys for the aircraft applications. Mater. Today Proc. 2017, 4, 8971–8982. [Google Scholar] [CrossRef]
- Gurrappa, I. Characterization of titanium alloy Ti6Al4V for chemical, marine and industrial applications. Mater. Charact. 2003, 51, 131–139. [Google Scholar] [CrossRef]
- Giannatsis, J.; Dedoussis, V. Additive fabrication technologies applied to medicine and health care: A review. Int. J. Adv. Manuf. Technol. 2009, 40, 116–127. [Google Scholar] [CrossRef]
- Pimenov, D.Y.; Guzeev, V.I. Mathematical model of plowing forces to account for flank wear using FME modeling for orthogonal cutting scheme. Int. J. Adv. Manuf. Technol. 2017, 89, 3149–3159. [Google Scholar] [CrossRef]
- Pimenov, D.Y.; Mia, M.; Gupta, M.K.; Machado, A.R.; Tomaz, Í.V.; Sarikaya, M.; Wojciechowski, S.; Mikolajczyk, T.; Kapłonek, W. Improvement of machinability of Ti and its alloys using cooling-lubrication techniques: A review and future prospect. J. Mater. Res. Technol. 2021, 11, 719–753. [Google Scholar] [CrossRef]
- Liu, S.Y.; Yung, C.S. Additive manufacturing of Ti6Al4V alloy: A review. Mater. Des. 2019, 164, 107752. [Google Scholar] [CrossRef]
- Ukar, E.; Lamikiz, A.; Martínez, S.; Estalayo, F.; Tabernero, I. Laser Polishing of GGG70L Cast Iron with 2D scan-head. Pro. Eng. 2013, 63, 53–59. [Google Scholar] [CrossRef][Green Version]
- Martínez, S.; Lamikiz, A.; Ukar, E.; Calleja, A.; Arrizubieta, J.A.; López de Lacalle, L.N. Analysis of the regimes in the scanner-based laser hardening process. Opt. Laser. Eng. 2017, 90, 72–80. [Google Scholar] [CrossRef]
- Zhou, J.; Liao, C.H.; Shen, H.; Ding, X.H. Surface and property characterization of laser polished Ti6Al4V. Surf. Coat. Technol. 2019, 380, 125016. [Google Scholar] [CrossRef]
- Xu, Z.; Ouyang, W.T.; Liu, Y.F.; Jiao, J.K.; Liu, Y.Z.; Zhang, W.W. Effects of laser polishing on surface morphology and mechanical properties of additive manufactured TiAl components. J. Manuf. Process. 2021, 65, 51–59. [Google Scholar] [CrossRef]
- López de Lacalle, L.N.; Sa’nchez, J.A.; Lamikiz, A.; Celaya, A. Plasma assisted milling of heat-resistant superalloys. J. Manuf. Sci. Eng. 2004, 126, 274–285. [Google Scholar] [CrossRef]
- López de Lacalle, L.N.; Lamikiz, A.; Celaya, A. Simulation of plasma assisted milling of heat resistant alloys. Int. J. Simul. Model. 2002, 1, 5–15. [Google Scholar]
- Mai, T.A.; Lim, G.C. Micromelting and its effects on surface topography and properties in laser polishing of stainless steel. J. Laser. App. 2004, 16, 221–228. [Google Scholar] [CrossRef]
- Perry, T.L.; Werschmoeller, D.; Duffie, N.A.; Li, X.C.; Pfefferkorn, F.E. Examination of selective pulsed laser micropolishing on microfabricated nickel samples using spatial frequency analysis. J. Manuf. Sci. Eng. 2009, 131, 021002. [Google Scholar] [CrossRef]
- Perry, T.L.; Werschmoeller, D.; Li, X.C.; Pfefferkorn, F.E.; Duffie, N.A. The effect of laser pulse duration and feed rate on pulsed laser polishing of micro fabricated nickel samples. J. Manuf. Sci. Eng. 2009, 131, 031002. [Google Scholar] [CrossRef]
- Perry, T.L.; Werschmoeller, D.; Li, X.C.; Pfefferkorn, F.E.; Duffie, N.A. Pulsed laser polishing of micro-milled Ti6Al4V samples. J. Manuf. Process. 2009, 11, 74–81. [Google Scholar] [CrossRef]
- Vadali, M.; Ma, C.; Duffie, N.A.; Li, X.; Pfefferkorn, F.E. Pulsed laser micro polishing: Surface prediction model. J. Manuf. Process. 2012, 14, 307–315. [Google Scholar] [CrossRef]
- Ukar, E.; Lamikiz, A.; Martínez, S.; Tabernero, I.; López de Lacalle, L.N. Roughness prediction on laser polished surfaces. J. Mater. Process. Technol. 2012, 212, 1305–1313. [Google Scholar] [CrossRef]
- Wang, Q.H.; Morrow, J.D.; Ma, C.; Duffie, N.A.; Pfefferkorn, F.E. Surface prediction model for thermocapillary regime pulsed laser micro polishing of metals. J. Manuf. Process. 2015, 20, 340–348. [Google Scholar] [CrossRef]
- Sim, B.; Kim, W. Melting and Dynamic-surface Deformation in Laser Surface Heating. Int. J. Heat Mass Transfer. 2005, 48, 1137–1144. [Google Scholar] [CrossRef]
- Ma, C.; Vadali, M.; Duffie, N.A.; Pfefferkorn, F.E.; Li, X. Melt pool flow and surface evolution during pulsed laser micro polishing of Ti6Al4V. J. Manuf. Sci. Eng. 2013, 135, V001T01A054. [Google Scholar] [CrossRef]
- Zhang, C.; Zhou, J.; Shen, H. Role of Capillary and Thermocapillary Forces in Laser Polishing of Metals. J. Manuf. Sci. Eng. 2017, 139, 041019. [Google Scholar] [CrossRef]
- Shen, H.; Pan, Y.; Zhou, J.; Yao, Z. Forming mechanism of bump shape in pulsed laser melting of stainless steel. J. Heat Transfer. 2017, 139, 062301. [Google Scholar] [CrossRef]
- Li, K.; Zhao, Z.Y.; Zhou, H.M.; Zhou, H.; Jin, J.C. Numerical analyses of molten pool evolution in laser polishing Ti6Al4V. J. Manuf. Process. 2020, 58, 574–584. [Google Scholar] [CrossRef]
- Li, K.; Zhou, H.M.; Zhao, Z.Y.; Zhou, H.; Yin, J. A study on transient molten pool dynamics in laser polishing of Ti6Al4V using numerical simulation. J. Manuf. Process. 2021, 65, 478–490. [Google Scholar] [CrossRef]
- Sharma, S.; Mandal, V.; Ramakrishna, S.A.; Ramkumar, J. Numerical simulation of melt hydrodynamics induced hole blockage in Quasi-CW fiber laser micro-drilling of TiAl6V4. J. Mater. Process. Technol. 2018, 262, 131–148. [Google Scholar] [CrossRef]
- Mills, K.C. Recommended Values of Thermophysical Properties for Selected Commercial; Woodhead Publishing Ltd: Cambridge, UK, 2002. [Google Scholar]
- Ramos, J.A.; Murphy, J.; Wood, K.; Bourell, D.L.; Beaman, J.J. Surface roughness enhancement of indirect-SLS metal parts by laser surface polishing. In Proceedings of the 12th Solid Freeform Fabrication Symposium, Austin, TX, USA, 6–8 August 2001; pp. 28–38. [Google Scholar]
- Ramos, J.A.; Bourell, D.L.; Beaman, J.J. Surface over-melt during laser polishing of indirect-SLS metal parts. MRS Proc. 2002, 758, 53–61. [Google Scholar] [CrossRef]
- Ramos, J.A.; Bourell, D.L.; Beaman, J.J. Surface characterization of laser polished indirect-SLS parts. In Proceedings of the Solid Freeform Fabrication Symposium, Austin, TX, USA, 5–7 August 2002; pp. 554–562. [Google Scholar] [CrossRef]
- Ramos, J.A.; Bourell, D.L. Reducing surface roughness of metallic freeform-fabricated parts using non-tactile finishing methods. Int. J. Mater. Prod. Technol. 2004, 21, 297–316. [Google Scholar] [CrossRef]
- Zhang, W.K.; Dai, W.; Zheng, Z.Z.; Li, J.J.; Deng, T.T. Numerical simulation and verification of free surface evolution of laser polished H13 die steel. Chin. J. Lasers 2019, 46, 0702002. [Google Scholar] [CrossRef]
- Morville, S.; Carin, M.; Muller, M.; Gharbi, M.; Peyre, P.; Carron, D.; Lemasson, L.E.; Fabbro, R. 2D axial-symmetric model for fluid flow and heat transfer in the melting and resolidification of a vertical cylinder. In Proceedings of the 2010 COMSOL Conference, Paris, France, 17–19 November 2010. [Google Scholar]
- Fontes, E. Two Methods for Modeling Free Surfaces in COMSOL Multiphysics. 2018. Available online: https://www.comsol.com/blogs/two-methods-for-modeling-free-surfaces-in-comsol-multiphys-ics/ (accessed on 15 May 2018).
- Modeling Free Surfaces in COMSOL Multiphysics with Moving Mesh. 2018. Available online: https://cn.comsol.com/blogs/modeling-free-surfaces-in-comsol-multiphysics-with-moving-mesh/ (accessed on 31 May 2018).
- Zhou, Y.Q.; Zhao, Z.Y.; Zhang, W.; Xiao, H.B.; Xu, X.M. Experiment study of rapid laser polishing of freeform steel surface by dual-beam. Coatings 2019, 9, 324. [Google Scholar] [CrossRef]
- MFSC 700W-1500W Series Continuous Fiber Laser user Manual Reference. 2021. Available online: http://www.maxphotonics.com/Cnp/35.html/ (accessed on 6 May 2021).
- Courtois, M.; Carin, M.; Masson, P.L.; Gaied, S.; Balabane, M. A new approach to compute multi-reflections of laser beam in a keyhole for heat transfer and fluid flow modelling in laser welding. J. Phys. D Appl. Phys. 2013, 46, 505305. [Google Scholar] [CrossRef]
- Zhang, Y.M.; Shen, Z.H.; Ni, X.W. Modeling and simulation on long pulse laser drilling processing. Int. J. Heat Mass Tran. 2014, 73, 429–437. [Google Scholar] [CrossRef]
- Shen, H.; Feng, D.; Yao, Z. Modeling of underwater laser drilling of alumina. J. Manuf. Sci. Eng. 2016, 139, 041008. [Google Scholar] [CrossRef]

| Parameter | Nomenclature | Value |
|---|---|---|
| Solidus temperature (K) | Ts | 1877 |
| Liquidus temperature (K) | Tl | 1923 |
| Melting temperature (K) | Tm | 1900 |
| Boiling temperature (K) | Tb | 3315 |
| Ambient temperature (K) | Ta | 298.15 |
| Solidus density (kg m−3) | ρs | 4420 |
| Liquidus density (kg m−3) | ρl | 4000 |
| Dynamic viscosity (Pa s) | μ | 0.005 |
| Solidus thermal conductivity (Wm−1 K−1) | ks | 21 |
| Liquidus thermal conductivity (Wm−1 K−1) | kl | 29 |
| Solidus specific heat (Jkg−1 K−1) | Cp-s | 670 |
| Liquidus specific heat (Jkg−1 K−1) | Cp-l | 831 |
| Convective coefficient (Wm−2 K−1) | h | 10 |
| Temperature derivative of surface tension (Nm−1 K−1) | ∂γ/∂T | −2.8 × 10⁻⁴ |
| Latent heat of melting (Jkg−1) | Lm | 2.86 × 10⁵ |
| Emissivity | ε | 0.6 |
| Absorptivity | α0 | 0.3 |
| Polishing Parameter (Unit) | Nomenclature | Value |
|---|---|---|
| Laser beam radius (mm) | R0 | 0.135 |
| Laser power (W) | P | 150 |
| Laser scanning speed (mm s−1) | v | 300 |
| Laser heating duration (ms) | th | 3.5 |
| Cooling duration (ms) | tc | 0.3 |
| Boundary Condition | Boundary (See Figure 1) | Physical Condition |
|---|---|---|
| Boundary heat source | 1 | Laser radiation |
| Convection | 1, 2, 3 | Natural convection |
| Diffuse surface | 1, 2, 3 | Radiation |
| Thermal insulation | 4 | Insulation |
| Capillary force | 1 | Weak contribution |
| Themocapillary force | 1 | Marangoni effect |
| Wall | 2, 3,4 | No slip wall |
| Parameter (Unit) | Top Layer | The Rest |
|---|---|---|
| Maximum element size (μm) | 0.8 | 20 |
| Minimum element size (μm) | 0.002 | 0.024 |
| Maximum element growth rate | 1.05 | 1.1 |
| Curvature factor | 0.2 | 0.2 |
| Ti | Al | V | C | Fe | O | N |
|---|---|---|---|---|---|---|
| Balance | 5.50–6.75 | 3.50–4.50 | 0.08 | 0.30 | 0.20 | 0.05 |
Publisher’s Note: MDPI stays neutral with regard to jurisdictional claims in published maps and institutional affiliations. |
© 2021 by the authors. Licensee MDPI, Basel, Switzerland. This article is an open access article distributed under the terms and conditions of the Creative Commons Attribution (CC BY) license (https://creativecommons.org/licenses/by/4.0/).
Share and Cite
Li, K.; Zhao, Z.; Zhou, H.; Zhou, H.; Yin, J.; Zhang, W.; Zhou, G. Numerical Simulation of Effect of Different Initial Morphologies on Melt Hydrodynamics in Laser Polishing of Ti6Al4V. Micromachines 2021, 12, 581. https://doi.org/10.3390/mi12050581
Li K, Zhao Z, Zhou H, Zhou H, Yin J, Zhang W, Zhou G. Numerical Simulation of Effect of Different Initial Morphologies on Melt Hydrodynamics in Laser Polishing of Ti6Al4V. Micromachines. 2021; 12(5):581. https://doi.org/10.3390/mi12050581
Chicago/Turabian StyleLi, Kai, Zhenyu Zhao, Houming Zhou, Hao Zhou, Jie Yin, Wei Zhang, and Guiyao Zhou. 2021. "Numerical Simulation of Effect of Different Initial Morphologies on Melt Hydrodynamics in Laser Polishing of Ti6Al4V" Micromachines 12, no. 5: 581. https://doi.org/10.3390/mi12050581
APA StyleLi, K., Zhao, Z., Zhou, H., Zhou, H., Yin, J., Zhang, W., & Zhou, G. (2021). Numerical Simulation of Effect of Different Initial Morphologies on Melt Hydrodynamics in Laser Polishing of Ti6Al4V. Micromachines, 12(5), 581. https://doi.org/10.3390/mi12050581


