3.1. Effect of Processing Parameters on Waveguide Track with Periodic Patterns
Propagation loss measurements were carried out on all the waveguides fabricated by the Ti:Sapphire femtosecond laser and PI stage through coupling fibers to the waveguides. The output power after propagation through the waveguide with a different length was measured based on the cut-off method. It was found that the optimal single-scan waveguide with the lowest propagation loss of about 0.6 dB/cm at 976 nm was fabricated using a translation velocity of 100 μm/s and pulse energy of 1.6 μJ. For multiscan fabricated waveguides, the optimal processing parameters were a scanning speed of 500 μm/s, pulse energy of 0.9 μJ, and 8 repetitive scans, yielding to a propagation loss of 0.3 dB/cm.
Figure 1 shows standard images of femtosecond laser’s written optimal waveguides in fused silica. In
Figure 1a,b, the guided near-field modes at 976 nm are captured for the optimal single-scan and multiscan waveguides, respectively. The single-scan waveguide had a horizontal diameter (full width at half maximum) of 7.5 μm and a vertical diameter of 7.7 μm. The mode field of the multiscan waveguide was symmetric, with a horizontal diameter of 6.4 μm and a vertical diameter of 6.1 μm. Therefore, the beam-shaping method used here is rather successful in delivering quasi-circular profiles. The reason for the difference between two mode fields lies in the obtained maximum refractive index change that was measured to be 1.4 × 10
−3 and 2.1 × 10
−3 at 976 nm for single-scan and multiscan waveguides, respectively (the refractive index distribution is obtained through the reverse deduction of the scalar wave equation from near-field mode distribution). The PCM images in
Figure 1c,d reinforce this evidence in which the single-scan waveguide track has a lighter color and smaller index contrast, leading to a larger guided mode. What needs to be highlighted is that positive index changes appear dark in the PCM images, while light zones indicate a negative index. Interestingly, there are regular oscillatory patterns inside the single-scan waveguide track, compared with the multiscan waveguide, as shown in
Figure 1c. Therefore, oscillatory patterns are linked to nearly periodic type I refractive index changes induced in the space by femtosecond laser modification, with a period in the range of 2 μm. The onset of this periodic refractive index change may be one of the reasons for the higher propagation loss of the single-scan waveguide, resulting in the periodic perturbation and the rugged interfaces. Consequently, some incident light might be dissipated through scattering with nonuniformities. The better guiding in the multiscan waveguide is mainly related to better mode confinement, and the roughness of the guide interface is smoother. In addition, because the normalized frequencies of these two waveguides are different, the less-confined mode is another reason for propagation loss.
The influence of laser processing parameters on the characteristics of oscillatory patterns was further investigated using the single-scan technique, including laser pulse energy, polarization direction, and scanning speed. The laser polarization angle was rotated to be 0°, 45°, and 90° with respect to the scanning direction by rotating the other half-wave plate in the experiments. Our result, shown in
Figure 2, demonstrates that laser polarization has no impact on the orientation of the periodic patterns. However, a previous work exhibited that both laser polarization and scanning direction have influenced the self-organized planes arising from the quill or nonreciprocal writing effect [
19]. These nanogratings were linked to a process of light scattering and interference [
20]. The independence to polarization here, in addition to the spacing, indicates that a different formation mechanism is at work. We observed a relatively smooth waveguide trace when the pulse energy was no more than 1.0 μJ, at the fixed scanning speed of 100 μm/s. With an increase in the pulse energy, the periodic patterns become apparent. The phenomenon is in agreement with the observation of
Figure 1d: no observably periodic patterns are seen at a low energy value of 0.9 μJ using the multiscan technique, because of homogenizing treatment for multiple scanning and lower index change induced by lower pulse energy. The average period is little influenced as the pulse energy is higher than 1.4 μJ at the scanning speed of 250 μm/s, as shown in
Figure 3. Moreover, the robustness of periodic structures becomes worse with the random overlay of multiperiod patterns and short-range disorder when waveguides were formed by larger pulse energy of 3.0 μJ, as shown in
Figure 3c. The glass matrix was damaged with type II periodic patterns inside when the laser energy further increases. The orientation of the damaged periodic pattern is perpendicular to the pattern in type I waveguide, and the period is in a magnitude of micrometer, which is not the focus in this work and is not discussed here.
Then, we repeated the experiments to investigate the influence of pulse energy and polarization direction on the characteristics of oscillatory patterns with Yb:KGW laser processing system. It was also proved that laser polarization and pulse energy have little impact on the orientation and the period of oscillating patterns, respectively. Furthermore,
Figure 4a,b show the longitudinal profiles of the single-scan waveguides with different scanning speeds and scanning directions. In
Figure 4a, the overall amplitude of the refractive index change and the cross-sectional size of waveguides decreased as the scanning speed increased. The periodicities of these modulated patterns were 2.2, 4.3, and 6.5 μm, at the scanning velocities of 100, 200, and 300 μm/s, respectively. This indicates a linear scaling between the dose and the period. Interestingly enough, the time interval between processing each neighboring pattern is ~22 ms. Observable pattern-embedded or smooth, structureless waveguides were not obtained with the scanning speed higher than 600 μm/s due to the decrease in laser energy per unit volume. This experiment was repeated with the Ti:Sapphire femtosecond laser and Aerotech stage, shown in
Figure 5. The periodicities of these modulated patterns fabricated were 2.2, 6.6, and 13.1 μm, at the scanning velocities of 100, 300, and 600 μm/s, respectively. The same time period was obtained, which shows that the fabrication of modulated patterns can be well repeated. At the same time, it is demonstrated that laser wavelength and pulse width have no impact on the periodicity of the modulated patterns. The relative orientation between the confocal geometry and the slit is also of importance. In
Figure 4b, the angle between the scanning direction and the vertical direction is 45 degrees and 30 degrees, respectively, while the position of the slit is fixed and shown in the yellow box, indicating that the beam was shaped in the horizontal direction. This shows that the direction of modulated patterns has no link with the scanning direction. Then, by comparing
Figure 4a,b based on the above conclusion, we can see that the direction of periodic modulations is always parallel to the slit-beam-shaping direction. We recall that the focused spot through slit shaping is similar to a disk that has expanded in the horizontal direction and remains unchanged vertically, shown in
Figure 4b. As a result, the waveguide tracks were produced similarly to imprinting the footprint of the disk in a piece-by-piece manner. However, the angle between the scanning direction and the long axis of the slit cannot be too large; otherwise, the influence of rectangular aperture on the aspect ratio of femtosecond written waveguides will lose its meaning. For instance, the waveguide track had little type II damage when the included angle between the writing direction and the long side of the slit was 45 degrees. This result reveals that the oscillatory index patterns fabricated by 1030 nm femtosecond laser are less visible than those generated by 780 nm femtosecond laser. The energy window for type I waveguide and the increase in refractive index change become smaller: No refractive index changes are generated with lower energy pulses, and the irradiated region is catastrophically damaged with higher energy due to the longer pulse duration of the Yb laser. The pulse width of Yb:KGW femtosecond laser is 225 fs, close to the upper limit of the pulse width for fabrication of type I waveguide in fused silica. In addition, from
Figure 5, we can see that the larger modulation period is obtained with a larger scanning speed, to extend the modulation range under the premise of a great increase in the overall index change in waveguide track.
3.2. Raman and SEM Analysis
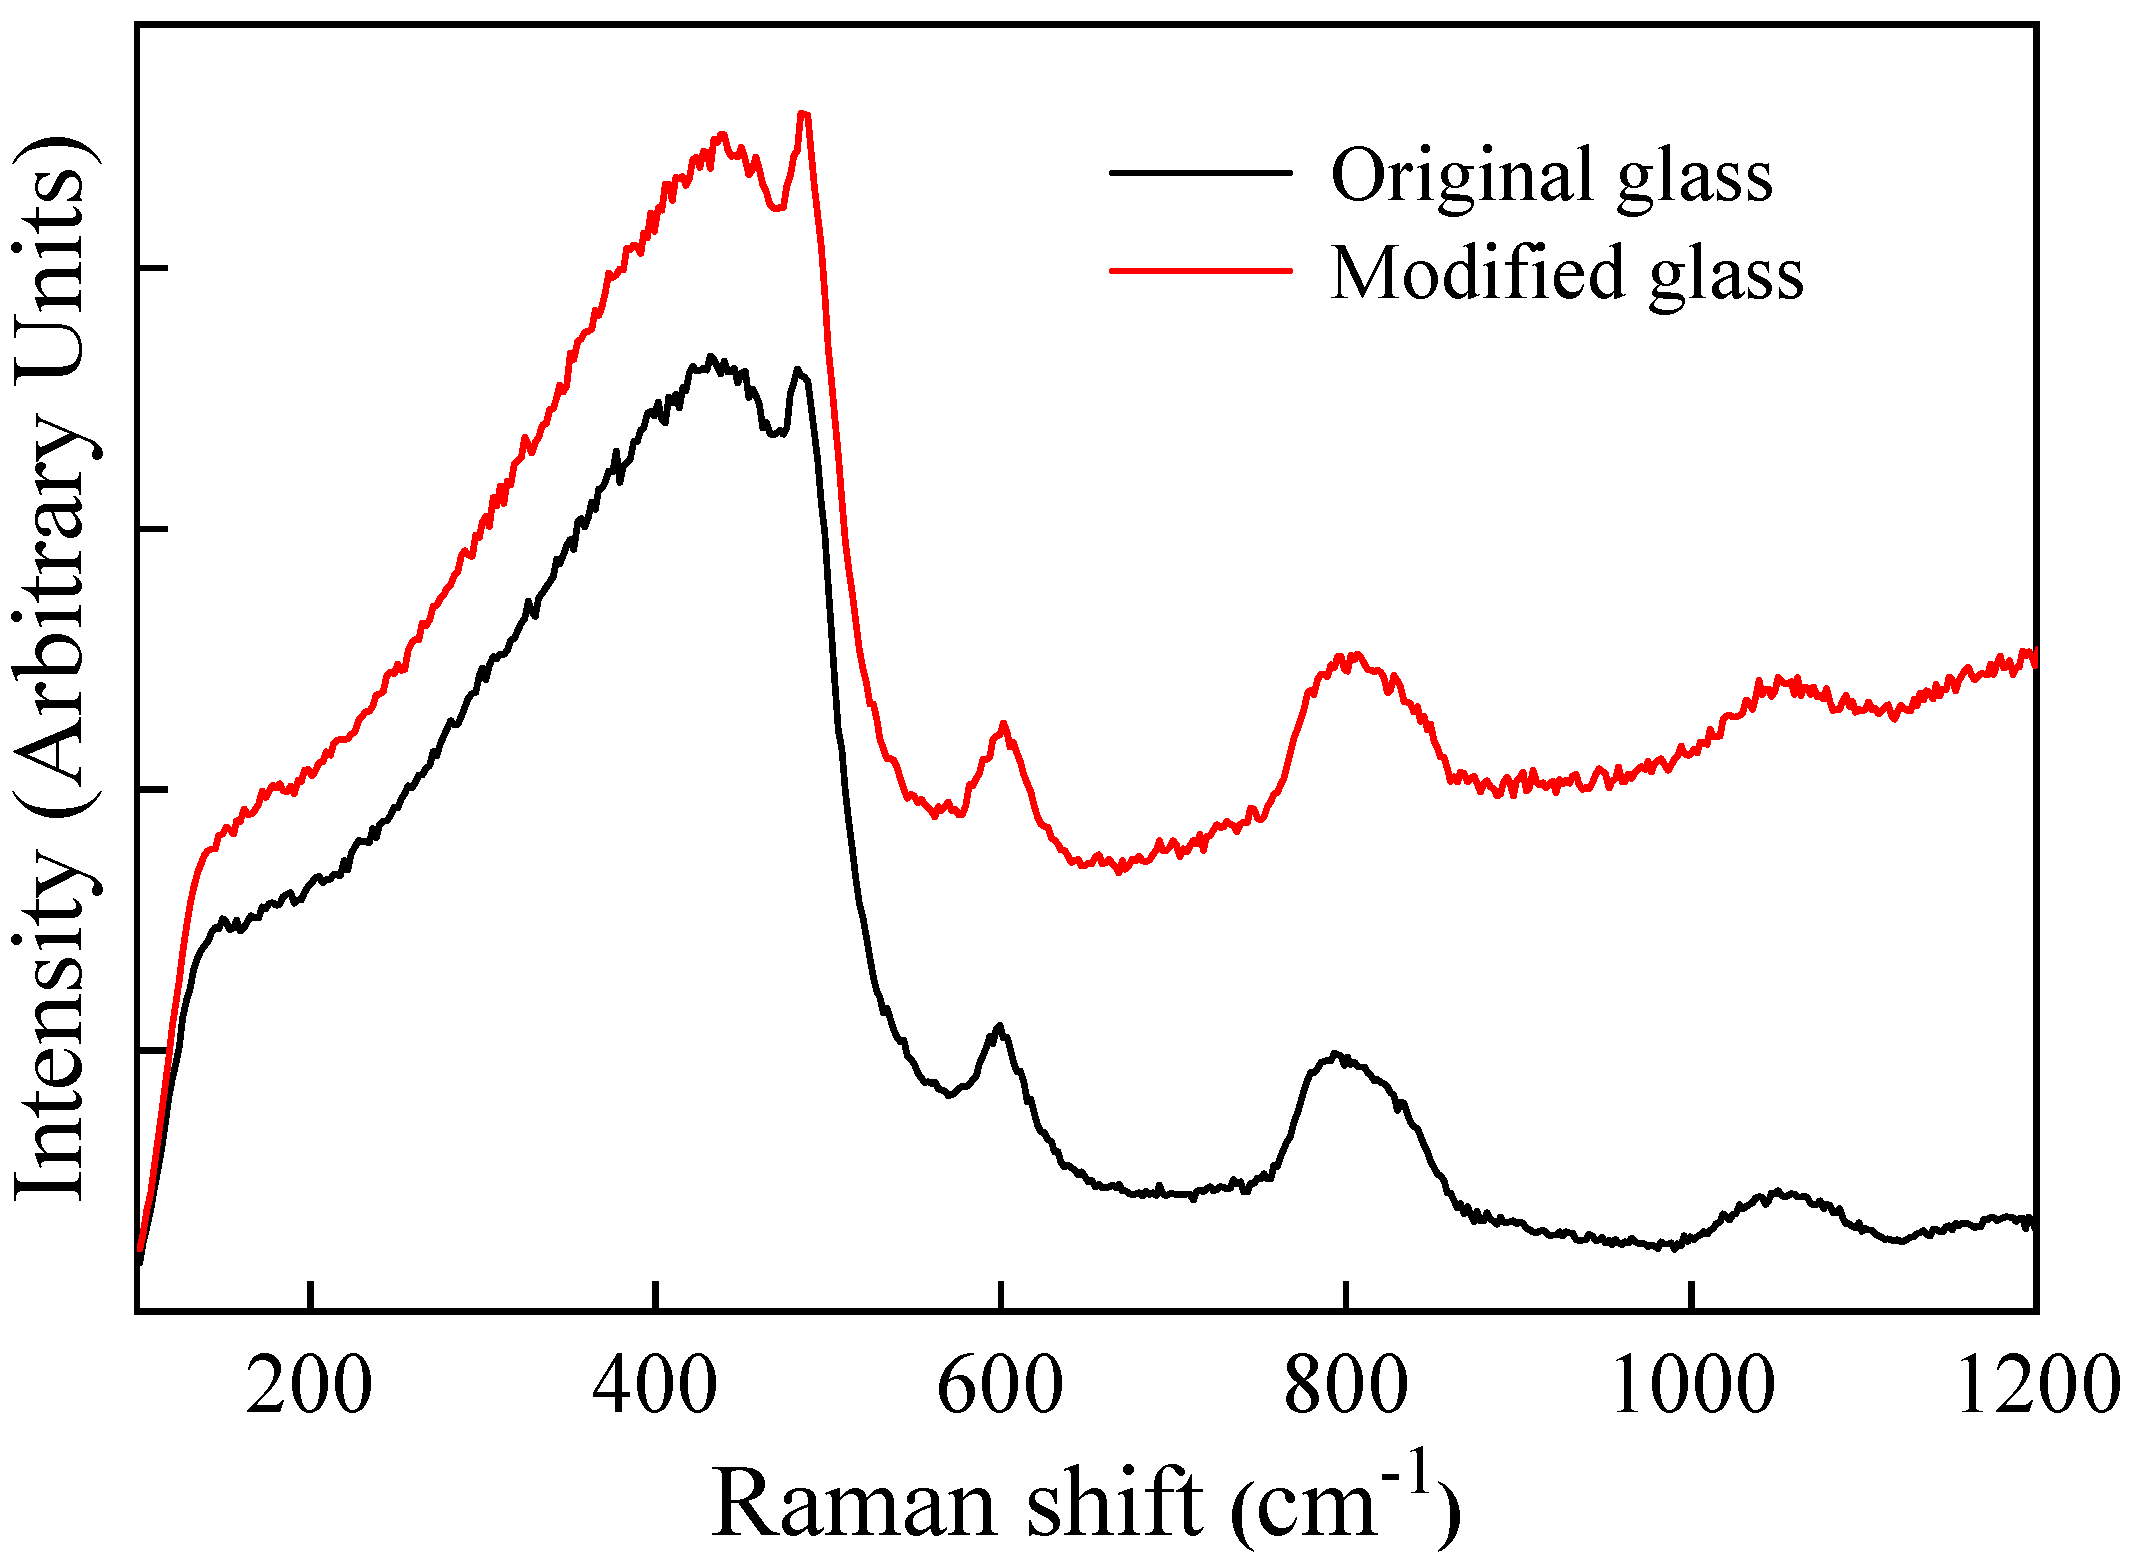
Figure 6 compares the Raman spectra of the original glass and the modified glass under the irradiation condition of the pulse energy of 1.6 μJ and scanning speed of 100 μm/s. One can see that the fluorescence effect of laser irradiation is obvious, due to the formation of nonbridging oxygen hole centers after the breakage of the Si-O bond [
21]. There is no significant variation in the Raman peak ratio across the modified region, which is in agreement with the result in Ref. [
22]. The two main causes were that (1) the lower energy deposition in the focal volume induced a small incremental change of three-membered and four-membered ring structures, and (2) the polishing treatment before Raman analysis increases the surface pressure, resulting in the densification of the whole cross section of the waveguide. In addition, the Raman linear mapping on the oscillatory-patterns-embedded waveguides was generated. Unfortunately, the refractive index change of the periodic oscillations is too small to reflect the change in the intensity and shift of the characteristic peaks.
In order to clearly observe the spatial period of the microstructures, SEM images of waveguide tracks were captured after acidic corrosion treatment, as shown in
Figure 7. The etched grating planes are the isolated narrow, sheet-like cavities with a thickness of a few hundred nanometers and a lateral width equal to the waveguide diameter. The etch rate of the modulated regions with high and low refractive index change is different [
23]. It is known that the etch rate of femtosecond laser modified silica structure is approximately linearly dependent on the induced index of refraction change, at least up to index changes of = 0.01 [
23]. Erosion degree by acid etching increases when more structural defects appear in the focal volume. The most common defects produced in type I waveguide are the Si dangling bond with a trapped electron and nonbridging oxygens with unpaired electrons originating from laser-induced bond breaking [
24]. Therefore, in
Figure 7, the etched groove in region A stands for higher index change with many structural defects, while material present in region B seems to be little affected by the laser exposure. The area ratio of regions A and B is one major difference among modulated patterns formed with different scanning speeds. Specifically, region B becomes larger with the increase in the scanning speed; by contrast, the increase in the area of region A is relatively slow. In consequence, the index change in the waveguide track is periodically present. The two different etch rates in
Figure 7 are mainly caused by the number of structural defects. There are more structural defects in the laser spot center, as the excitation is at maximum, while the polishing depth is hard to control because of invisible waveguide tracks by the ordinary microscope.
3.3. Discussion on the Mechanism for the Formation of Periodic Patterns
We indicated the formation of periodic patterns along the waveguide track using a reshaped femtosecond laser beam. Even though in many cases femtosecond-laser-induced periodic patterns depend on the polarization of laser radiation and scale with the wavelength [
25], the orientation and size of the modulated patterns in our experiment are only related to beam shaping of the focal laser spot and scanning speed, i.e., the imprinting feedthrough. Therefore, the formation mechanism is not due to the electromagnetic perturbation but due to the energy delivery into a dynamic system with potential movement perturbation. In addition, we can see that the laser pulse energy has little effect on the spatial period but has a significant effect on the waveguide diameter. As higher pulse energy leads to the formation of larger modification structures, isotropic thermal diffusion extends the laser-heated region far outside the focal volume, as shown in
Figure 3. Since the scanning speed is directly determining the periodicity of modulated patterns, we monitored the position error and velocity error of the Aerotech stage.
Figure 8a shows the relationship between the scanning speeds and the position errors of the axis, which has the linear motion during the fabrication of straight waveguides. The frequency of position error in unit time is a constant value of ~45 Hz. This proves that position error of the stage is caused by intrinsic vibrations of the platform based on the measurement of the static displacement. The time interval between neighbor peaks of periodic position error is ~22.2 ms, which is equal to the time difference for neighbor microstructures, shown in
Figure 4a. Therefore, the period of the embedded patterns increases proportionally with scanning speed. It is worth noting that the maximum distance of neighbor peaks and valleys is ~65 nm at the speed of 100 μm/s and far less than the periodicity of the modulated microstructures.
Figure 8b exhibited the assumed displacement of the motion stage at the speed of 100 μm/s, whose position error was exaggerated with the sinusoidal amplitude (referring to the envelope of real error) higher than 19 times the measurement value. The motion displacement during an oscillating cycle is divided into two parts, corresponding to the shadow areas in
Figure 8b. In the first area, the glass matrix is irradiated 3 times by laser pulses; in the second area, the glass matrix is irradiated only once by relatively low-spatial-density laser pulses. As a consequence, the reasonable inference is that the glass is modified with the successive formation of high and low refractive index changes in the periodic patterns. Moreover, the low-index region has more area than the higher-index region, which is in accordance with
Figure 7b. In fact, the spatial spacing of the continuous pulses in our experiment is 2 nm, at the speed of 100 μm/s. Even though the actual position error of the motion stage is very small, the modified region can also be divided into enrichment zone and evacuation zone for laser pulses. Therefore, it is deduced that the small perturbation in the platform’s displacement is the trigger for the generation of periodic patterns. As the influence of motion perturbation in laser pulse space distribution will decrease, or even disappear, when the scanning speed further increases, the waveguide trace is more homogeneous without periodic patterns, as shown in
Figure 4a. For example, the spatial spacing of the continuous pulses in our experiment is 60 nm, at the speed of 3000 μm/s. The actual perturbation amplitude is only about 33 nm, which has little effect on the uniformity of laser pulse distribution.
The periodic experiment result may seem similar to self-organized bubble patterns fabricated as a consequence of thermal origin and cumulative energy deposition by laser pulse at a frequency of 9.4 MHz [
16], where the cumulative regime is evident at a repetition rate greater than 200 kHz [
26]. However, recent research has shown the relaxation dynamics occur in a large time window ranging from nanoseconds to microseconds after the irradiation of fused silica by femtosecond laser, in which molecular kinetics and structural rearrangements in low-viscosity phases play important roles [
27]. In addition, the characteristic timescale here is not consistent with the rapid shock and rarefaction scenario expected at high pressures [
28]. Therefore, we believe the thermal relaxation dynamics is another factor in the generation of periodic microstructures [
27,
29]. The small position perturbation is responsible for the perturbation of laser energy accumulation and evacuation accentuated, which influences both the dose and the focal position. The position perturbation is also considered to lead to small refocusing adjustments due to the thermos-optic effect, and cause a local temperature perturbation, which leads to temperature nonuniformity dynamics process with time. From
Figure 7a, we can see that the smoothness of the error curve is decreased, and the oscillation in peaks and valleys is more evident with the increase in the working speed. The influence of the displacement error at the greater scanning speed causes more nonuniform energy distribution in the writing path and further large structural change in the long-term behavior of the dynamical system. This is the probable reason why the region with a higher refractive-index increase in the modified periodic pattern becomes slightly wider with higher scanning speed, which is in line with the phenomenon in
Figure 4a and
Figure 6. More investigations need to be further carried out to elucidate the complex multiphysical mechanisms for the microstructure evolution embedded in type Ι waveguide written by femtosecond laser during thermomechanical processing.


