
A Combined Positioning Method Used for Identification of Concrete Cracks


Abstract
:1. Introduction
2. Analysis of Brillouin-Scattering-Based Sensing Principle and Time-Domain Localization Theory
3. Experiment
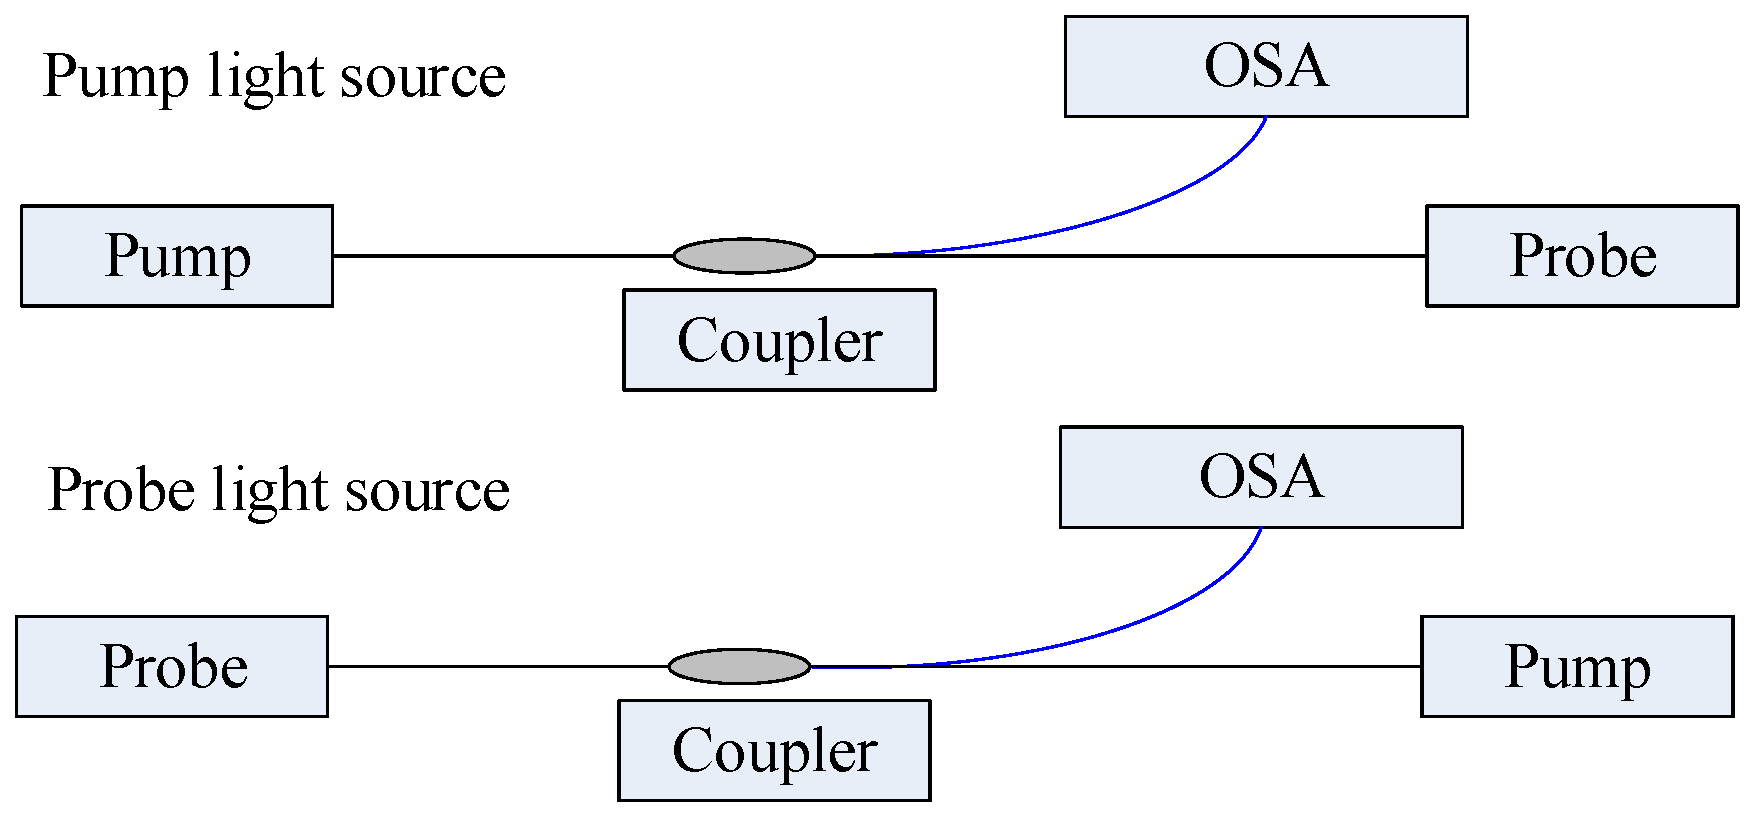
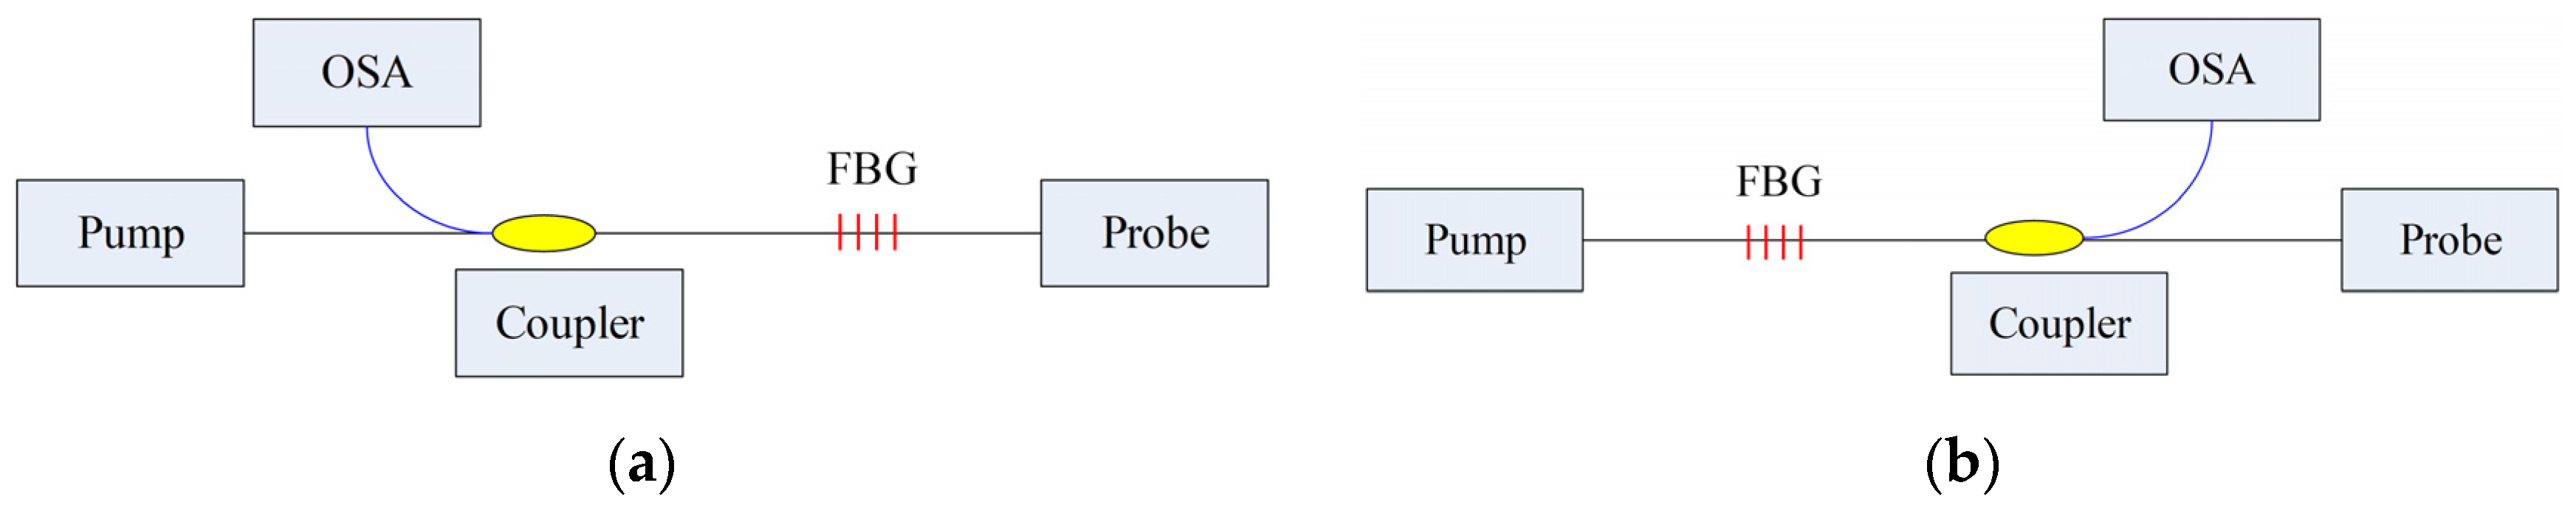
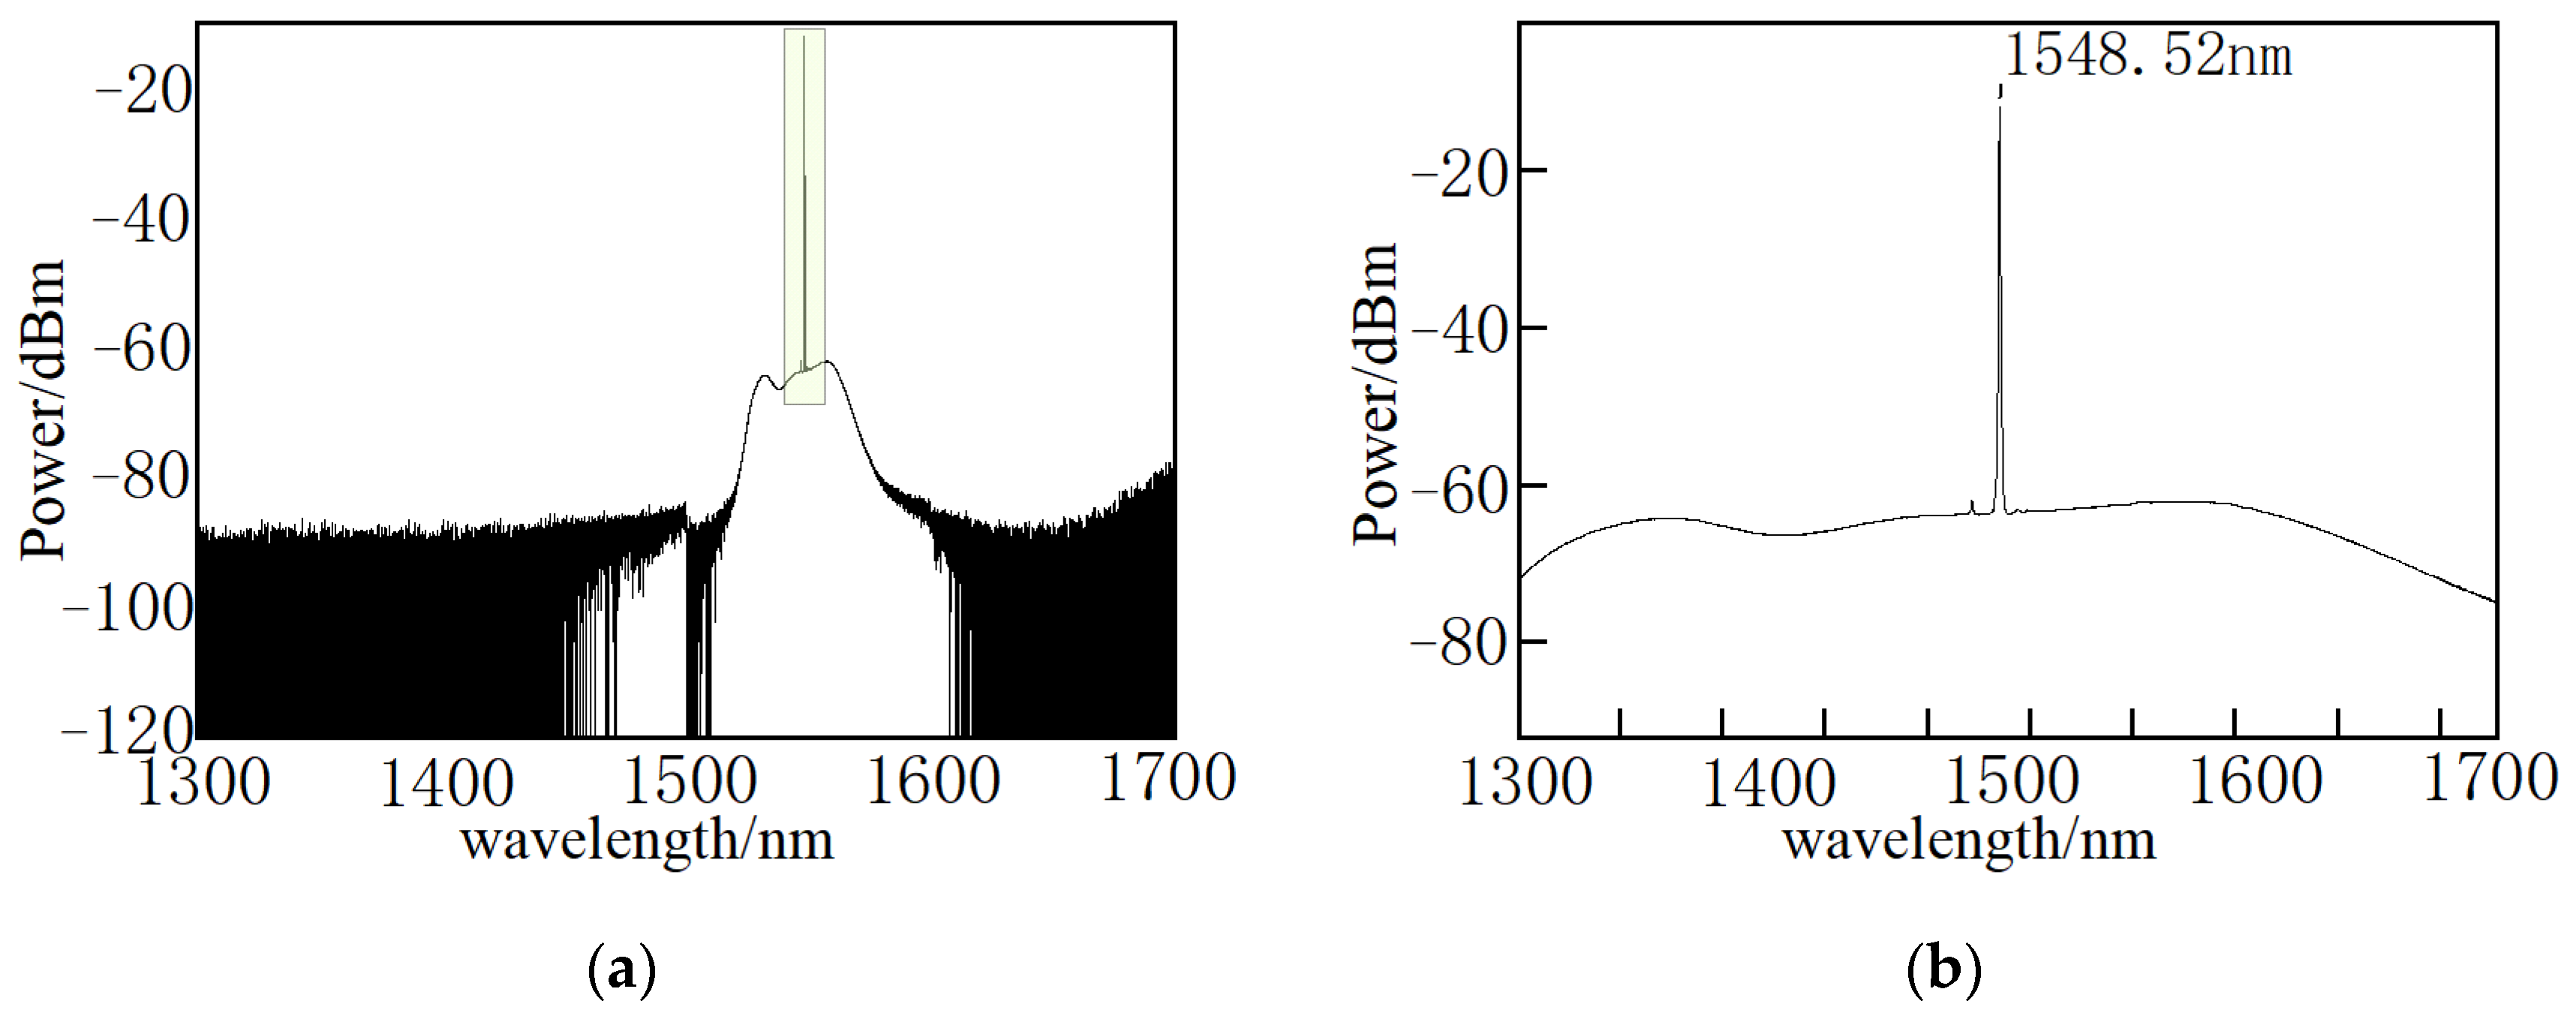
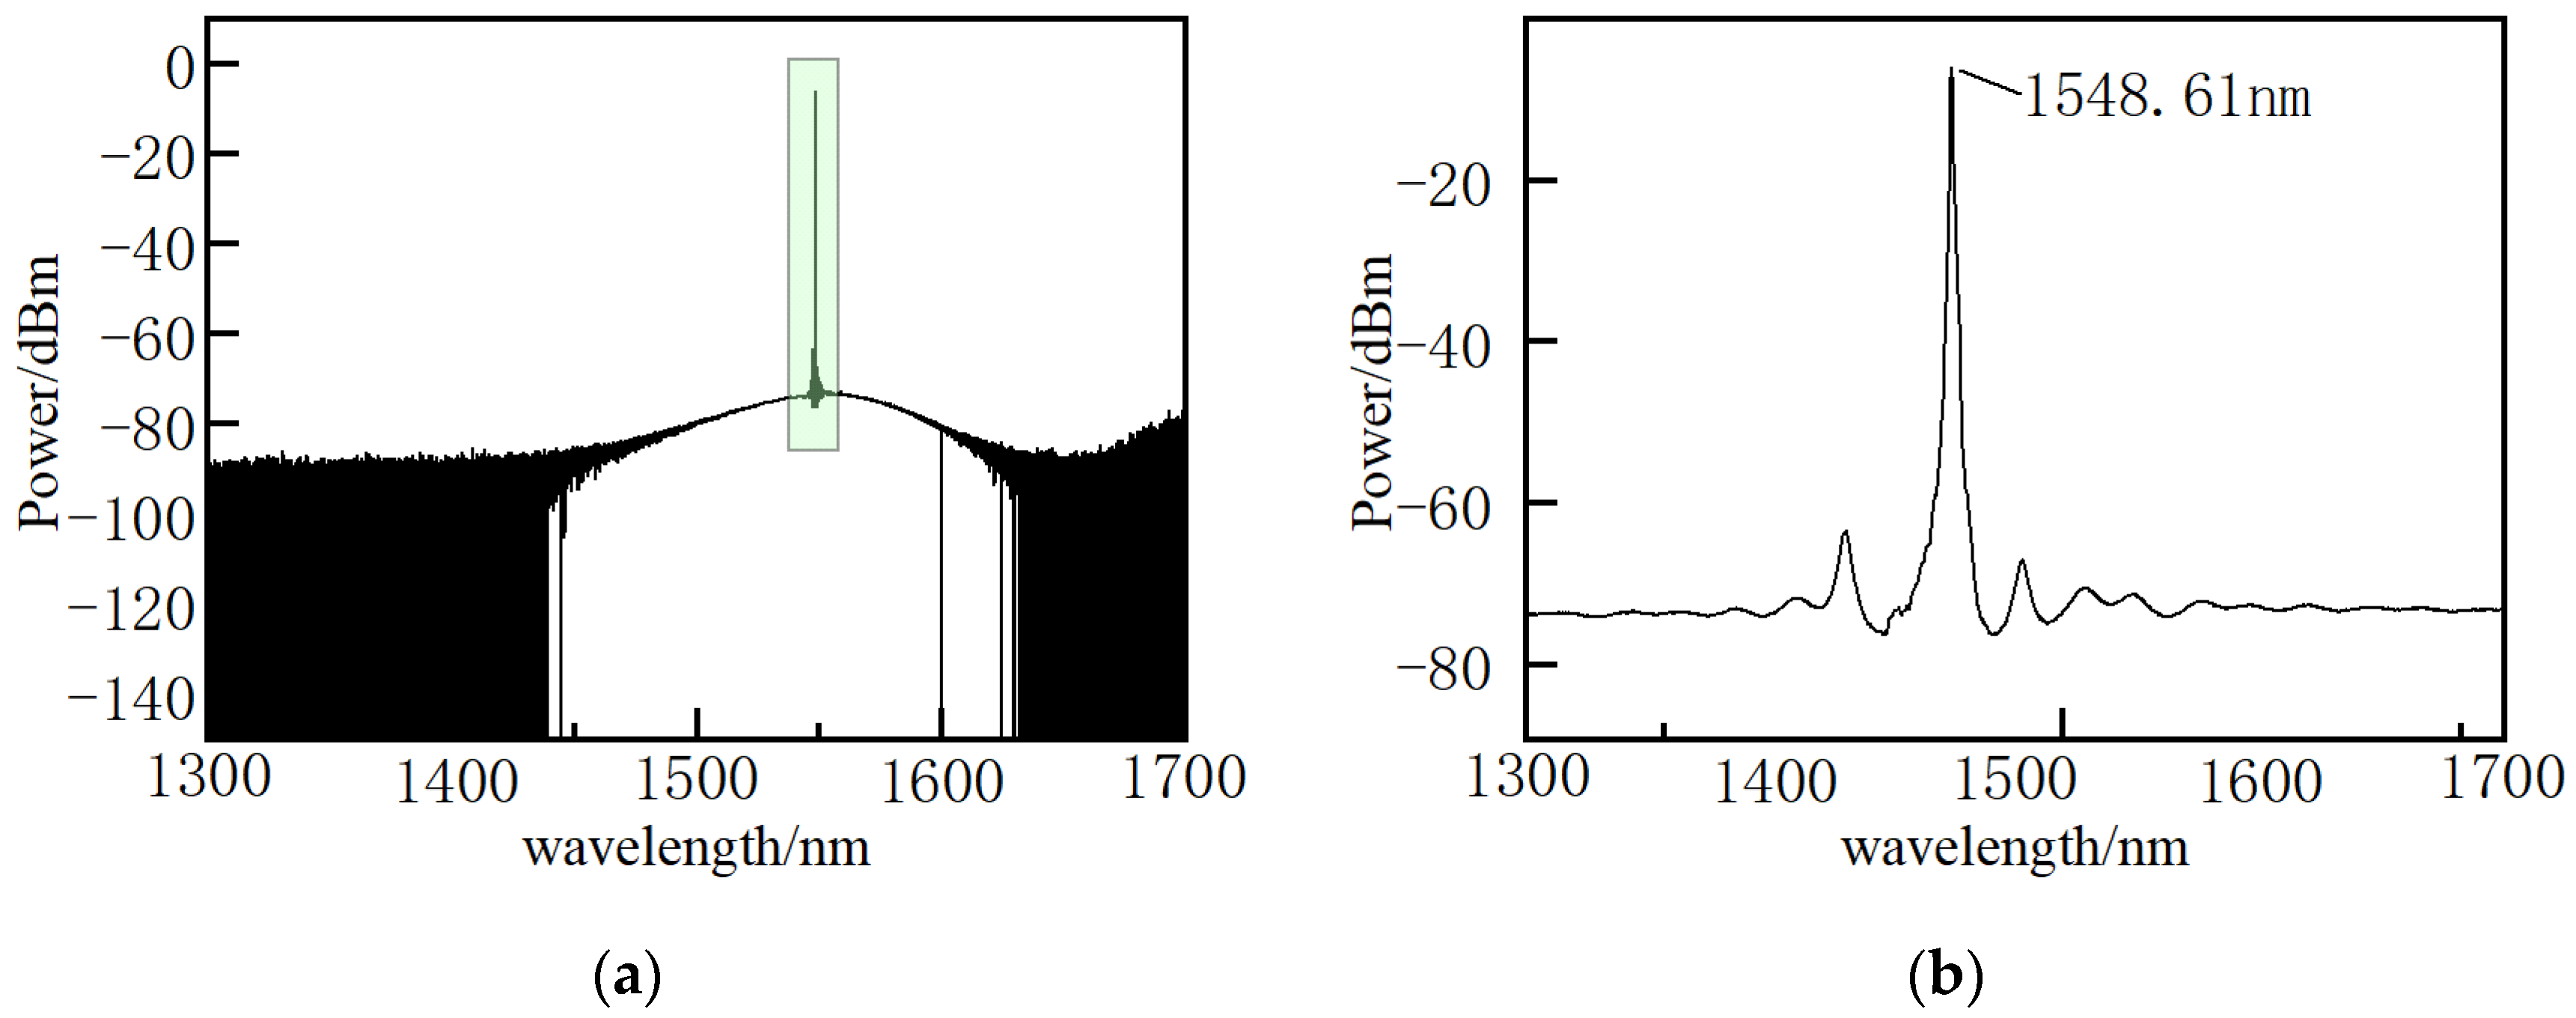
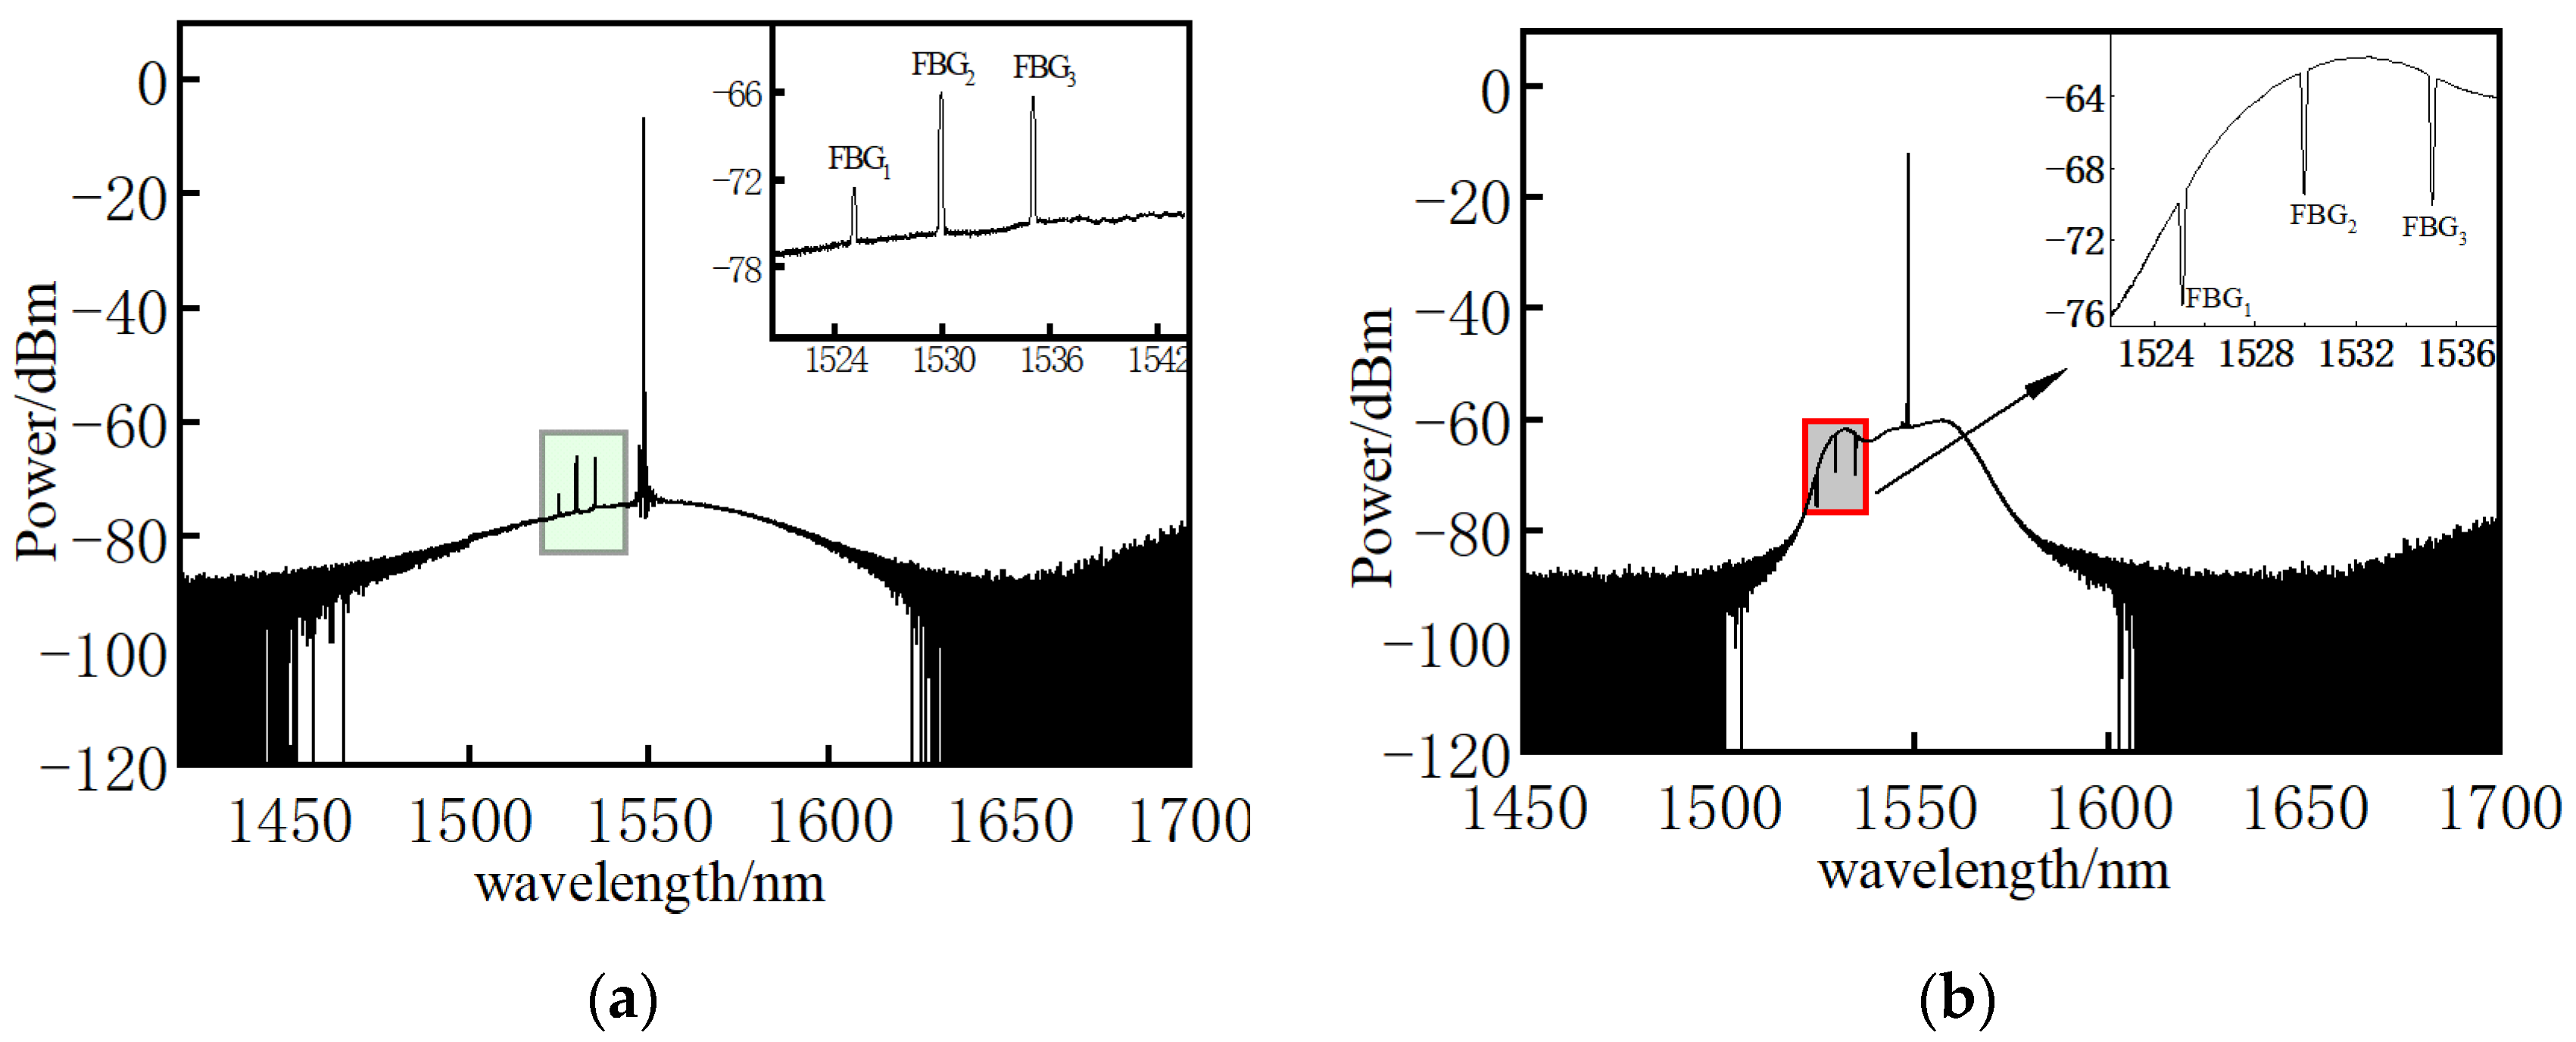
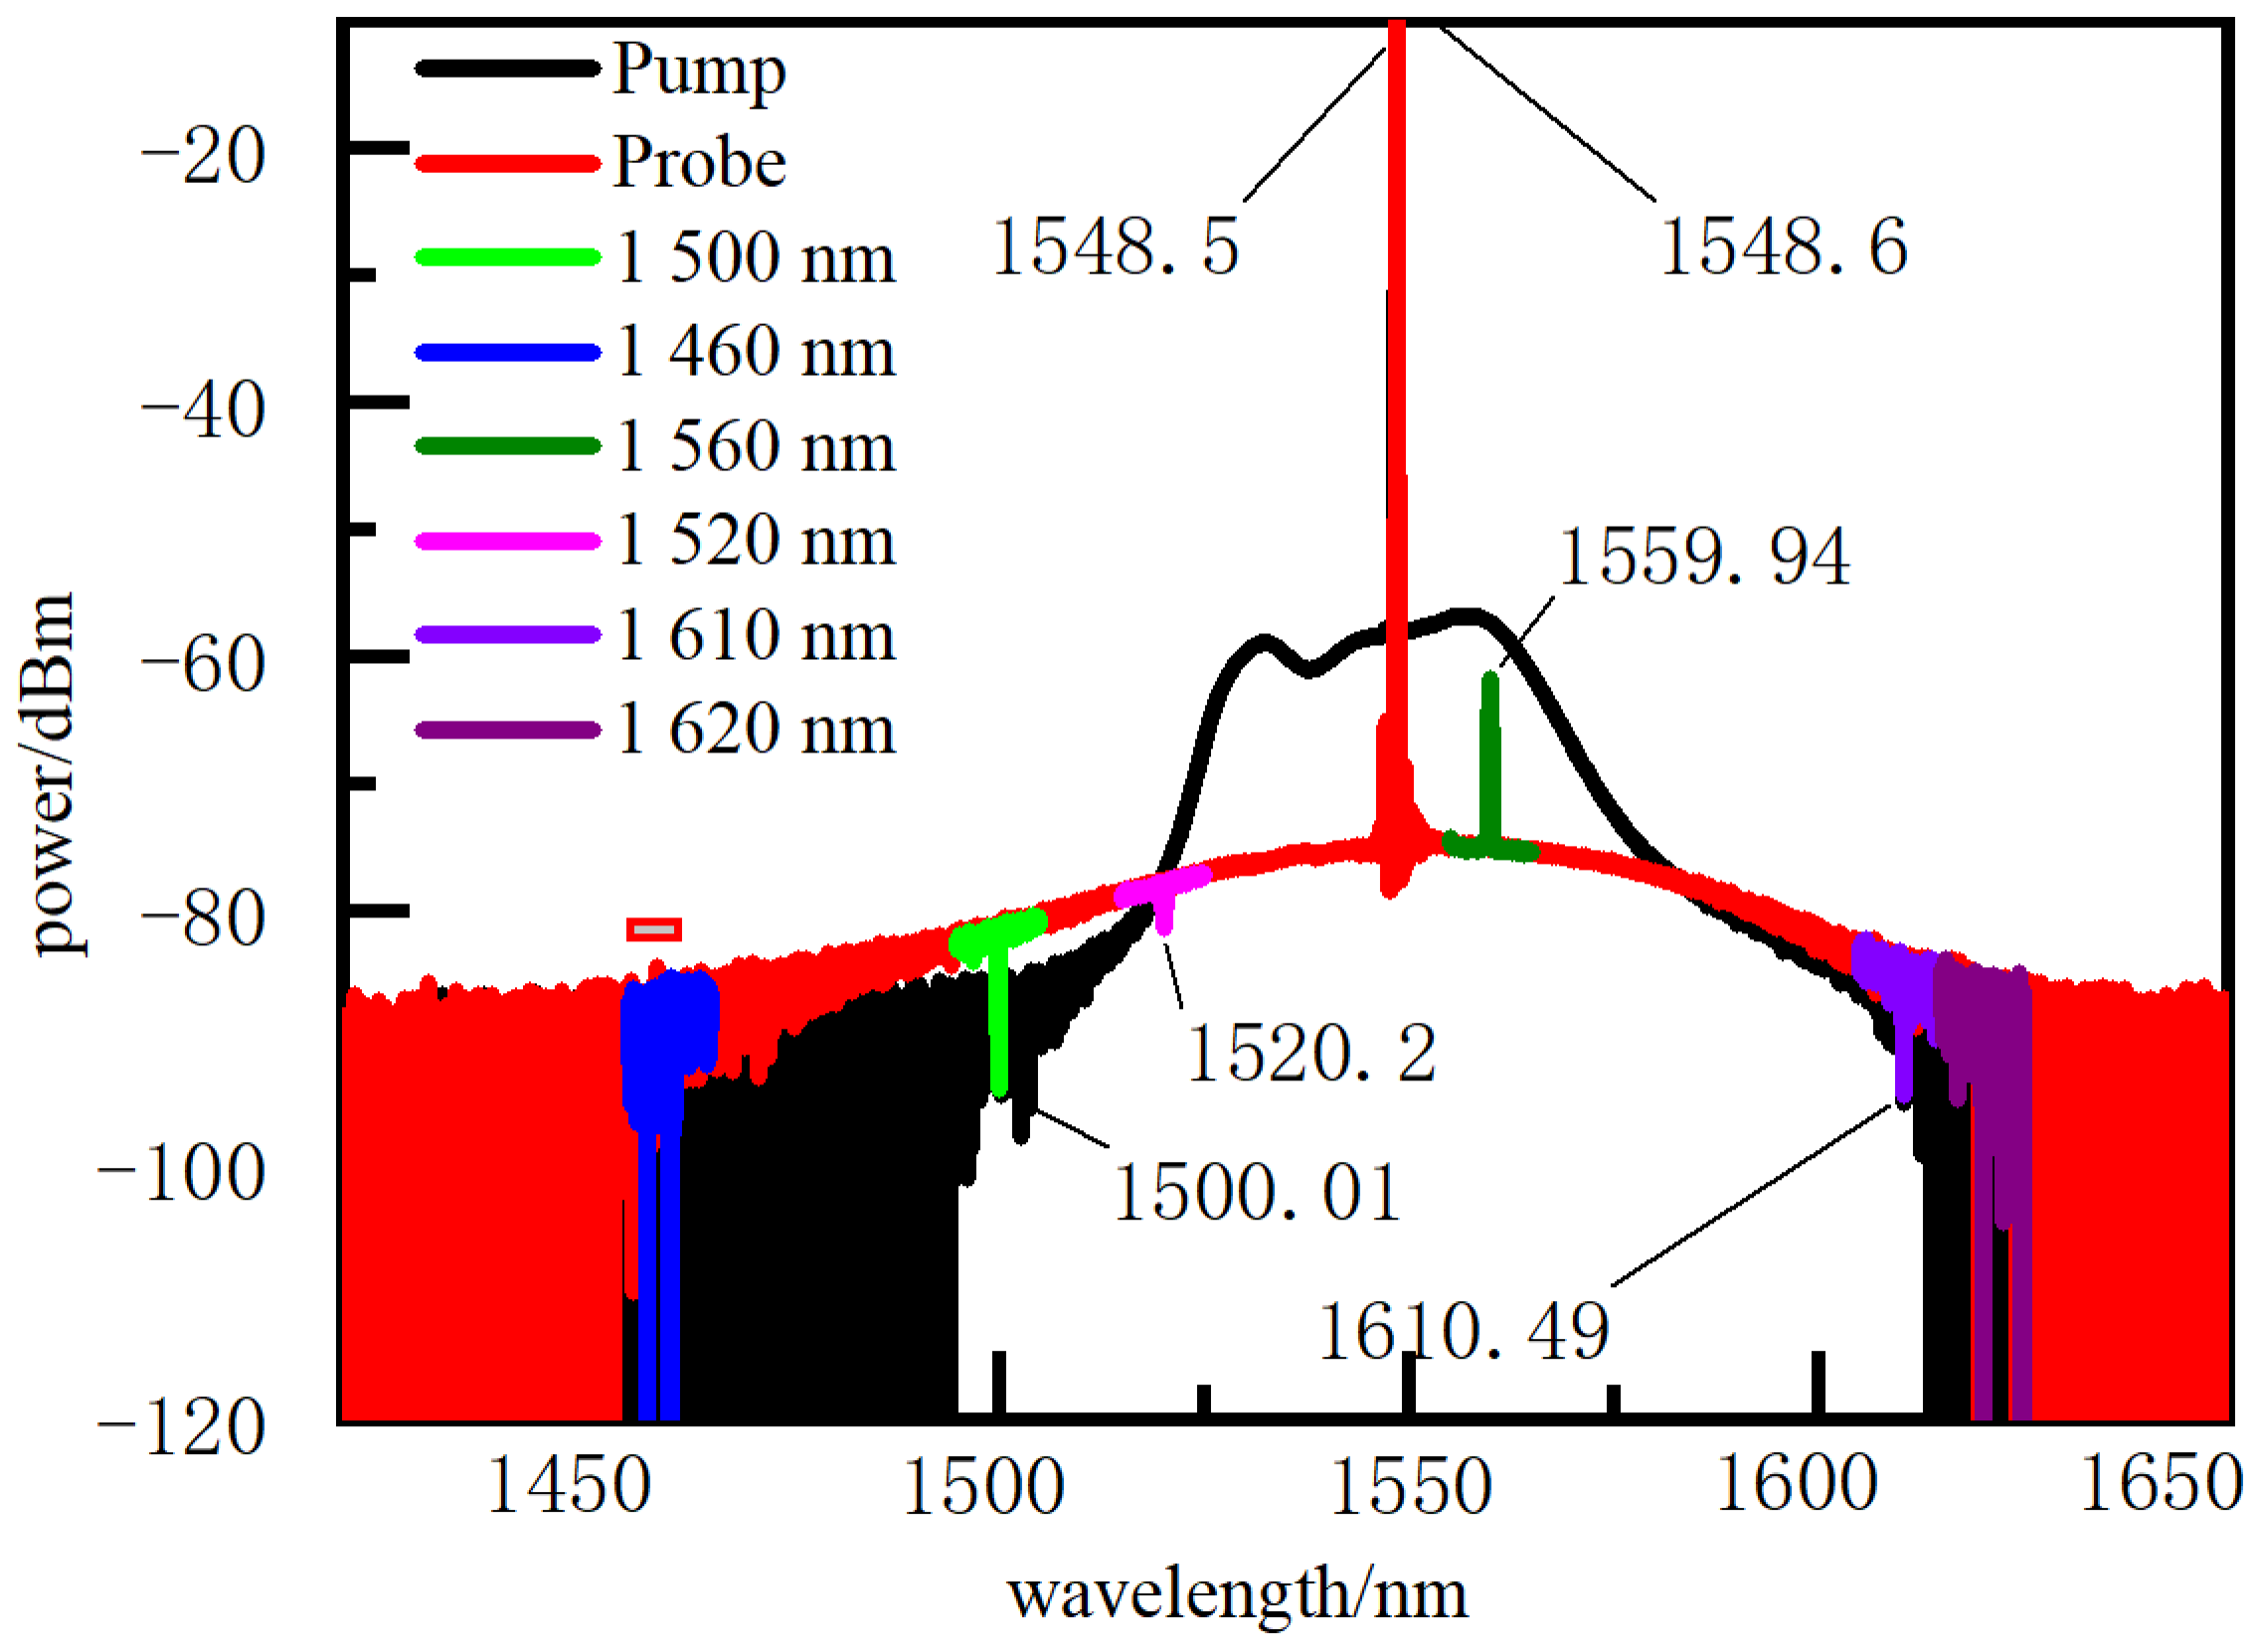
3.1. Coupling Test of Fiber Grating and Brillouin Scattering
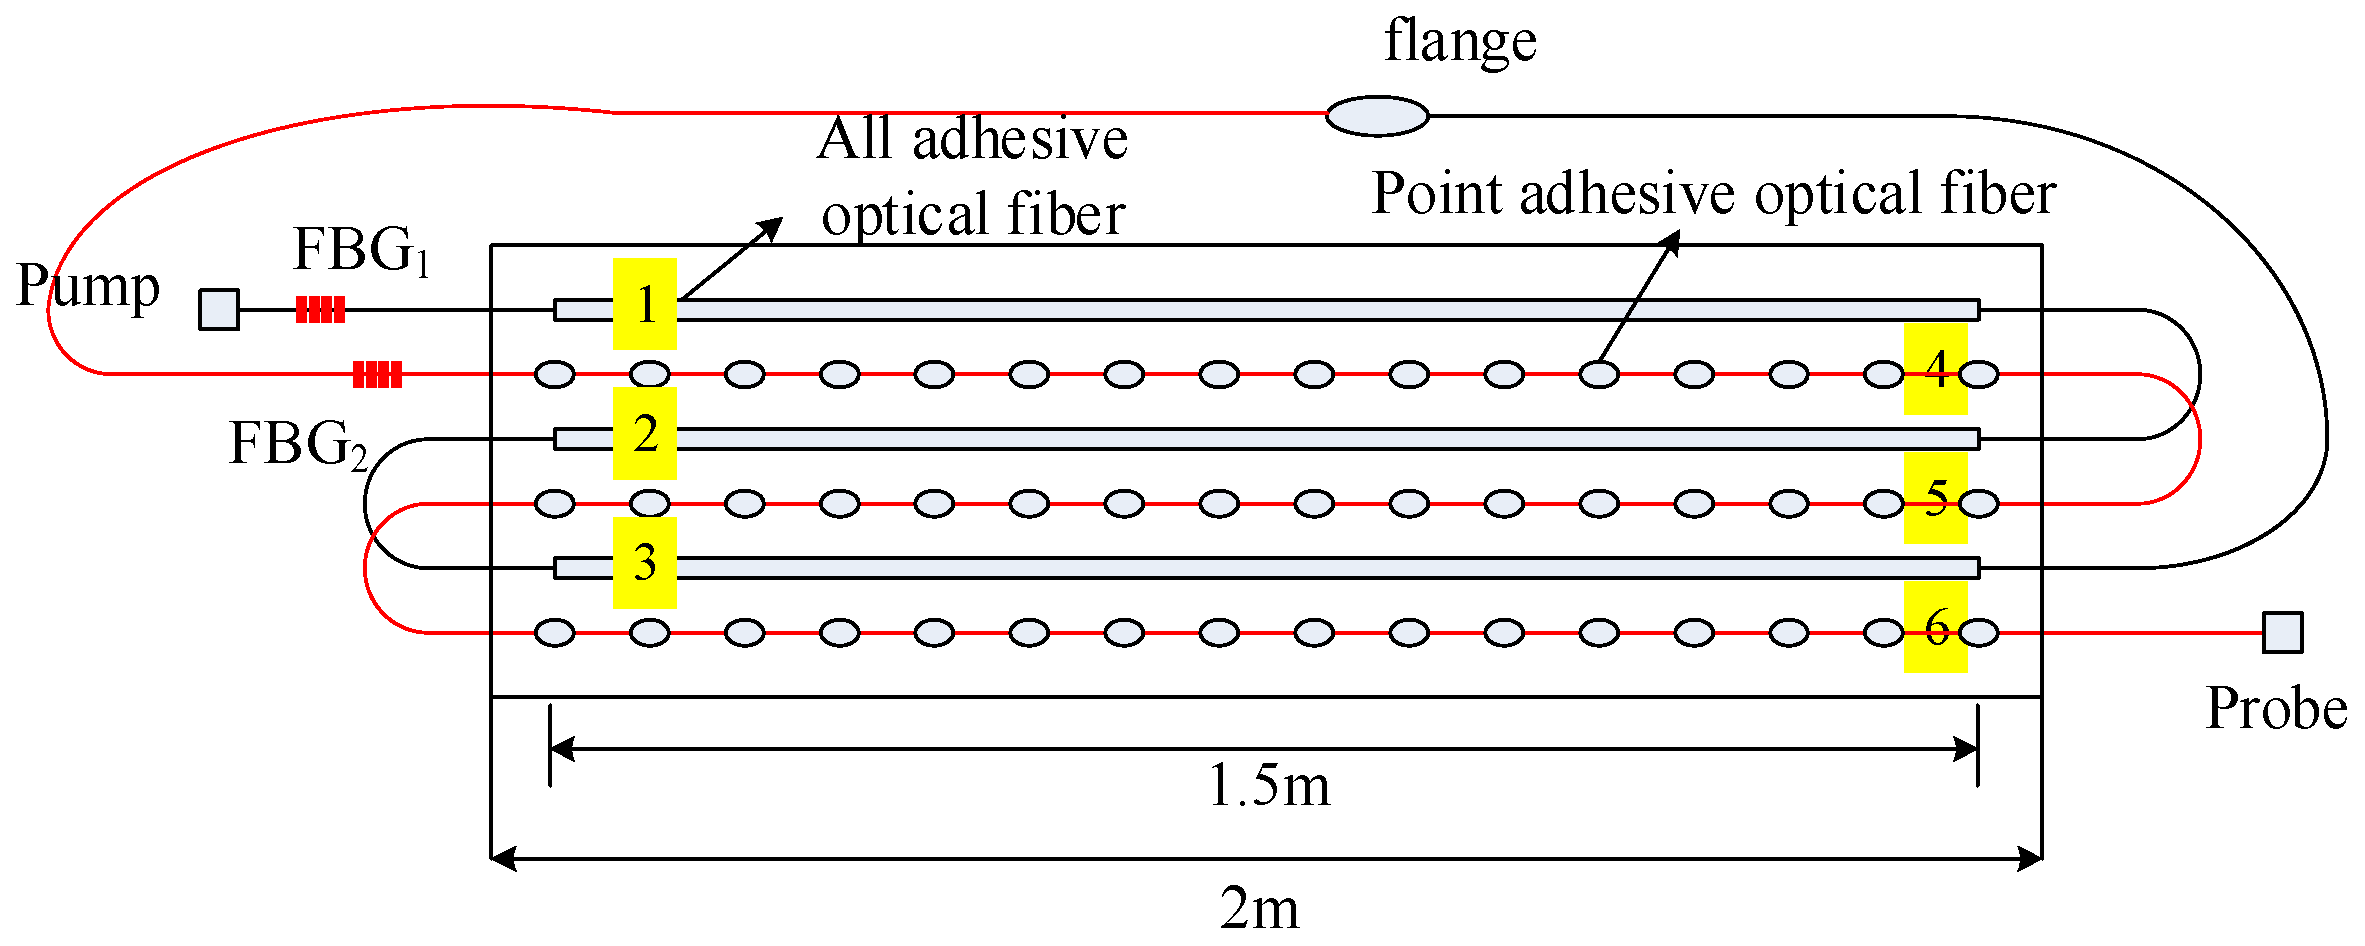
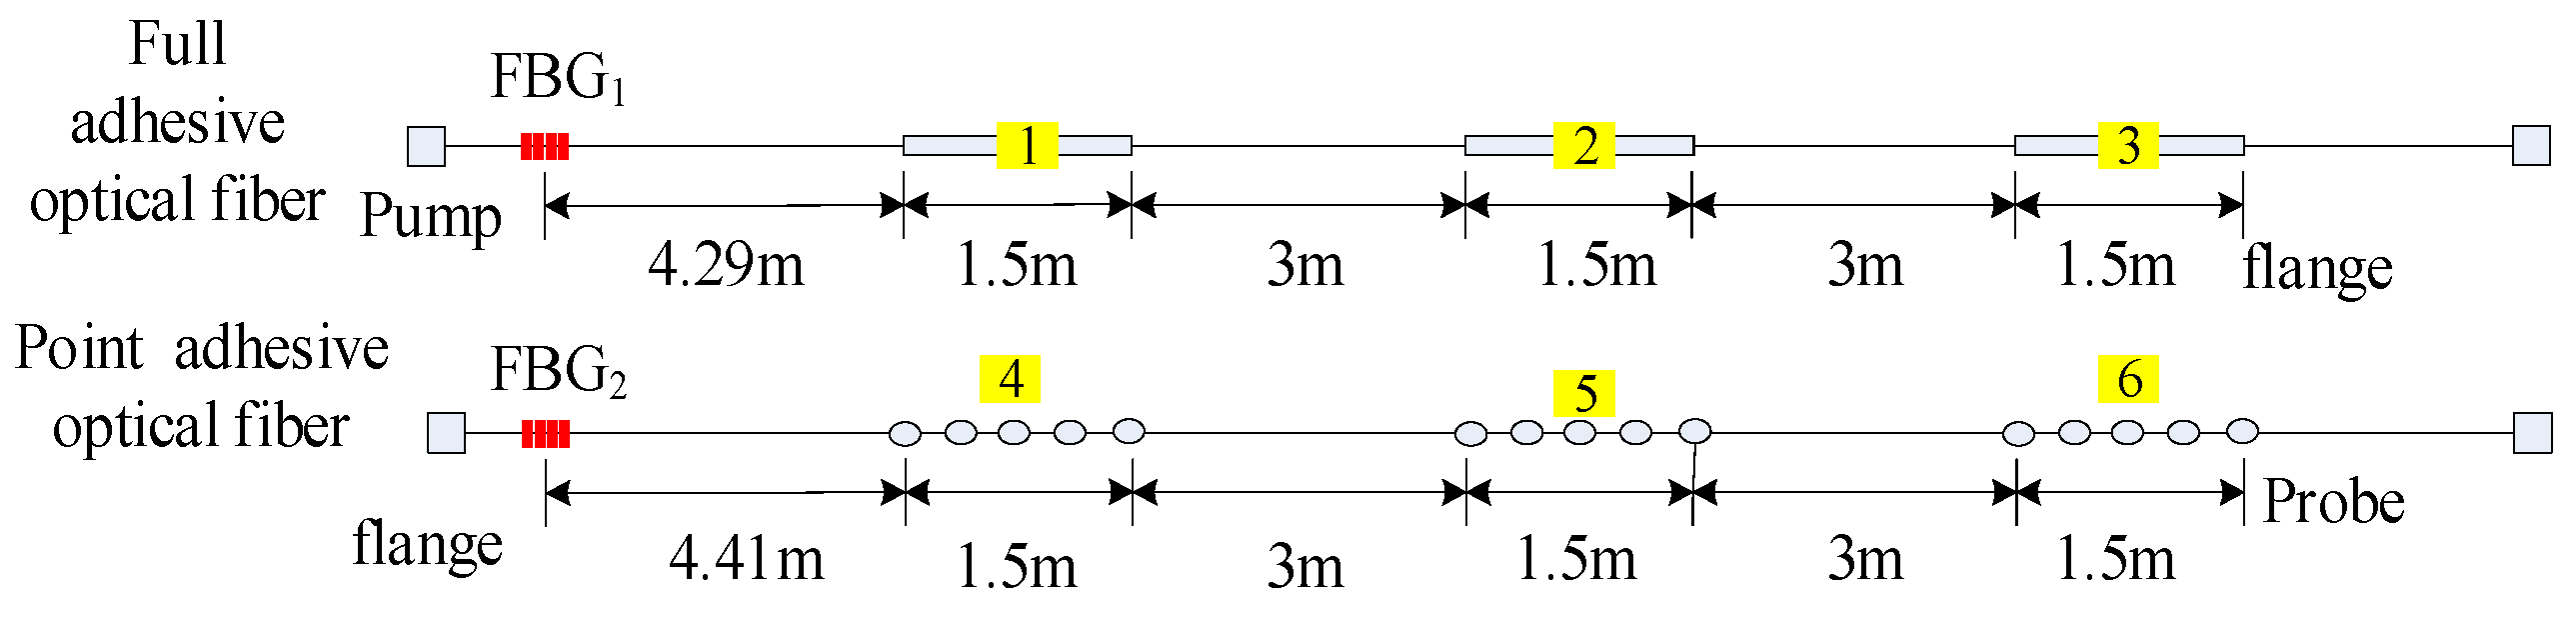
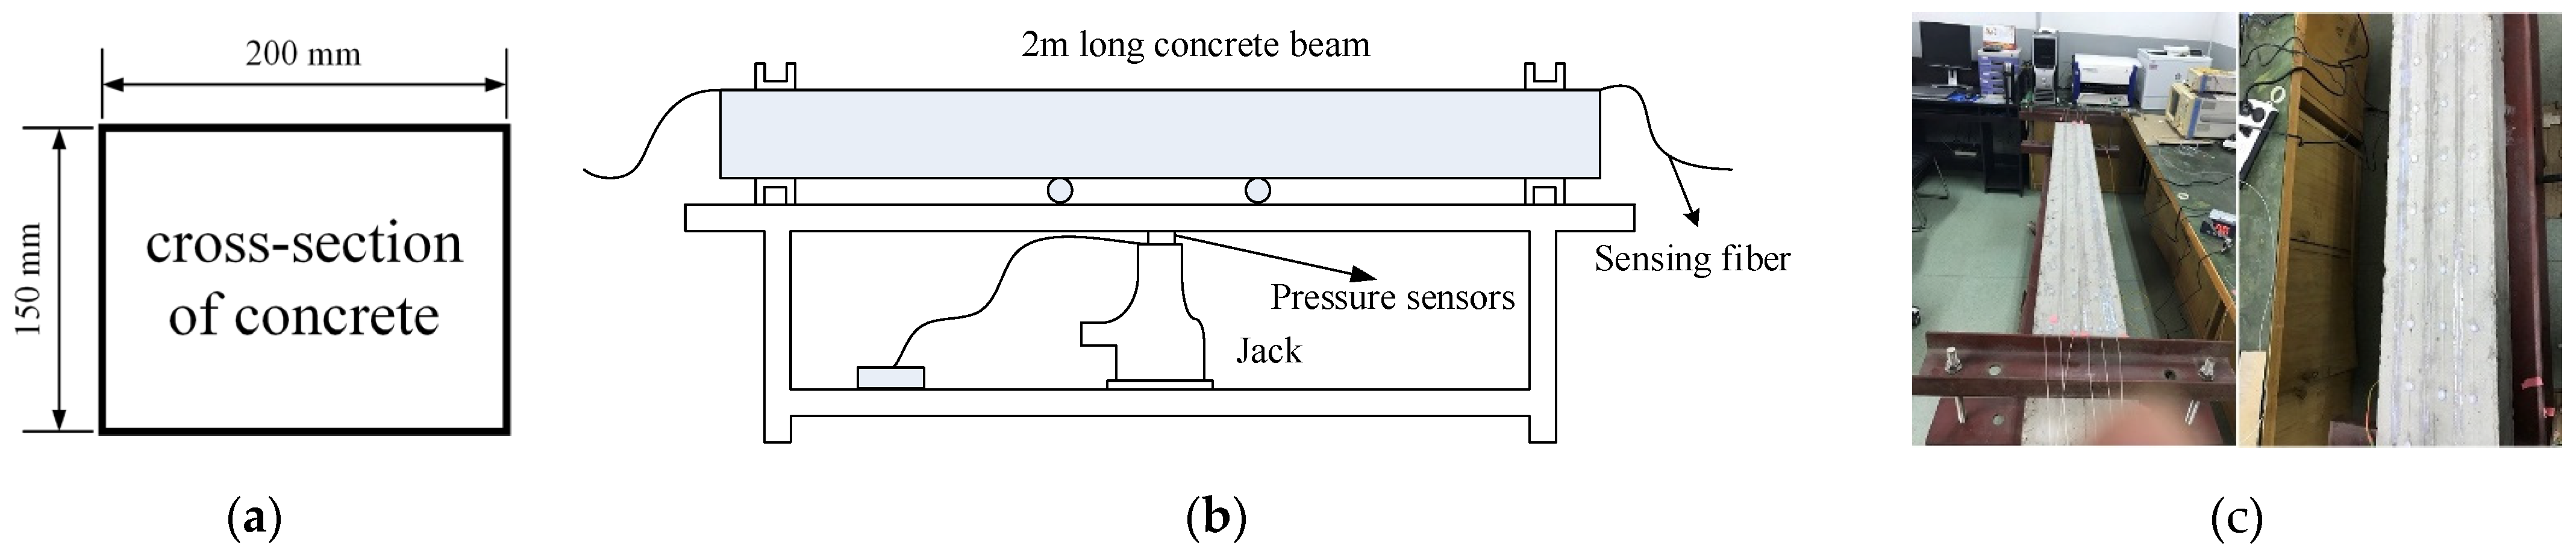
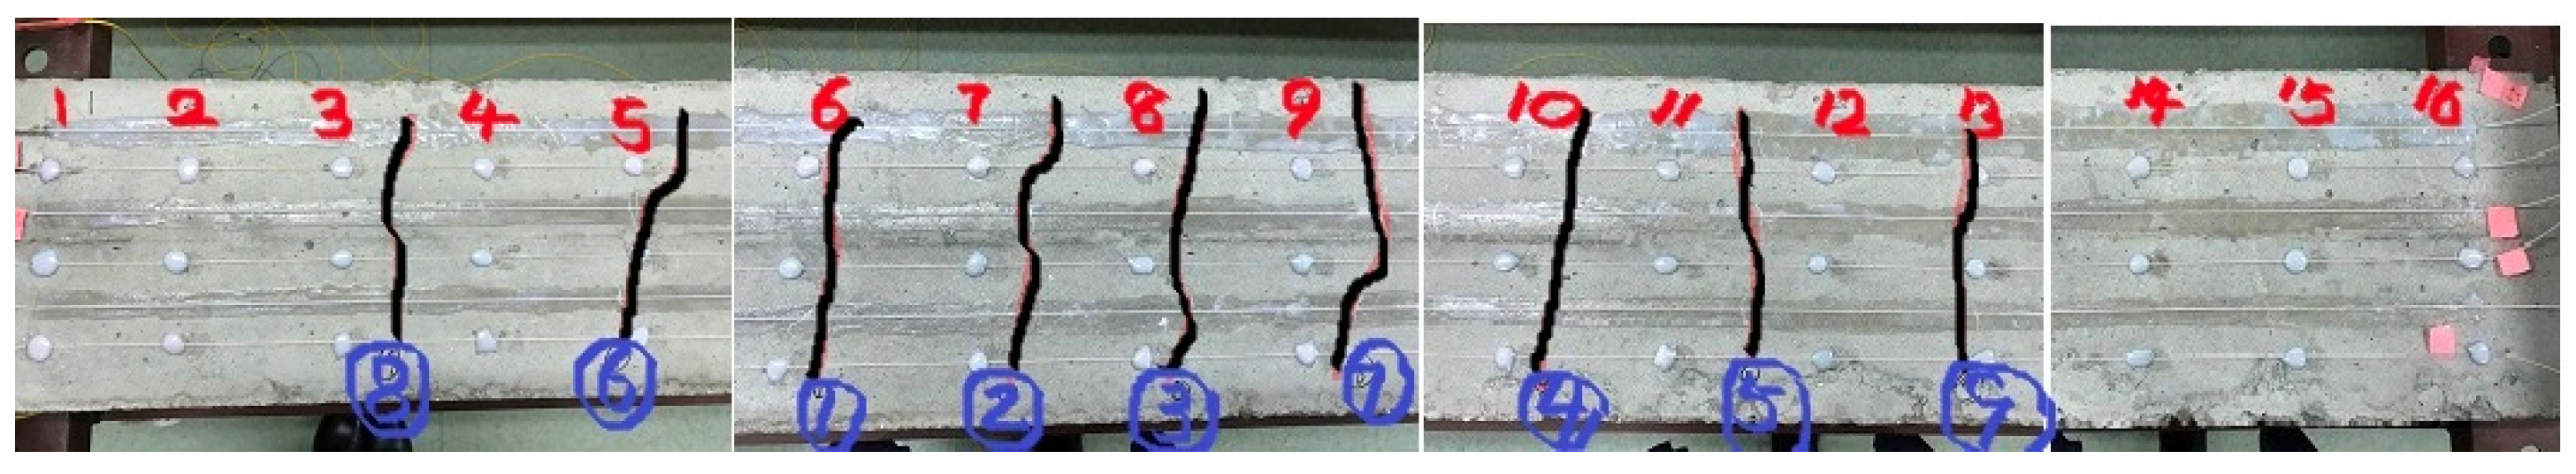
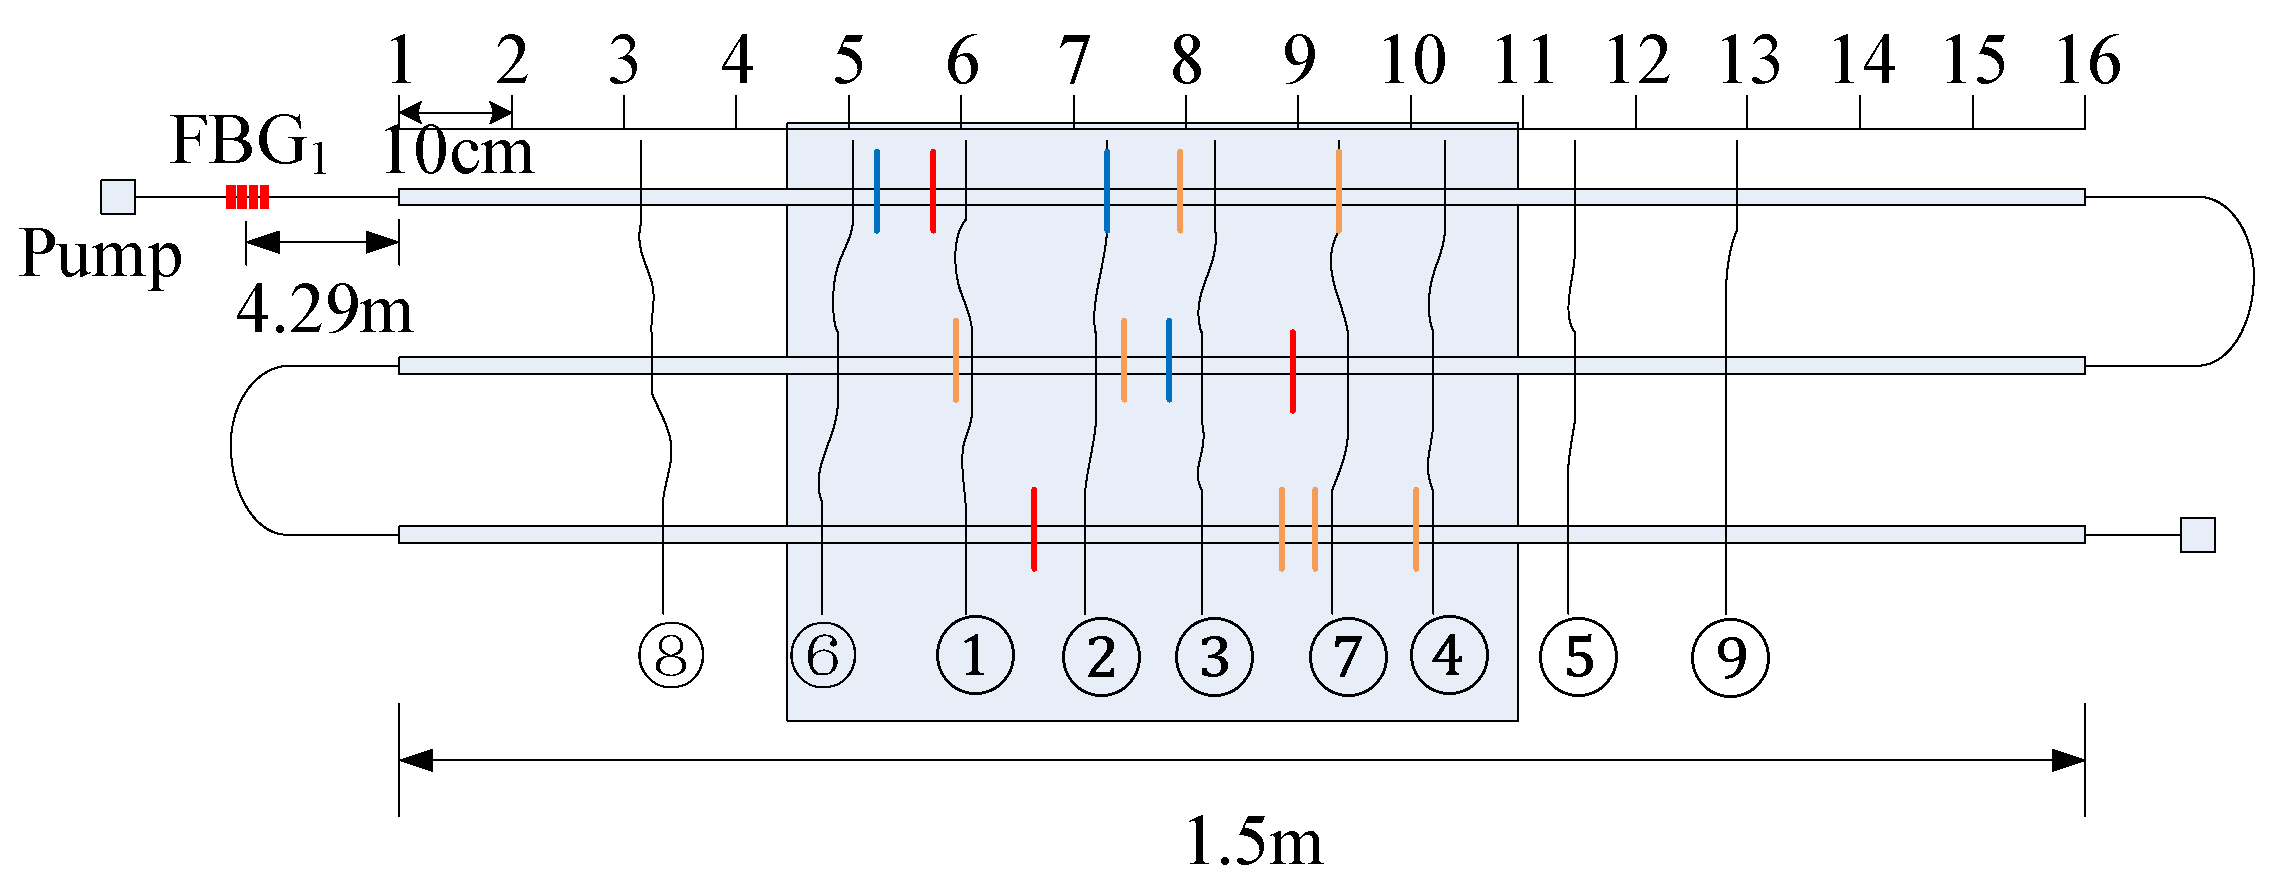
3.2. Concrete Crack Location Experiment
4. Results and Discussion
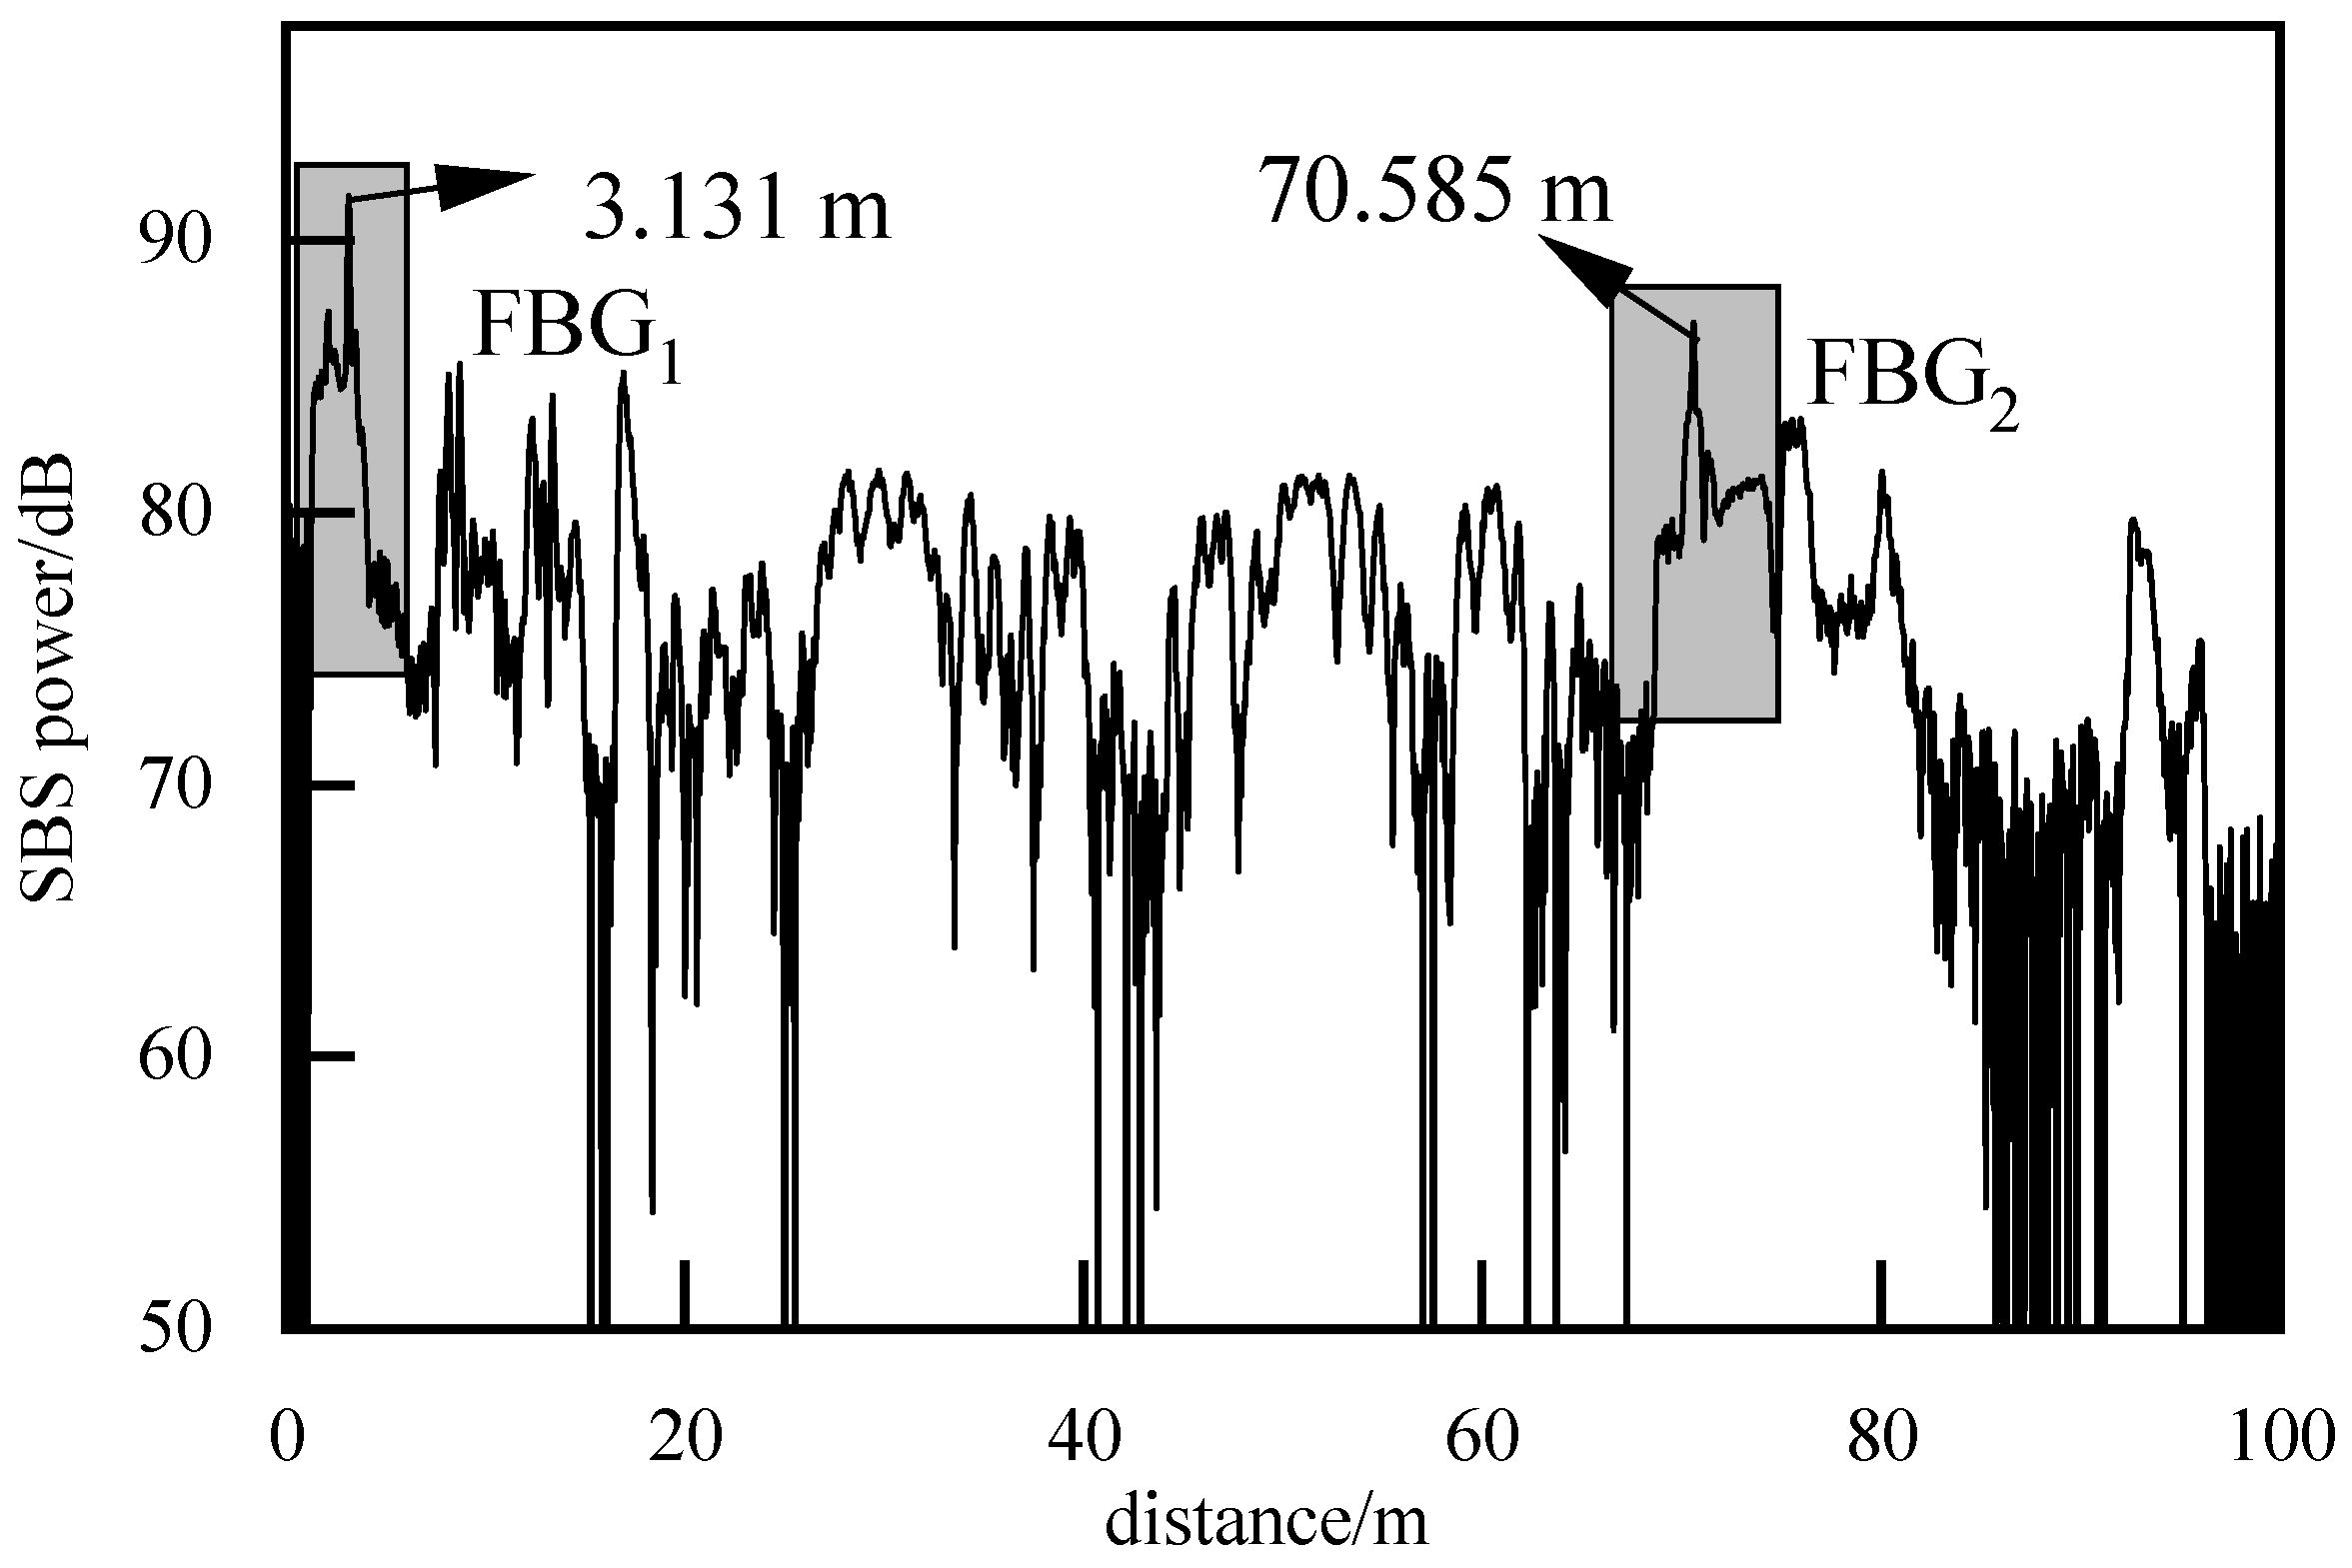
4.1. Coupling Mechanism of FBG and Brillouin Scattering
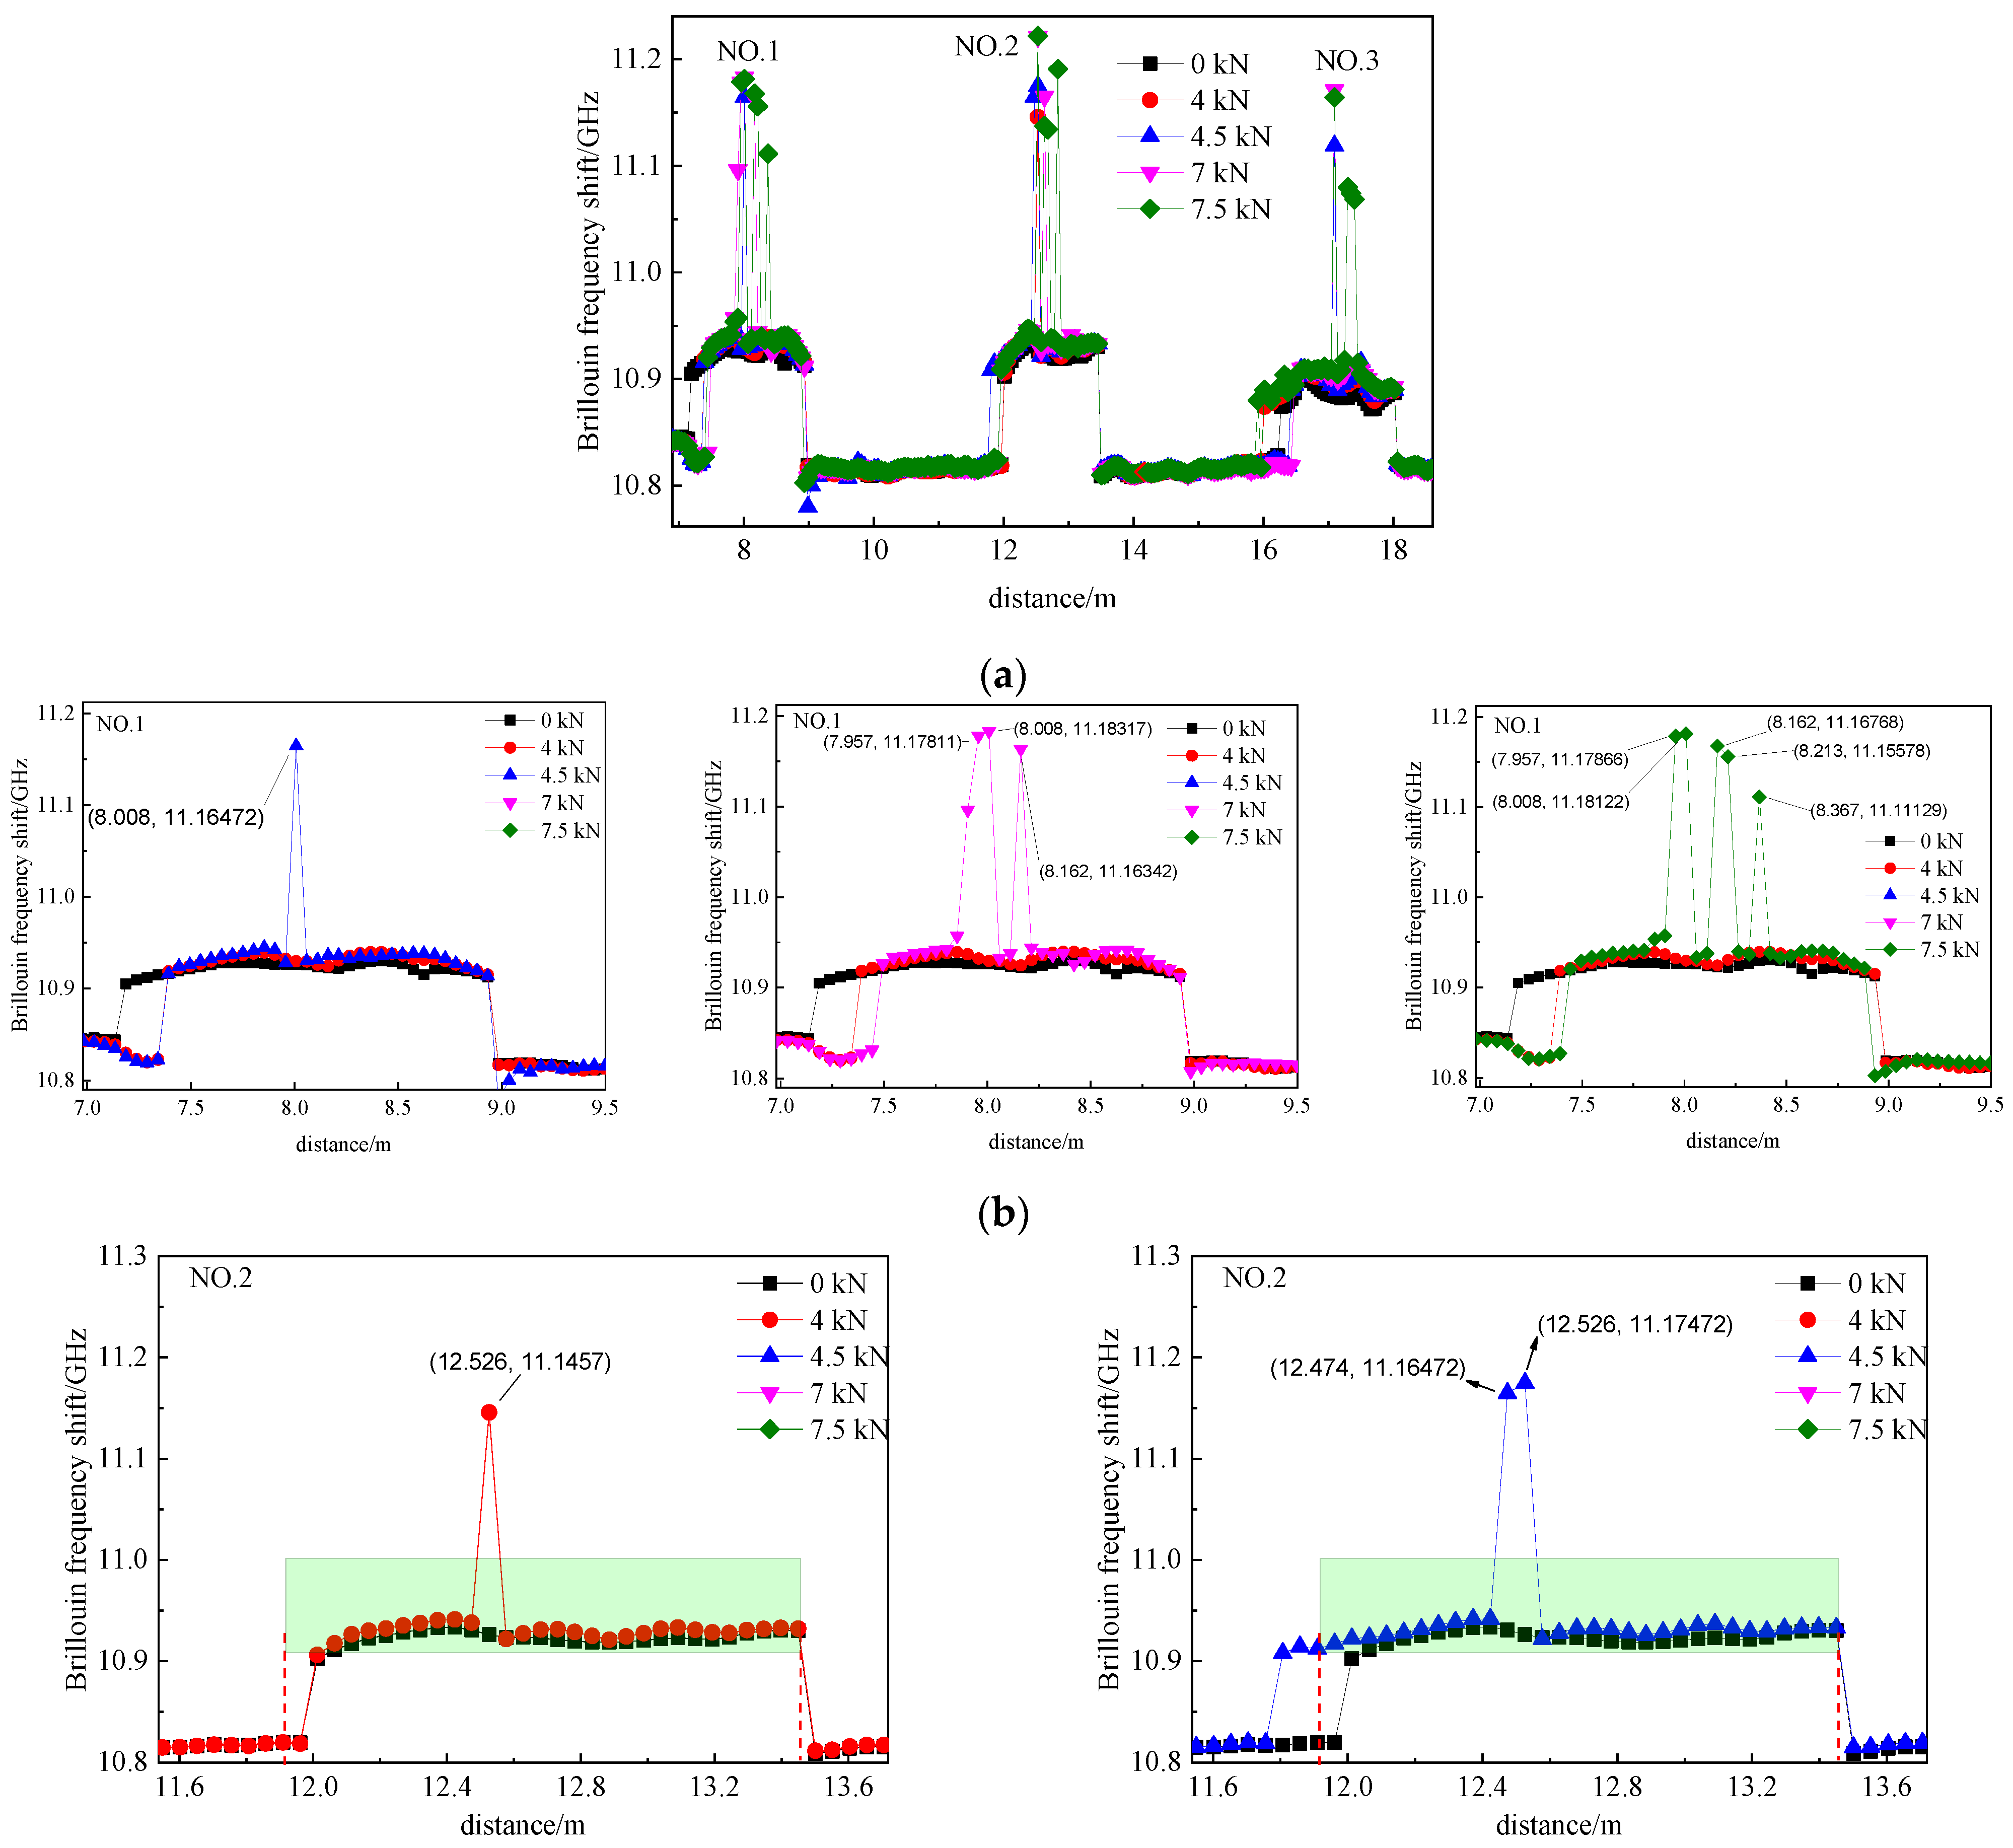
4.2. Concrete Crack Localization
5. Conclusions
Author Contributions
Funding
Institutional Review Board Statement
Informed Consent Statement
Data Availability Statement
Conflicts of Interest
References
- Goszczyńska, B.; Trmpczyński, W.; Tworzewska, J. Analysis of Crack Width Development in Reinforced Concrete Beams. Materials 2021, 14, 3043. [Google Scholar] [CrossRef]
- Tittelboom, K.V.; Belie, N.D. Self-Healing in Cementitious Materials—A Review. Materials 2013, 6, 2182–2217. [Google Scholar] [CrossRef] [PubMed] [Green Version]
- Niederleithinger, E.; Wang, X.; Herbrand, M.; Muller, M. Processing Ultrasonic Data by Coda Wave Interferometry to Monitor Load Tests of Concrete Beams. Sensors 2018, 18, 1971. [Google Scholar] [CrossRef] [Green Version]
- Zhang, J.; Li, Y.; Du, G.; Song, G. Damage Detection of L-Shaped Concrete Filled Steel Tube (L-CFST) Columns under Cyclic Loading Using Embedded Piezoceramic Transducers. Sensors 2018, 18, 2171. [Google Scholar] [CrossRef] [Green Version]
- Bremer, K.; Alwis, L.; Weigand, F.; Kuhne, M.; Zheng, Y.; Kruger, M.; Helbig, R.; Roth, B. Evaluating the Performance of Functionalized Carbon Structures with Integrated Optical Fiber Sensors under Practical Conditions. Sensors 2018, 18, 3923. [Google Scholar] [CrossRef] [Green Version]
- Luo, J.; Hao, Y.; Ye, Q.; Hao, Y.; Li, L. Development of optical fiber sensors based on Brillouin scattering and FBG for on-line monitoring in overhead transmission lines. J. Lightwave Technol. 2013, 31, 1559–1565. [Google Scholar] [CrossRef]
- Sun, A.; Semenova, Y.; Farrell, G.; Chen, B.; Li, G.; Lin, Z. BOTDR integrated with FBG sensor array for distributed strain measurement. Electron. Lett. 2010, 46, 66. [Google Scholar] [CrossRef]
- Lan, C.; Zhou, Z.; Ou, J. Monitoring of structural prestress loss in RC beams by inner distributed Brillouin and fiber Bragg grating sensors on a single optical fiber. Struct. Control. Health Monit. 2014, 21, 317–330. [Google Scholar] [CrossRef]
- Delgado, F.S.; Carvalho, J.P.; Coelho, T.V.N.; Dos Santos, A.B. An Optical Fiber Sensor and Its Application in UAVs for Current Measurements. Sensors 2016, 16, 1800. [Google Scholar] [CrossRef] [Green Version]
- Sun, Y.; Cao, H.; Ma, L.; Cui, H.; Huang, Y. A wavelength selective application for an optical fiber surface plasmon resonance sensor. Opt. Commun. 2016, 363, 110–116. [Google Scholar] [CrossRef]
- Hong, C.Y.; Zhang, Y.F.; Liu, L.Q. Application of distributed optical fiber sensor for monitoring the mechanical performance of a driven pile. Measurement 2016, 88, 186–193. [Google Scholar] [CrossRef]
- He, J.; Zhou, Z.; Ou, J. Optic fiber sensor-based smart bridge cable with functionality of self-sensing. Mech. Syst. Signal Process. 2013, 35, 84–94. [Google Scholar] [CrossRef]
- Feng, W.; Yin, J.; Borana, L.; Qin, J.; Wu, P.; Yang, J. A network theory for BOTDA measurement of deformations of geotechnical structures and error analysis. Measurement 2019, 146, 618–627. [Google Scholar] [CrossRef]
- Zeni, L.; Picarelli, L.; Avolio, B.; Coscetta, A.; Papa, R.; Zeni, G.; Di Maio, C.; Vassallo, R.; Minardo, A. Brillouin optical time-domain analysis for geotechnical monitoring. J. Rock Mech. Geotech. Eng. 2015, 7, 458–462. [Google Scholar] [CrossRef] [Green Version]
- Fan, L.; Bao, Y.; Meng, W.; Chen, G. In-situ monitoring of corrosion-induced expansion and mass loss of steel bar in steel fiber reinforced concrete using a distributed fiber optic sensor. Compos. Part B Eng. 2019, 165, 679–689. [Google Scholar] [CrossRef]
- Fan, L.; Tan, X.; Zhang, Q.; Meng, W.; Chen, G.; Bao, Y. Monitoring corrosion of steel bars in reinforced concrete based on helix strains measured from a distributed fiber optic sensor. Eng. Struct. 2020, 204, 110039. [Google Scholar] [CrossRef]
- Mao, J.; Xu, F.; Gao, Q.; Liu, S.; Jin, W.; Xu, Y. A Monitoring Method Based on FBG for Concrete Corrosion Cracking. Sensors 2016, 16, 1093. [Google Scholar] [CrossRef] [Green Version]
- Crunelle, C.; Caucheteur, C.; Wuilpart, M.; Mégret, P. Quasi-distributed temperature sensor combining Fibre Bragg Gratings and temporal reflectometry technique interrogation. Opt. Lasers Eng. 2009, 47, 412–418. [Google Scholar] [CrossRef]
- Yang, L.; Xiao, R.; Ji, X.; Ren, L.; Jia, Z.; Li, H. OTDR-based detection of broken strands and damage in high-voltage transmission conductors. J. Optoelectron. Laser 2013, 24, 961–966. [Google Scholar]
- Mao, J.; Chen, J.; Cui, L.; Jin, W.; Xu, C.; He, Y. Monitoring the Corrosion Process of Reinforced Concrete Using BOTDA and FBG Sensors. Sensors 2015, 15, 8866–8883. [Google Scholar] [CrossRef]
- Innes, M.; Davis, C.; Rosalie, C.; Norman, P.; Rajic, N. Acoustic Emission Detection and Characterisation Using Networked FBG Sensors. Procedia Eng. 2017, 188, 440–447. [Google Scholar] [CrossRef]
- Tian, S.; Wen, K.; Wang, D. Research on damage localization of steel beams based on long-range fiber grating sensors. Adv. Laser Optoelectron. 2013, 4, 77–82. [Google Scholar]
- Broth, Z.; Hoult, N.A. Dynamic distributed strain sensing to assess reinforced concrete behaviour. Eng. Struct. 2020, 204, 110036. [Google Scholar] [CrossRef]
- Rodriguez, G.; Casas, J.R.; Villalba, S. Shear crack width assessment in concrete structures by 2D distributed optical fiber. Eng. Struct. 2019, 195, 508–523. [Google Scholar] [CrossRef]
- Yuan, L. Influence of temperature and strain on refractive index of optical fiber. J. Opt. 1997, 17, 1714–1717. [Google Scholar]
- Li, Q.; Zhang, C.; Li, L.; Zhong, X. Localization mechanisms and location methods of the disturbance sensor based on phase-sensitive OTDR. Optik 2014, 125, 2099–2103. [Google Scholar] [CrossRef]
- Li, J.; Zhao, D.; Hou, Y.; Sun, B. Power coupling characteristics between FBG and back-scattering signals. Int. J. Mod. Phys. B 2017, 31, 1741014. [Google Scholar] [CrossRef] [Green Version]
- Li, J.; Sun, B.; Kinzo, K. The influence of FBG on Brillouin distributed sensor. J. Civ. Struct. Health Monit. 2015, 5, 629–643. [Google Scholar] [CrossRef]


| Number of FBG | Performance Parameters | ||
|---|---|---|---|
| Wavelength/nm | Bandwidth/nm | Reflectance % | |
| FBG1 | 1525.03 | 0.23 | 84.54 |
| FBG2 | 1529.88 | 0.21 | 82.59 |
| FBG3 | 1535.01 | 0.21 | 84 |
| Number of FBG | Performance Parameters | ||
|---|---|---|---|
| Wavelength/nm | Bandwidth/nm | Reflectance % | |
| FBG1 | 1544.74 | 0.22 | 73.39 |
| FBG2 | 1529.91 | 0.23 | 91.54 |
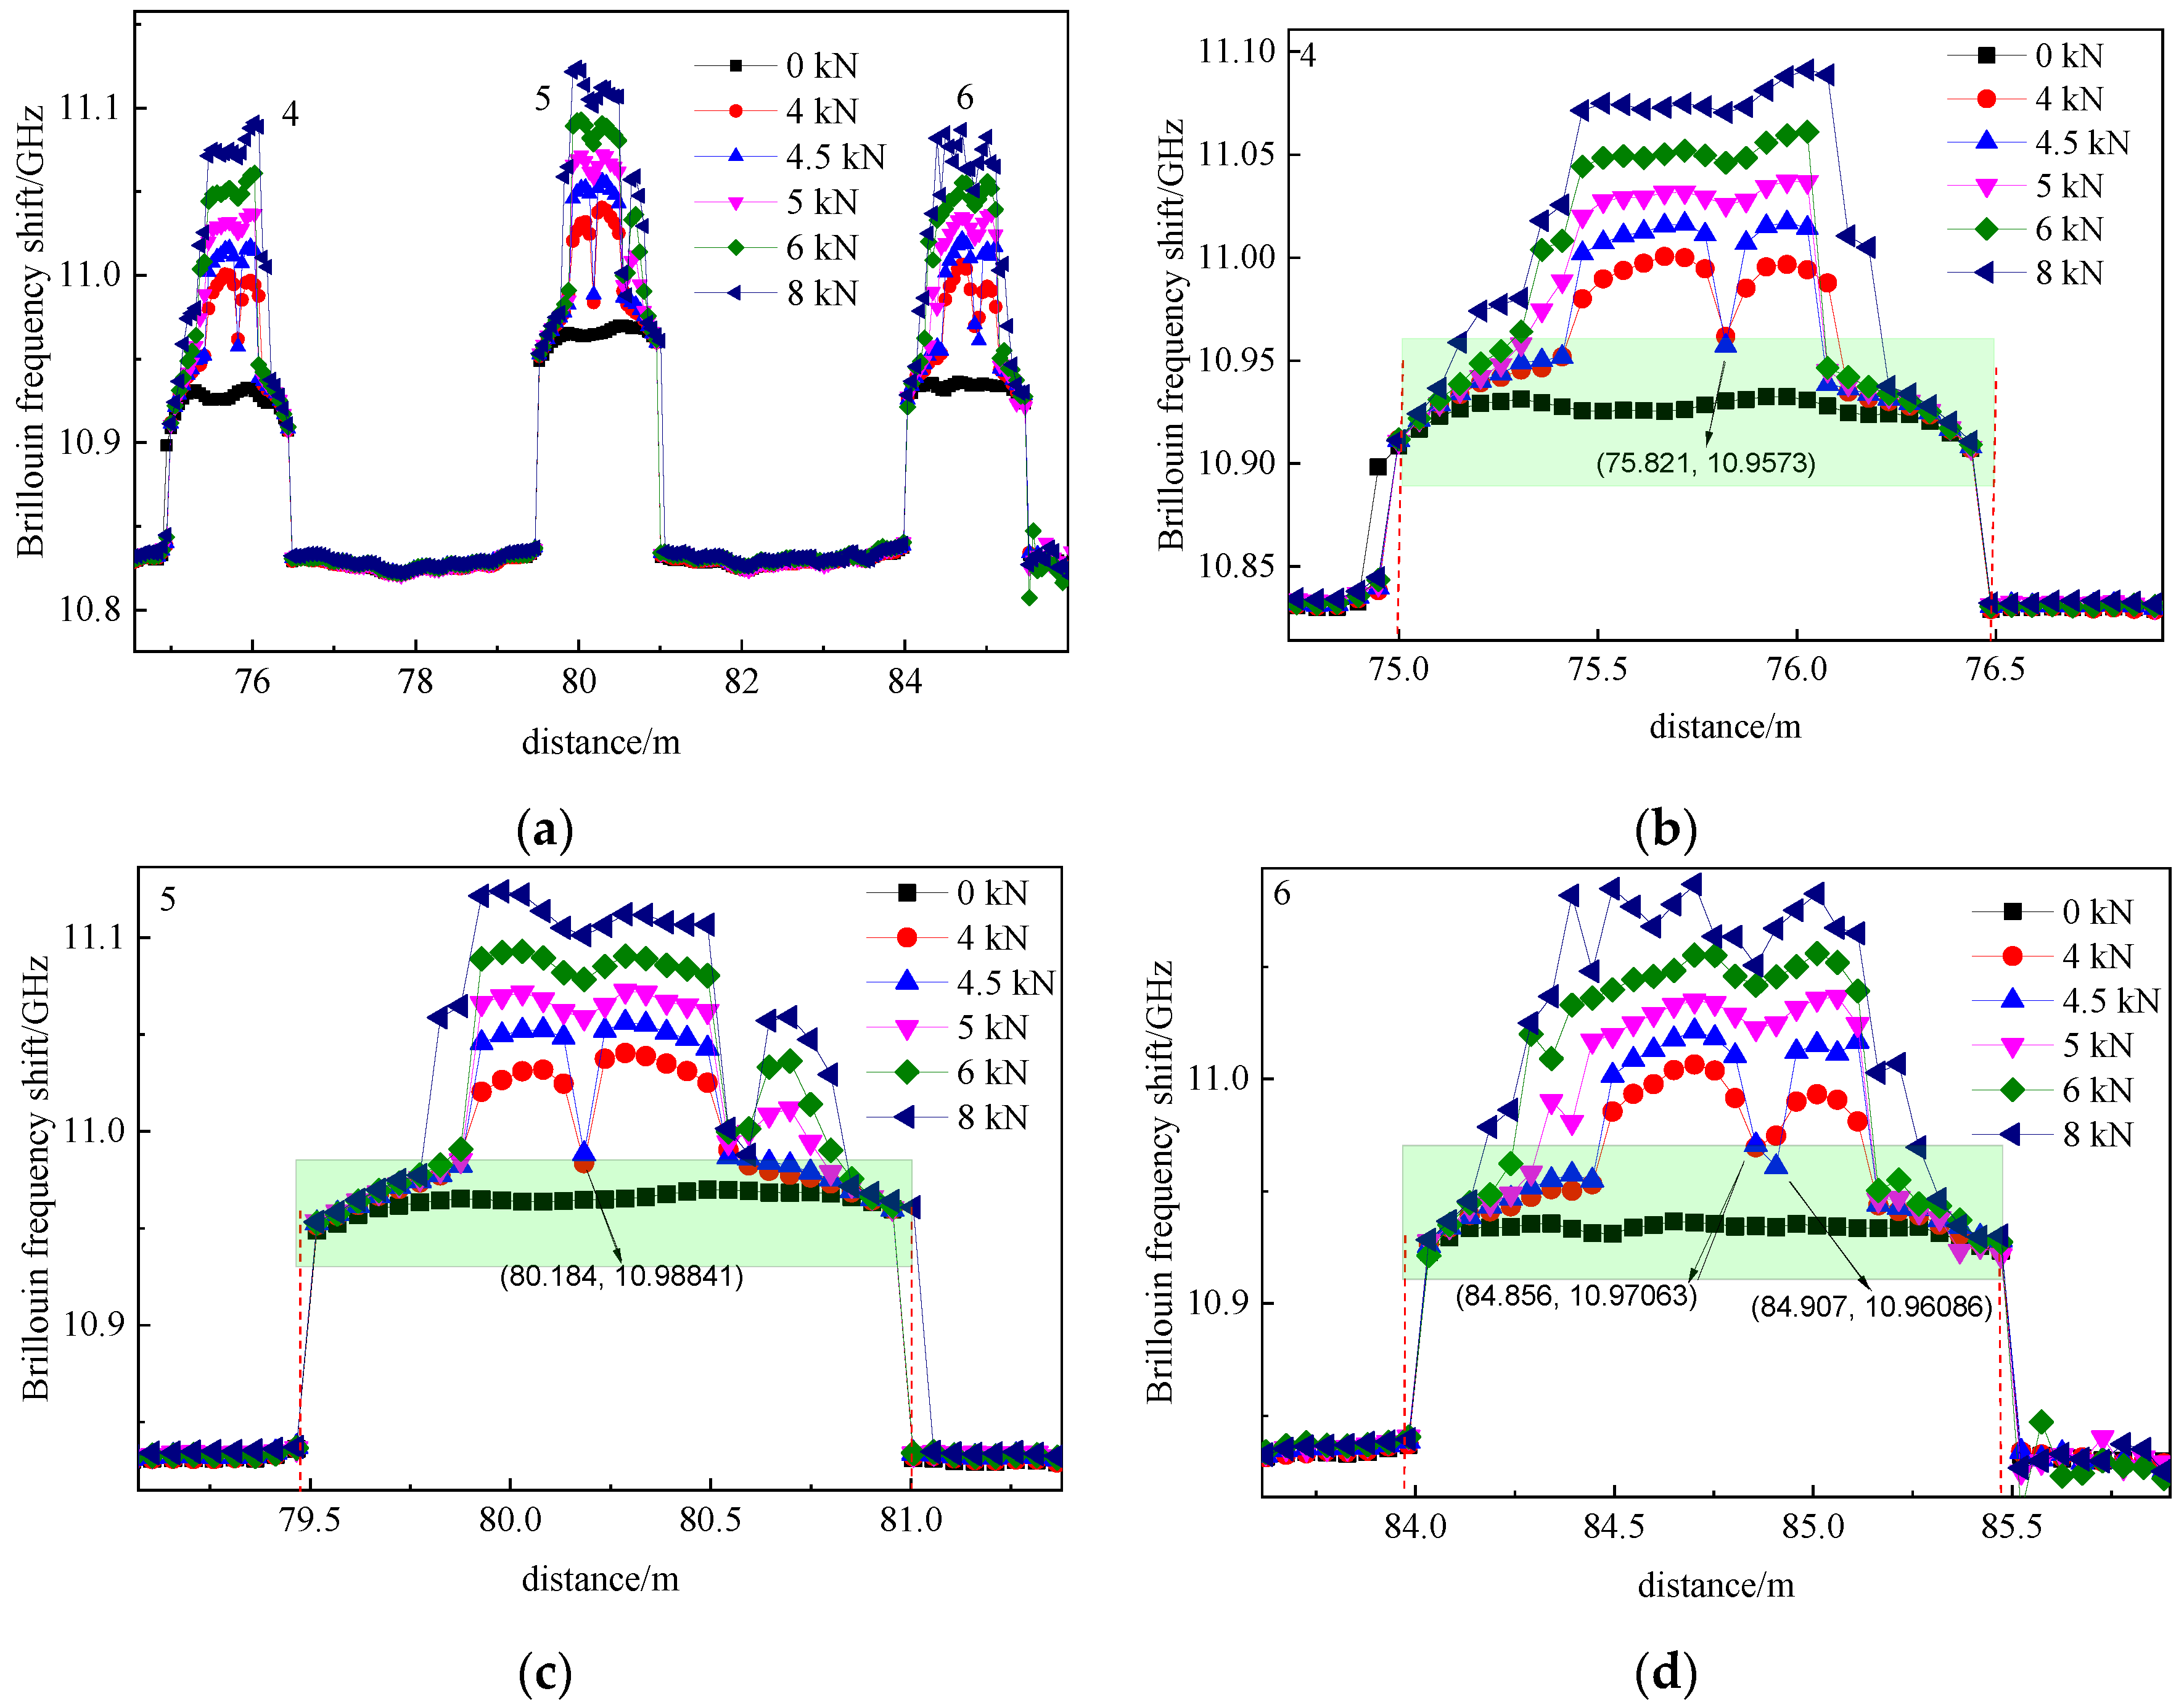
| Segment | Distance/m | Identification Length/m | Crack Number | Actual Length /m | Positioning Error/m |
|---|---|---|---|---|---|
| 1 | 7.957 | 0.536 | 6 | 0.4 | 0.136 |
| 8.008 | 0.587 | 1 | 0.5 | 0.087 | |
| 8.162 | 0.741 | 2 | 0.61 | 0.131 | |
| 8.213 | 0.792 | 3 | 0.7 | 0.092 | |
| 8.367 | 0.946 | 7 | 0.82 | 0.126 | |
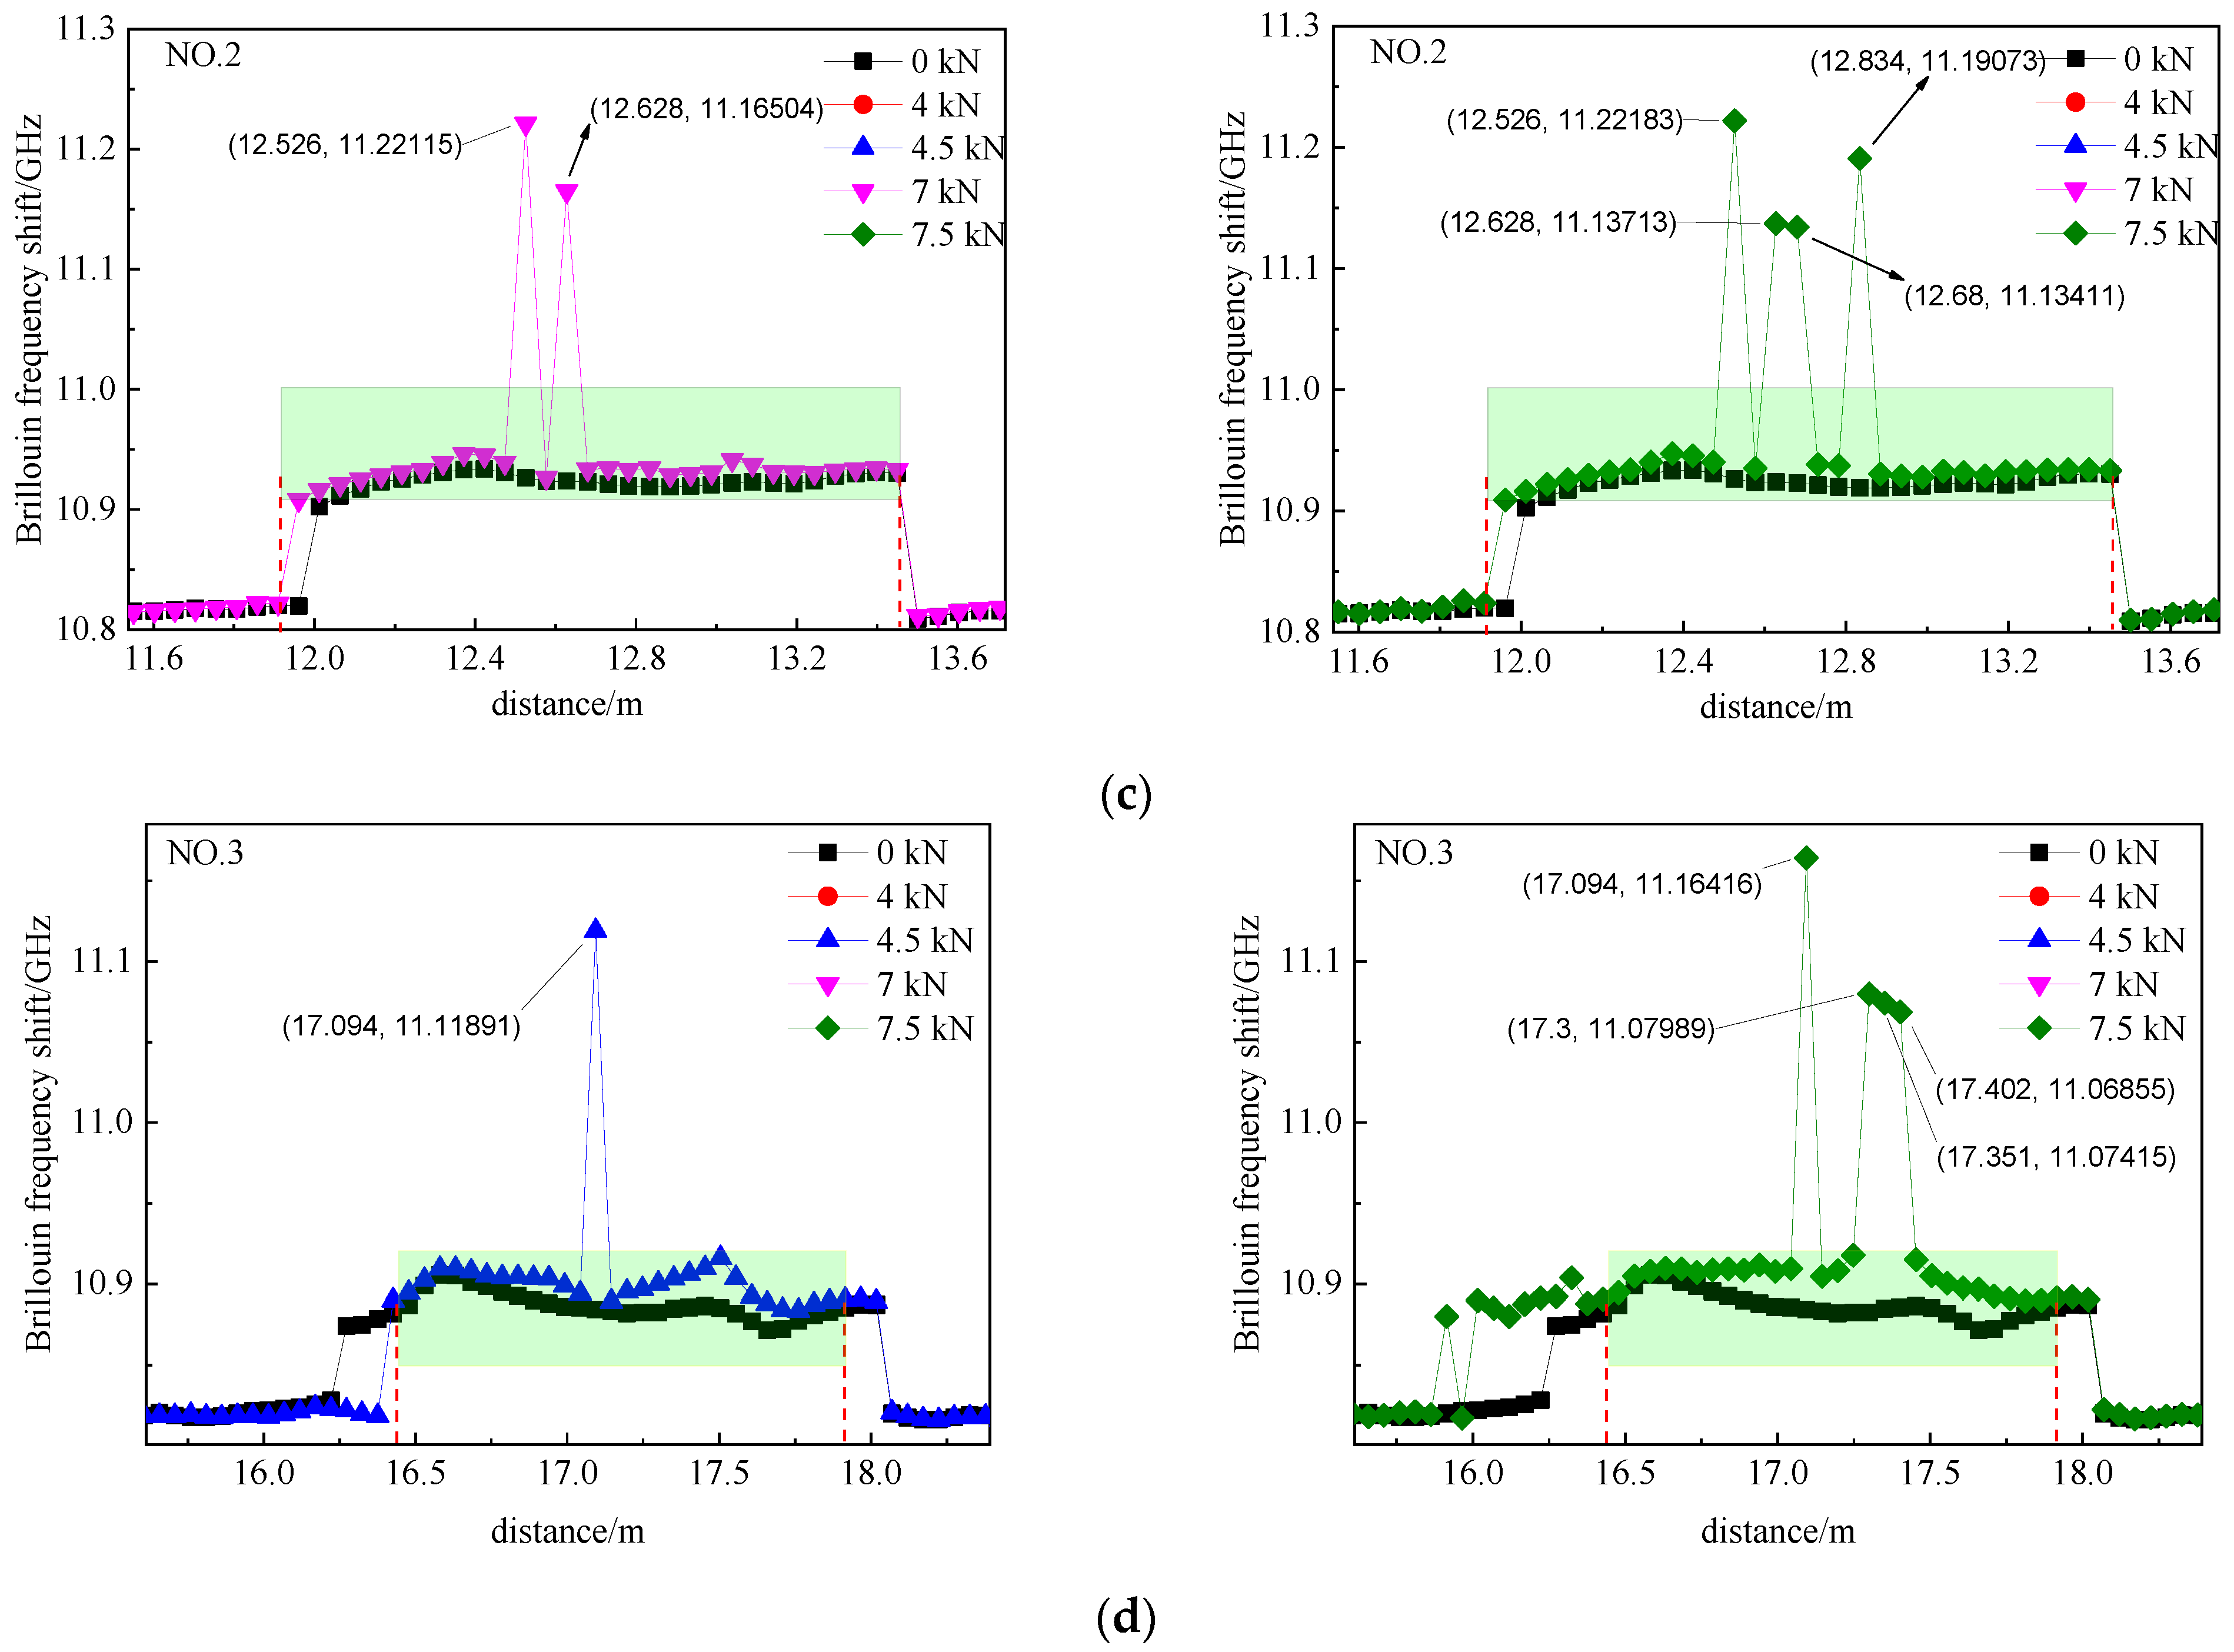
| 2 | 12.834 | 0.587 | 1 | 0.5 | 0.095 |
| 12.680 | 0.741 | 2 | 0.63 | 0.093 | |
| 12.628 | 0.793 | 3 | 0.7 | 0.111 | |
| 12.526 | 0.895 | 7 | 0.83 | 0.065 | |
| 3 | 17.094 | 0.673 | 2 | 0.61 | 0.063 |
| 17.300 | 0.879 | 7 | 0.83 | 0.049 | |
| 17.351 | 0.93 | 7 | 0.83 | 0.100 | |
| 17.402 | 0.981 | 4 or 9 | 0.92 or 1.03 | 0.061 or 0.049 |
Publisher’s Note: MDPI stays neutral with regard to jurisdictional claims in published maps and institutional affiliations. |
© 2021 by the authors. Licensee MDPI, Basel, Switzerland. This article is an open access article distributed under the terms and conditions of the Creative Commons Attribution (CC BY) license (https://creativecommons.org/licenses/by/4.0/).
Share and Cite
Li, J.; Shen, B.; Wang, J. A Combined Positioning Method Used for Identification of Concrete Cracks. Micromachines 2021, 12, 1479. https://doi.org/10.3390/mi12121479
Li J, Shen B, Wang J. A Combined Positioning Method Used for Identification of Concrete Cracks. Micromachines. 2021; 12(12):1479. https://doi.org/10.3390/mi12121479
Chicago/Turabian StyleLi, Jianzhi, Bohao Shen, and Junjie Wang. 2021. "A Combined Positioning Method Used for Identification of Concrete Cracks" Micromachines 12, no. 12: 1479. https://doi.org/10.3390/mi12121479
APA StyleLi, J., Shen, B., & Wang, J. (2021). A Combined Positioning Method Used for Identification of Concrete Cracks. Micromachines, 12(12), 1479. https://doi.org/10.3390/mi12121479