
Axial and Nonaxial Migration of Red Blood Cells in a Microtube

 ,
,  , , and
Abstract
:1. Introduction
2. Methods
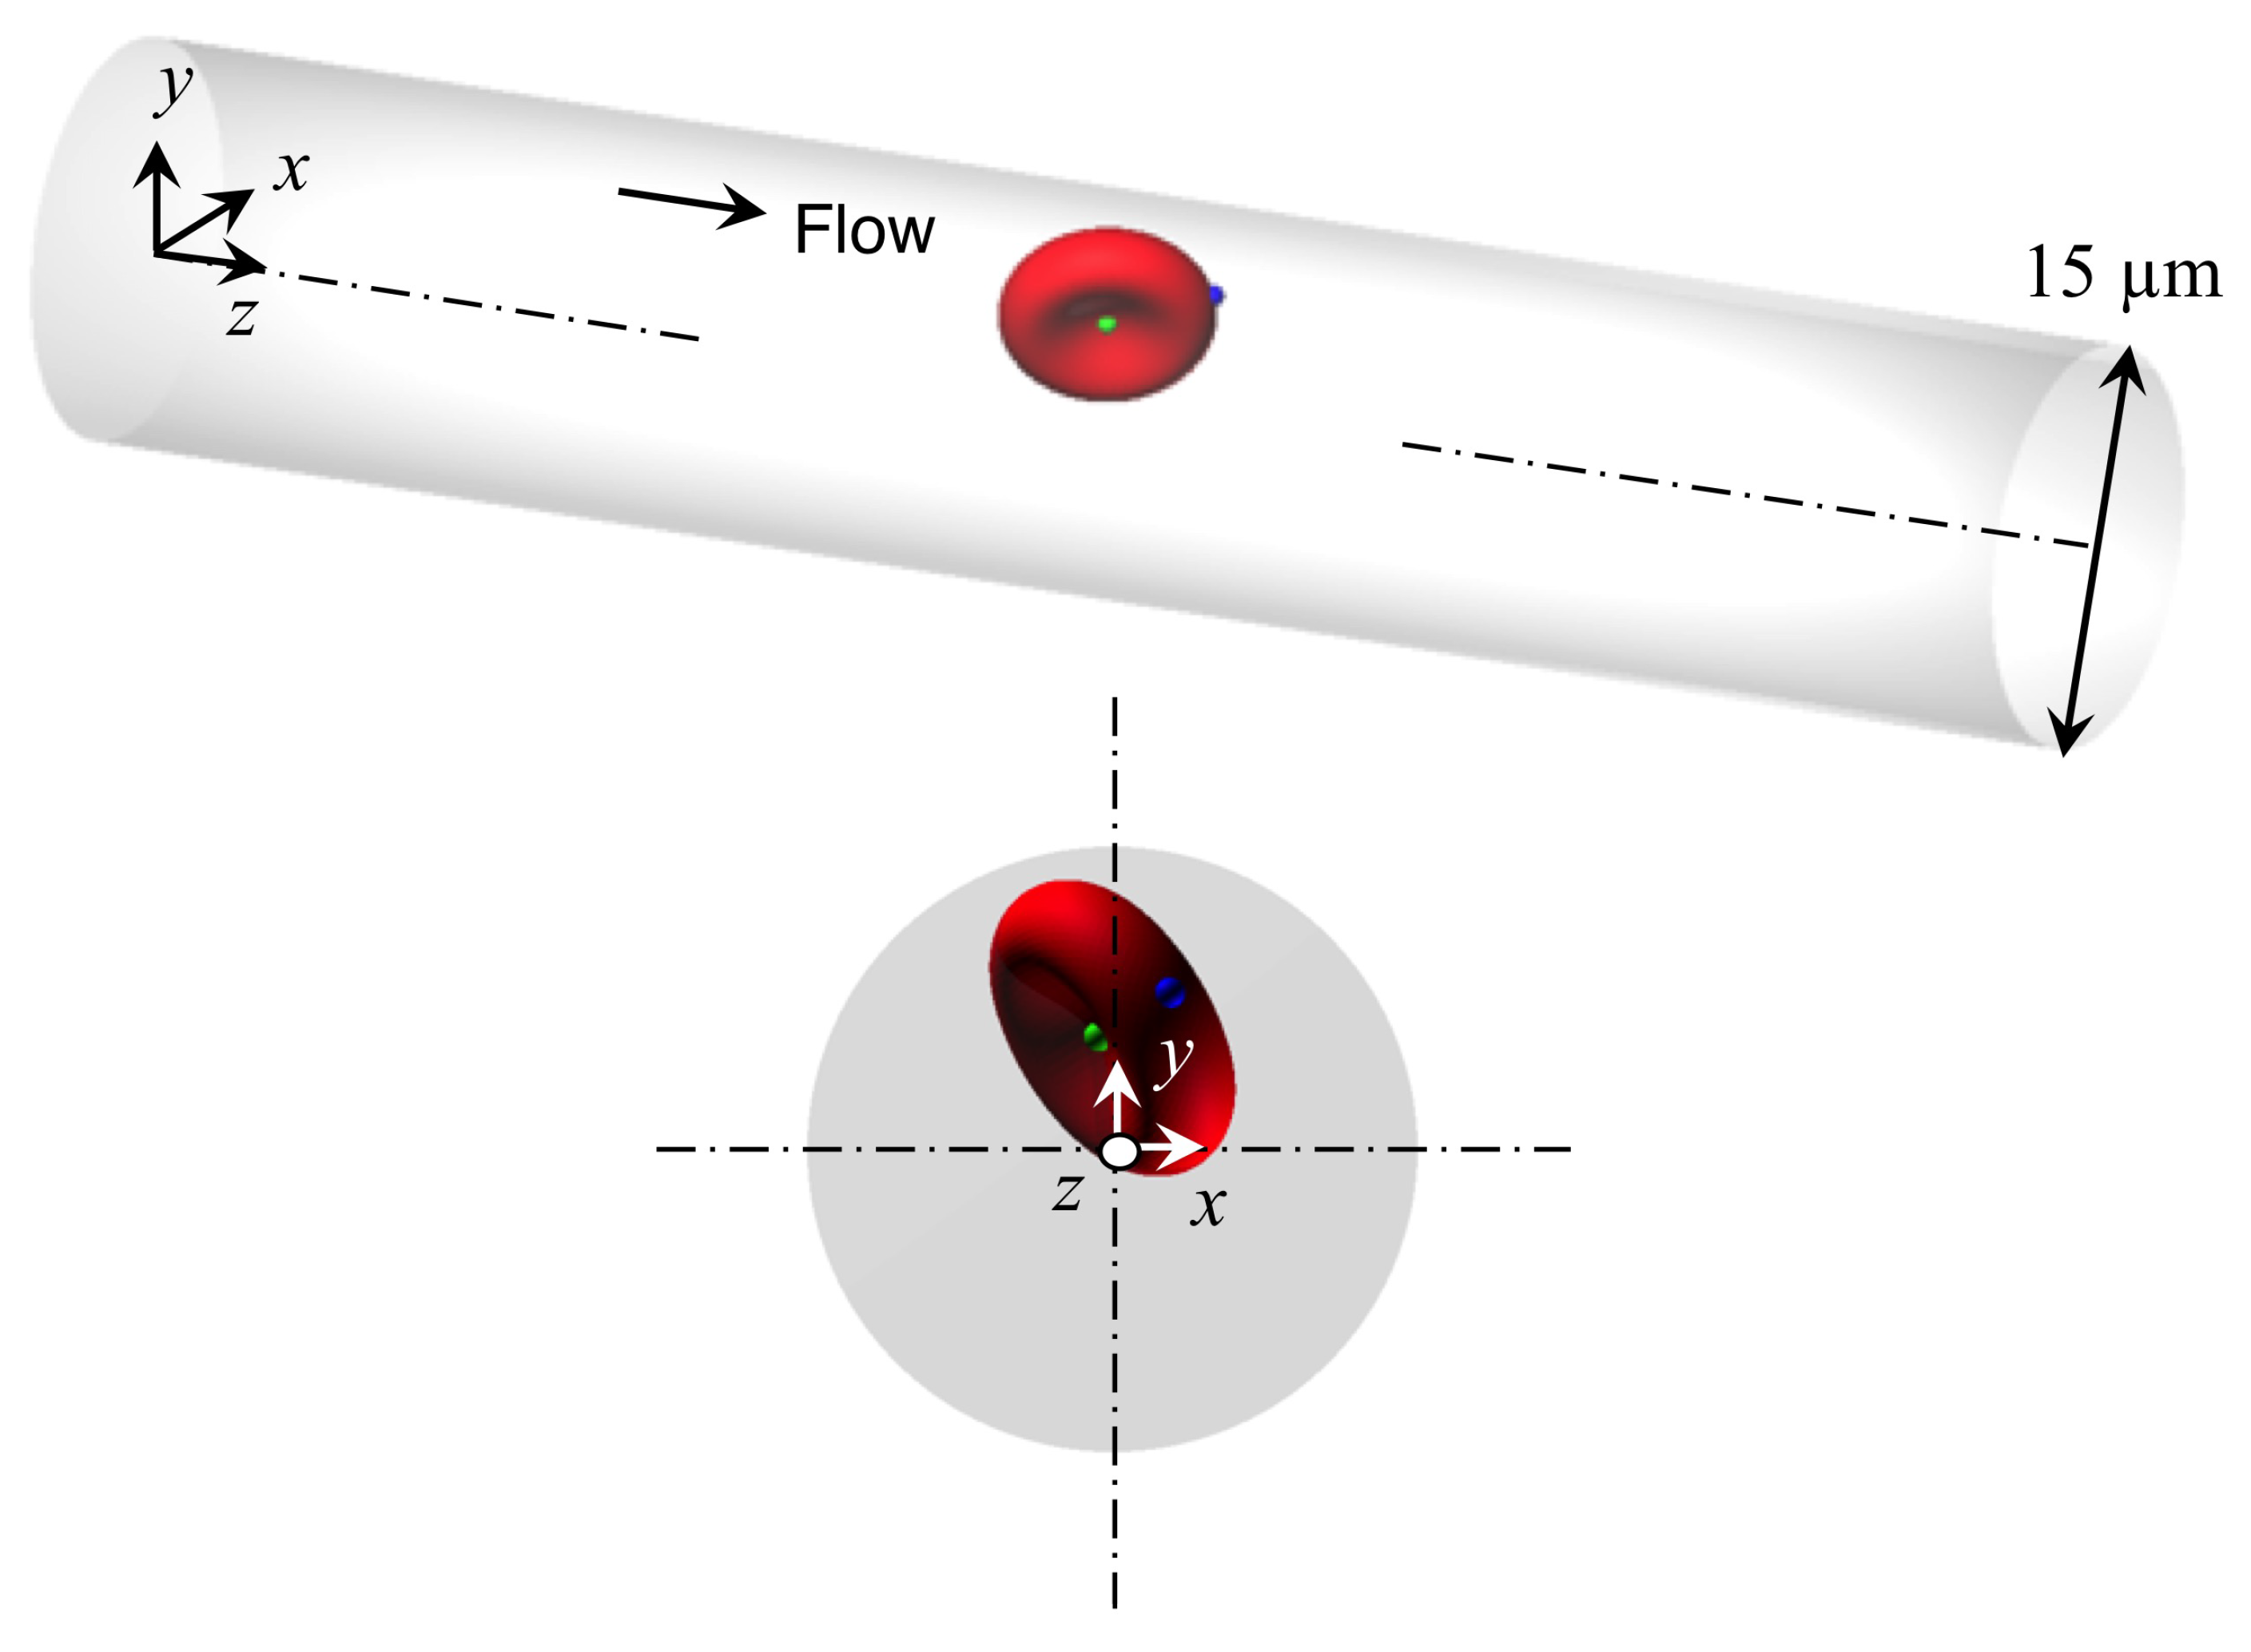
2.1. Flow and RBC Model
2.2. Numerical Simulation
2.3. Analysis
3. Results
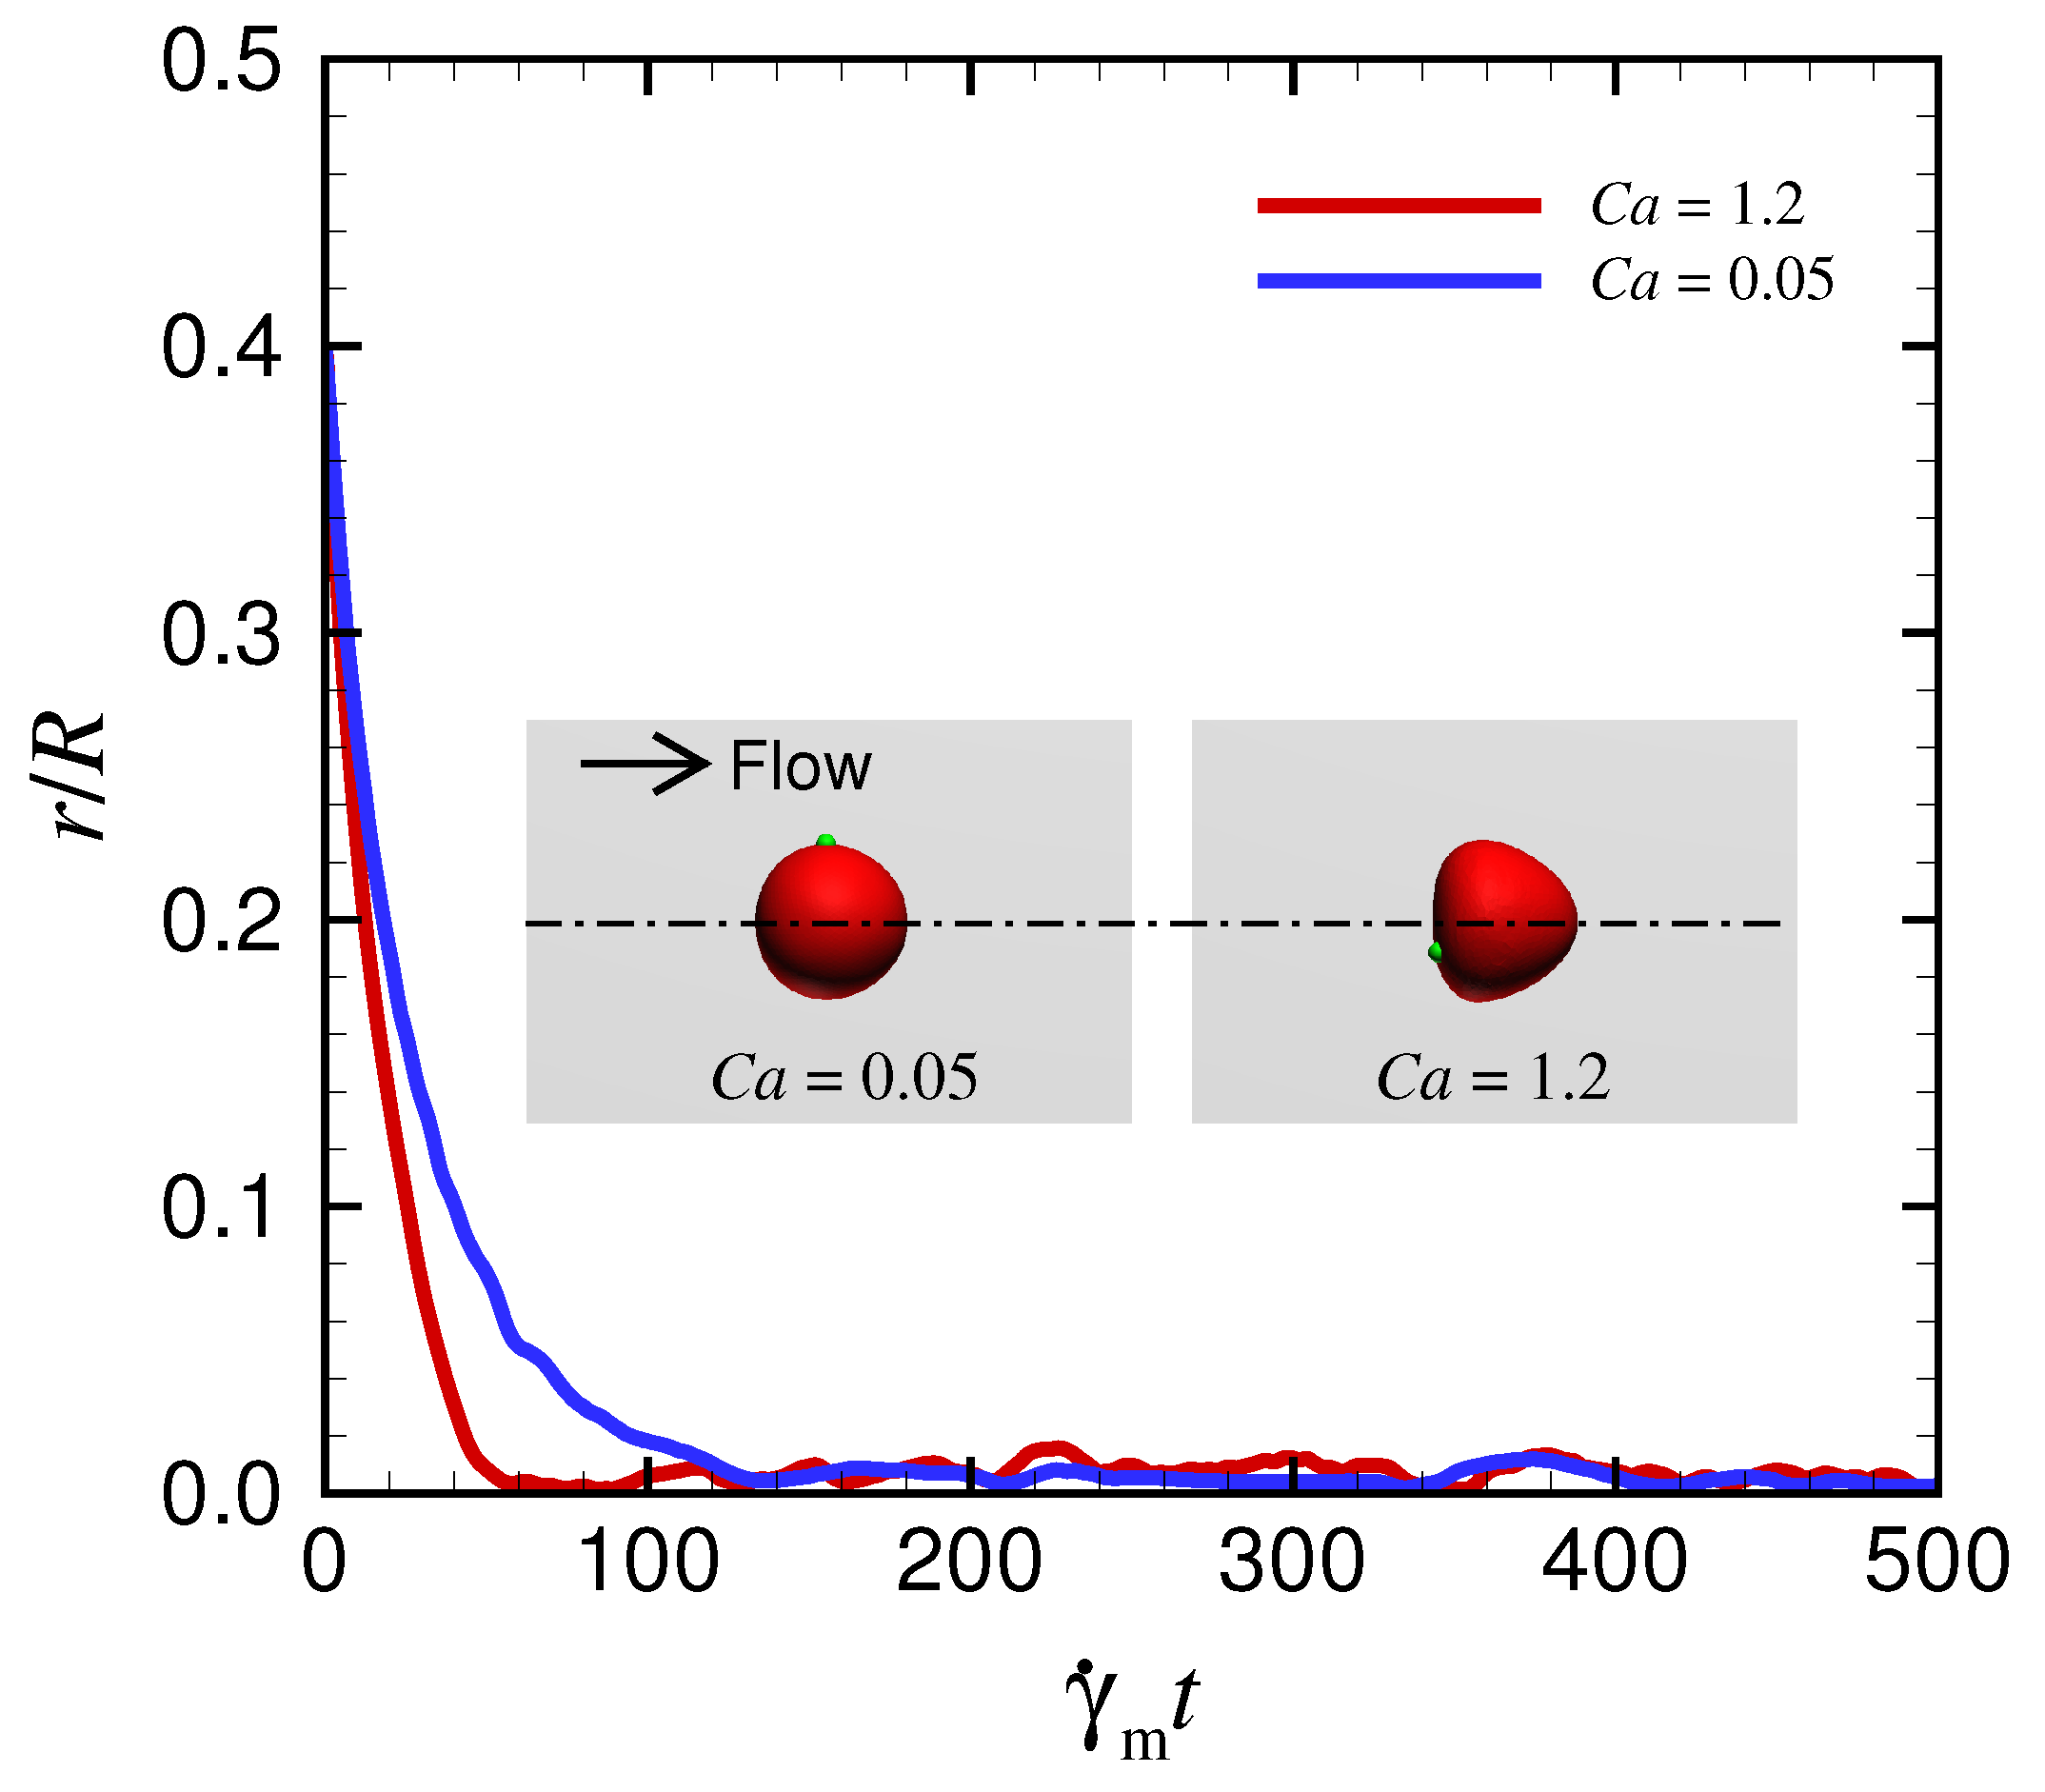
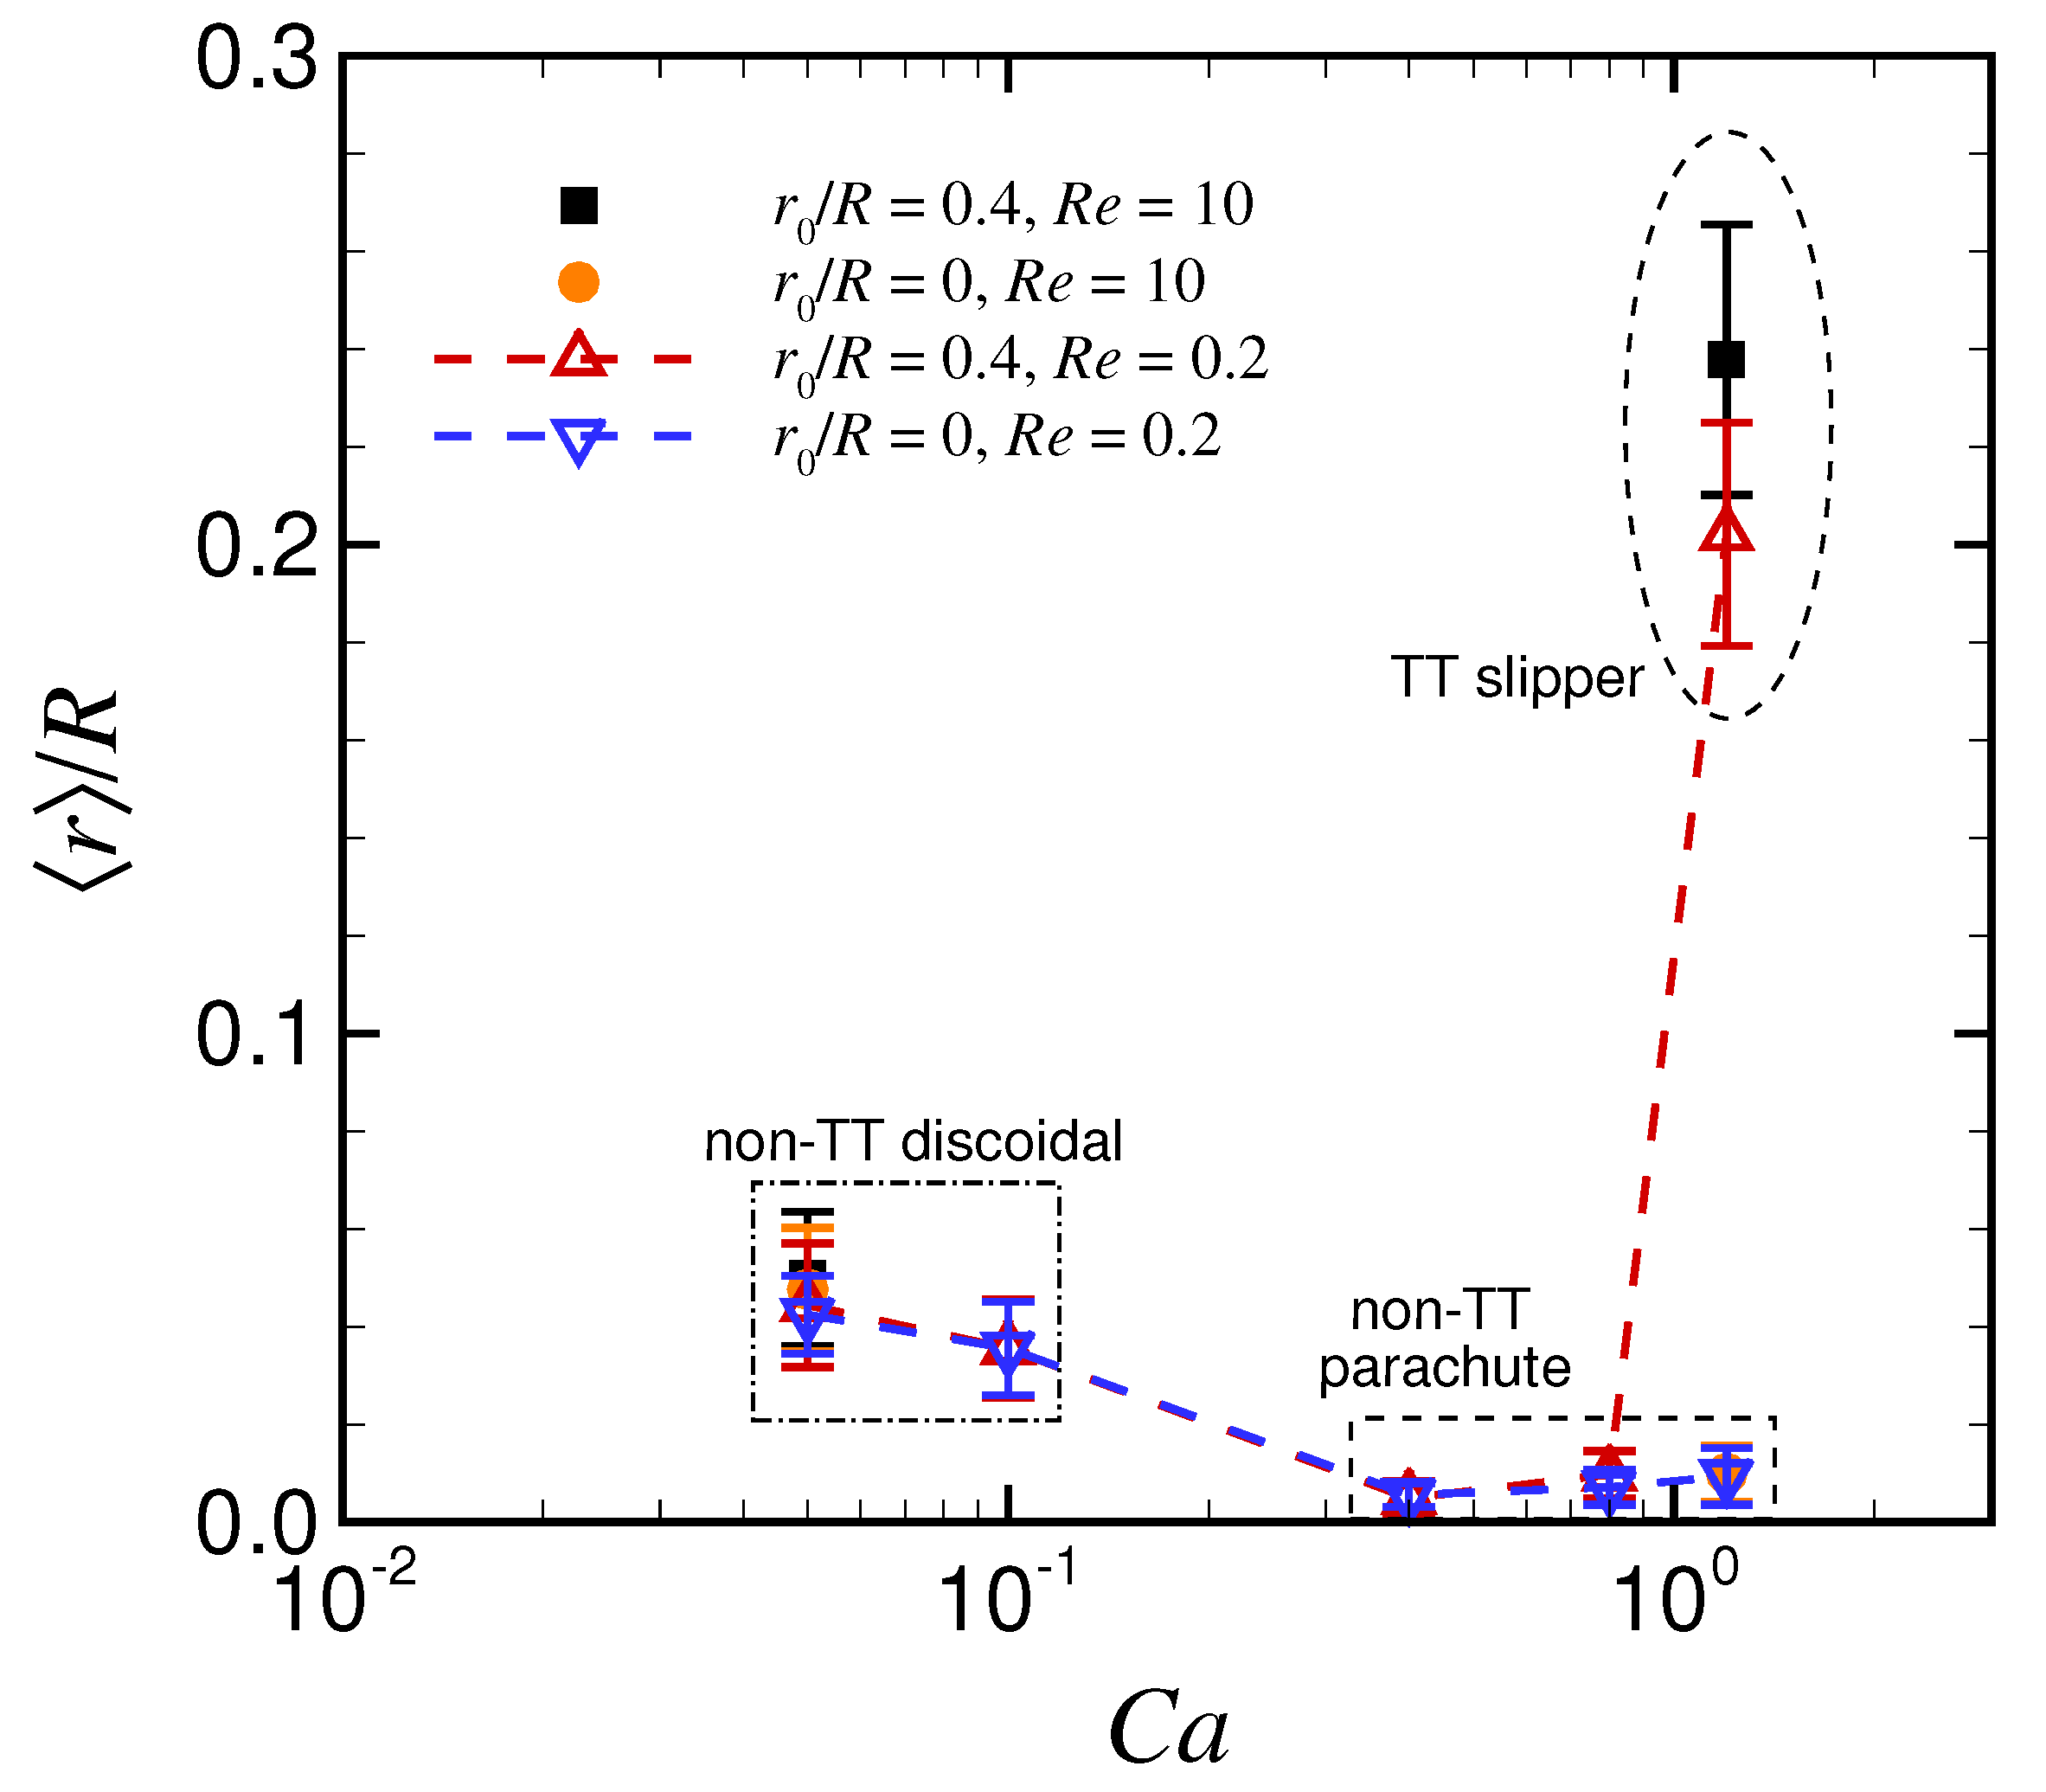
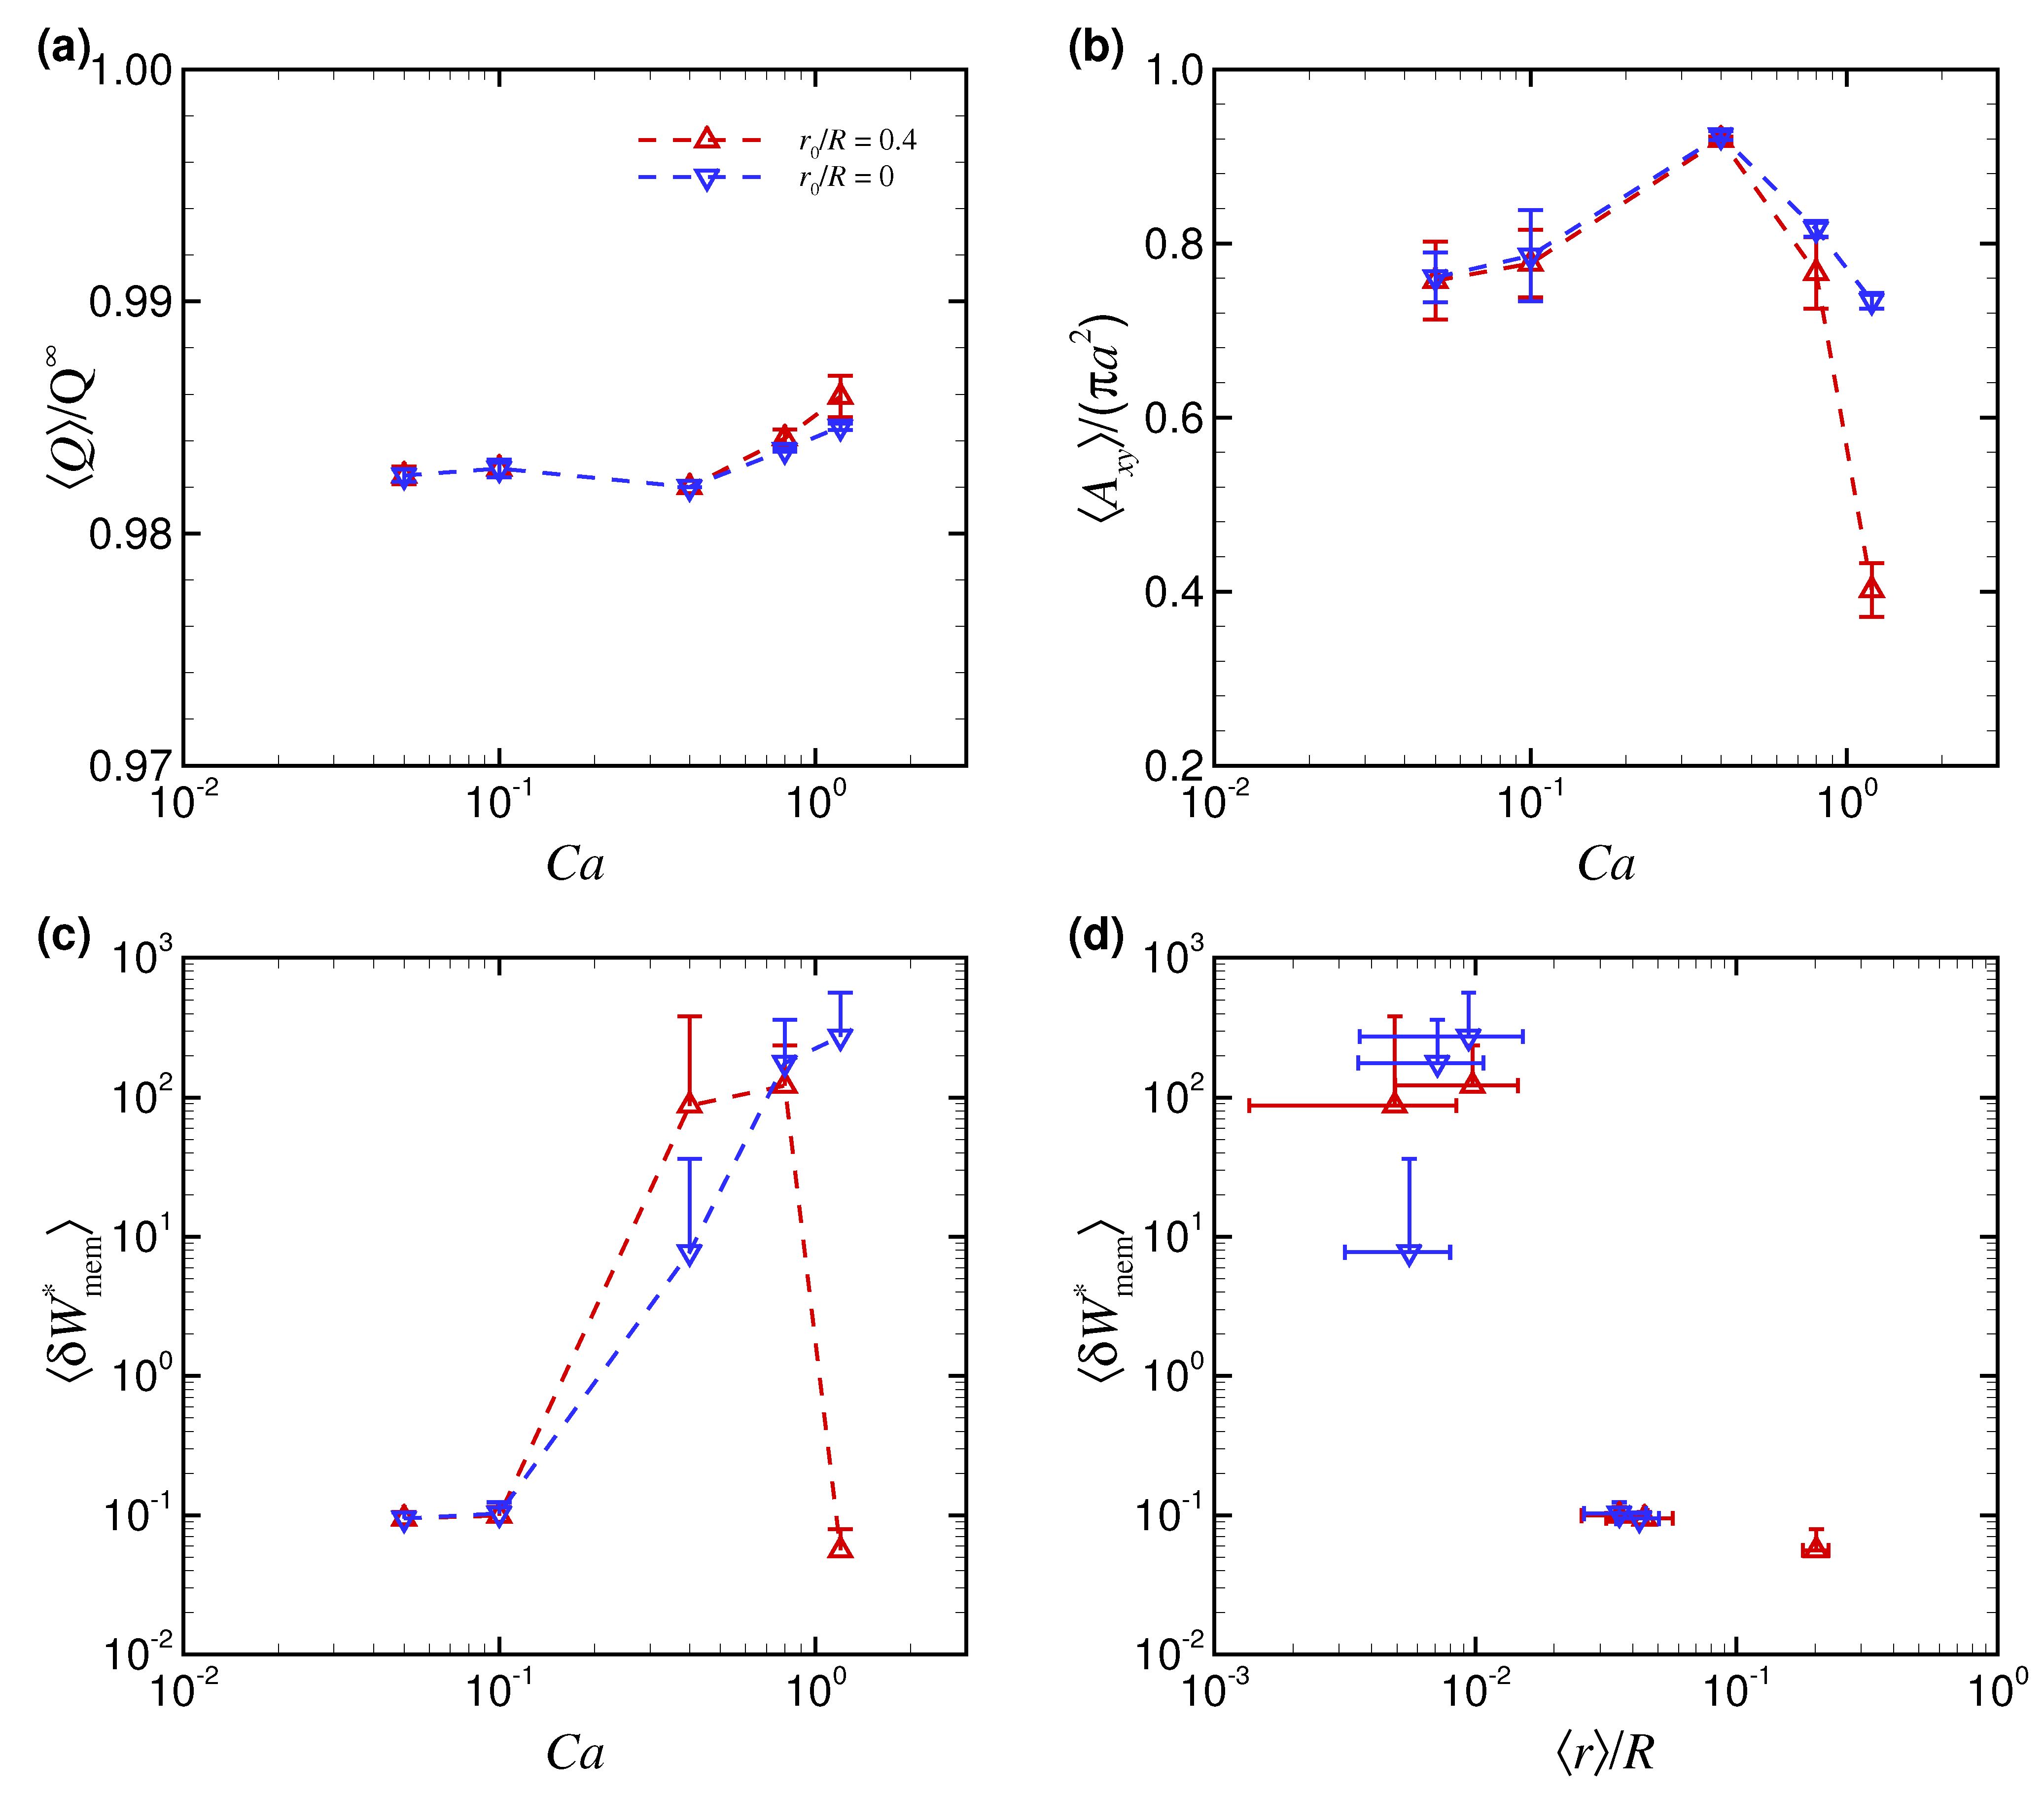
3.1. Effect of Capillary Number on RBC Shapes
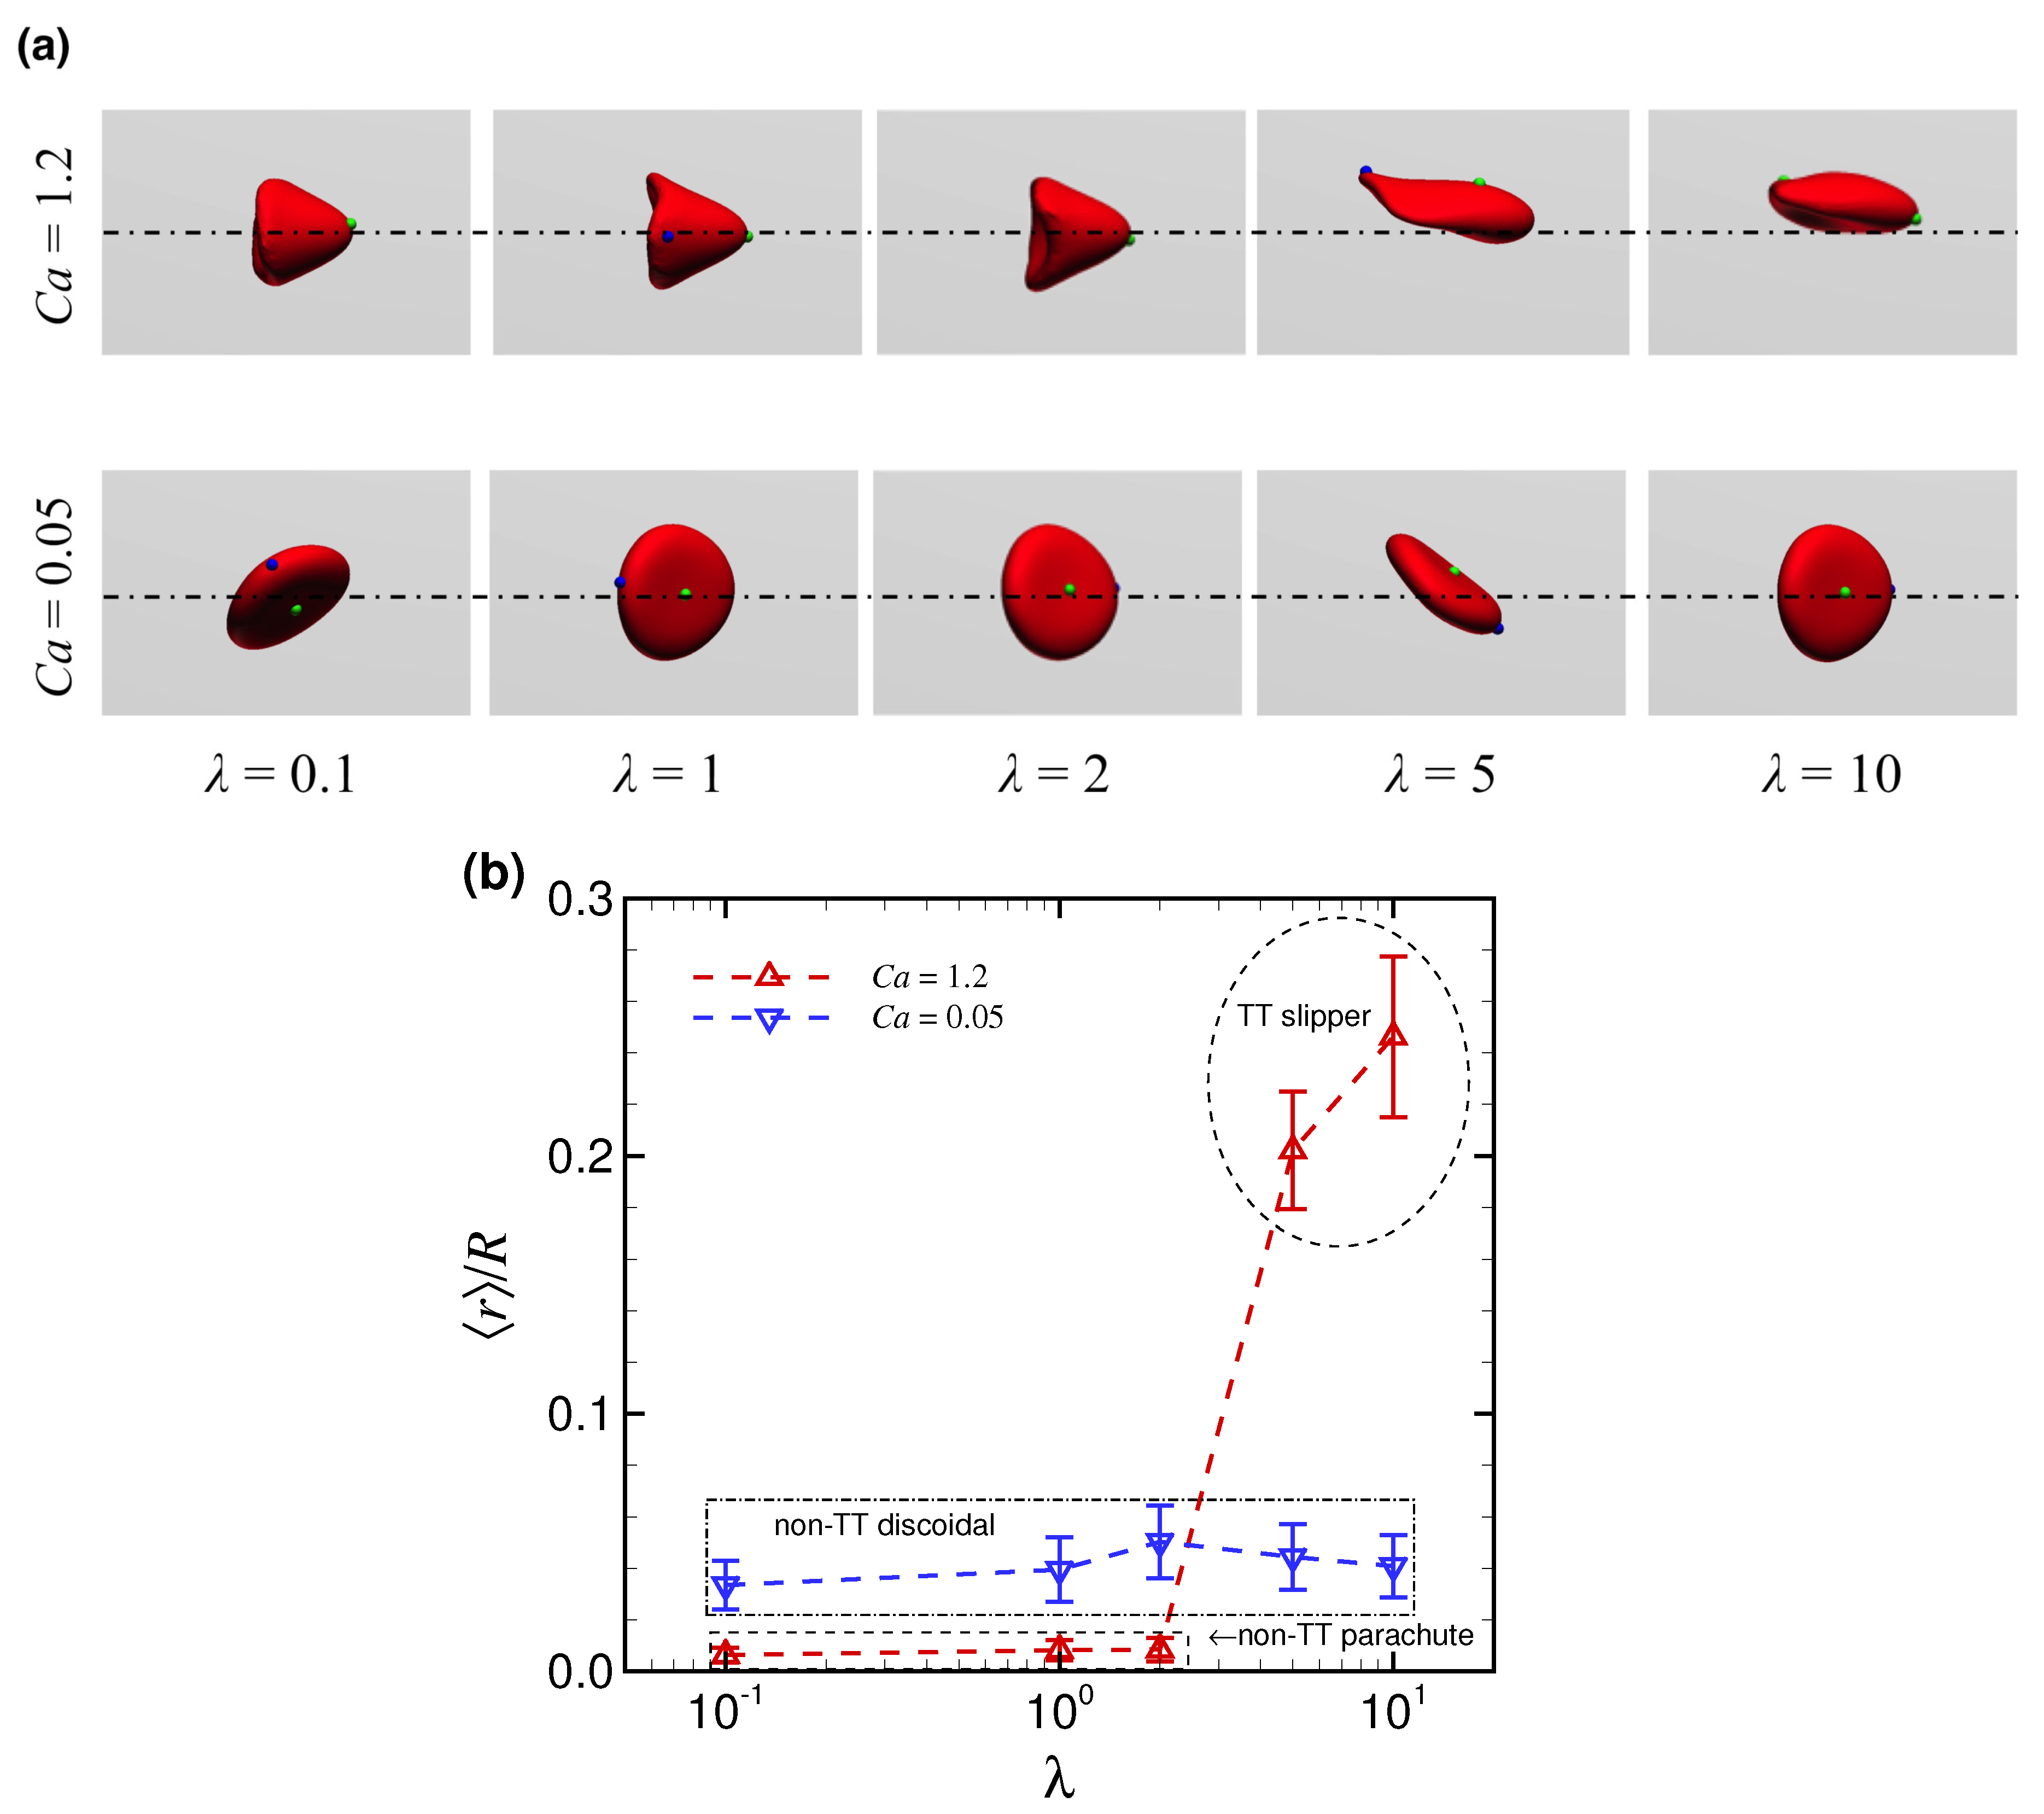
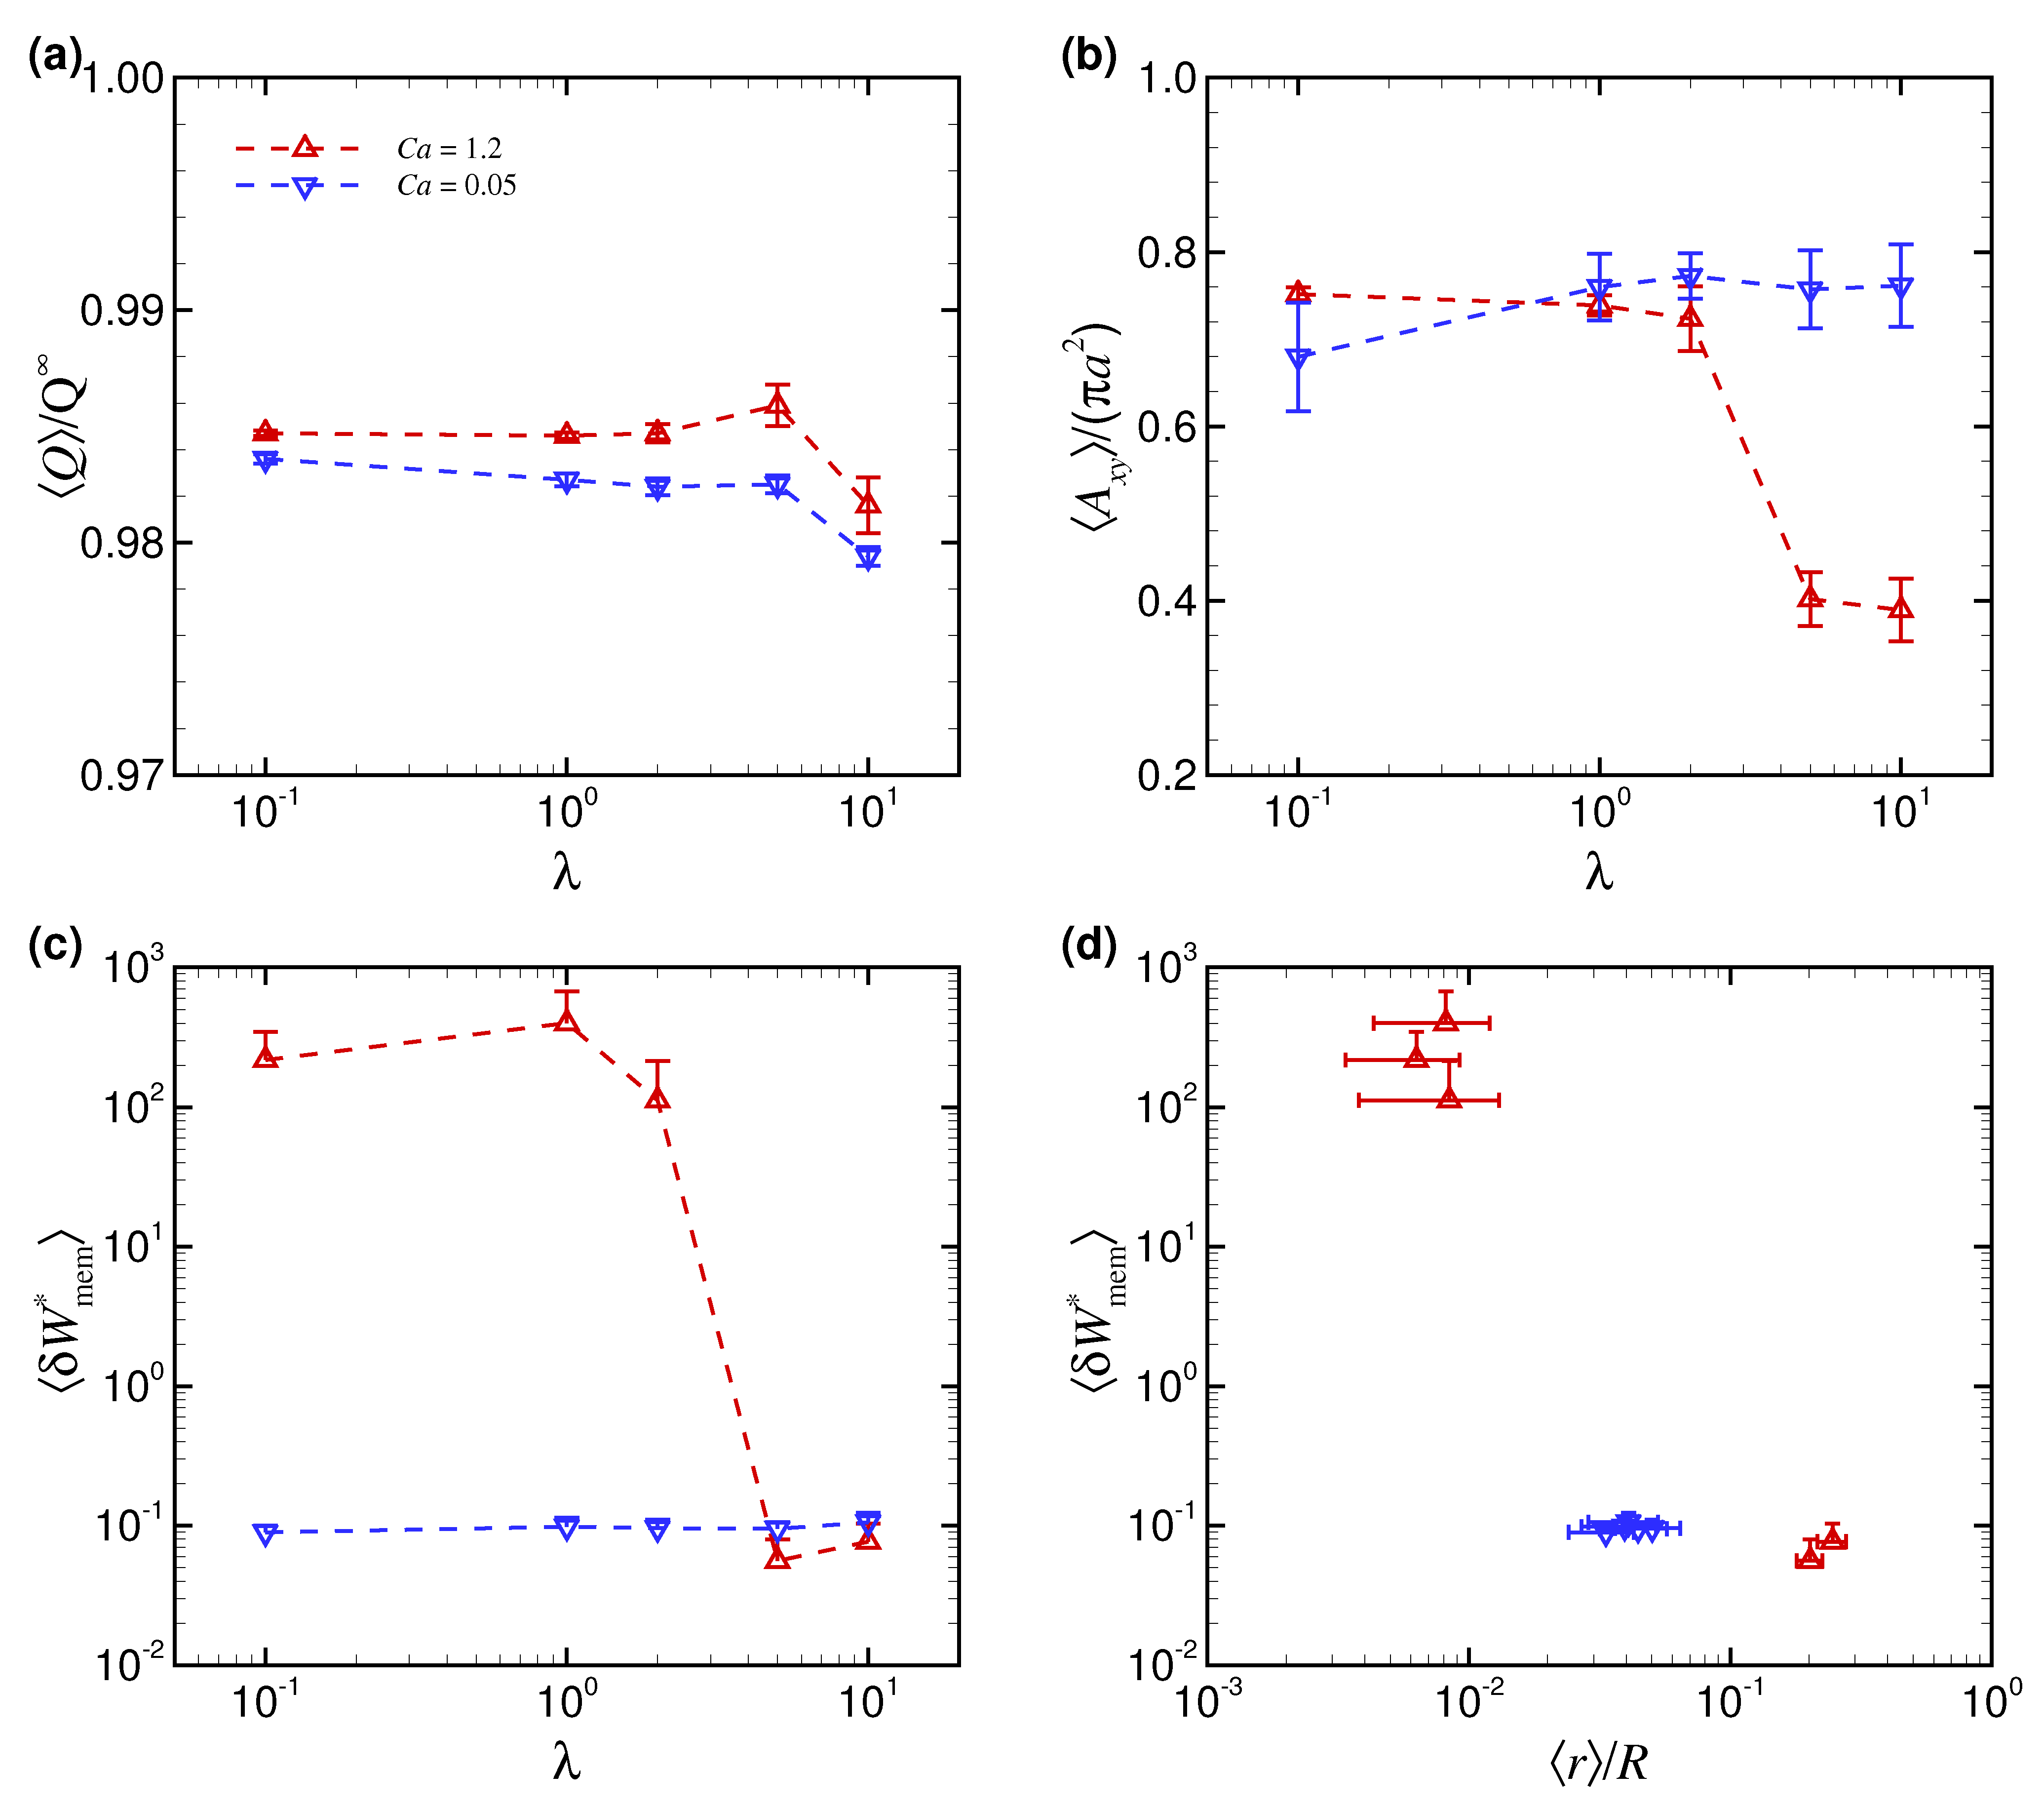
3.2. Effect of Viscosity Ratio on RBC Shapes
4. Discussion
5. Conclusions
Supplementary Materials
Author Contributions
Funding
Acknowledgments
Conflicts of Interest
Abbreviations
| RBC | Red blood cell |
| LBM | Lattice-Boltzmann method |
| FEM | Finite element method |
| IBM | Immersed boundary method |
| GPU | Graphics processing unit |
| (non-)TT motion | (non-)tank-treading motion |
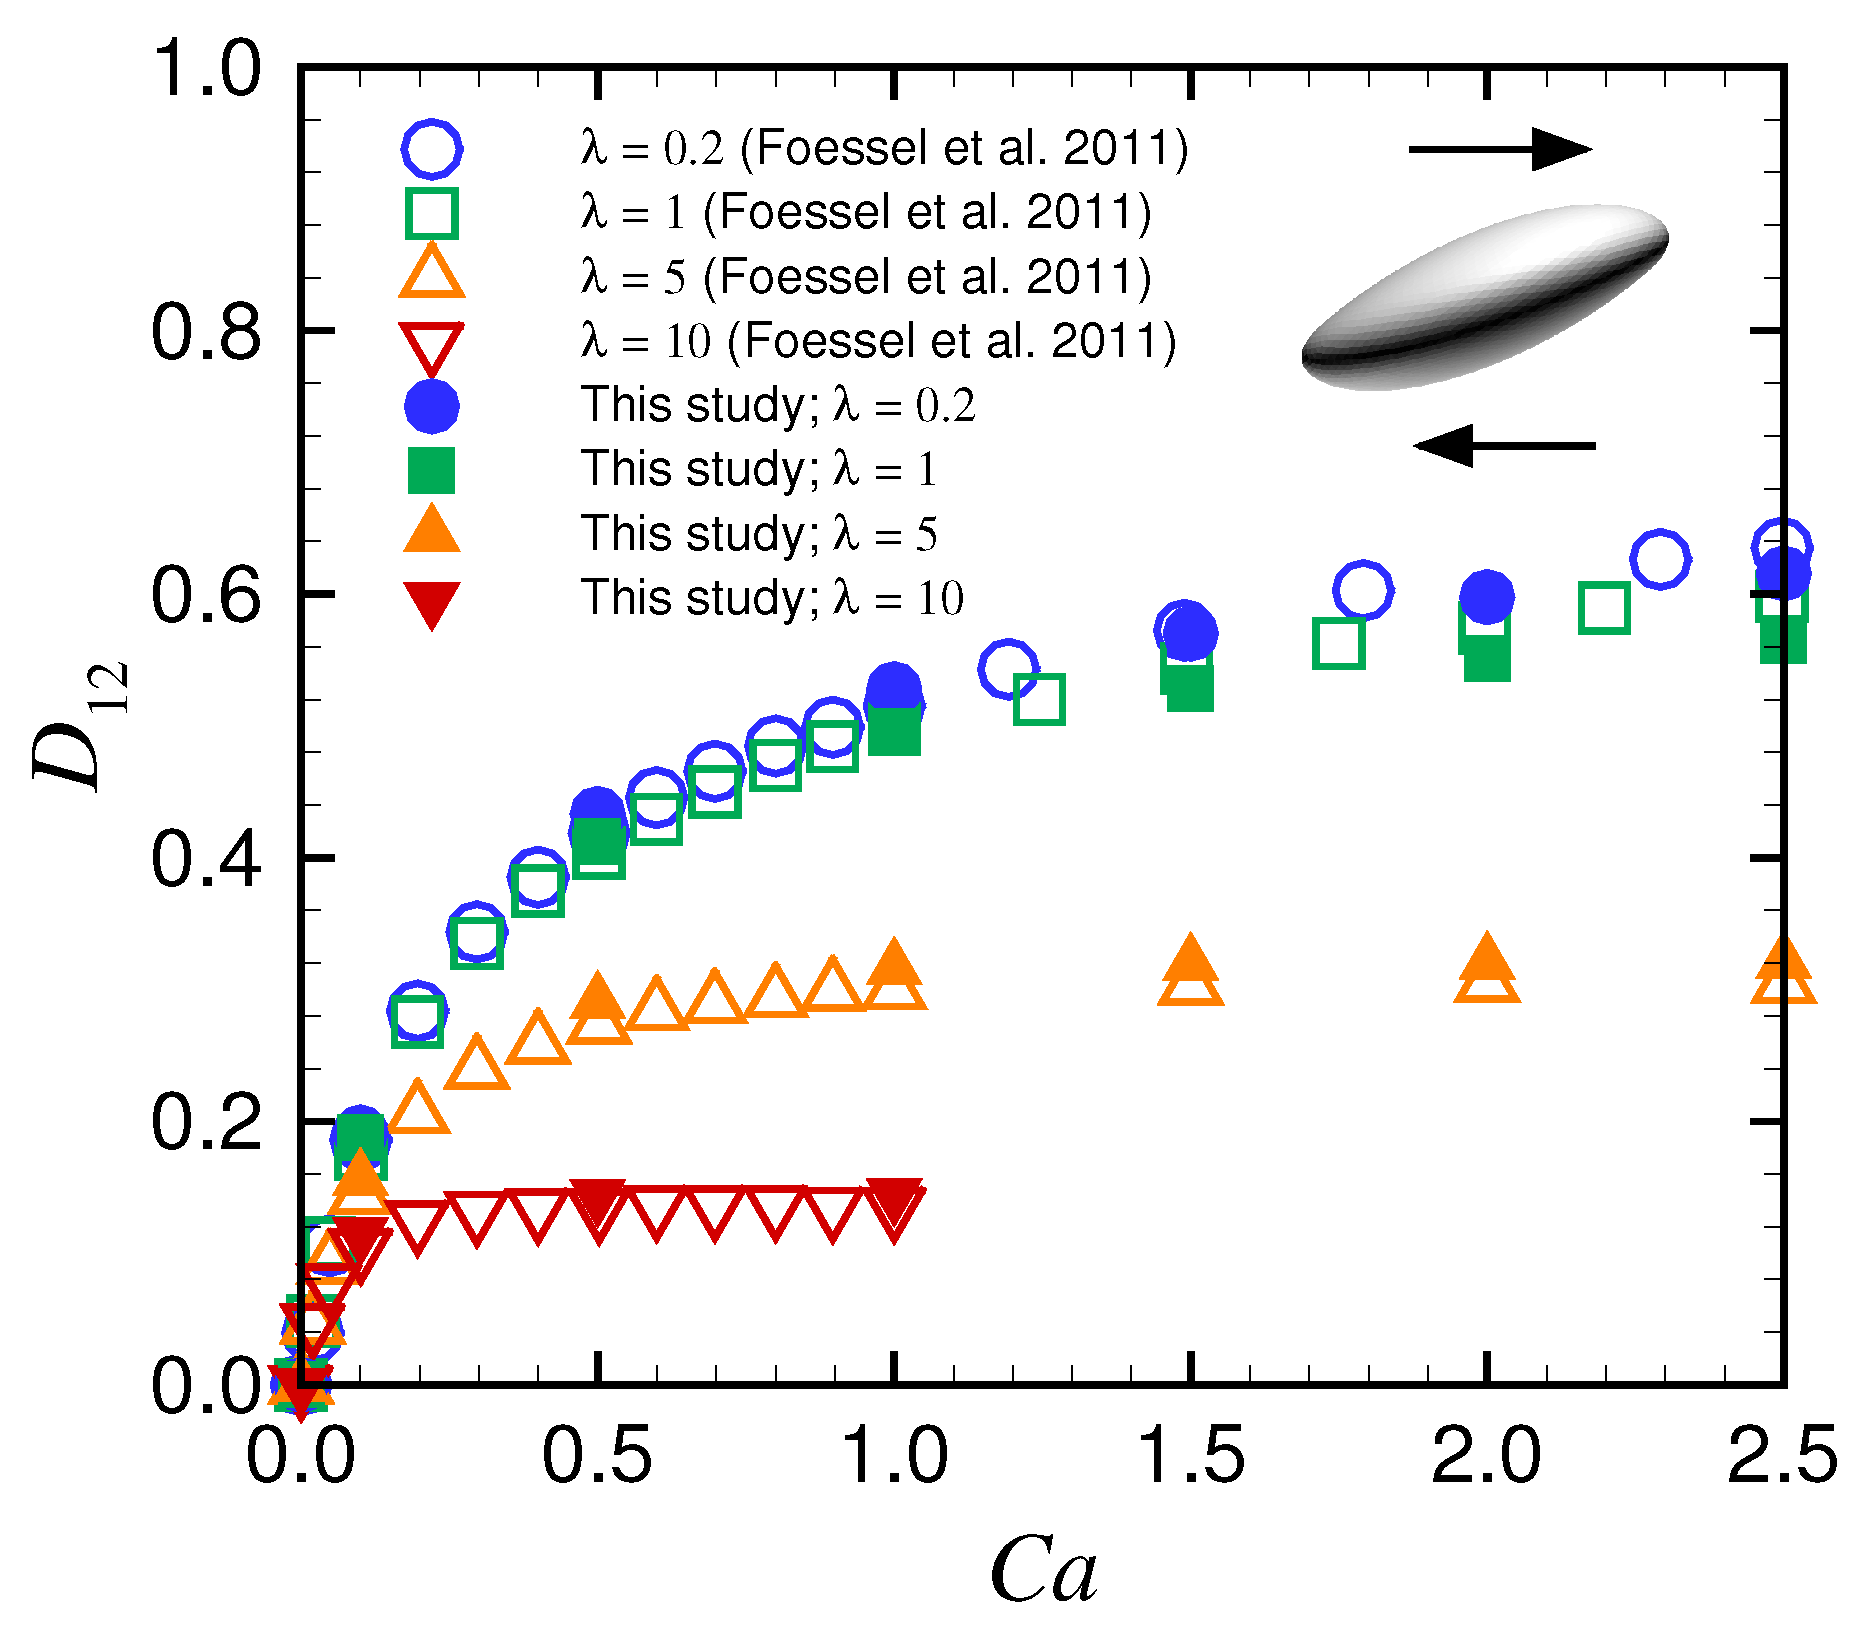
Appendix A. Deformation of a Spherical Capsule
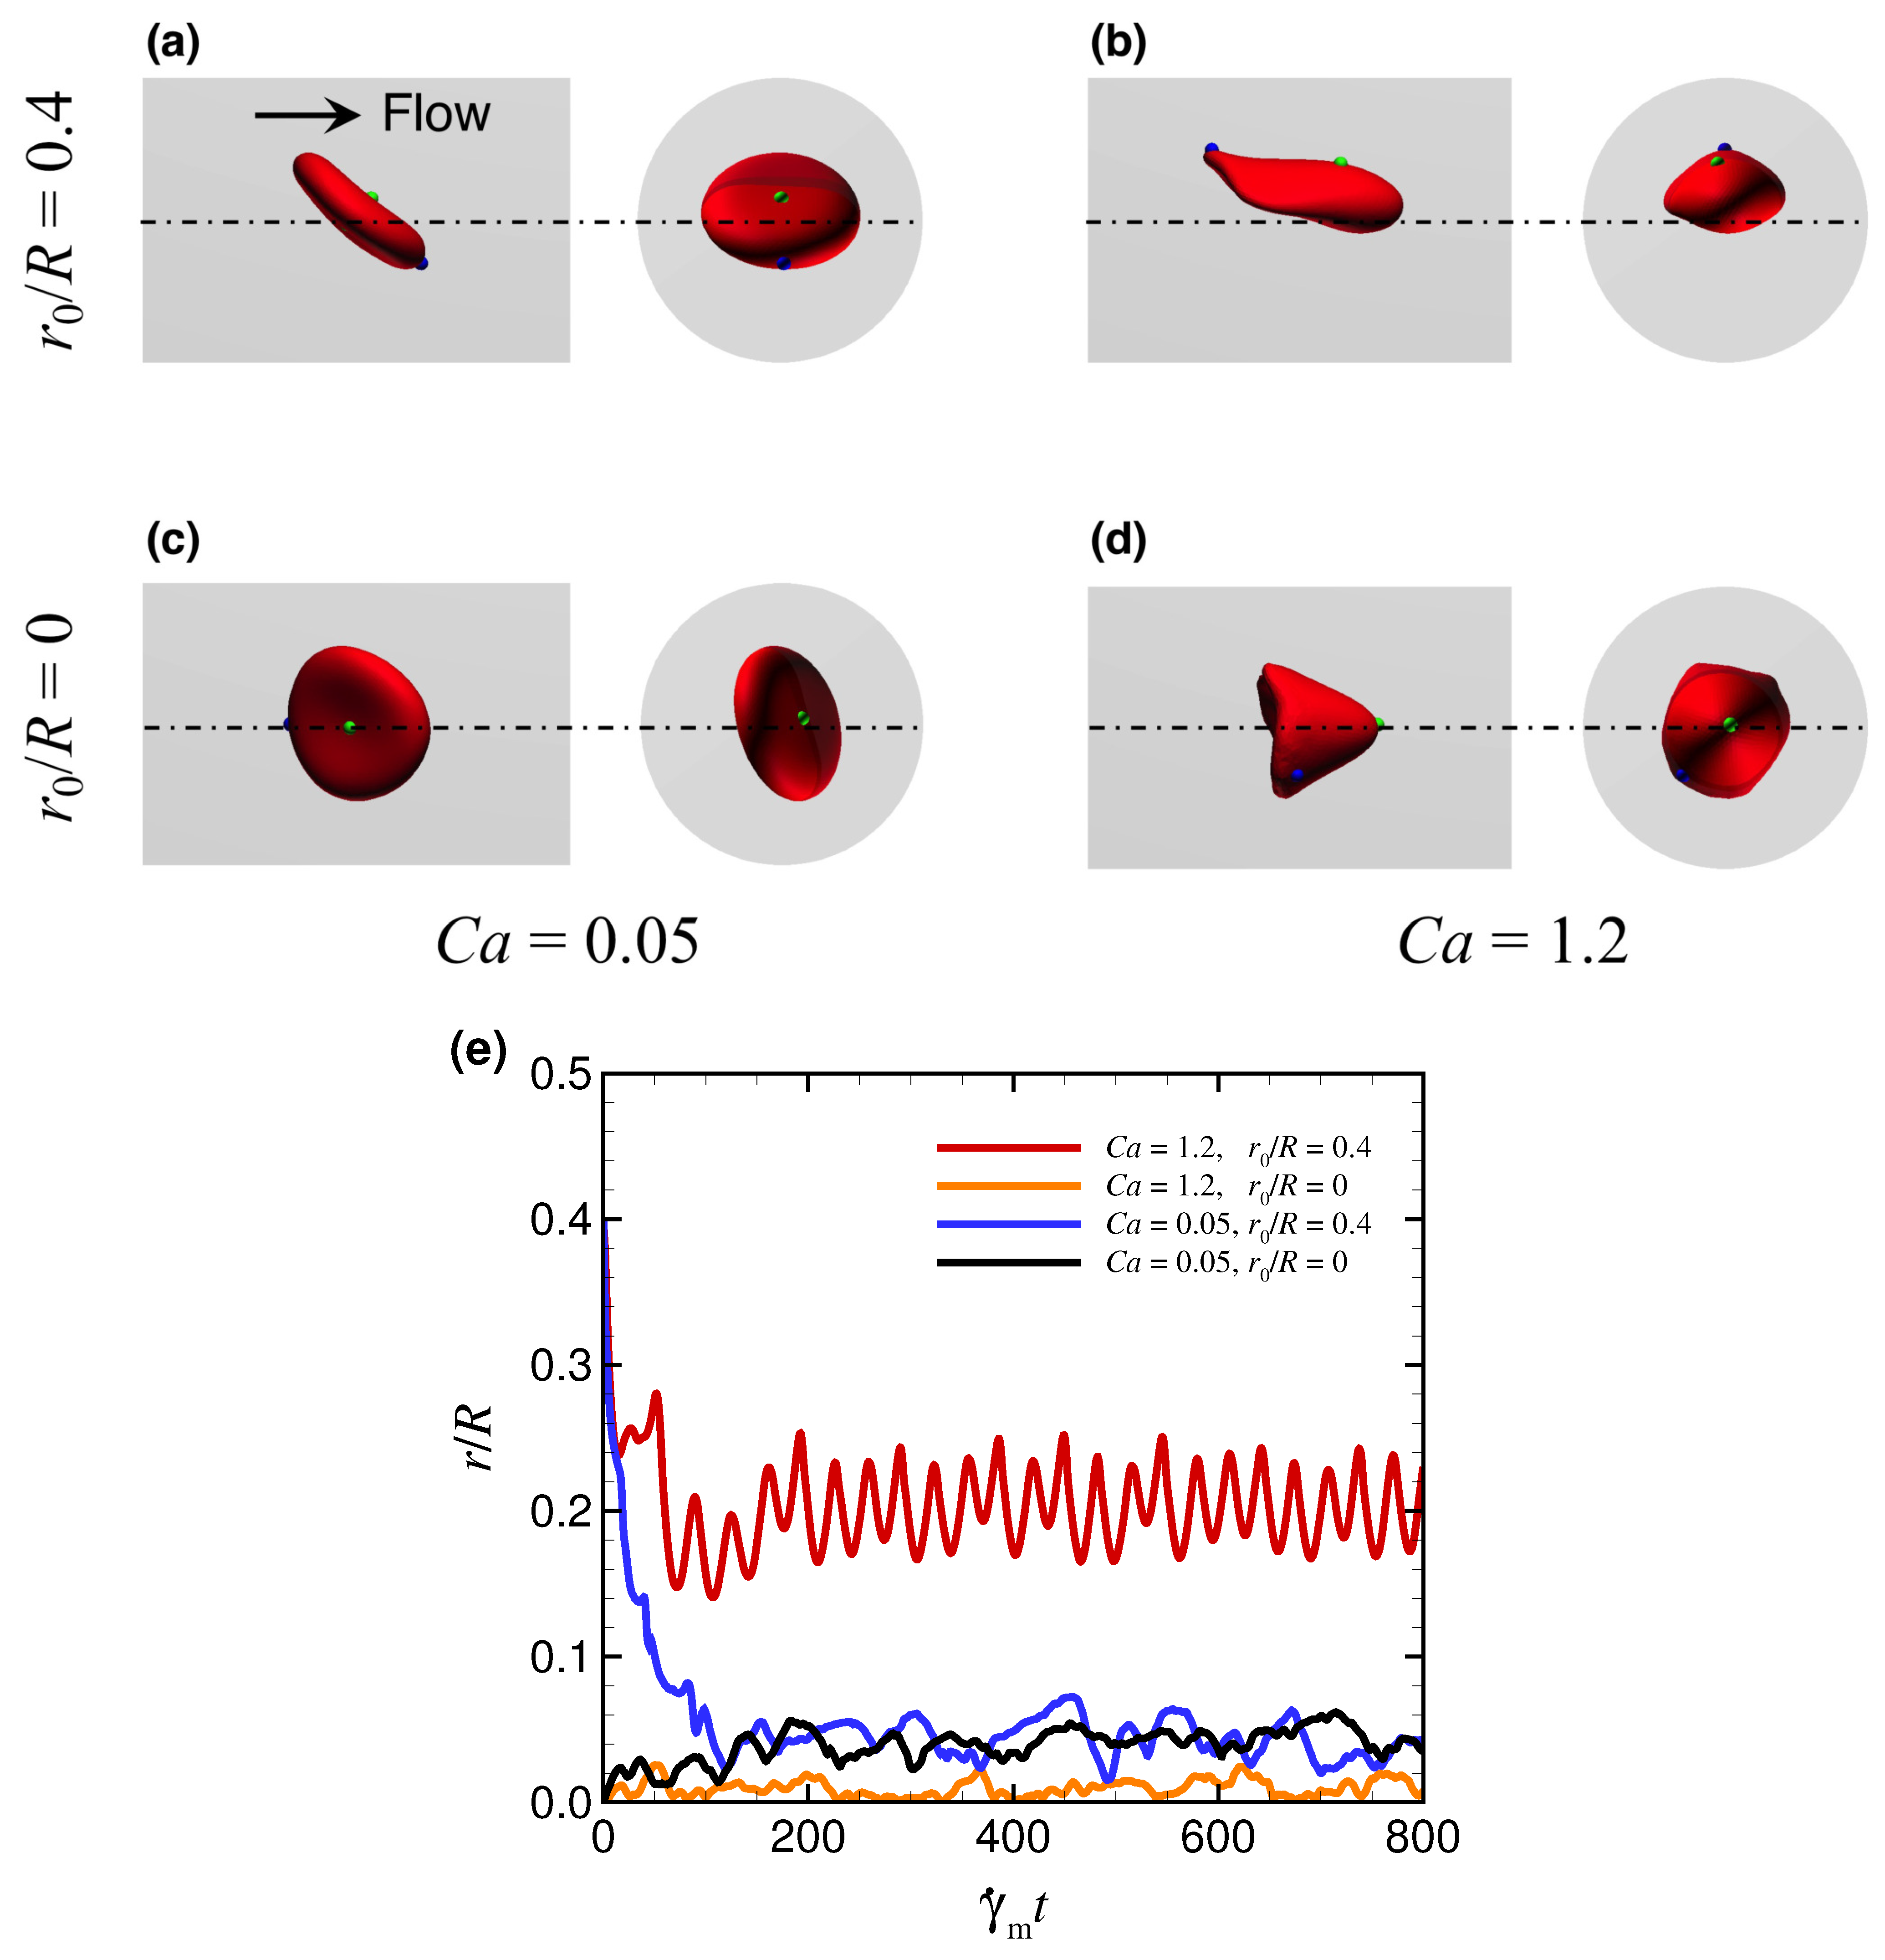
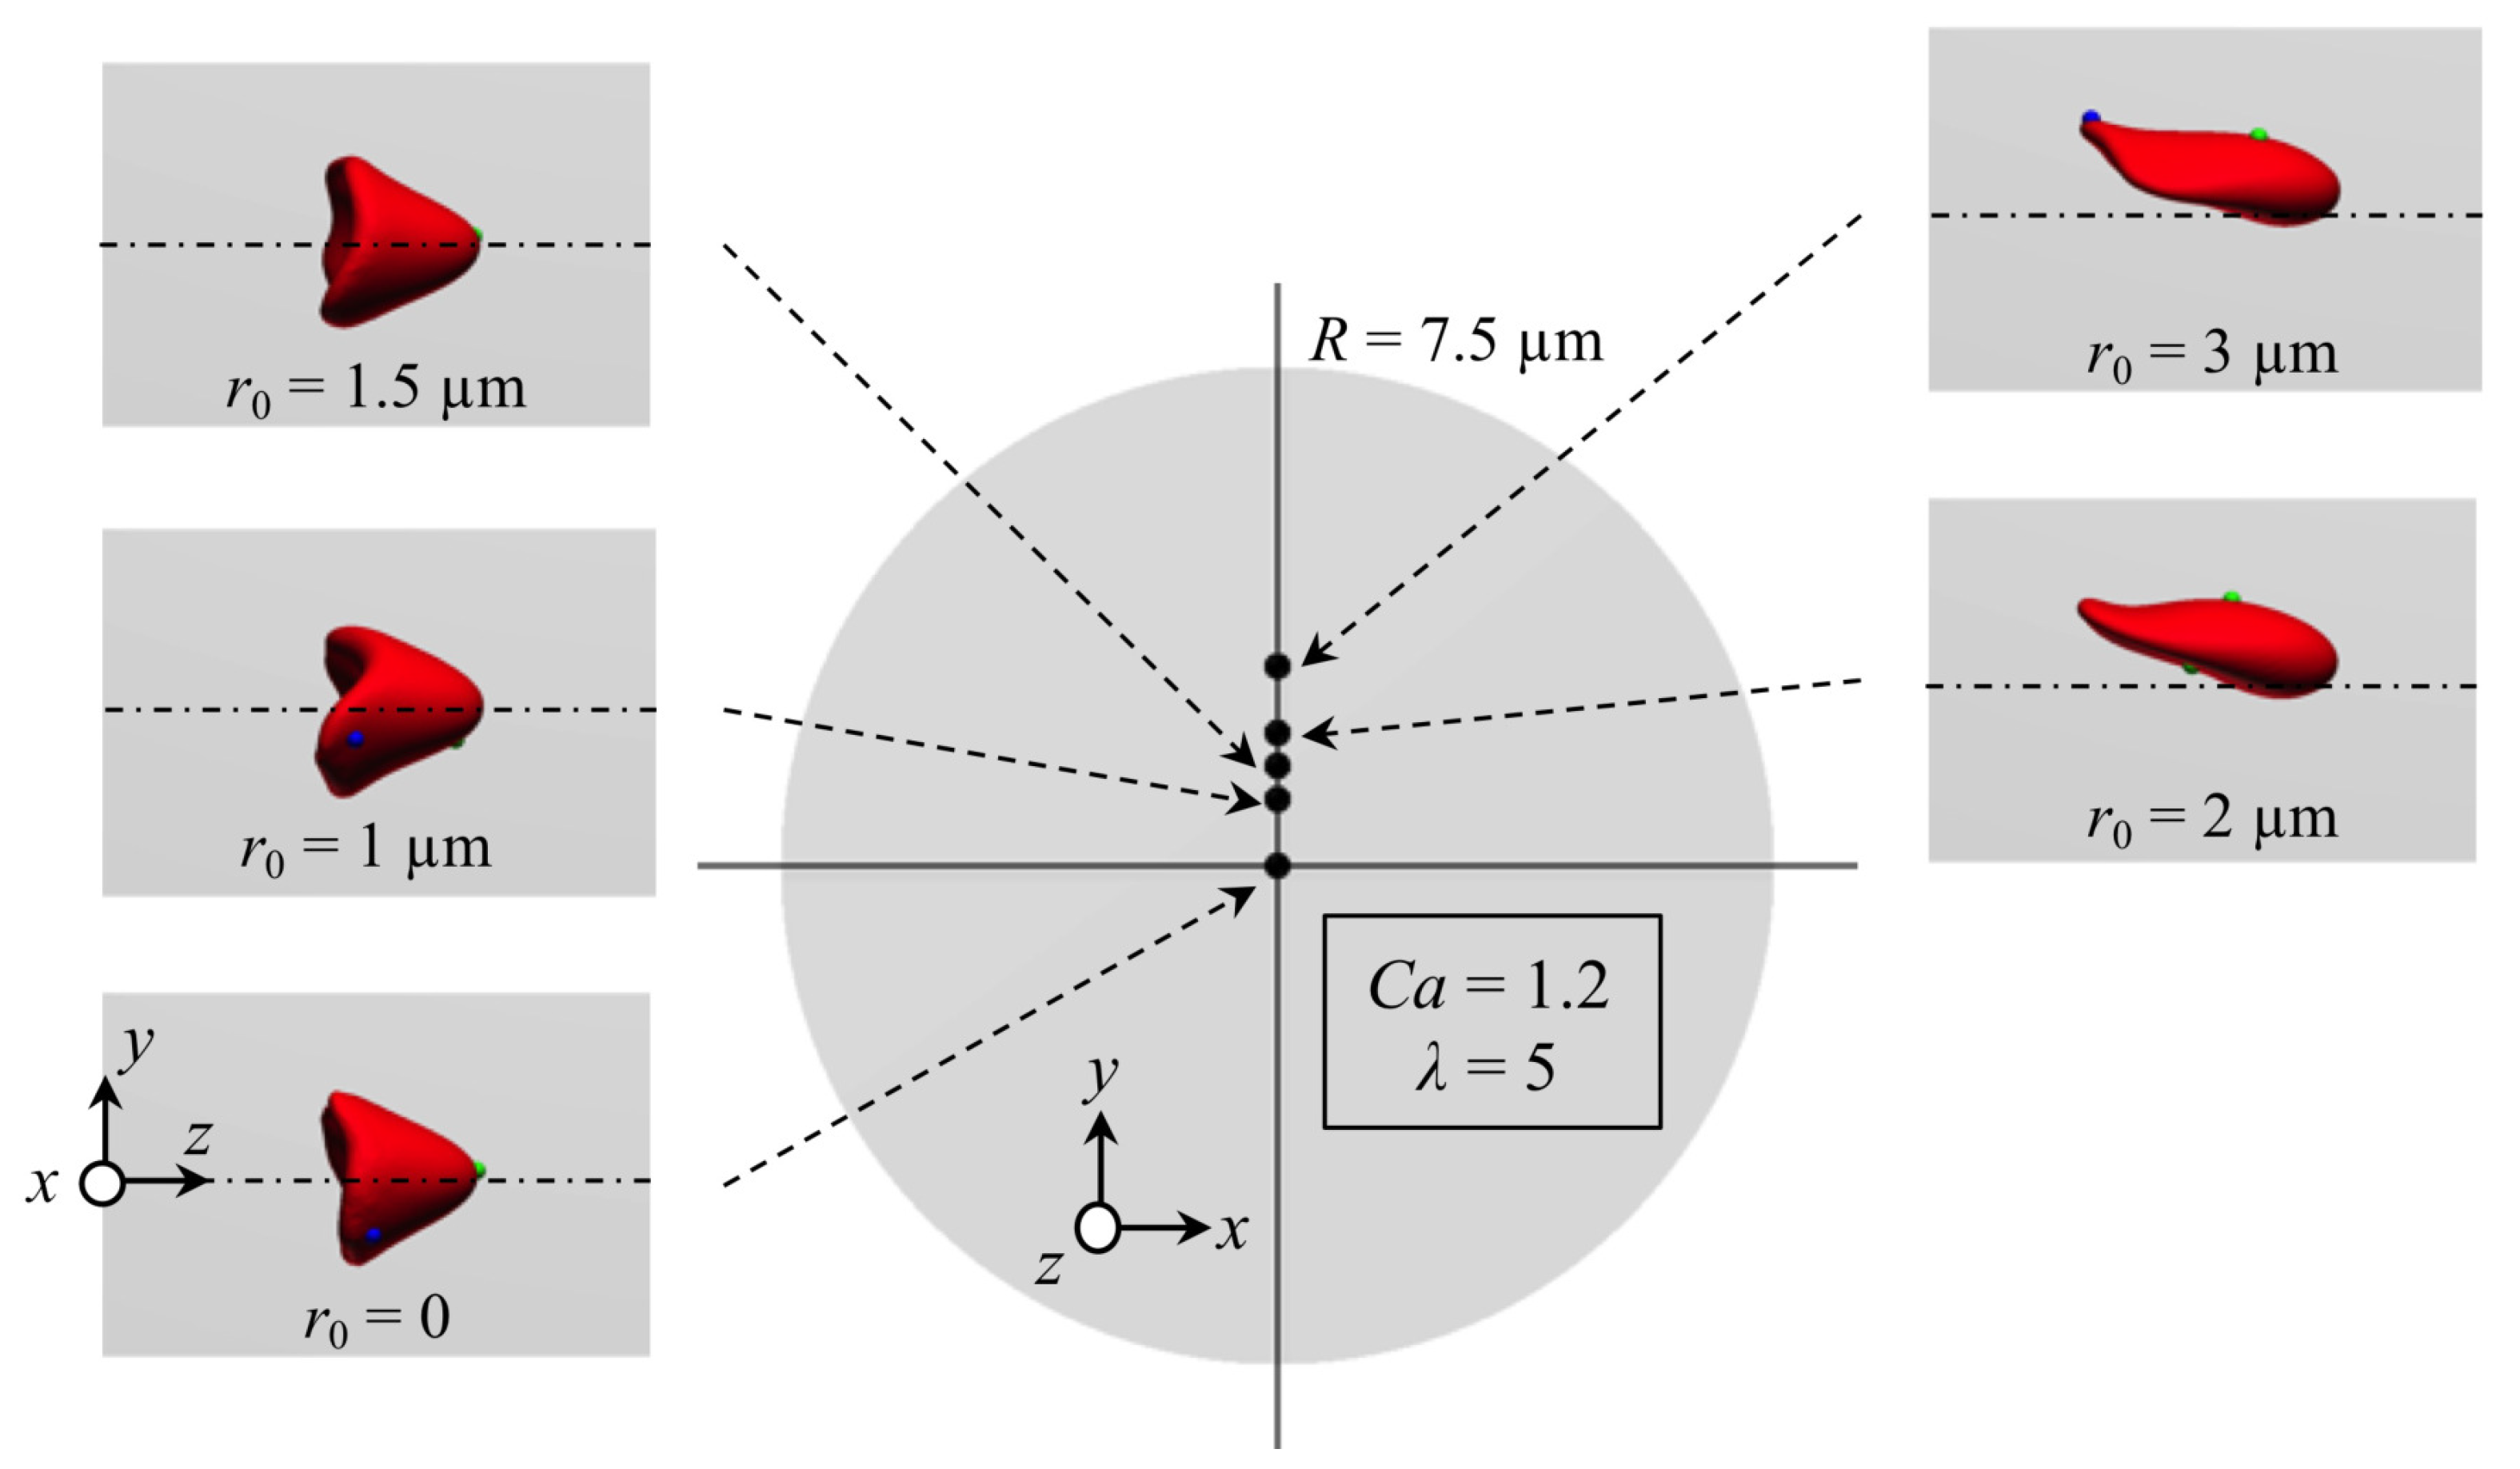
Appendix B. Effect of Initial Position of RBC on Stable Deformed Shapes

Appendix C. Behavior of a Spherical Capsule in a Circular Channel
References
- Lázaro, G.R.; Hernández-Machadoa, A.; Pagonabarraga, I. Rheology of red blood cells under flow in highly confined microchannels. I. Effect of elasticity. Soft Matter 2014, 10, 7195–7206. [Google Scholar] [CrossRef]
- Lázaro, G.R.; Hernández-Machadoa, A.; Pagonabarraga, I. Rheology of red blood cells under flow in highly confined microchannels. II. Effect of focusing and confinement. Soft Matter 2014, 10, 7207–7217. [Google Scholar] [CrossRef] [PubMed]
- Takeishi, N.; Rosti, M.E.; Imai, Y.; Wada, S.; Brandt, L. Haemorheology in dilute, semi-dilute and dense suspensions of red blood cells. J. Fluid Mech. 2019, 872, 818–848. [Google Scholar] [CrossRef] [Green Version]
- Skalak, R.; Branemark, P.I. Deformation of red blood cells in capillaries. Science 1969, 164, 717–719. [Google Scholar] [CrossRef] [PubMed]
- Guckenberger, A.; Kihm, A.; John, T.; Wagner, C.; Gekle, S. Numerical-experimental observation of shape bistability of red blood cells flowing in a microchannel. Soft Matter 2018, 14, 2032–2043. [Google Scholar] [CrossRef] [PubMed] [Green Version]
- Yaya, F.; Römer, J.; Guckenberger, A.; John, T.; Gekle, S.; Podgorski, T.; Wagner, C. Vortical flow structures induced by red blood cells in capillaries. Microcirculation 2021, 28, e12693. [Google Scholar] [CrossRef]
- Takeishi, N.; Ito, H.; Kaneko, M.; Wada, S. Deformation of a red blood cell in a narrow rectangular microchannel. Micromachines 2019, 10, 199. [Google Scholar] [CrossRef] [PubMed] [Green Version]
- Karnis, A.; Goldsmith, H.L.; Mason, S.G. Axial migration of particles in Poiseuille flow. Nature 1963, 14, 284–304. [Google Scholar] [CrossRef]
- Shi, L.; Pan, T.-W.; Glowinski, R. Lateral migration and equilibrium shape and position of a single red blood cell in bounded Poiseuille flows. Phys. Rev. E 2012, 86, 056306. [Google Scholar] [CrossRef] [Green Version]
- Kaoui, B.; Biros, G.; Misbah, C. Why do red blood cells have asymmetric shapes even in a symmetric flow? Phys. Rev. Lett. 2009, 103, 188101. [Google Scholar] [CrossRef] [Green Version]
- Hogan, B.; Shen, Z.; Zhang, H.; Misbah, C.; Barakat, A.I. Shear stress in the microvasculature: Influence of red blood cell morphology and endothelial wall undulation. Biomech. Model. Mechanobiol. 2019, 18, 1095–1109. [Google Scholar] [CrossRef] [PubMed]
- Noguchi, H.; Gompper, G. Shape transitions of fluid vesicles and red blood cells in capillary flows. Proc. Natl. Acad. Sci. USA 2005, 102, 14159–14164. [Google Scholar] [CrossRef] [Green Version]
- Fedosov, D.A.; Peltomäki, M.; Gompper, G. Deformation and dynamics of red blood cells in flow through cylindrical microchannels. Soft Matter 2014, 10, 4258–4267. [Google Scholar] [CrossRef] [PubMed] [Green Version]
- Ciftlik, A.T.; Ettori, M.; Gijs, M.A.M. High throughput-per-footprint inertial focusing. Small 2013, 9, 2764–2773. [Google Scholar] [CrossRef] [PubMed]
- Fregin, B.; Czerwinski, F.; Biedenweg, D.; Girardo, S.; Gross, S.; Aurich, K.; Otto, O. High-throughput single-cell rheology in complex samples by dynamic real-time deformability cytometry. Nat. Commun. 2019, 10, 415. [Google Scholar] [CrossRef] [Green Version]
- Ito, H.; Murakami, R.; Sakuma, S.; Tsai, C.-H.D.; Gutsmann, T.; Brandenburg, K.; Poöschl, J.M.B.; Arai, F.; Kaneko, M.; Tanaka, M. Mechanical diagnosis of human eryhrocytes by ultra-high speed manipulation unraveled critical time window for global cytoskeletal remodeling. Sci. Rep. 2017, 7, 43134. [Google Scholar] [CrossRef] [PubMed]
- Kihm, A.; Kaestner, L.; Wagner1, C.; Quint, S. Classification of red blood cell shapes in flow using outlier tolerant machine learning. PLoS Comput. Biol. 2019, 14, e1006278. [Google Scholar] [CrossRef] [Green Version]
- Lu, X.; Wood, D.K.; Higgins, J.M. Deoxygenation reduces sickle cell blood flow at arterial oxygen tension. Biophys. J. 2016, 110, 2751–2758. [Google Scholar] [CrossRef] [PubMed] [Green Version]
- McMahon, T.J. Red blood cell deformability, vasoactive mediators, and adhesion. Front. Physiol. 2019, 10, 1417. [Google Scholar] [CrossRef] [PubMed]
- Chien, S.; Usami, S.; Bertles, J.F. Abnormal rheology of oxygenated blood in sickle cell anemia. J. Clin. Investig. 1970, 49, 623–634. [Google Scholar] [CrossRef] [Green Version]
- Usami, S.; Chien, S.; Scholtz, P.M.; Bertles, J.F. Effect of deoxygenation on blood rheology in sickle cell disease. Microvasc. Res. 1975, 9, 324–334. [Google Scholar] [CrossRef]
- Kaul, D.K.; Xue, H. Rate of deoxygenation and rheologic behavior of blood in sickle cell anemia. Blood 1991, 77, 1353–1361. [Google Scholar] [CrossRef] [PubMed] [Green Version]
- Skalak, R.; Tozeren, A.; Zarda, R.P.; Chien, S. Strain energy function of red blood cell membranes. Biophys. J. 1973, 13, 245–264. [Google Scholar] [CrossRef] [Green Version]
- Takeishi, N.; Imai, Y.; Nakaaki, K.; Yamaguchi, T.; Ishikawa, T. Leukocyte margination at arteriole shear rate. Physiol. Rep. 2014, 2, e12037. [Google Scholar] [CrossRef] [PubMed]
- Takeishi, N.; Imai, Y.; Yamaguchi, T.; Ishikawa, T. Flow of a circulating tumor cell and red blood cells in microvessels. Phys. Rev. E 2015, 92, 063011. [Google Scholar] [CrossRef] [PubMed]
- Evans, E.; Fung, Y.-C. Improved measurements of the erythrocyte geometry. Microvasc. Res. 1972, 4, 335–347. [Google Scholar] [CrossRef]
- Barthés-Biesel, D.; Diaz, A.; Dheni, E. Effect of constitutive laws for two-dimensional membranes on flow-induced capsule deformation. J. Fluid. Mech. 2002, 460, 211–222. [Google Scholar] [CrossRef]
- Li, J.; Dao, M.; Lim, C.T.; Suresh, S. Spectrin-level modeling of the cytoskeleton and optical tweezers stretching of the erythrocyte. Phys. Fluid 2005, 88, 3707–6719. [Google Scholar] [CrossRef] [PubMed] [Green Version]
- de Morales Marinkovic, M.P.; Turner, K.T.; Butler, J.P.; Fredberg, J.J.; Suresh, S. Viscoelasticity of the human red blood cell. Am. J. Physiol. Cell Physiol. 2007, 293, C597–C605. [Google Scholar] [CrossRef] [Green Version]
- Suresh, S.; Spatz, J.; Mills, J.P.; Micoulet, A.; Dao, M.; Lim, C.T.; Beil, M.; Seufferlein, T. Connections between single-cell biomechanics and human disease states: Gastrointestinal cancer and malaria. Acta Biomater. 2005, 1, 15–30. [Google Scholar] [CrossRef]
- Mohandas, N.; Gallagher, P.G. Red cell membrane: Past, present, and future. Blood 2008, 112, 3939–3948. [Google Scholar] [CrossRef] [PubMed] [Green Version]
- Harkness, J.; Whittington, R.B. Blood-plasma viscosity: An approximate temperature-invariant arising from generalised concepts. Biorheology 1970, 6, 169–187. [Google Scholar] [CrossRef] [PubMed]
- Takeishi, N.; Imai, Y.; Ishida, S.; Omori, T.; Kamm, R.D.; Ishikawa, T. Cell adhesion during bullet motion in capillaries. Am. J. Physiol. Heart Circ. Physiol. 2016, 311, H395–H403. [Google Scholar] [CrossRef] [Green Version]
- Koutsiaris, A.G.; Tachmitzi, S.V.; Batis, N. Wall shear stress quantification in the human conjunctival pre-capillary arterioles in vivo. Microvasc. Res. 2013, 85, 34–39. [Google Scholar] [CrossRef]
- Koutsiaris, A.G.; Tachmitzi, S.V.; Batis, N.; Kotoula, M.G.; Karabatsas, C.H.; Tsironi, E.; Chatzoulis, D.Z. Volume flow and wall shear stress quantification in the human conjunctival capillaries and post-capillary venules in vivo. Biorheology 2007, 44, 375–386. [Google Scholar]
- Chen, S.; Doolen, G.D. Lattice boltzmann method for fluid flow. Annu. Rev. Fluid Mech. 1998, 30, 329–364. [Google Scholar] [CrossRef] [Green Version]
- Walter, J.; Salsac, A.V.; Barthés-Biesel, D.; Le Tallec, P. Coupling of finite element and boundary integral methods for a capsule in a stokes flow. Int. J. Numer. Meth. Eng. 2010, 83, 829–850. [Google Scholar] [CrossRef]
- Peskin, C.S. The immersed boundary method. Acta Numer. 2002, 11, 479–517. [Google Scholar]
- Case, L.D.C.; Ku, D.N. Thrombus formation at high shear rates. Annu. Rev. Biomed. Eng. 2017, 19, 413–415. [Google Scholar] [CrossRef] [PubMed]
- Aouane, O.; Thiébaud, M.; Benyoussef, A.; Wagner, C.; Misbah, C. Vesicle dynamics in a confined Poiseuille flow: From steady state to chaos. Phys. Rev. E 2014, 90, 033011. [Google Scholar] [CrossRef] [PubMed] [Green Version]
- Kaoui, B.; Tahiri, N.; Biben, T.; Ez-Zahraouy, H.; Benyoussef, A.; Biros, G.; Misbah, C. Complexity of vesicle microcirculation Phys. Rev. E 2011, 84, 041906. [Google Scholar]
- Tahiri, N.; Biben, T.; Ez-Zahraouy, H.; Benyoussef, A.; Misbah, C. On the problem of slipper shapes of red blood cells in the microvasculature. Microvasc. Res. 2013, 85, 40–45. [Google Scholar] [CrossRef] [PubMed]
- Ye, T.; Shi, H.; Peng, L.; Li, Y. Numerical studies of a red blood cell in rectangular microchannels. J. Appl. Phys. 2017, 122, 084701. [Google Scholar] [CrossRef]
- Peng, Z.; Asaro, R.J.; Zhu, Q. Multiscale modelling of erythrocytes in Stokes flow. J. Fluid Mech. 2011, 686, 299–337. [Google Scholar] [CrossRef] [Green Version]
- Torres-Sánchez, A.; Millán, D.; Arroyo, M. Modelling fluid deformable surfaces with an emphasis on biological interfaces. J. Fluid Mech. 2019, 872, 271–281. [Google Scholar] [CrossRef] [Green Version]
- Yazdani, A.; Bagchi, P. Influence of membrane viscosity on capsule dynamics in shear flow. J. Fluid Mech. 2013, 718, 569–595. [Google Scholar] [CrossRef]
- Ramanujan, S.; Pozrikidis, C. Deformation of liquid capsules enclosed by elastic membranes in simple shear flow: Large deformations and the effect of fluid viscosities. J. Fluid Mech. 1998, 361, 117–143. [Google Scholar] [CrossRef]
- Foessel, É.; Walter, J.; Salsac, A.-V.; Barthés-Biesel, D. Influence of internal viscosity on the large deformation and buckling of a spherical capsule in a simple shear flow. J. Fluid Mech. 2011, 672, 477–486. [Google Scholar] [CrossRef] [Green Version]


Publisher’s Note: MDPI stays neutral with regard to jurisdictional claims in published maps and institutional affiliations. |
© 2021 by the authors. Licensee MDPI, Basel, Switzerland. This article is an open access article distributed under the terms and conditions of the Creative Commons Attribution (CC BY) license (https://creativecommons.org/licenses/by/4.0/).
Share and Cite
Takeishi, N.; Yamashita, H.; Omori, T.; Yokoyama, N.; Sugihara-Seki, M. Axial and Nonaxial Migration of Red Blood Cells in a Microtube. Micromachines 2021, 12, 1162. https://doi.org/10.3390/mi12101162
Takeishi N, Yamashita H, Omori T, Yokoyama N, Sugihara-Seki M. Axial and Nonaxial Migration of Red Blood Cells in a Microtube. Micromachines. 2021; 12(10):1162. https://doi.org/10.3390/mi12101162
Chicago/Turabian StyleTakeishi, Naoki, Hiroshi Yamashita, Toshihiro Omori, Naoto Yokoyama, and Masako Sugihara-Seki. 2021. "Axial and Nonaxial Migration of Red Blood Cells in a Microtube" Micromachines 12, no. 10: 1162. https://doi.org/10.3390/mi12101162
APA StyleTakeishi, N., Yamashita, H., Omori, T., Yokoyama, N., & Sugihara-Seki, M. (2021). Axial and Nonaxial Migration of Red Blood Cells in a Microtube. Micromachines, 12(10), 1162. https://doi.org/10.3390/mi12101162