Effect of KDP-Crystal Material Properties on Surface Morphology in Ultra-Precision Fly Cutting


Abstract
1. Introduction
2. KDP Crystal Material Properties Analysis
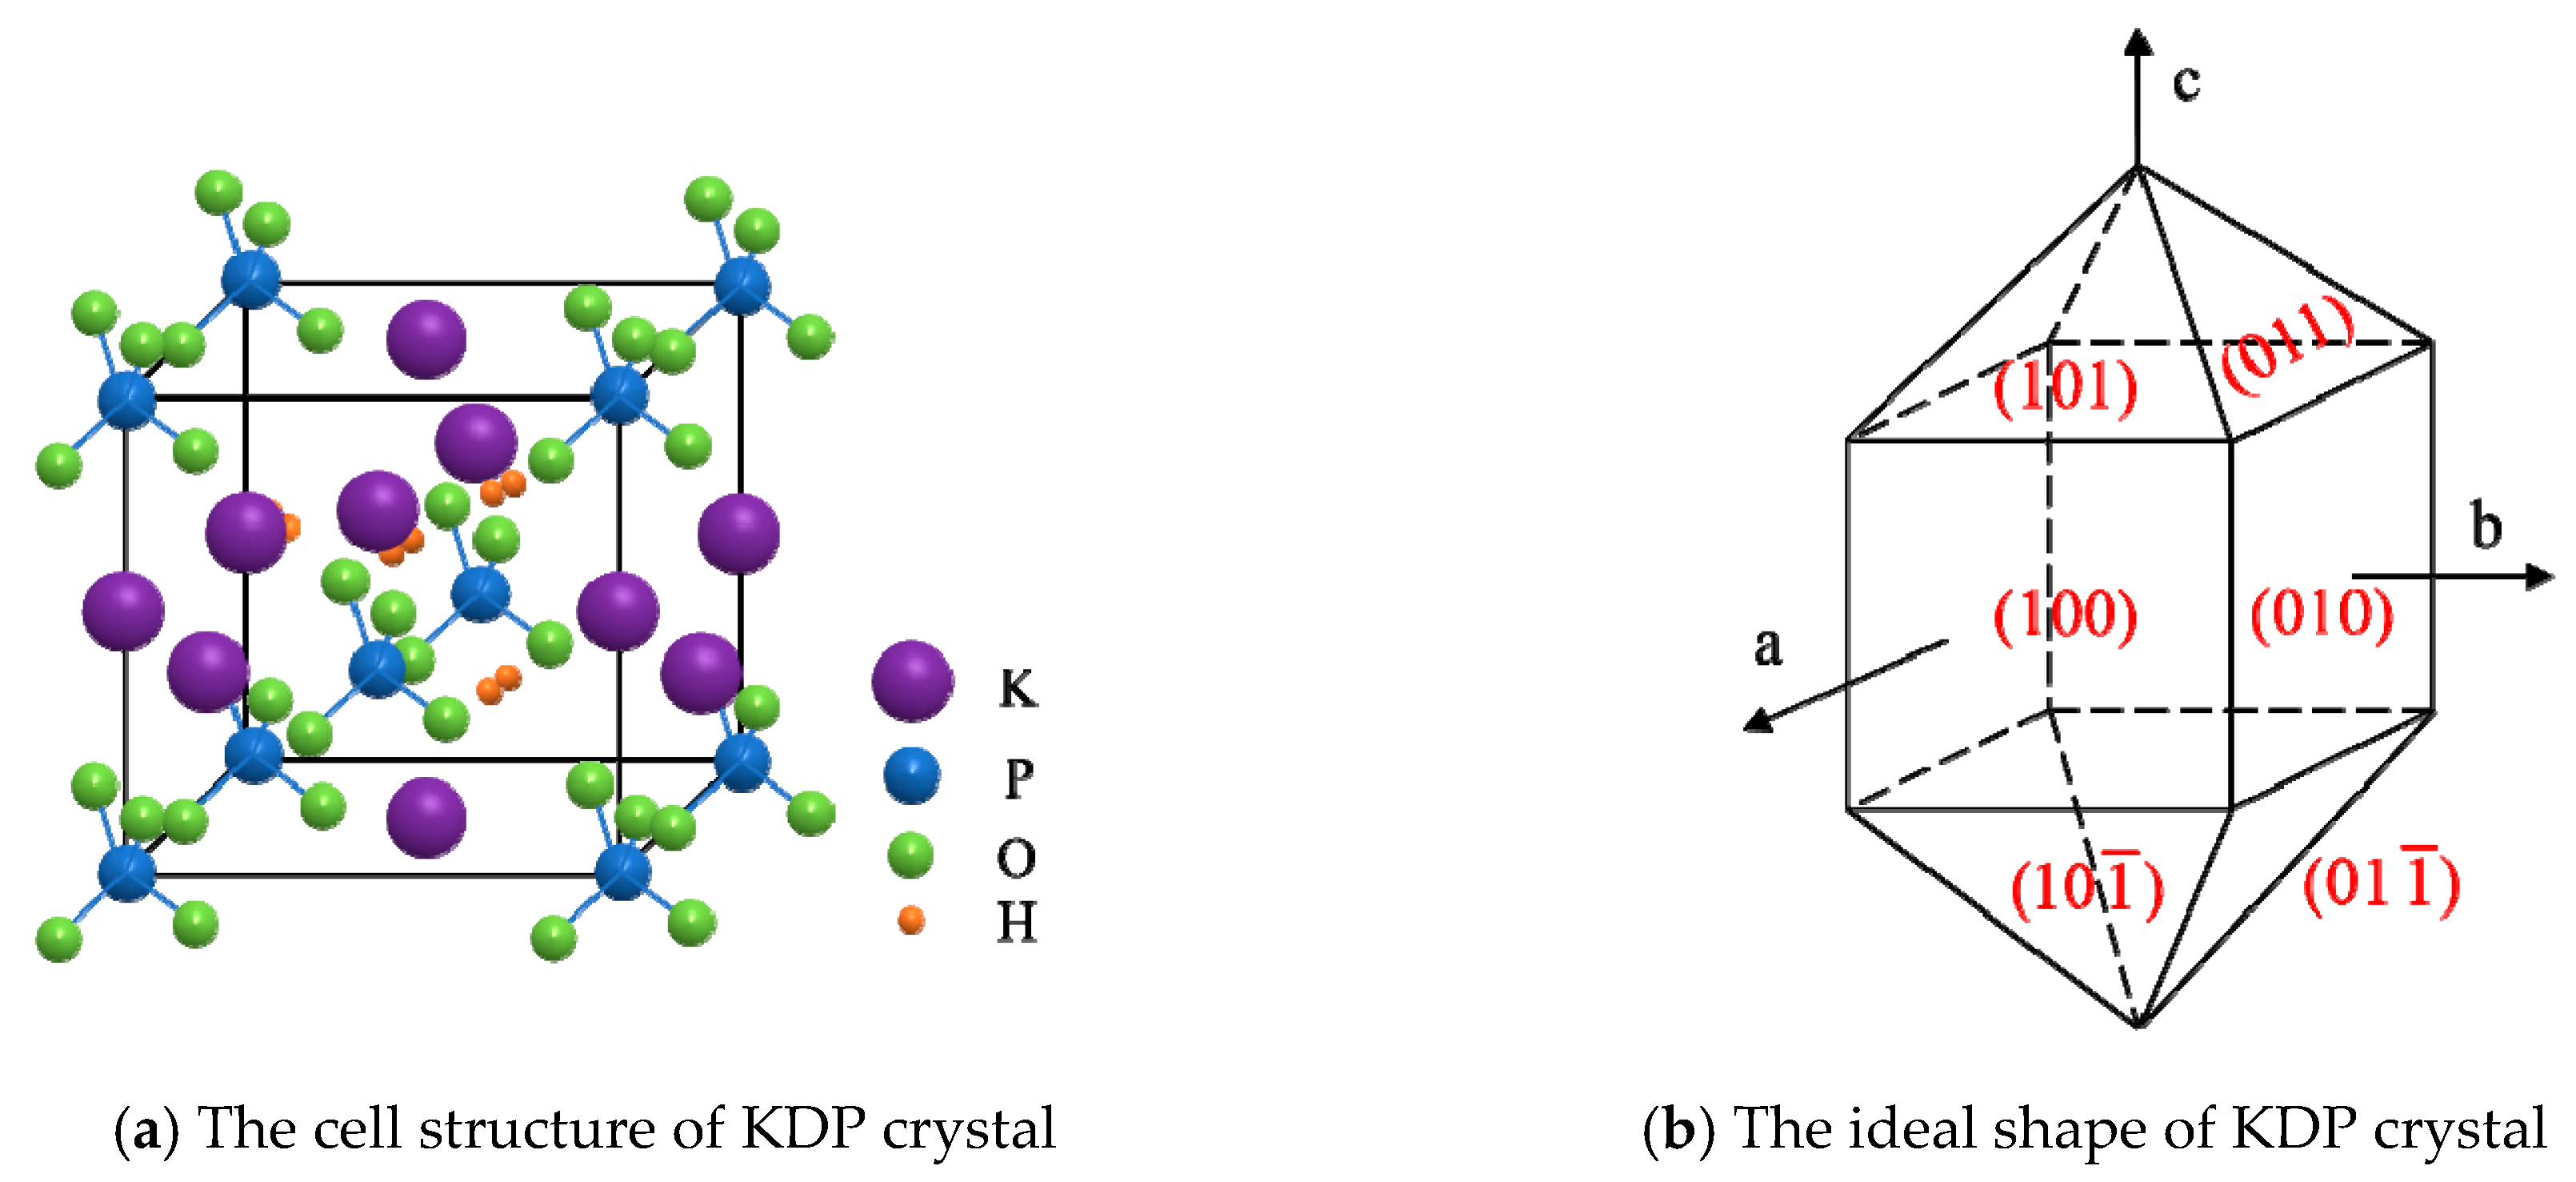
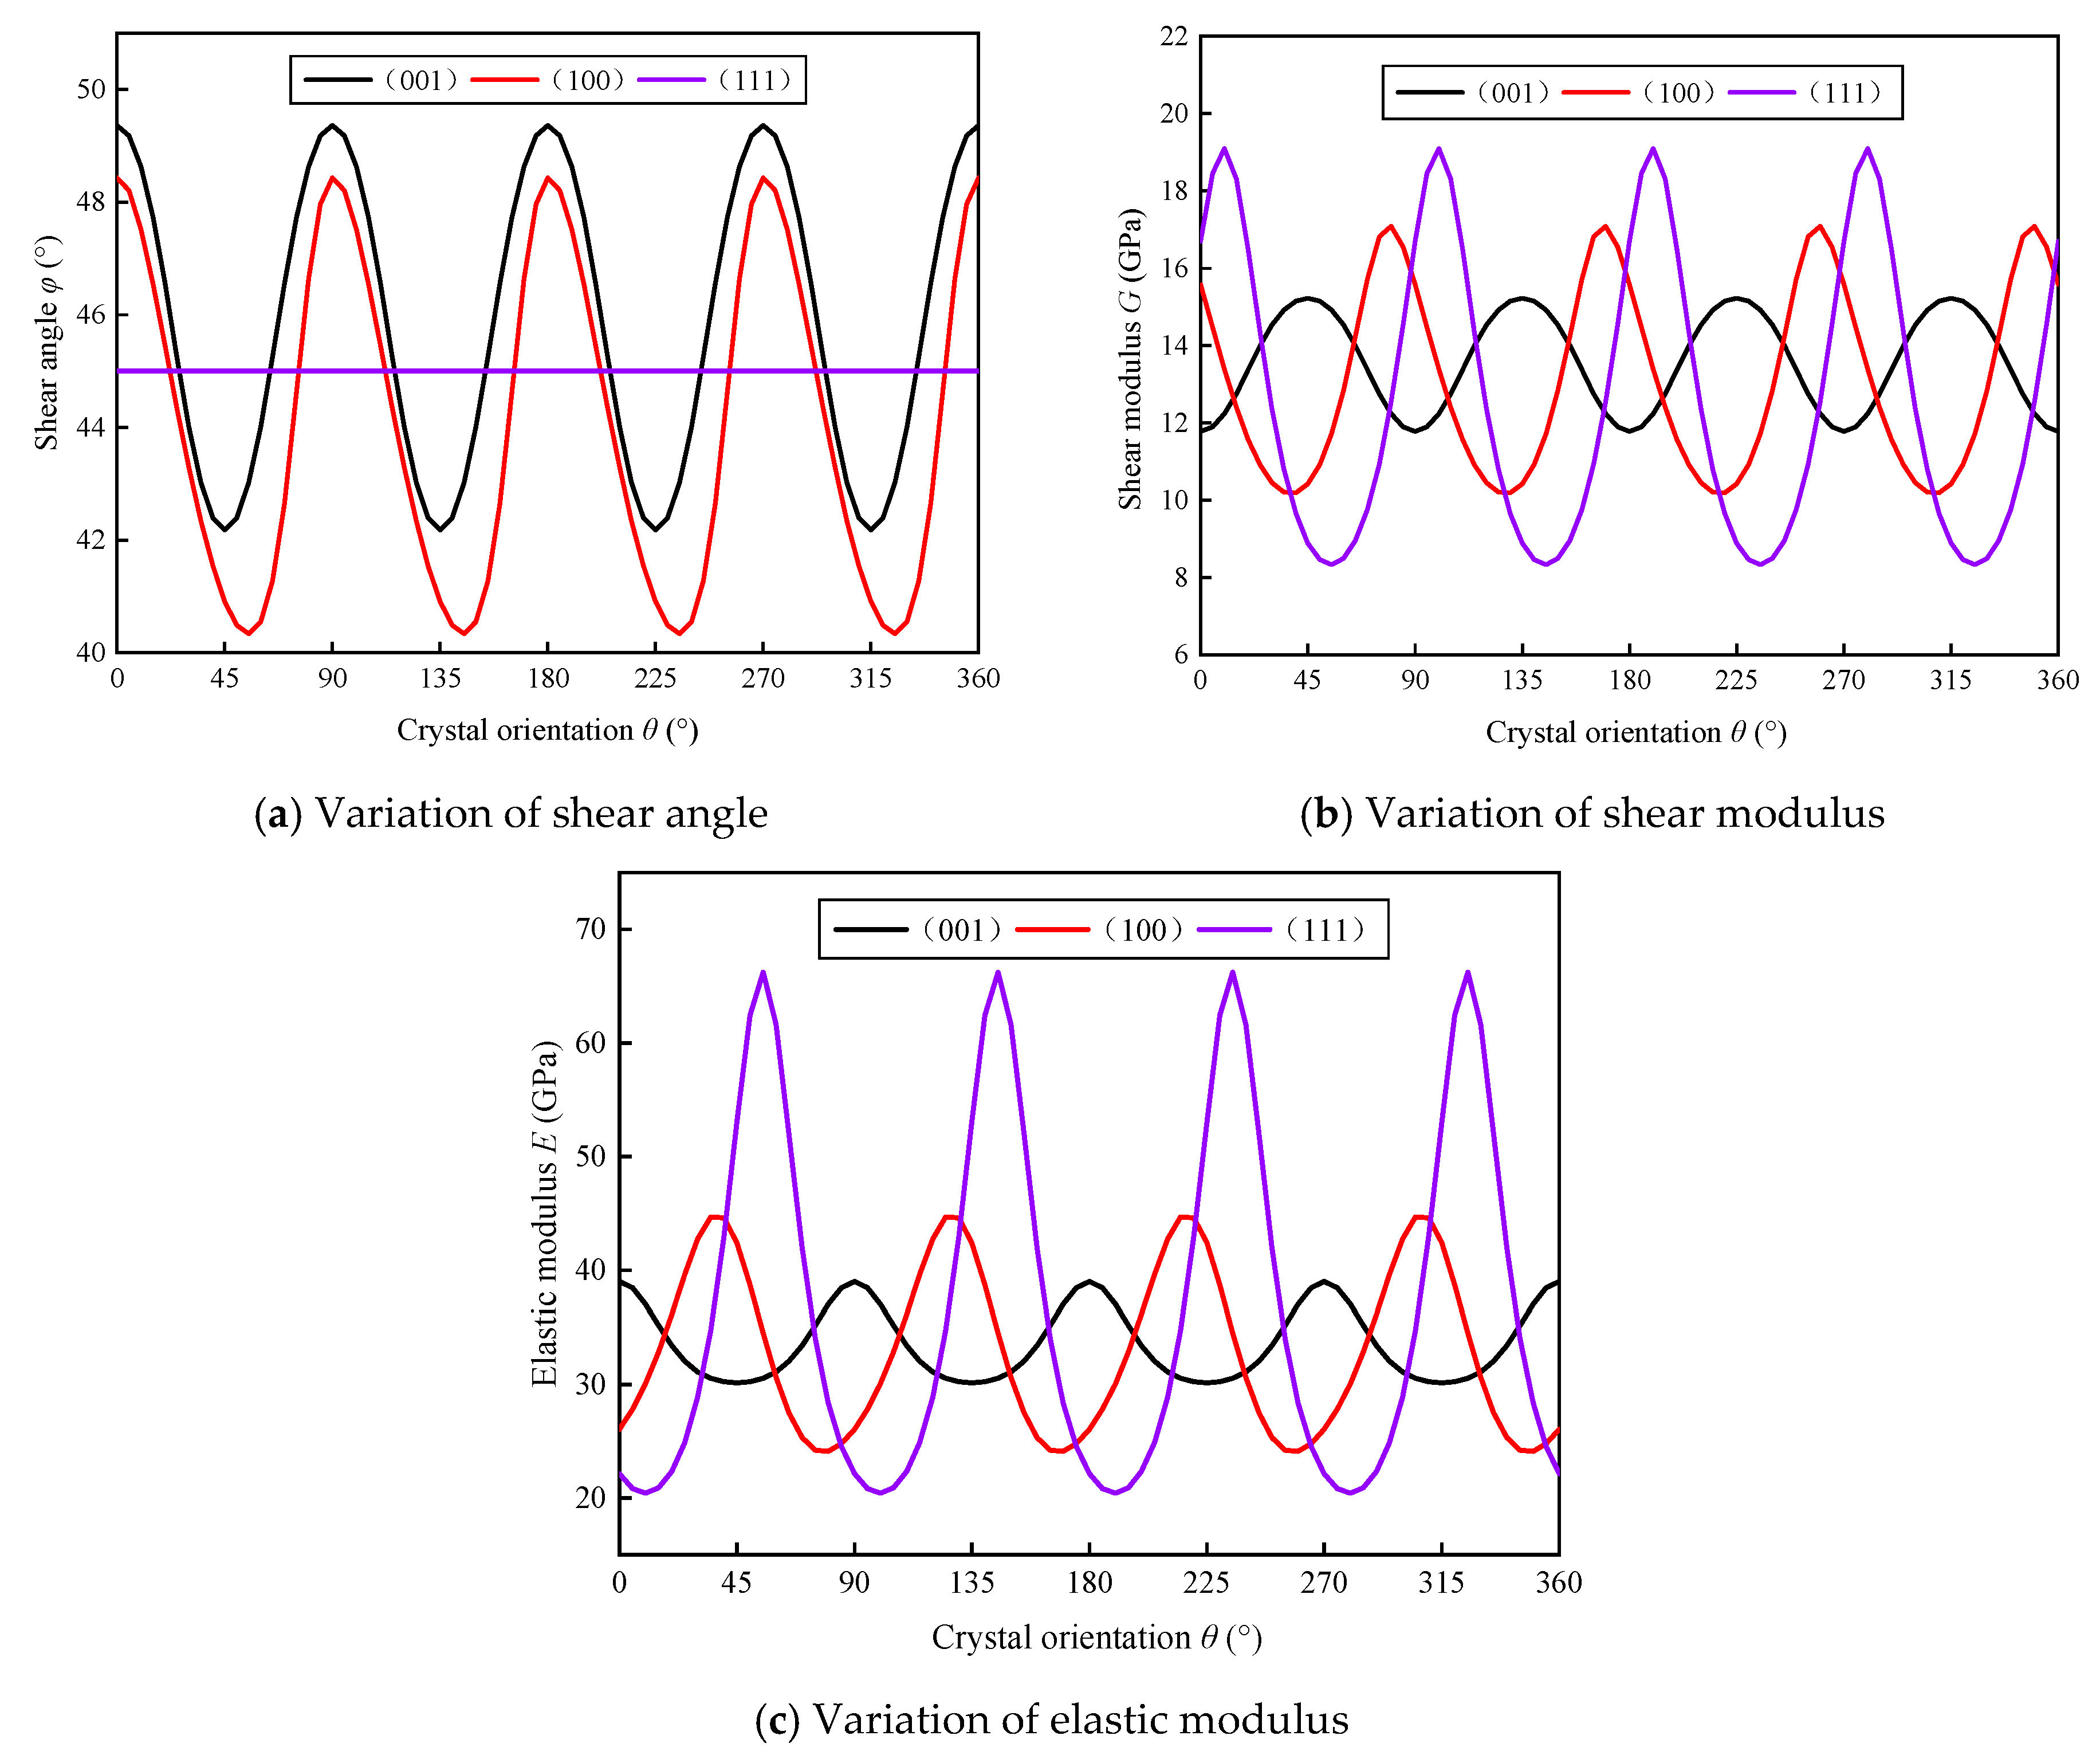
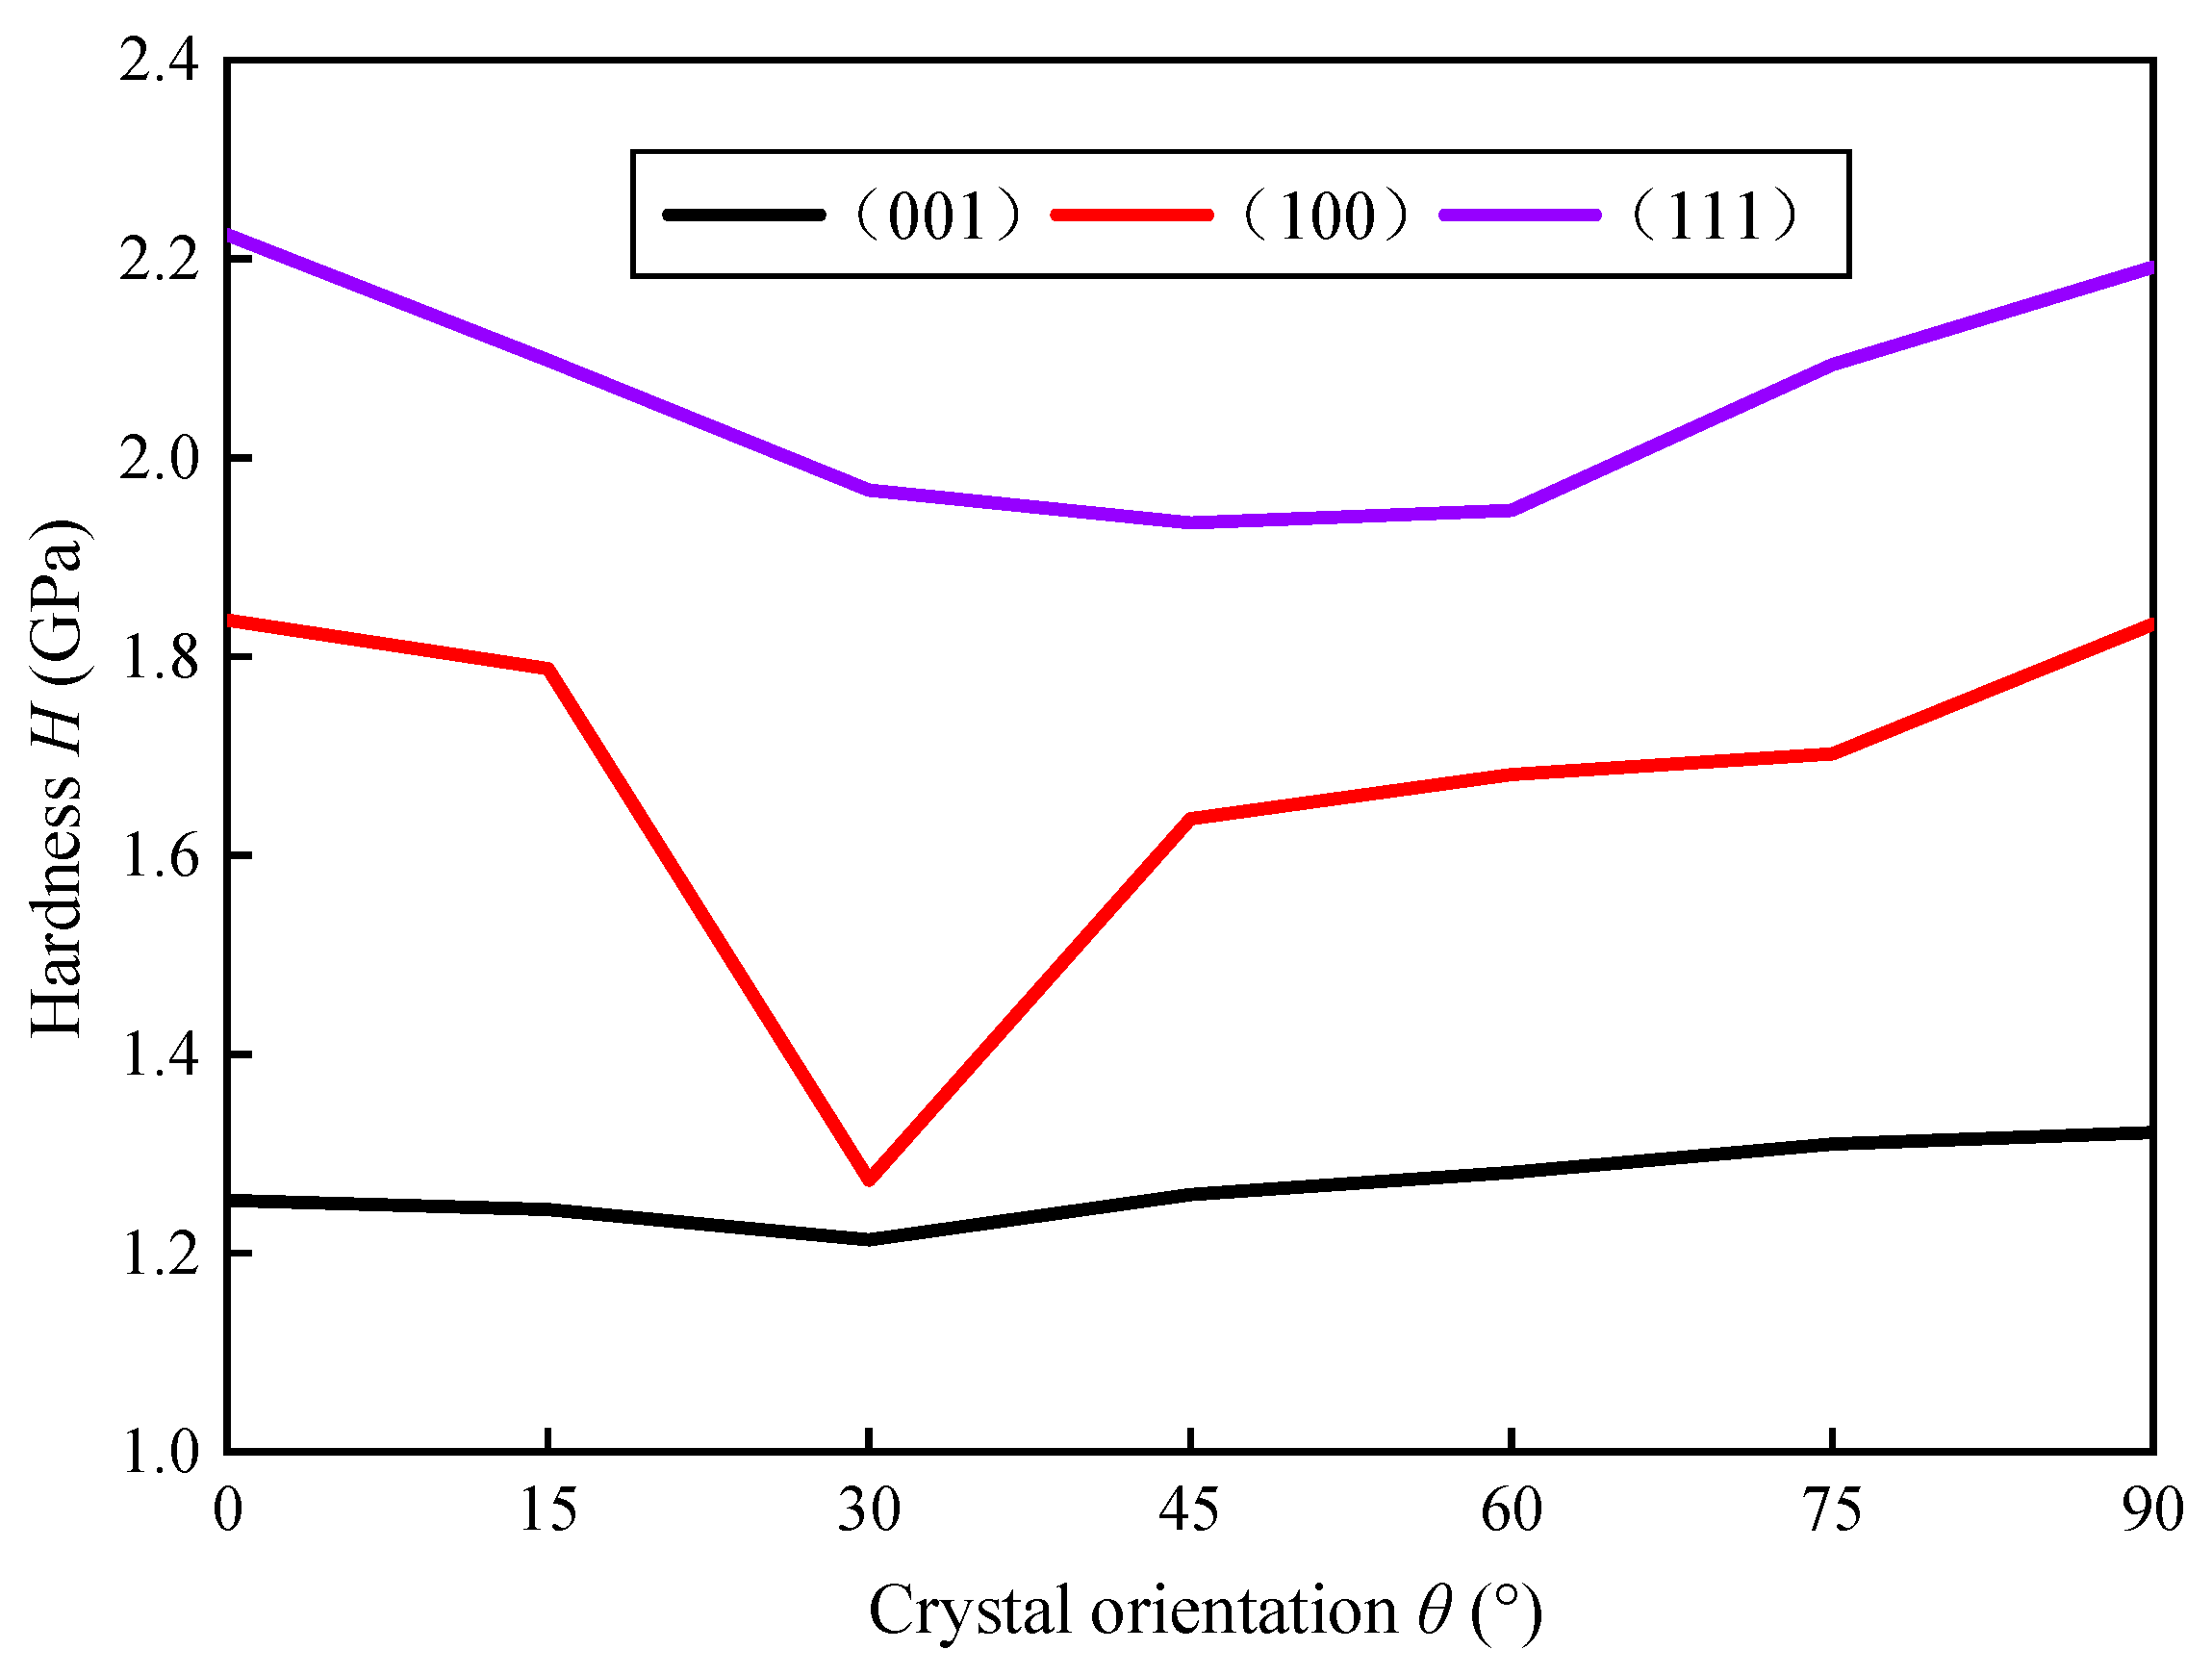
2.1. Mechanical Properties of KDP Crystal
2.2. Establishment of Strain Gradient Plasticity Model
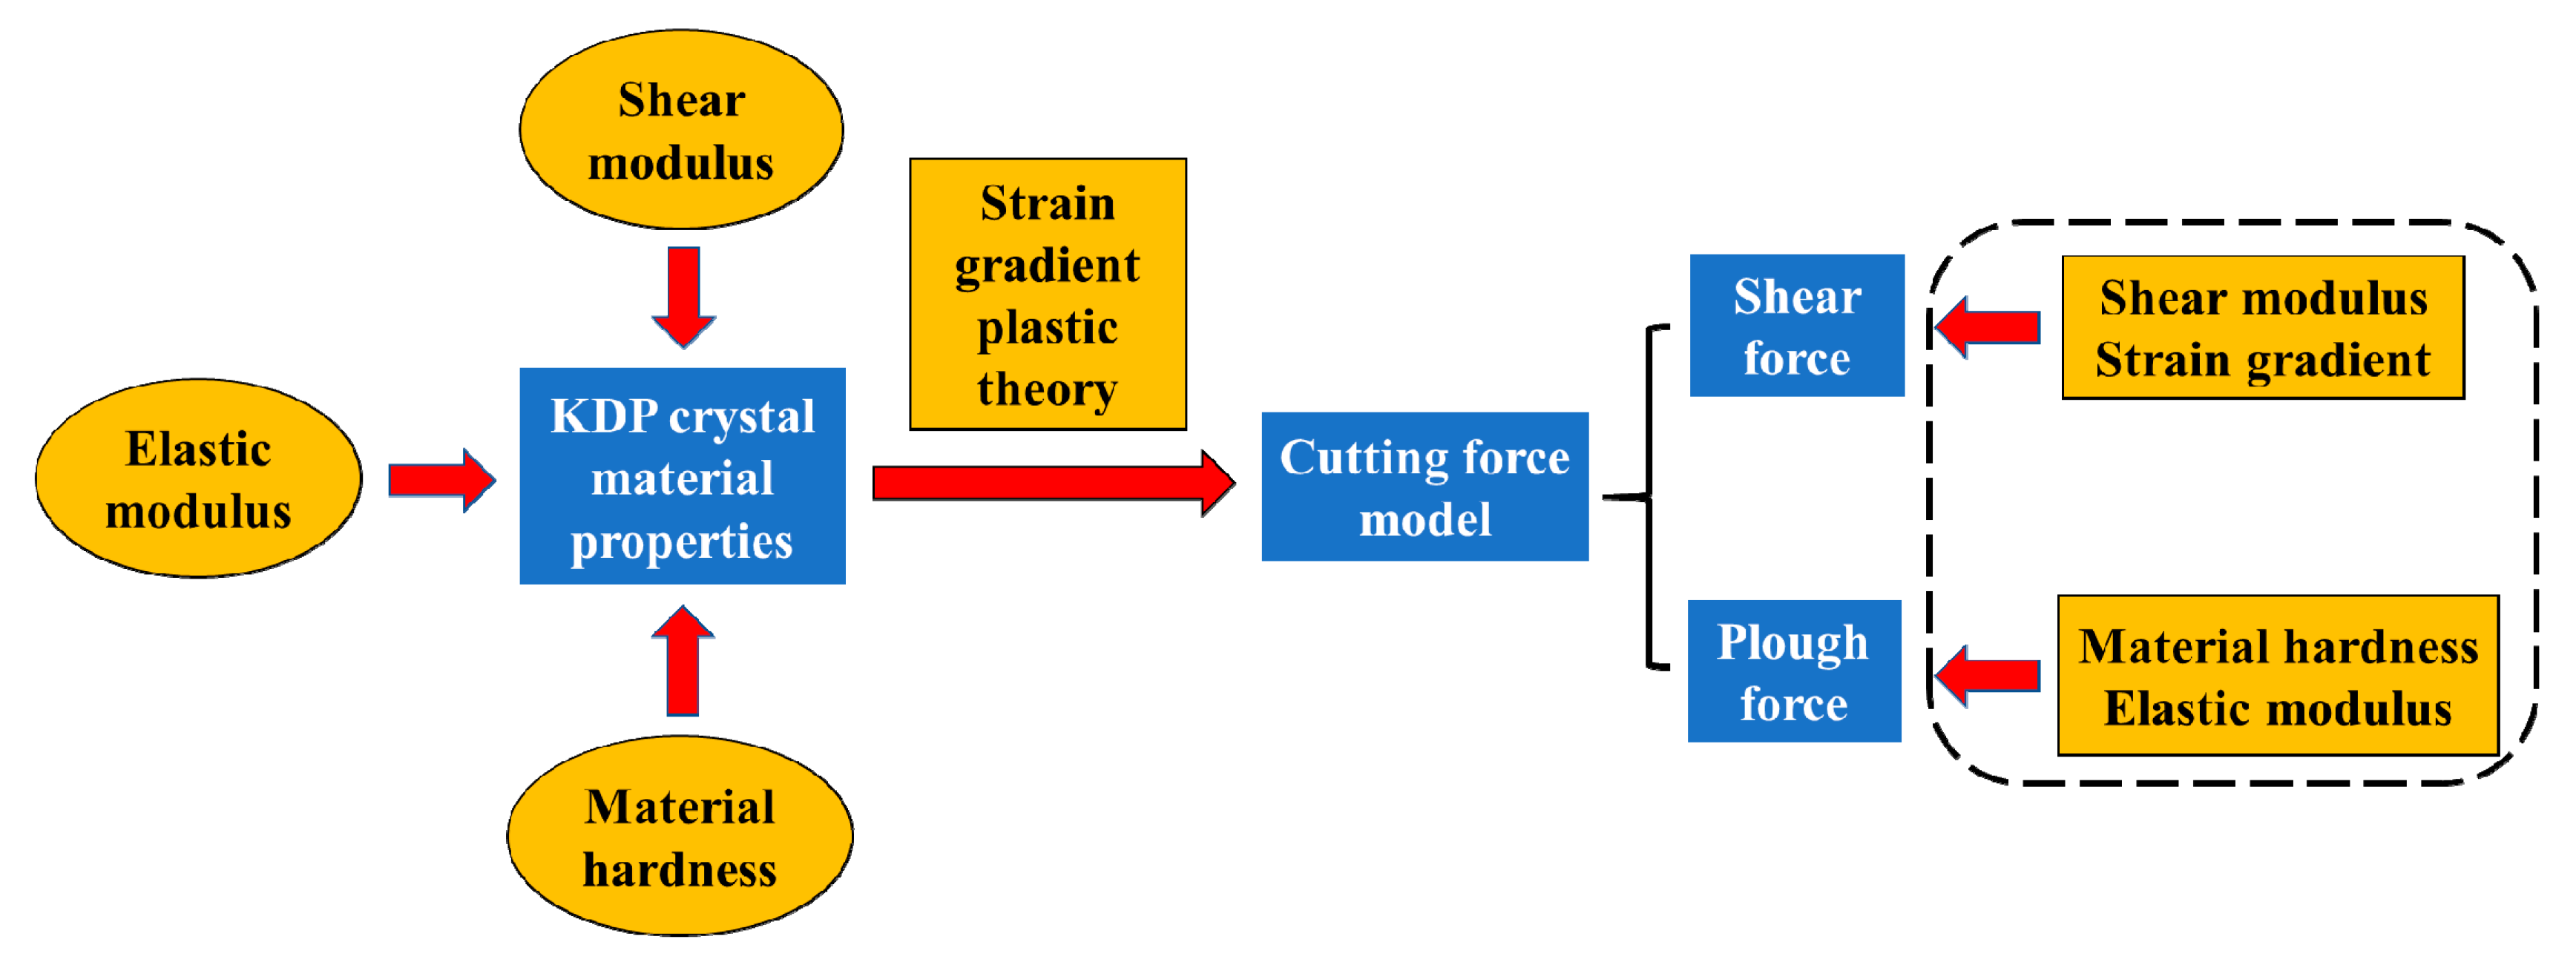
3. Establishment of Cutting Force Model
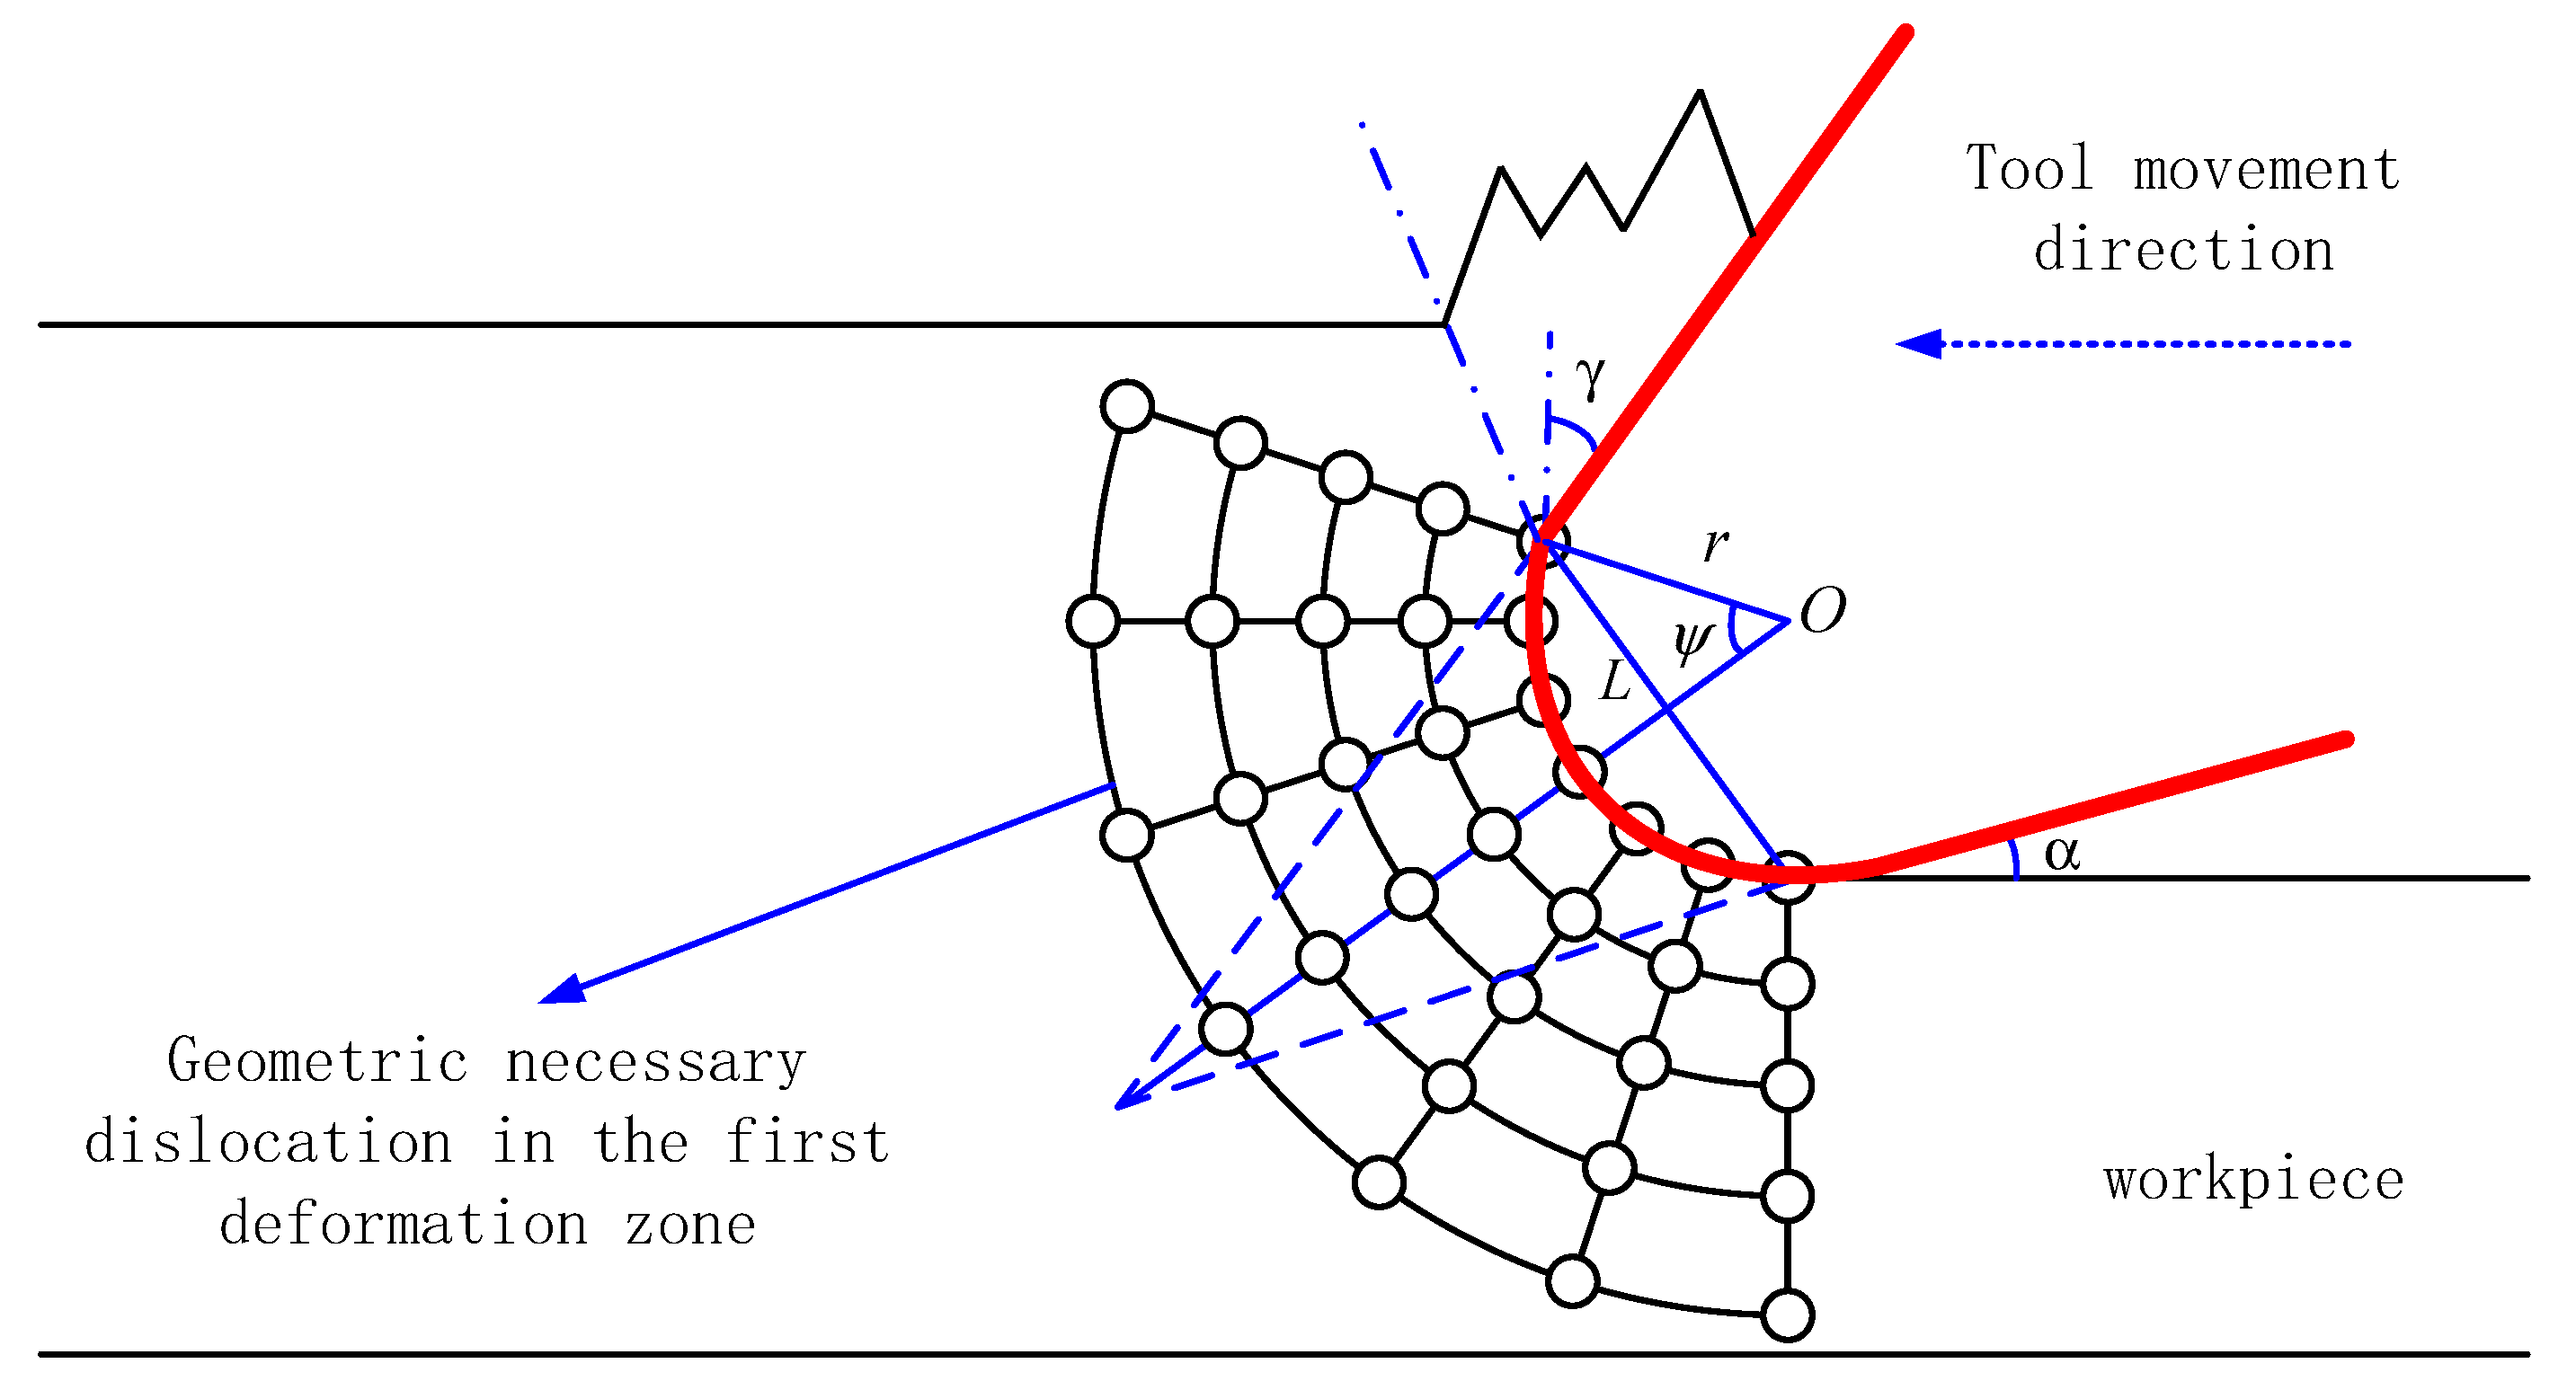
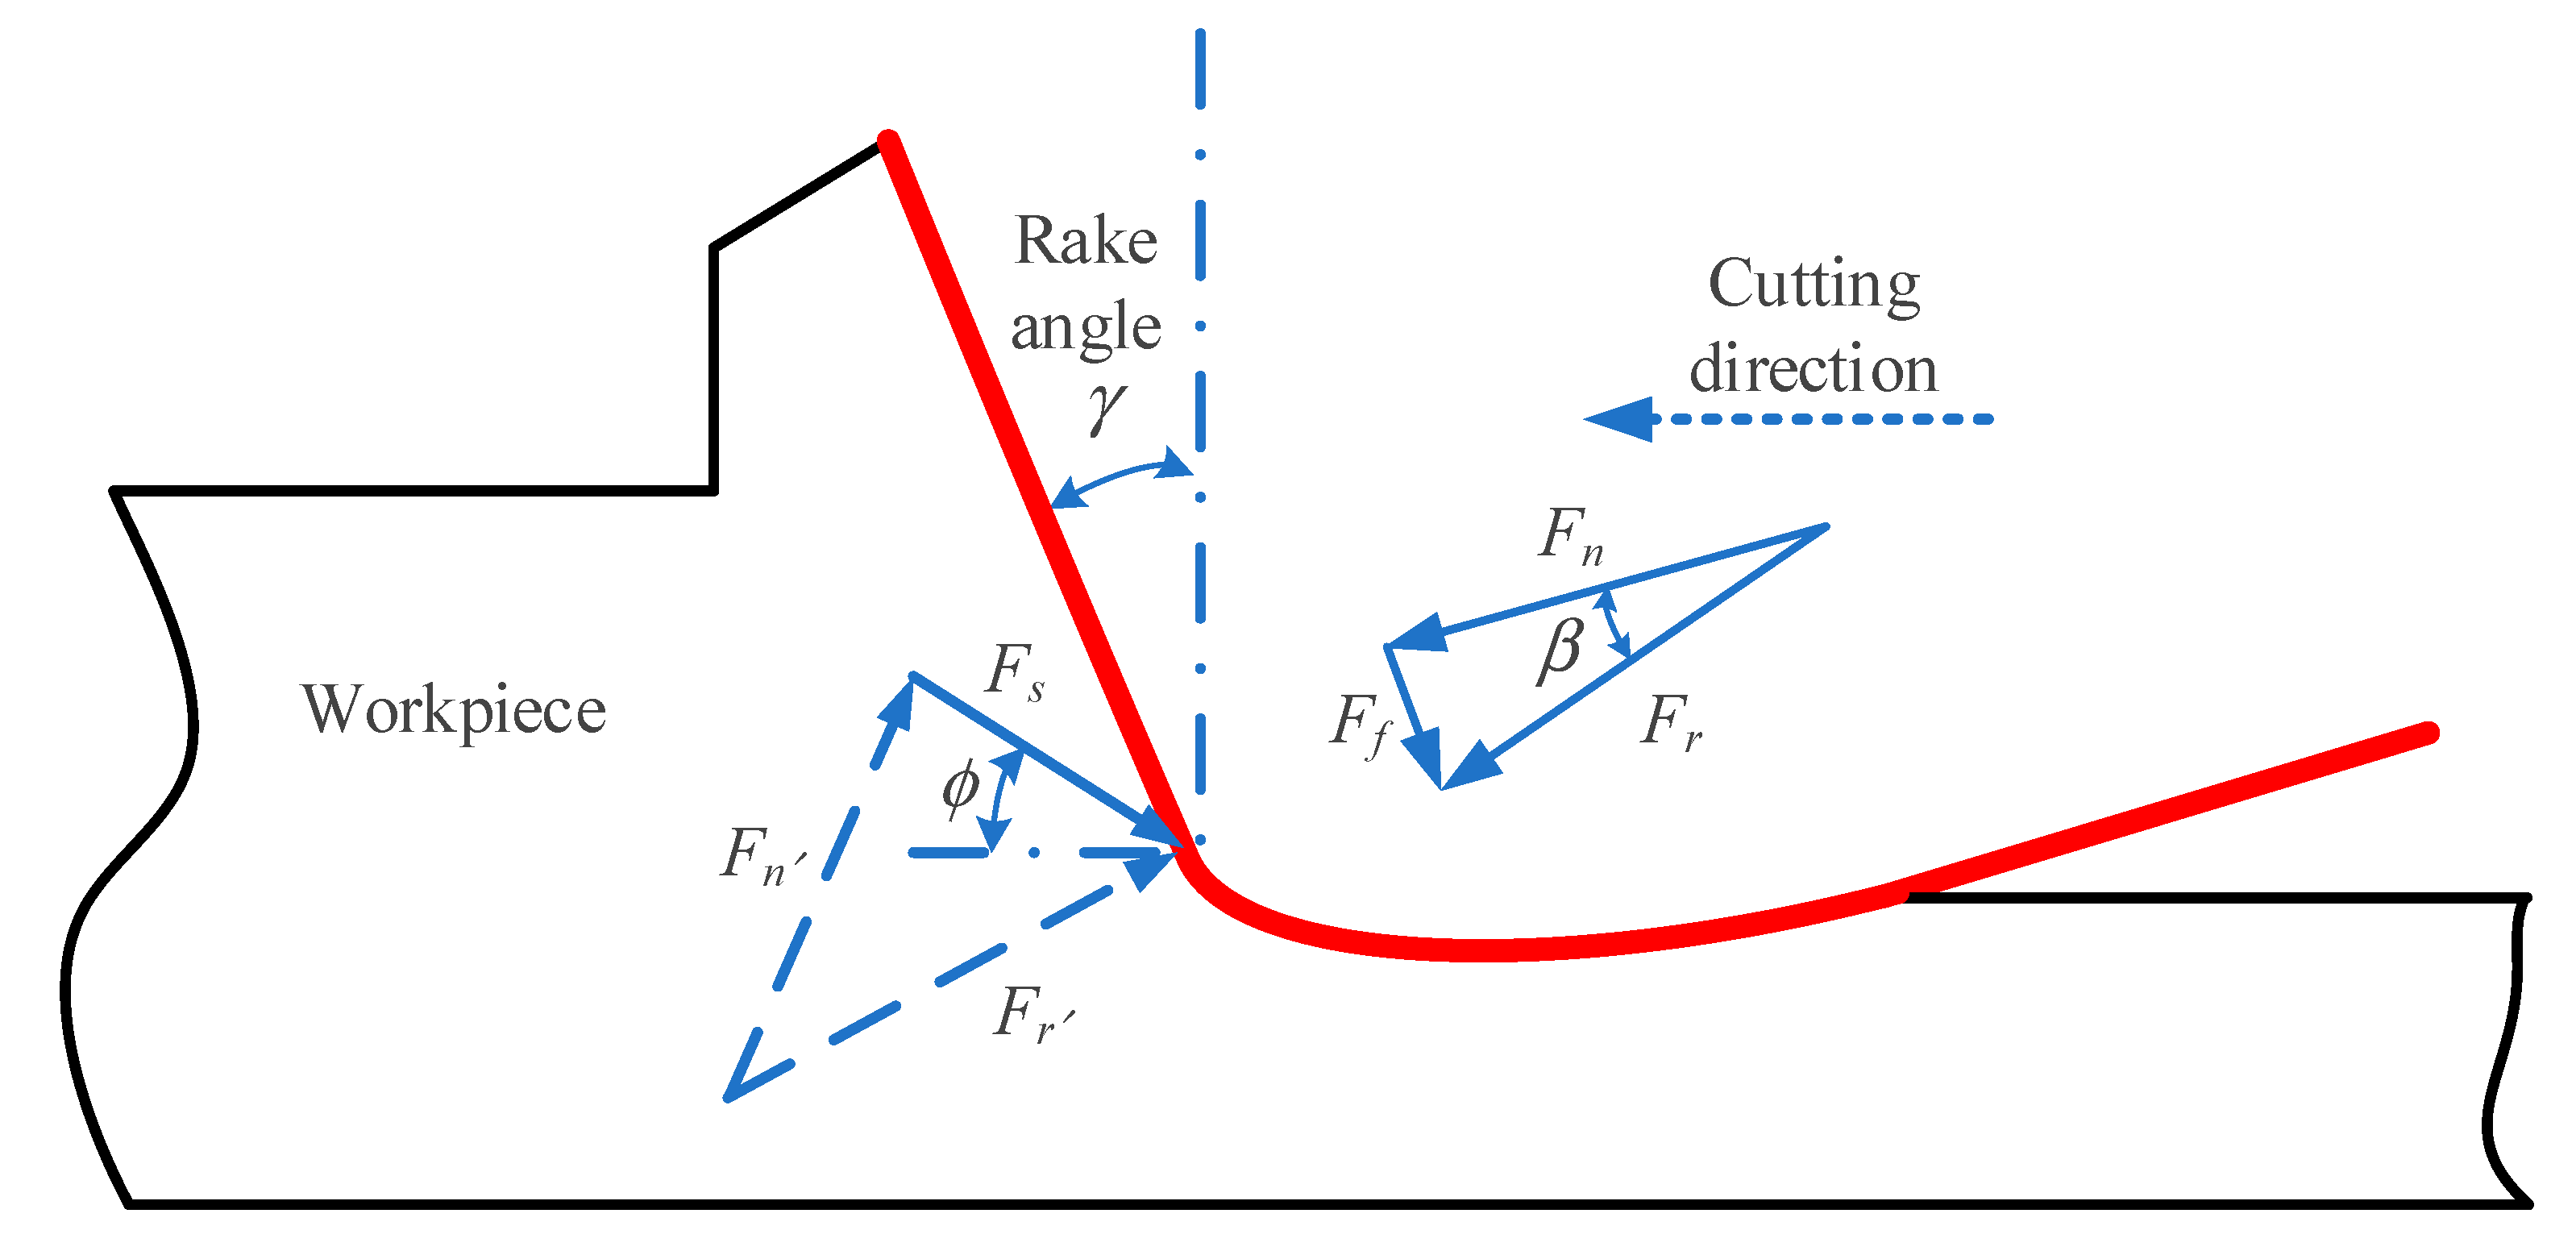
3.1. Shear Force Model
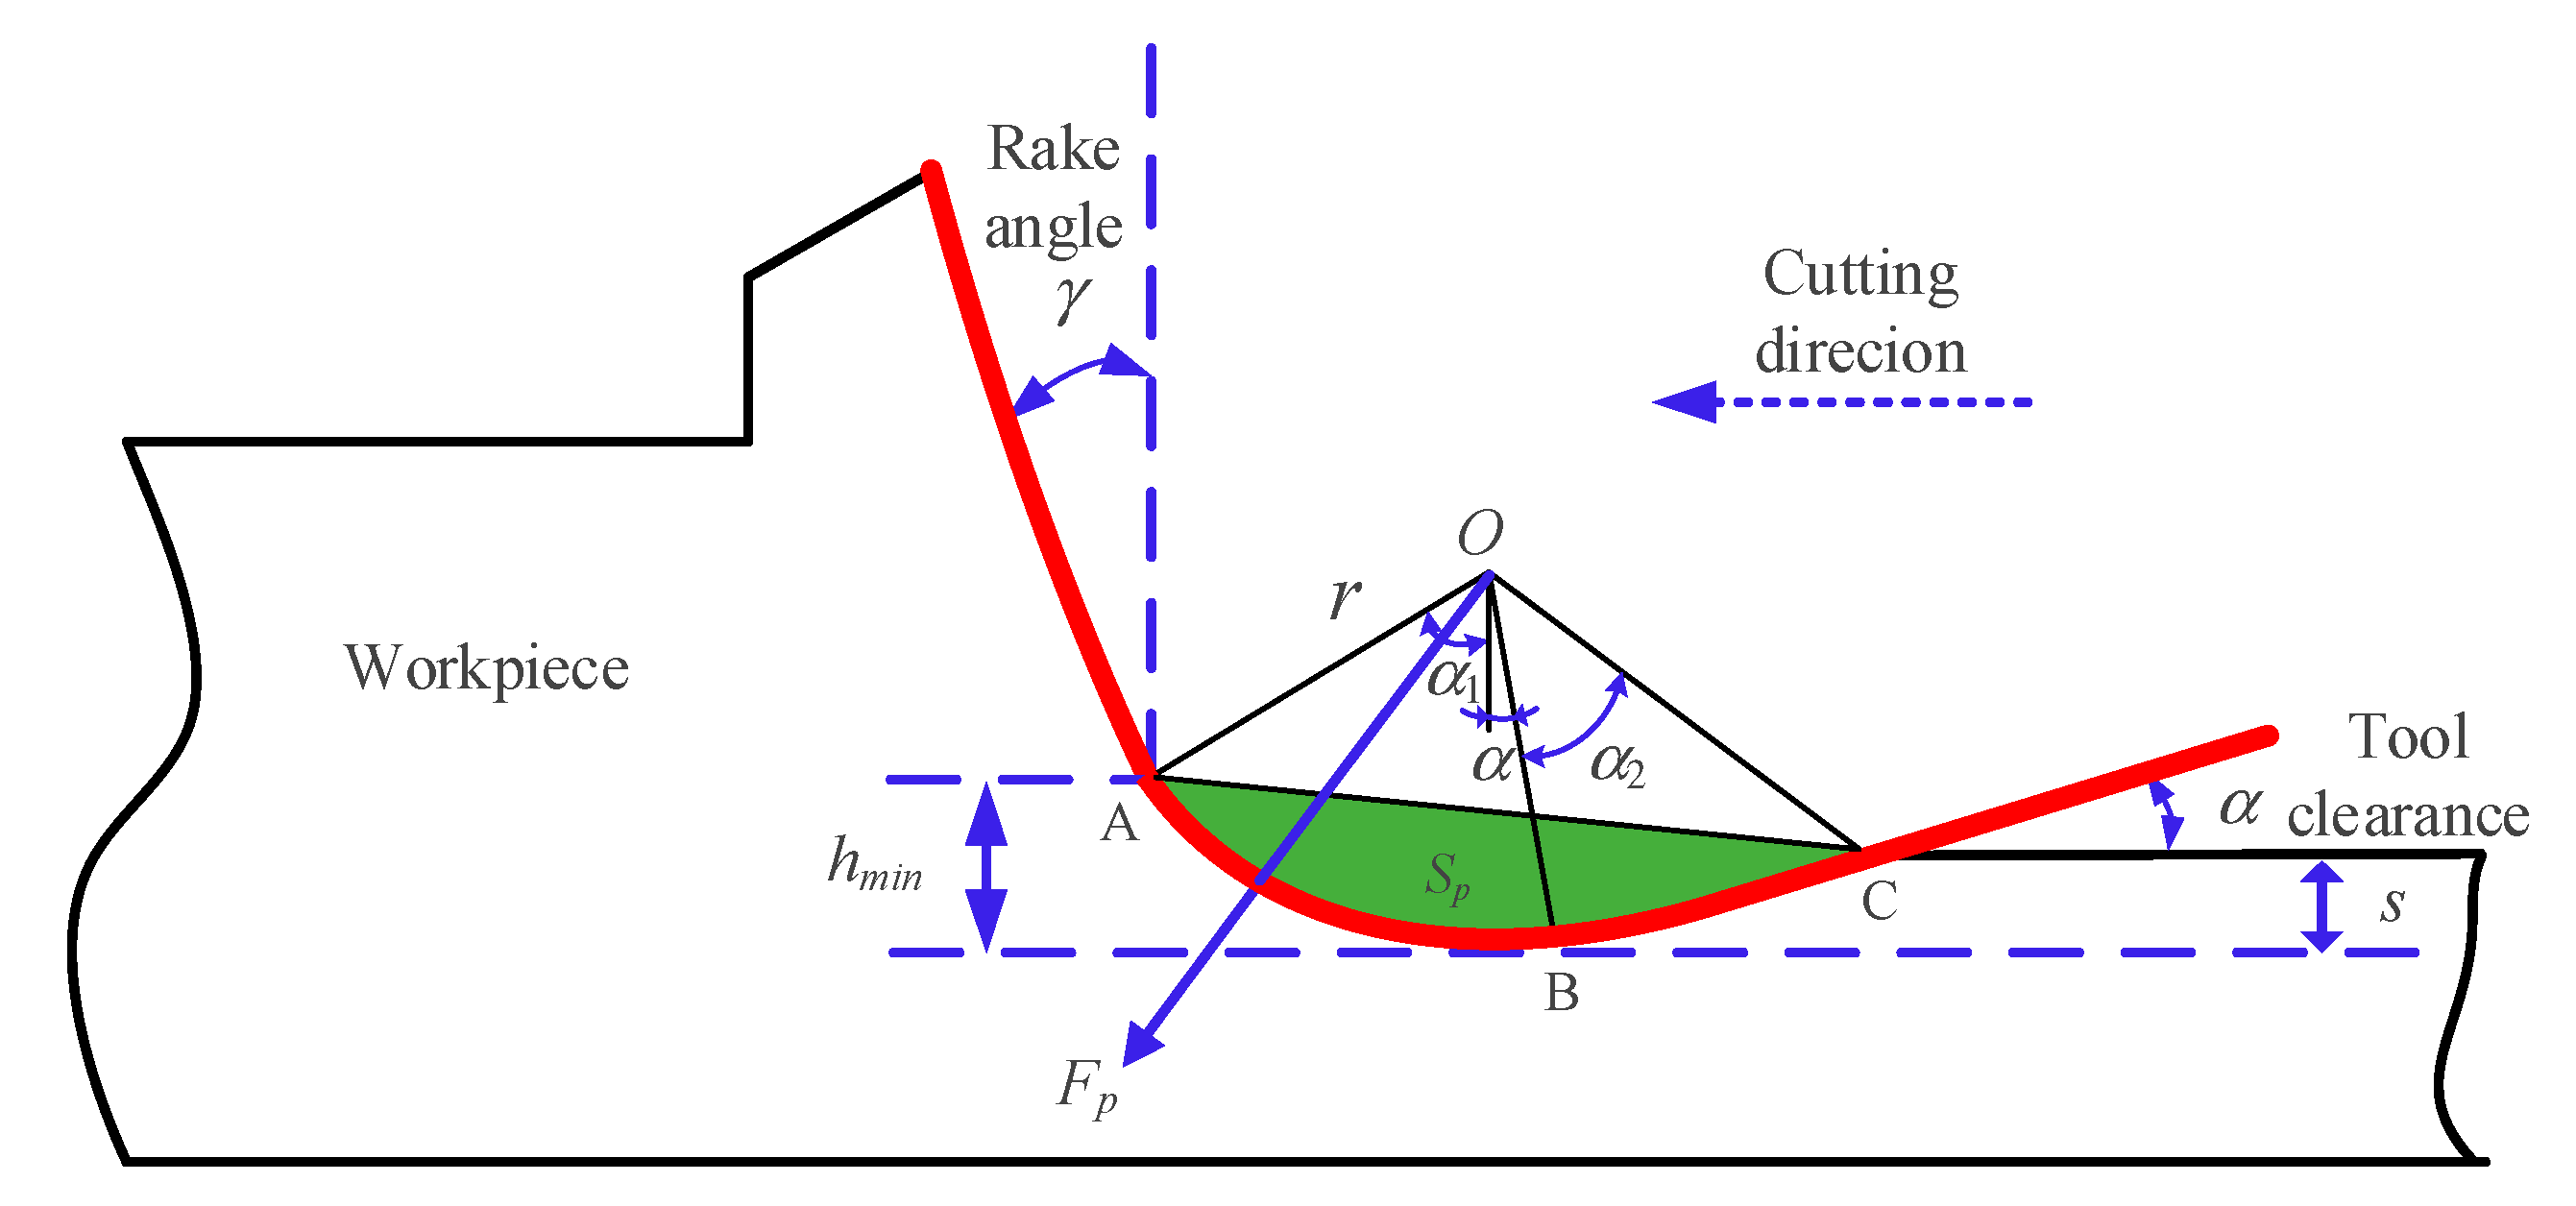
3.2. Ploughing Force Model
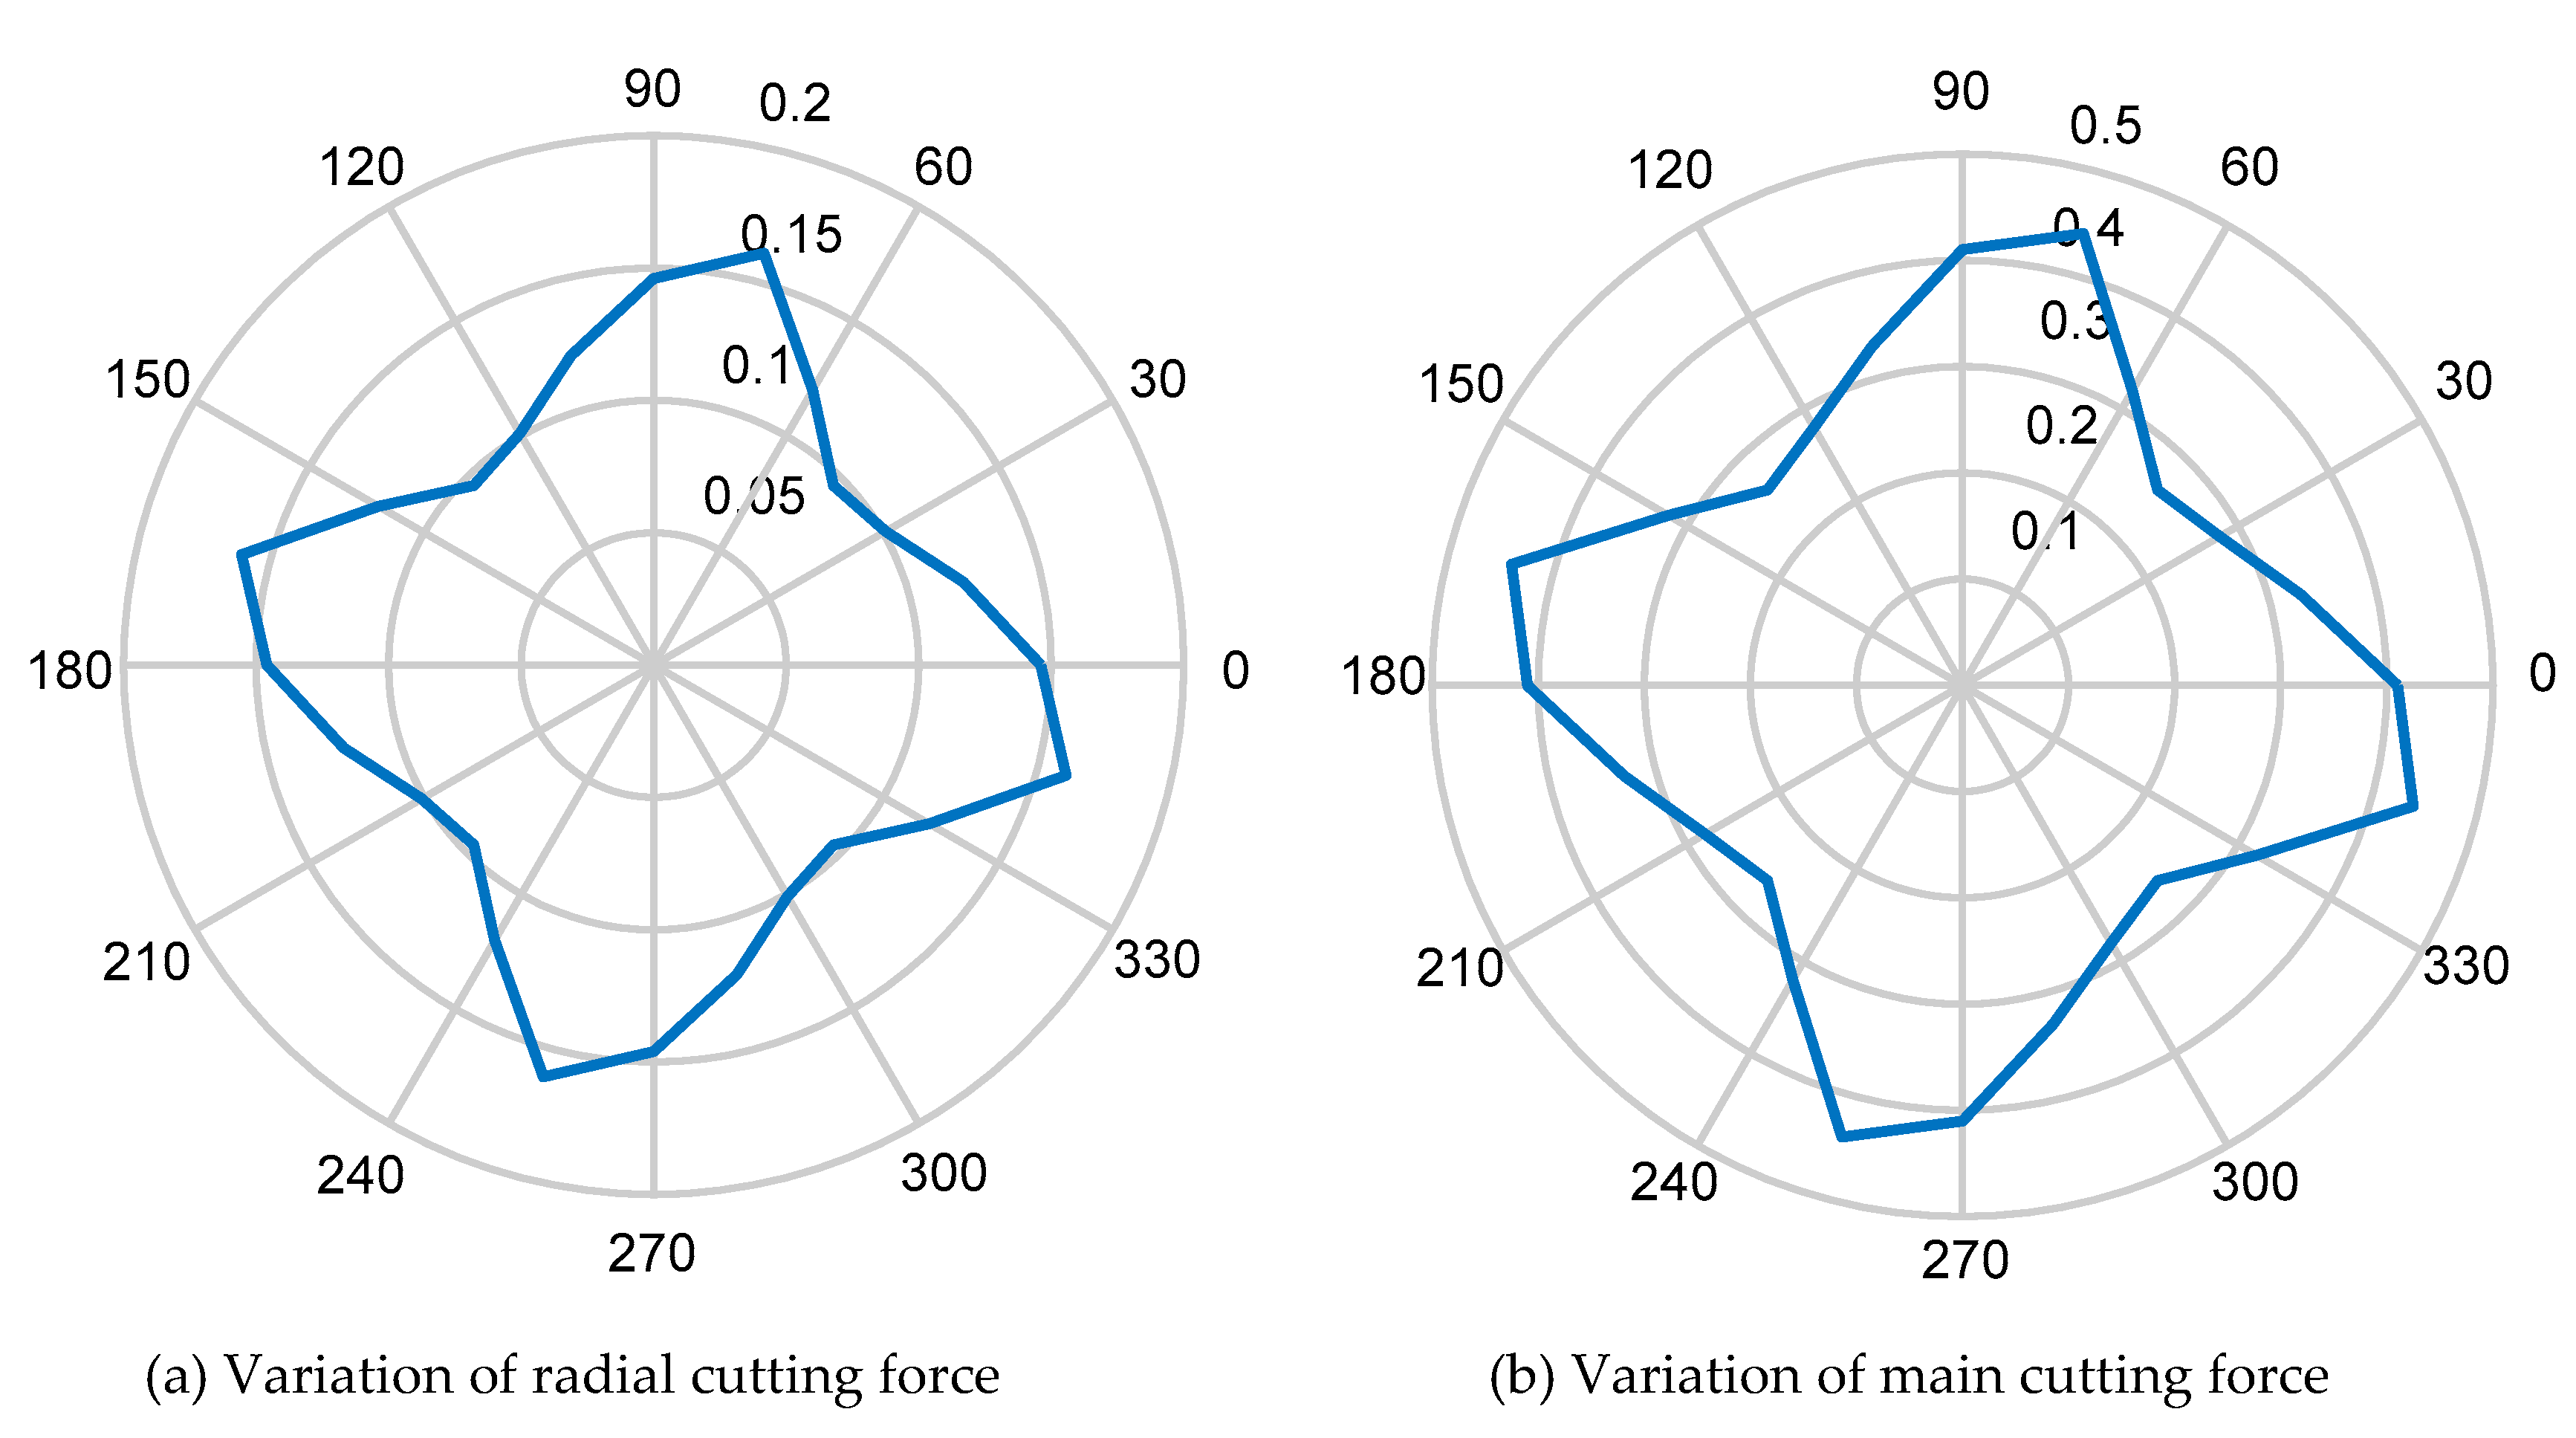
3.3. Modelling and Simulation of Cutting Force
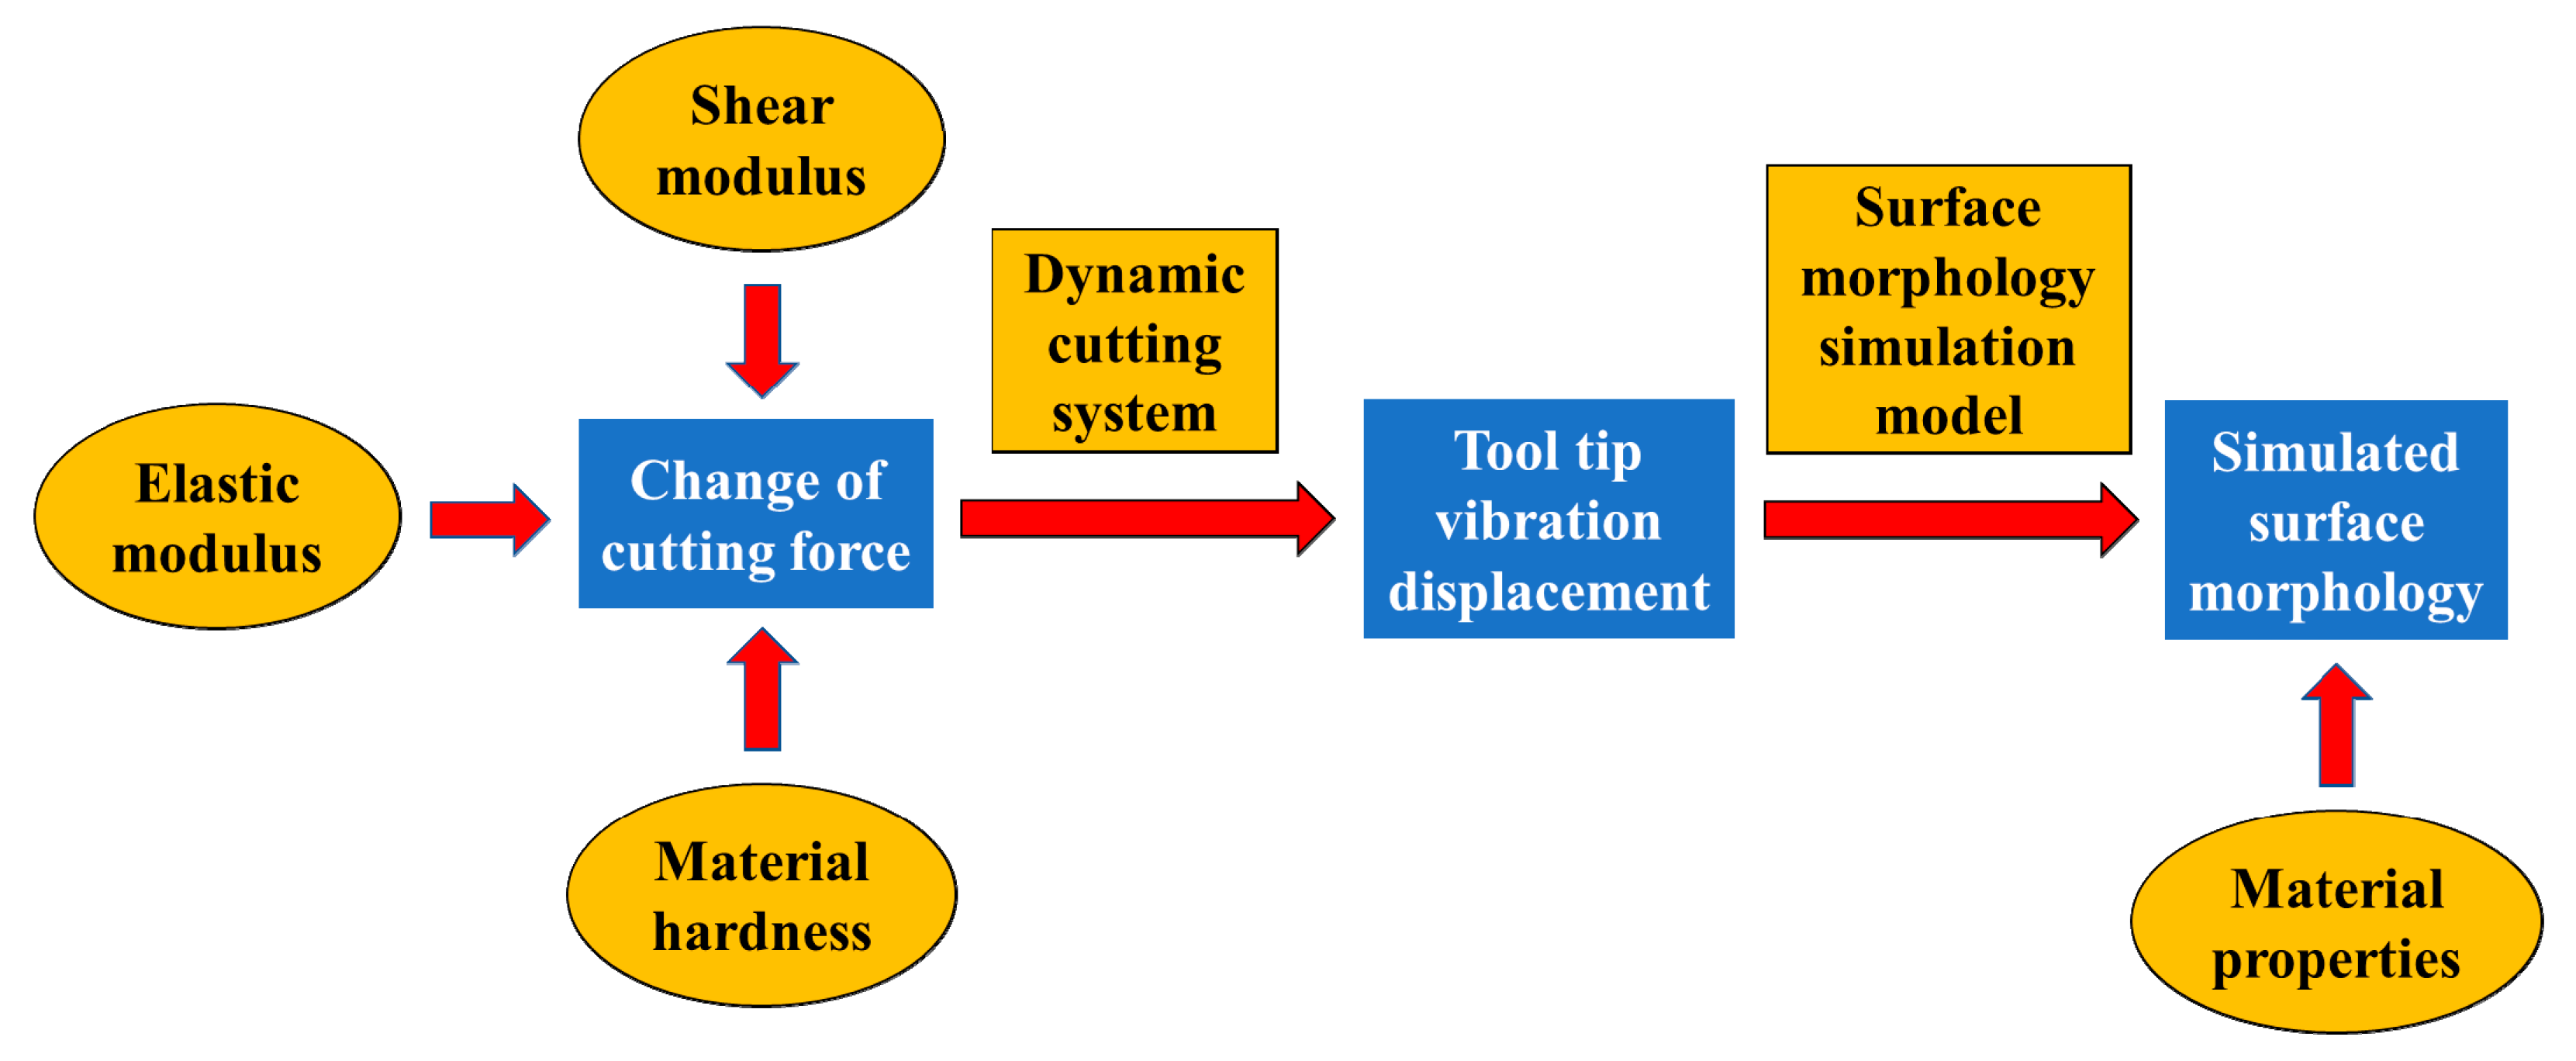
4. Establishment of Dynamic Cutting System and Surface Morphology Simulation Model
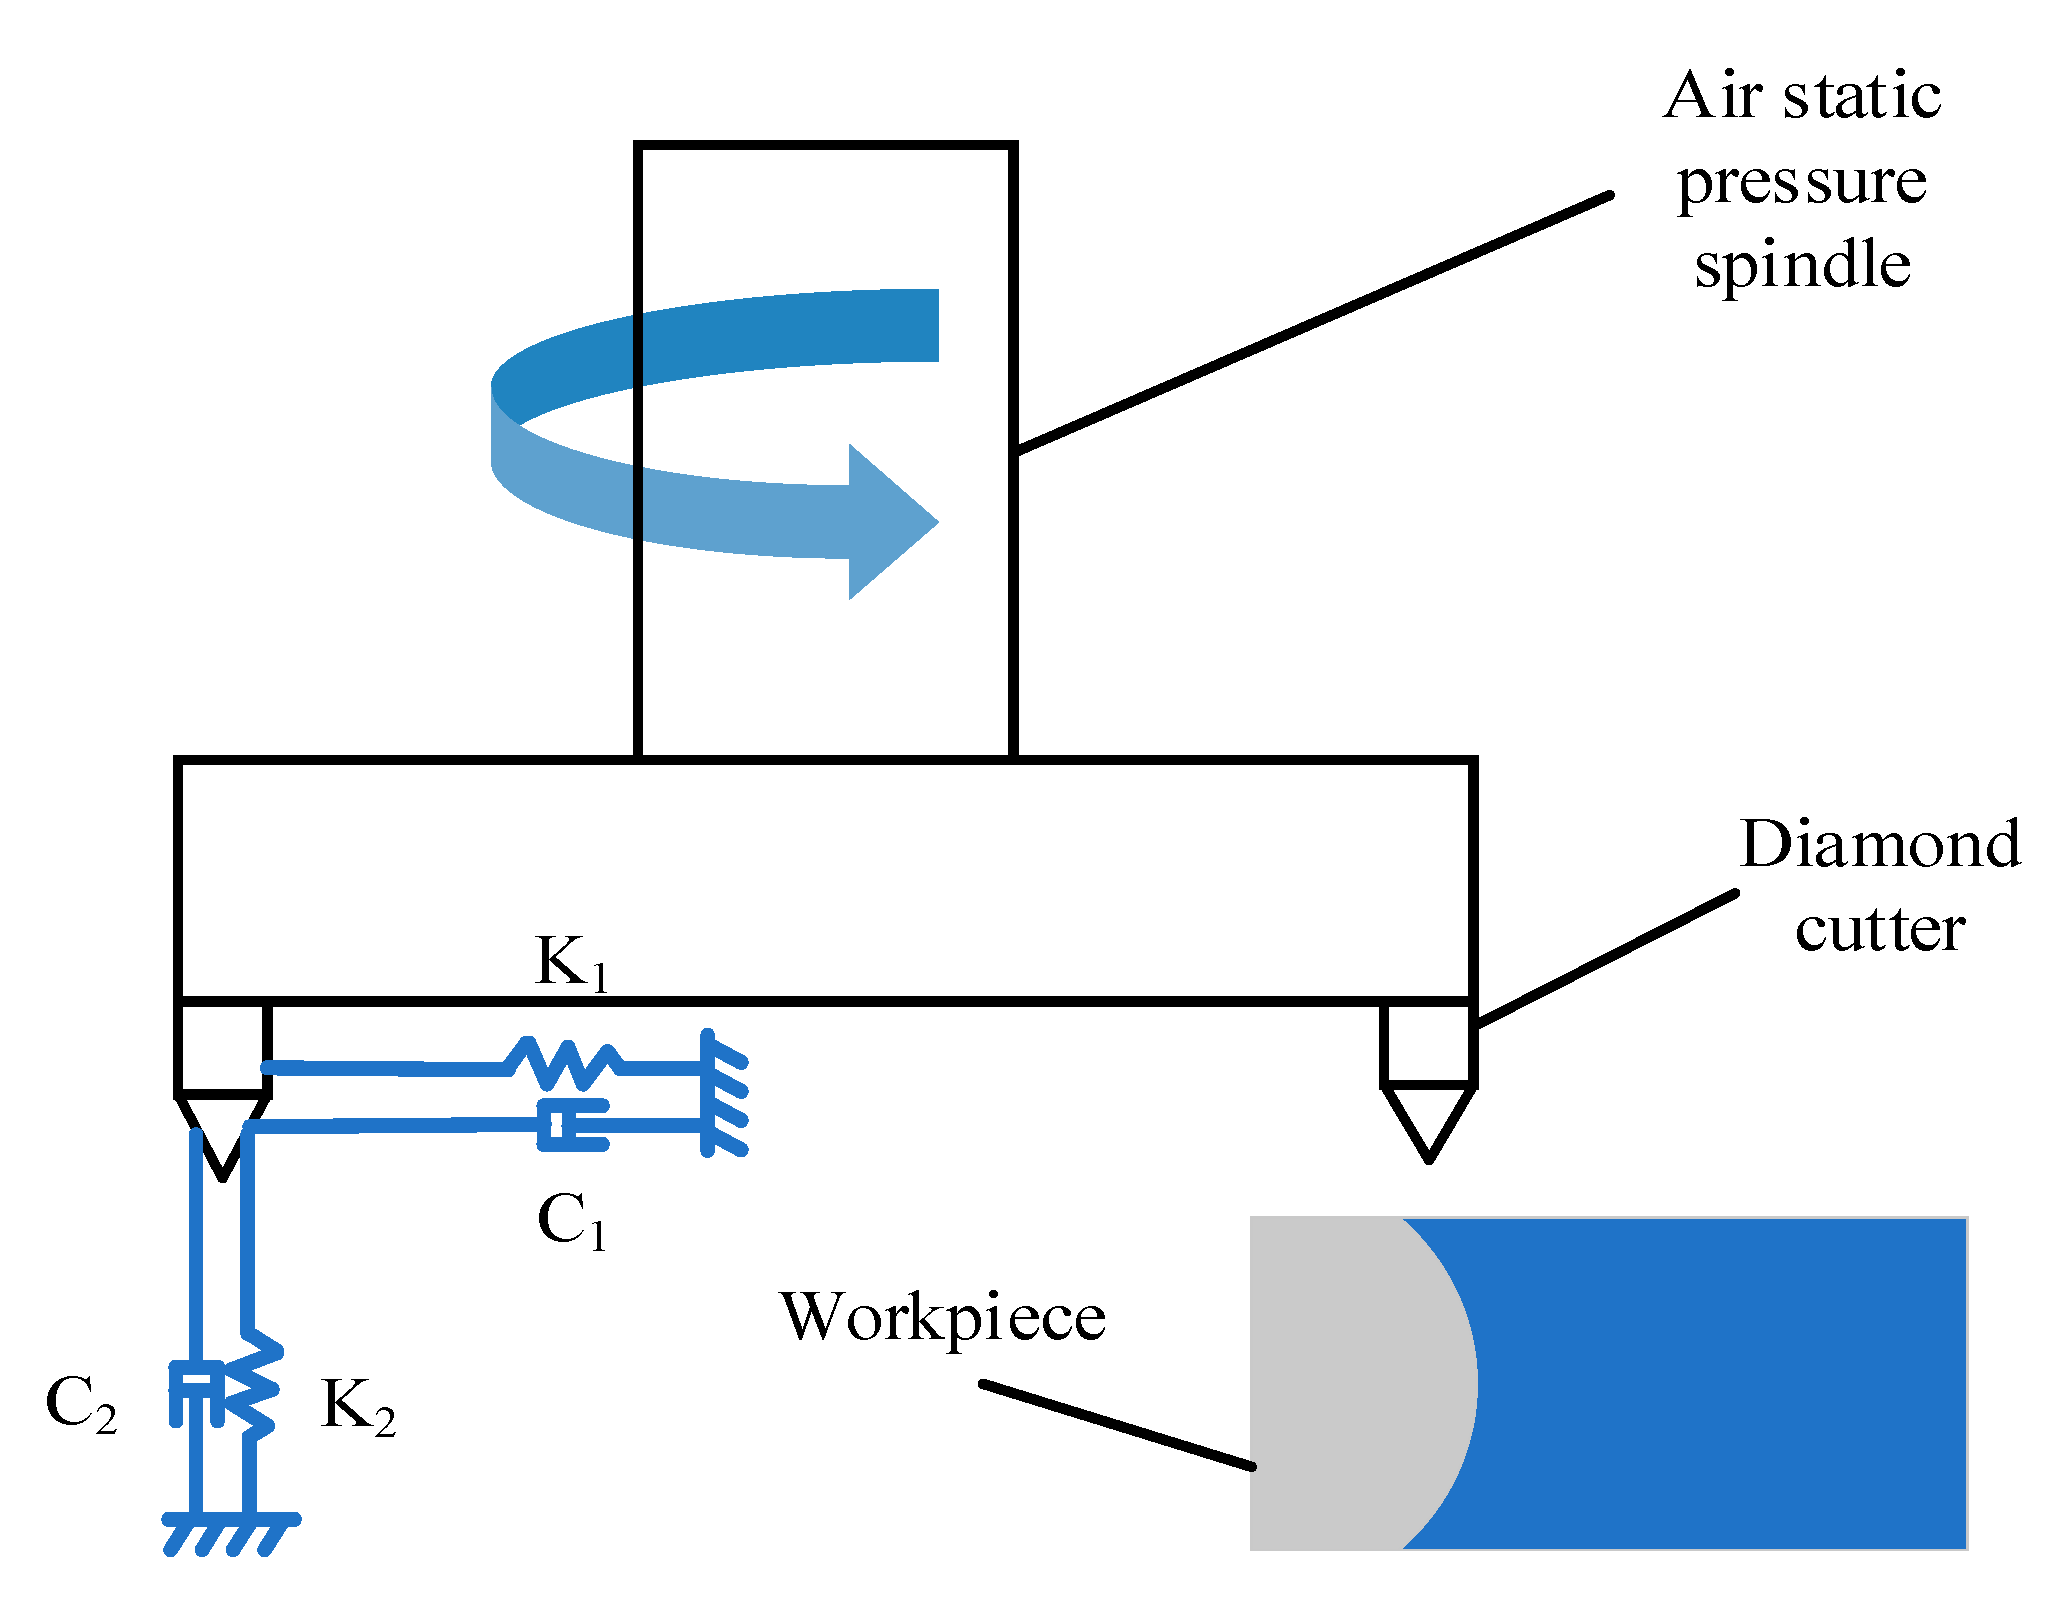
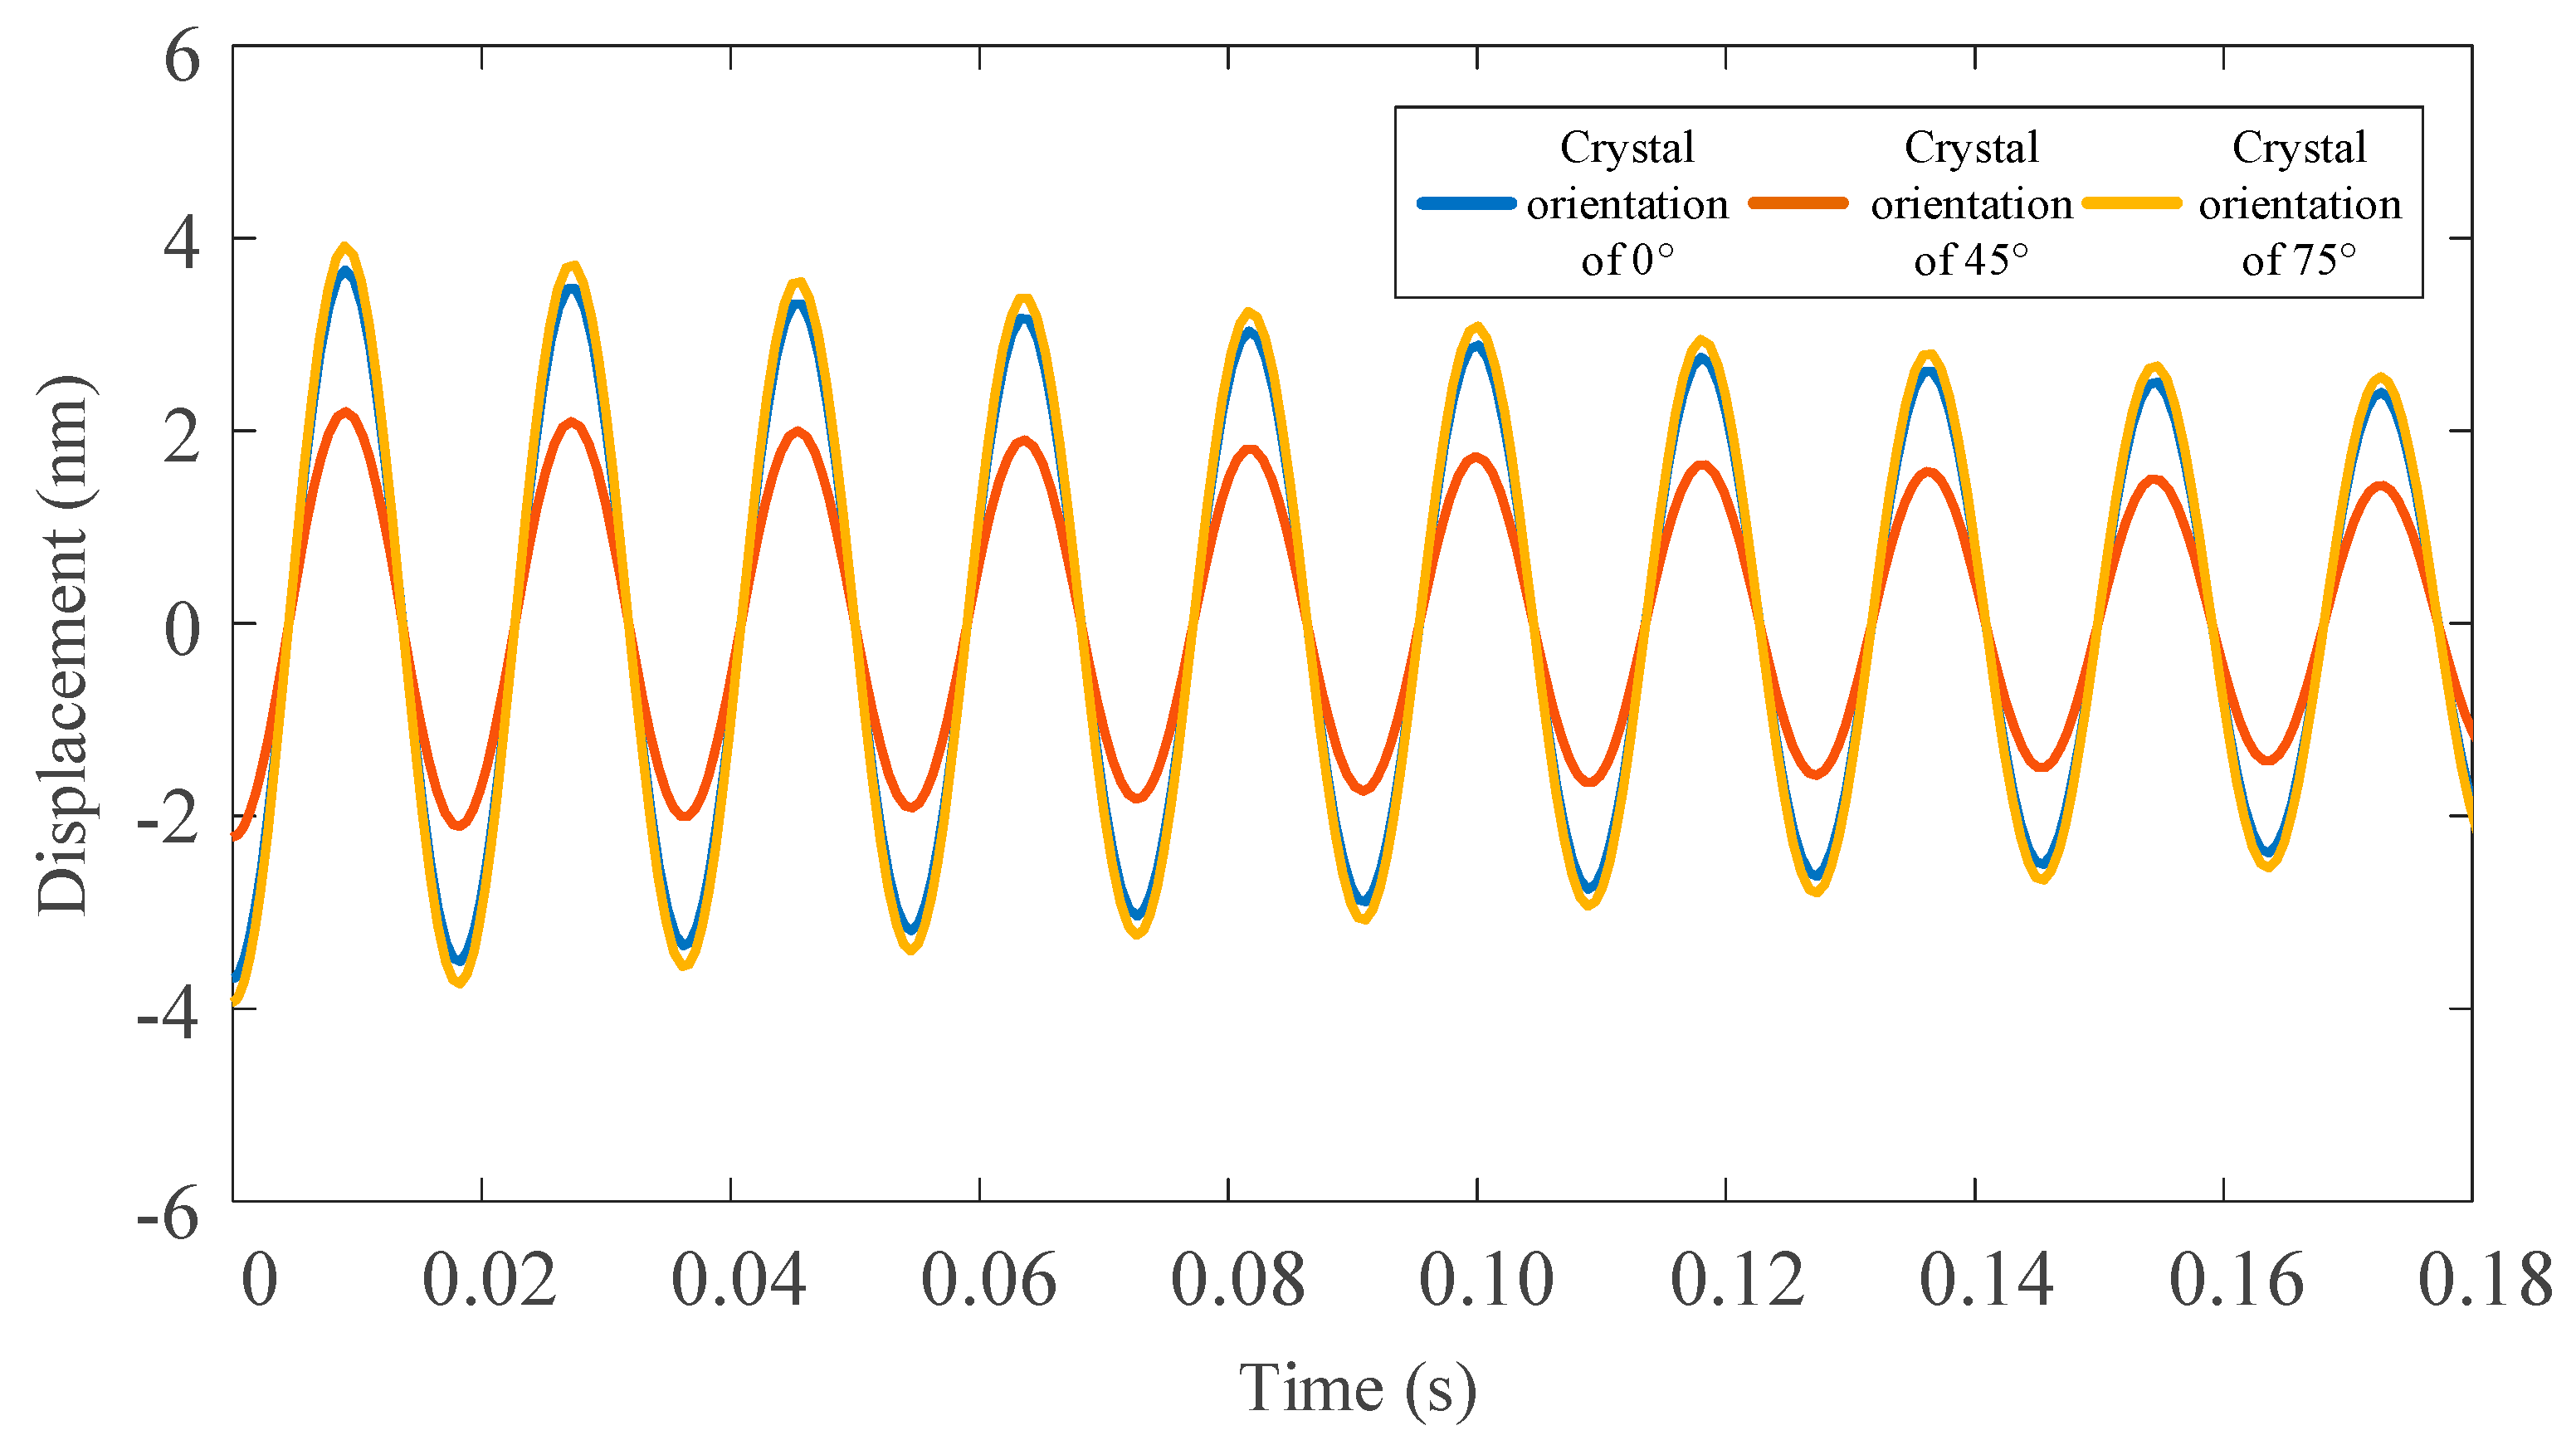
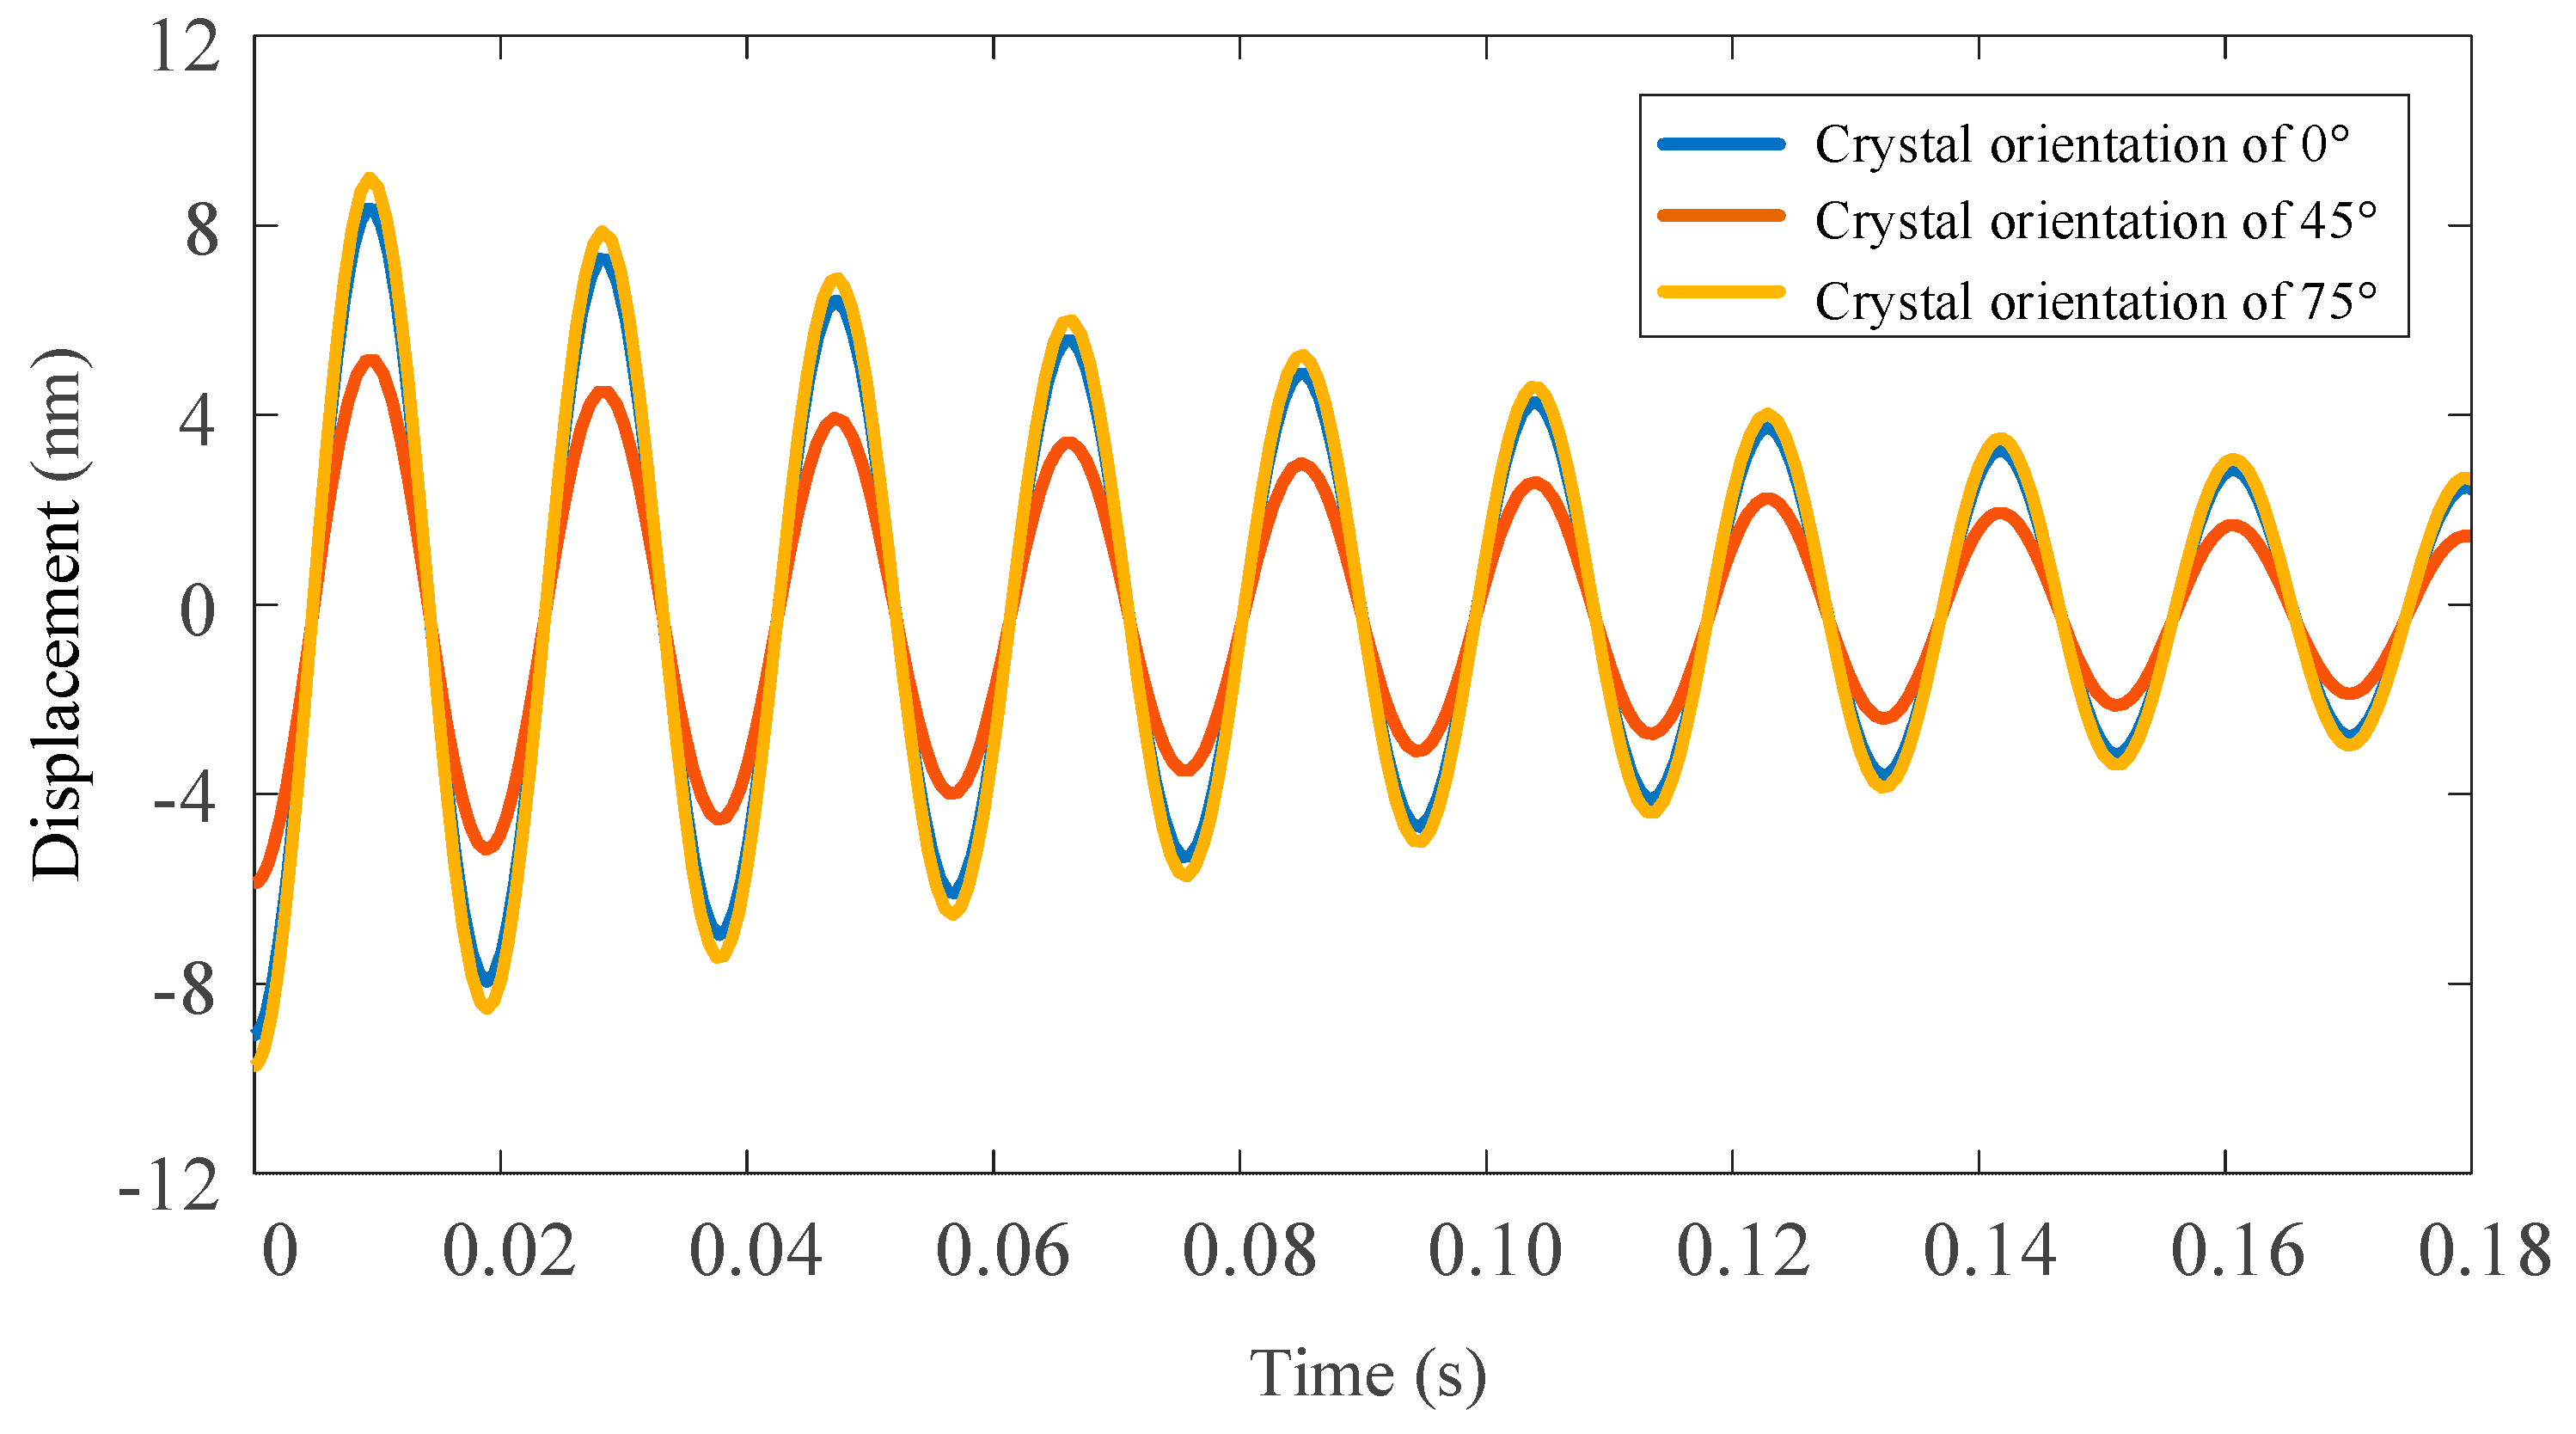
4.1. Establishment of Dynamic Cutting System
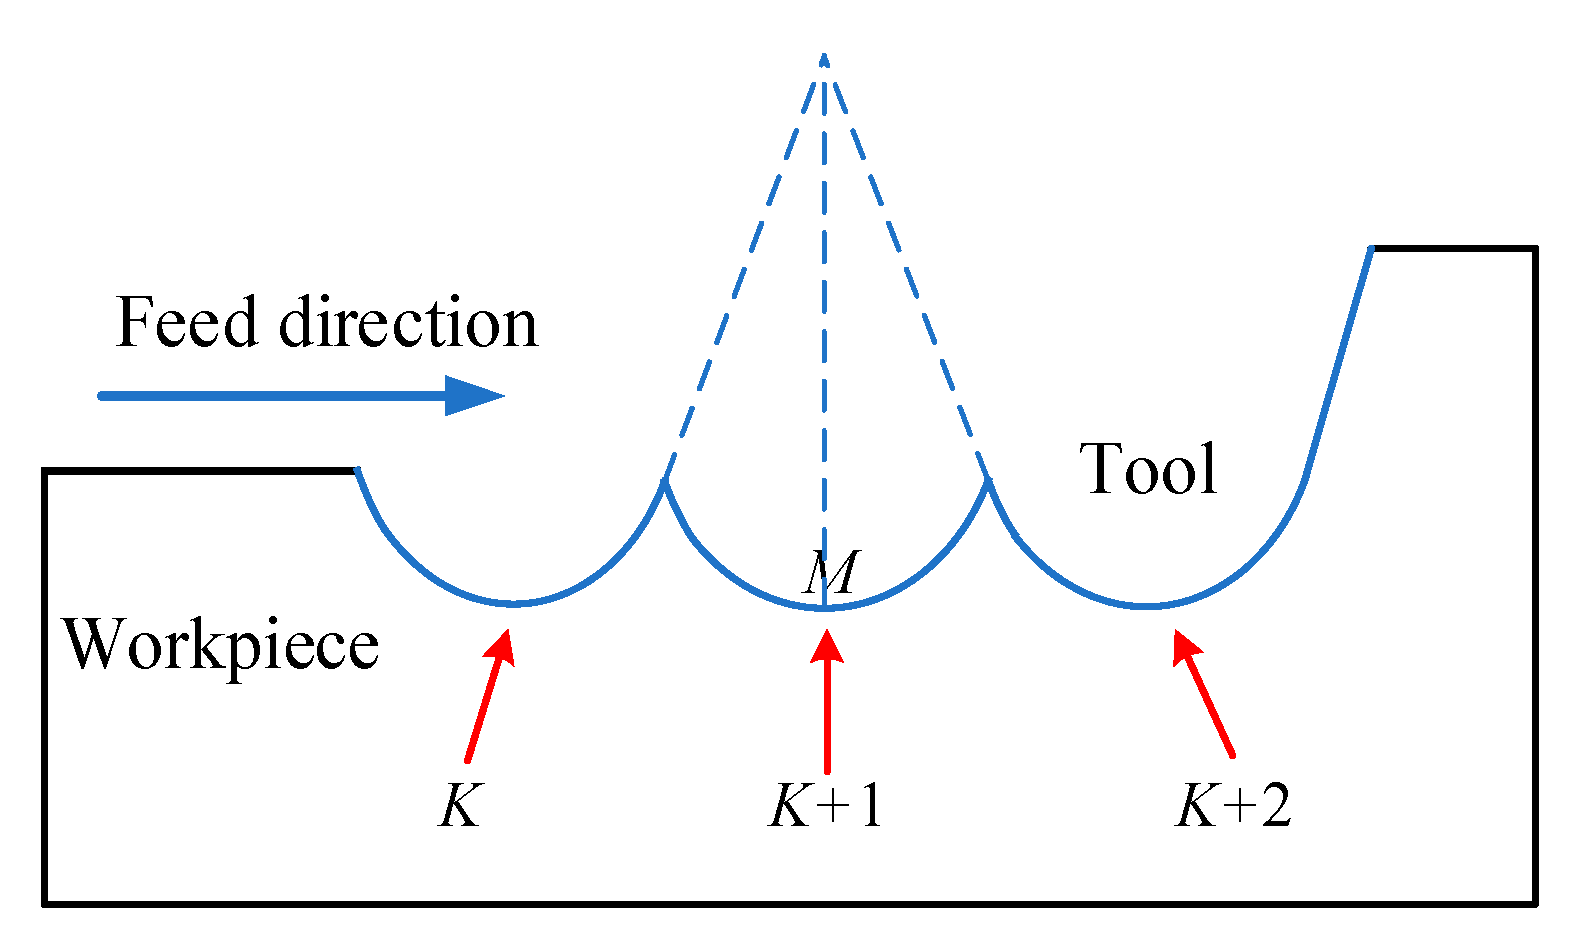
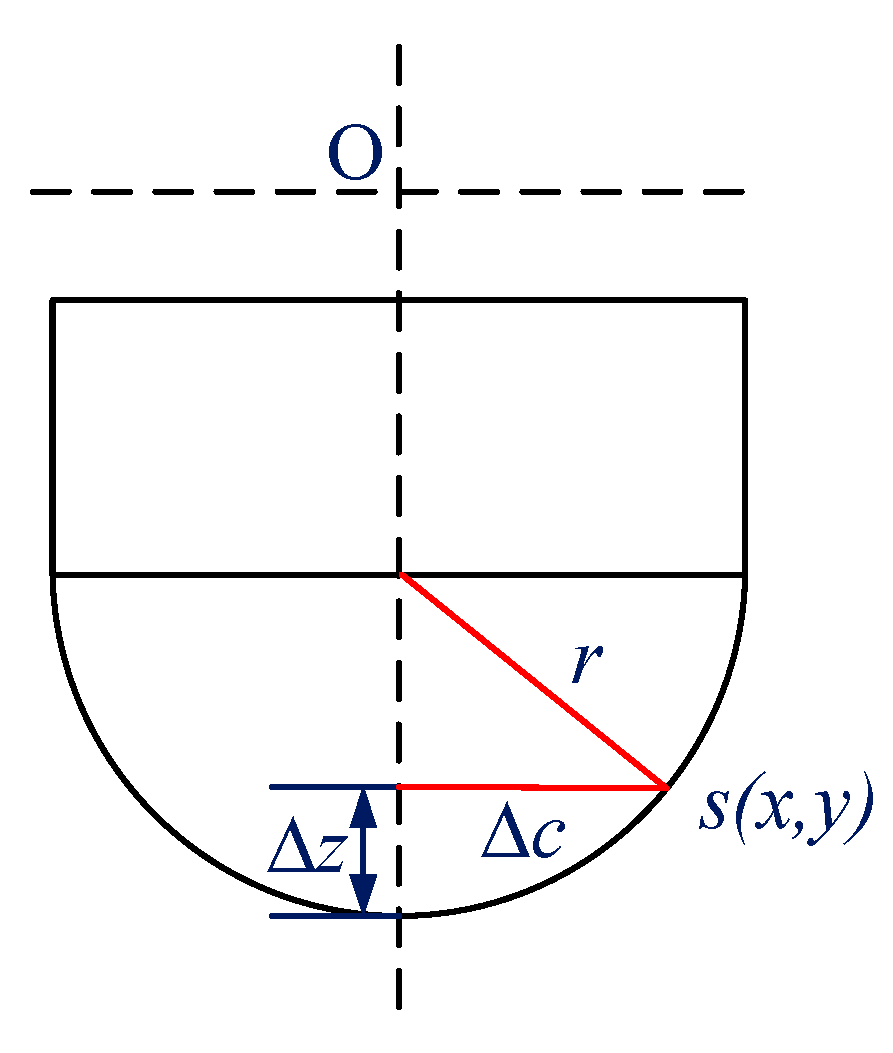
4.2. Establishment of Surface Morphology Model
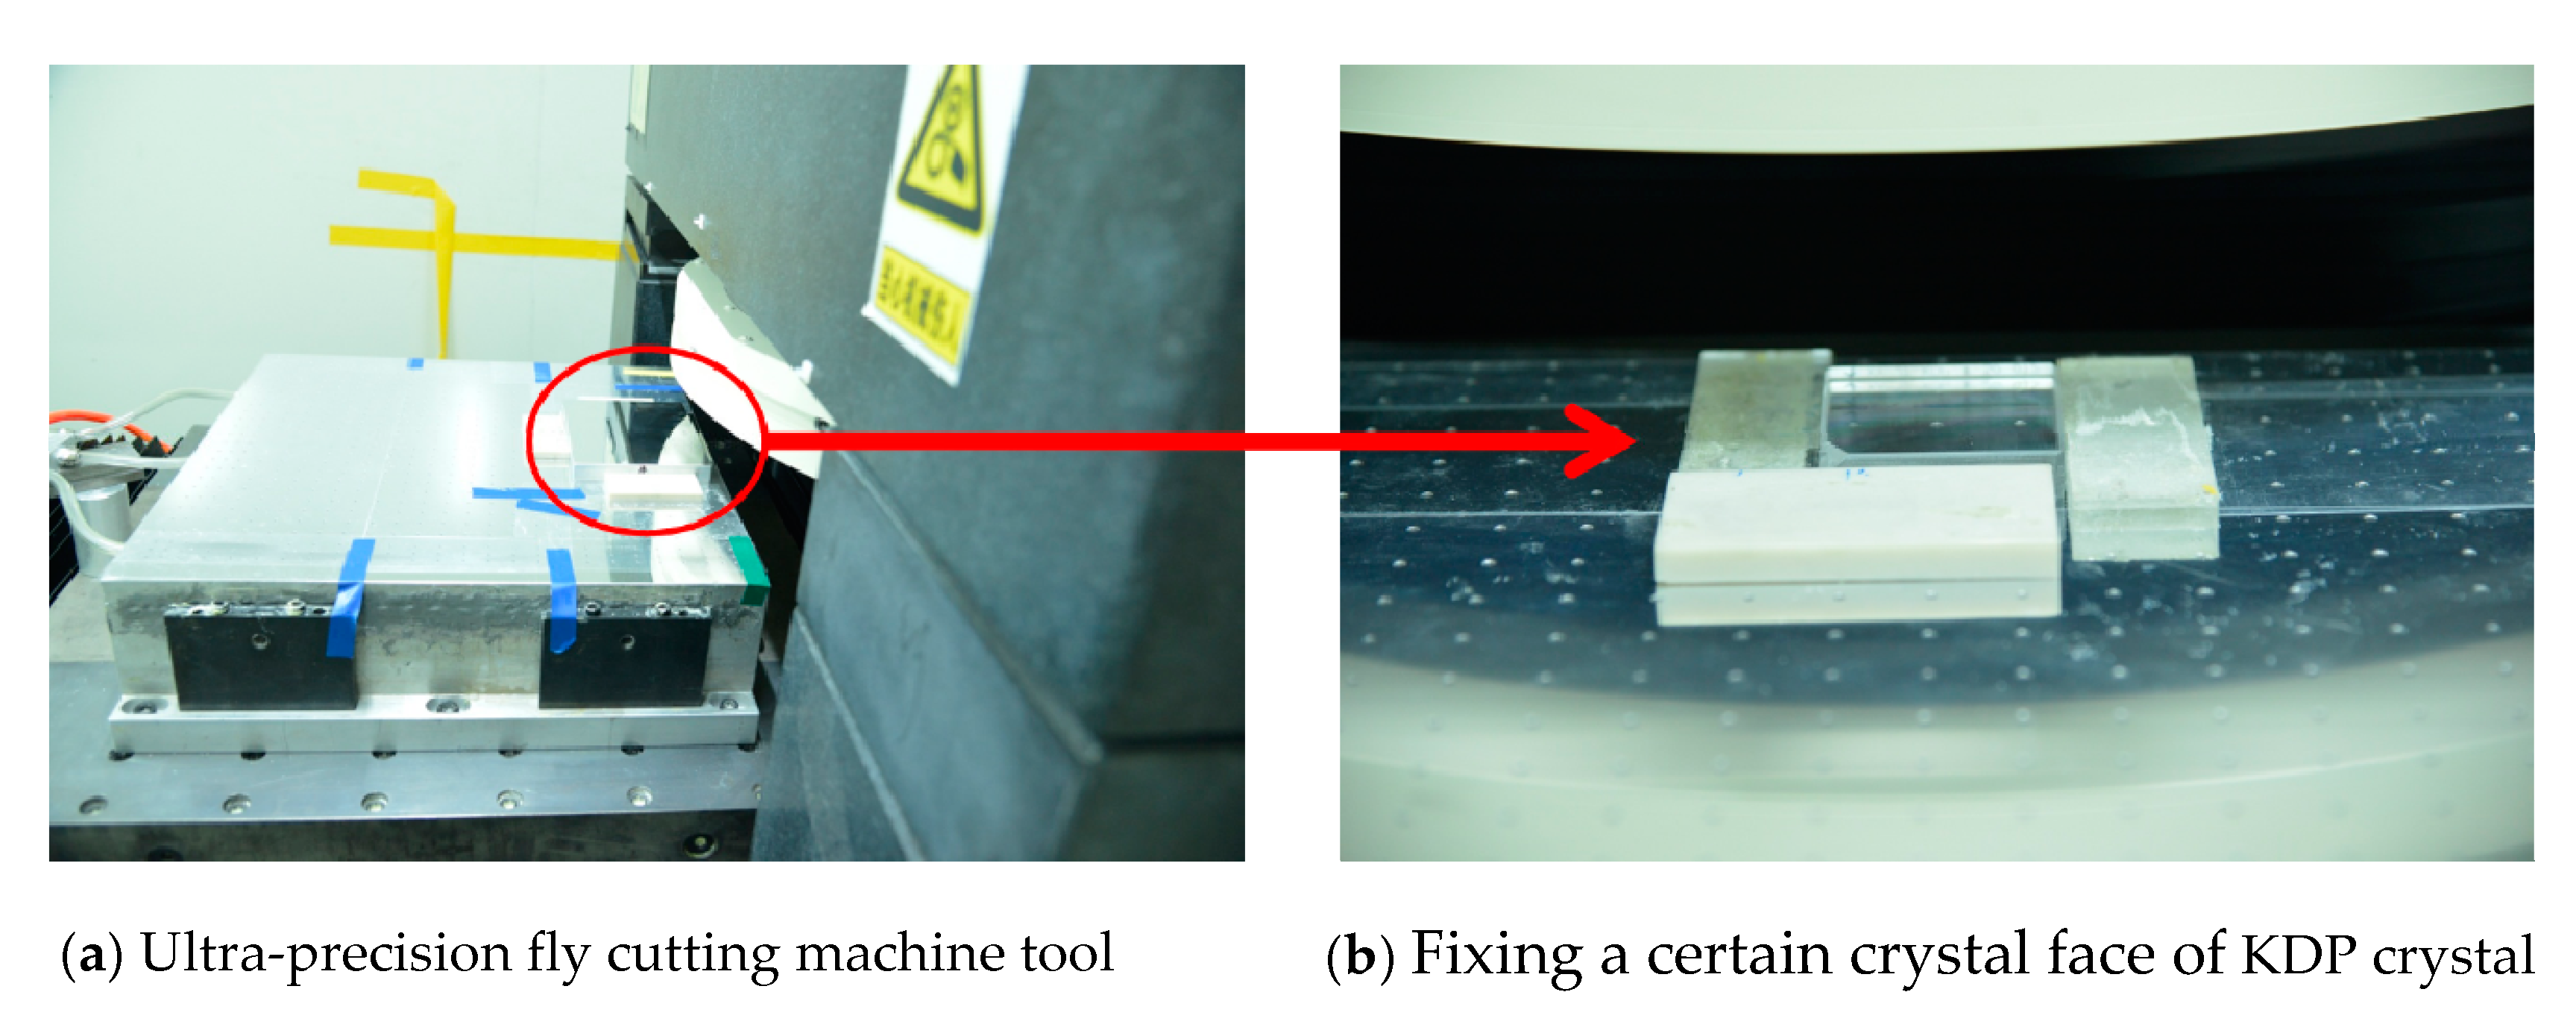
5. Experimental Results and Analysis
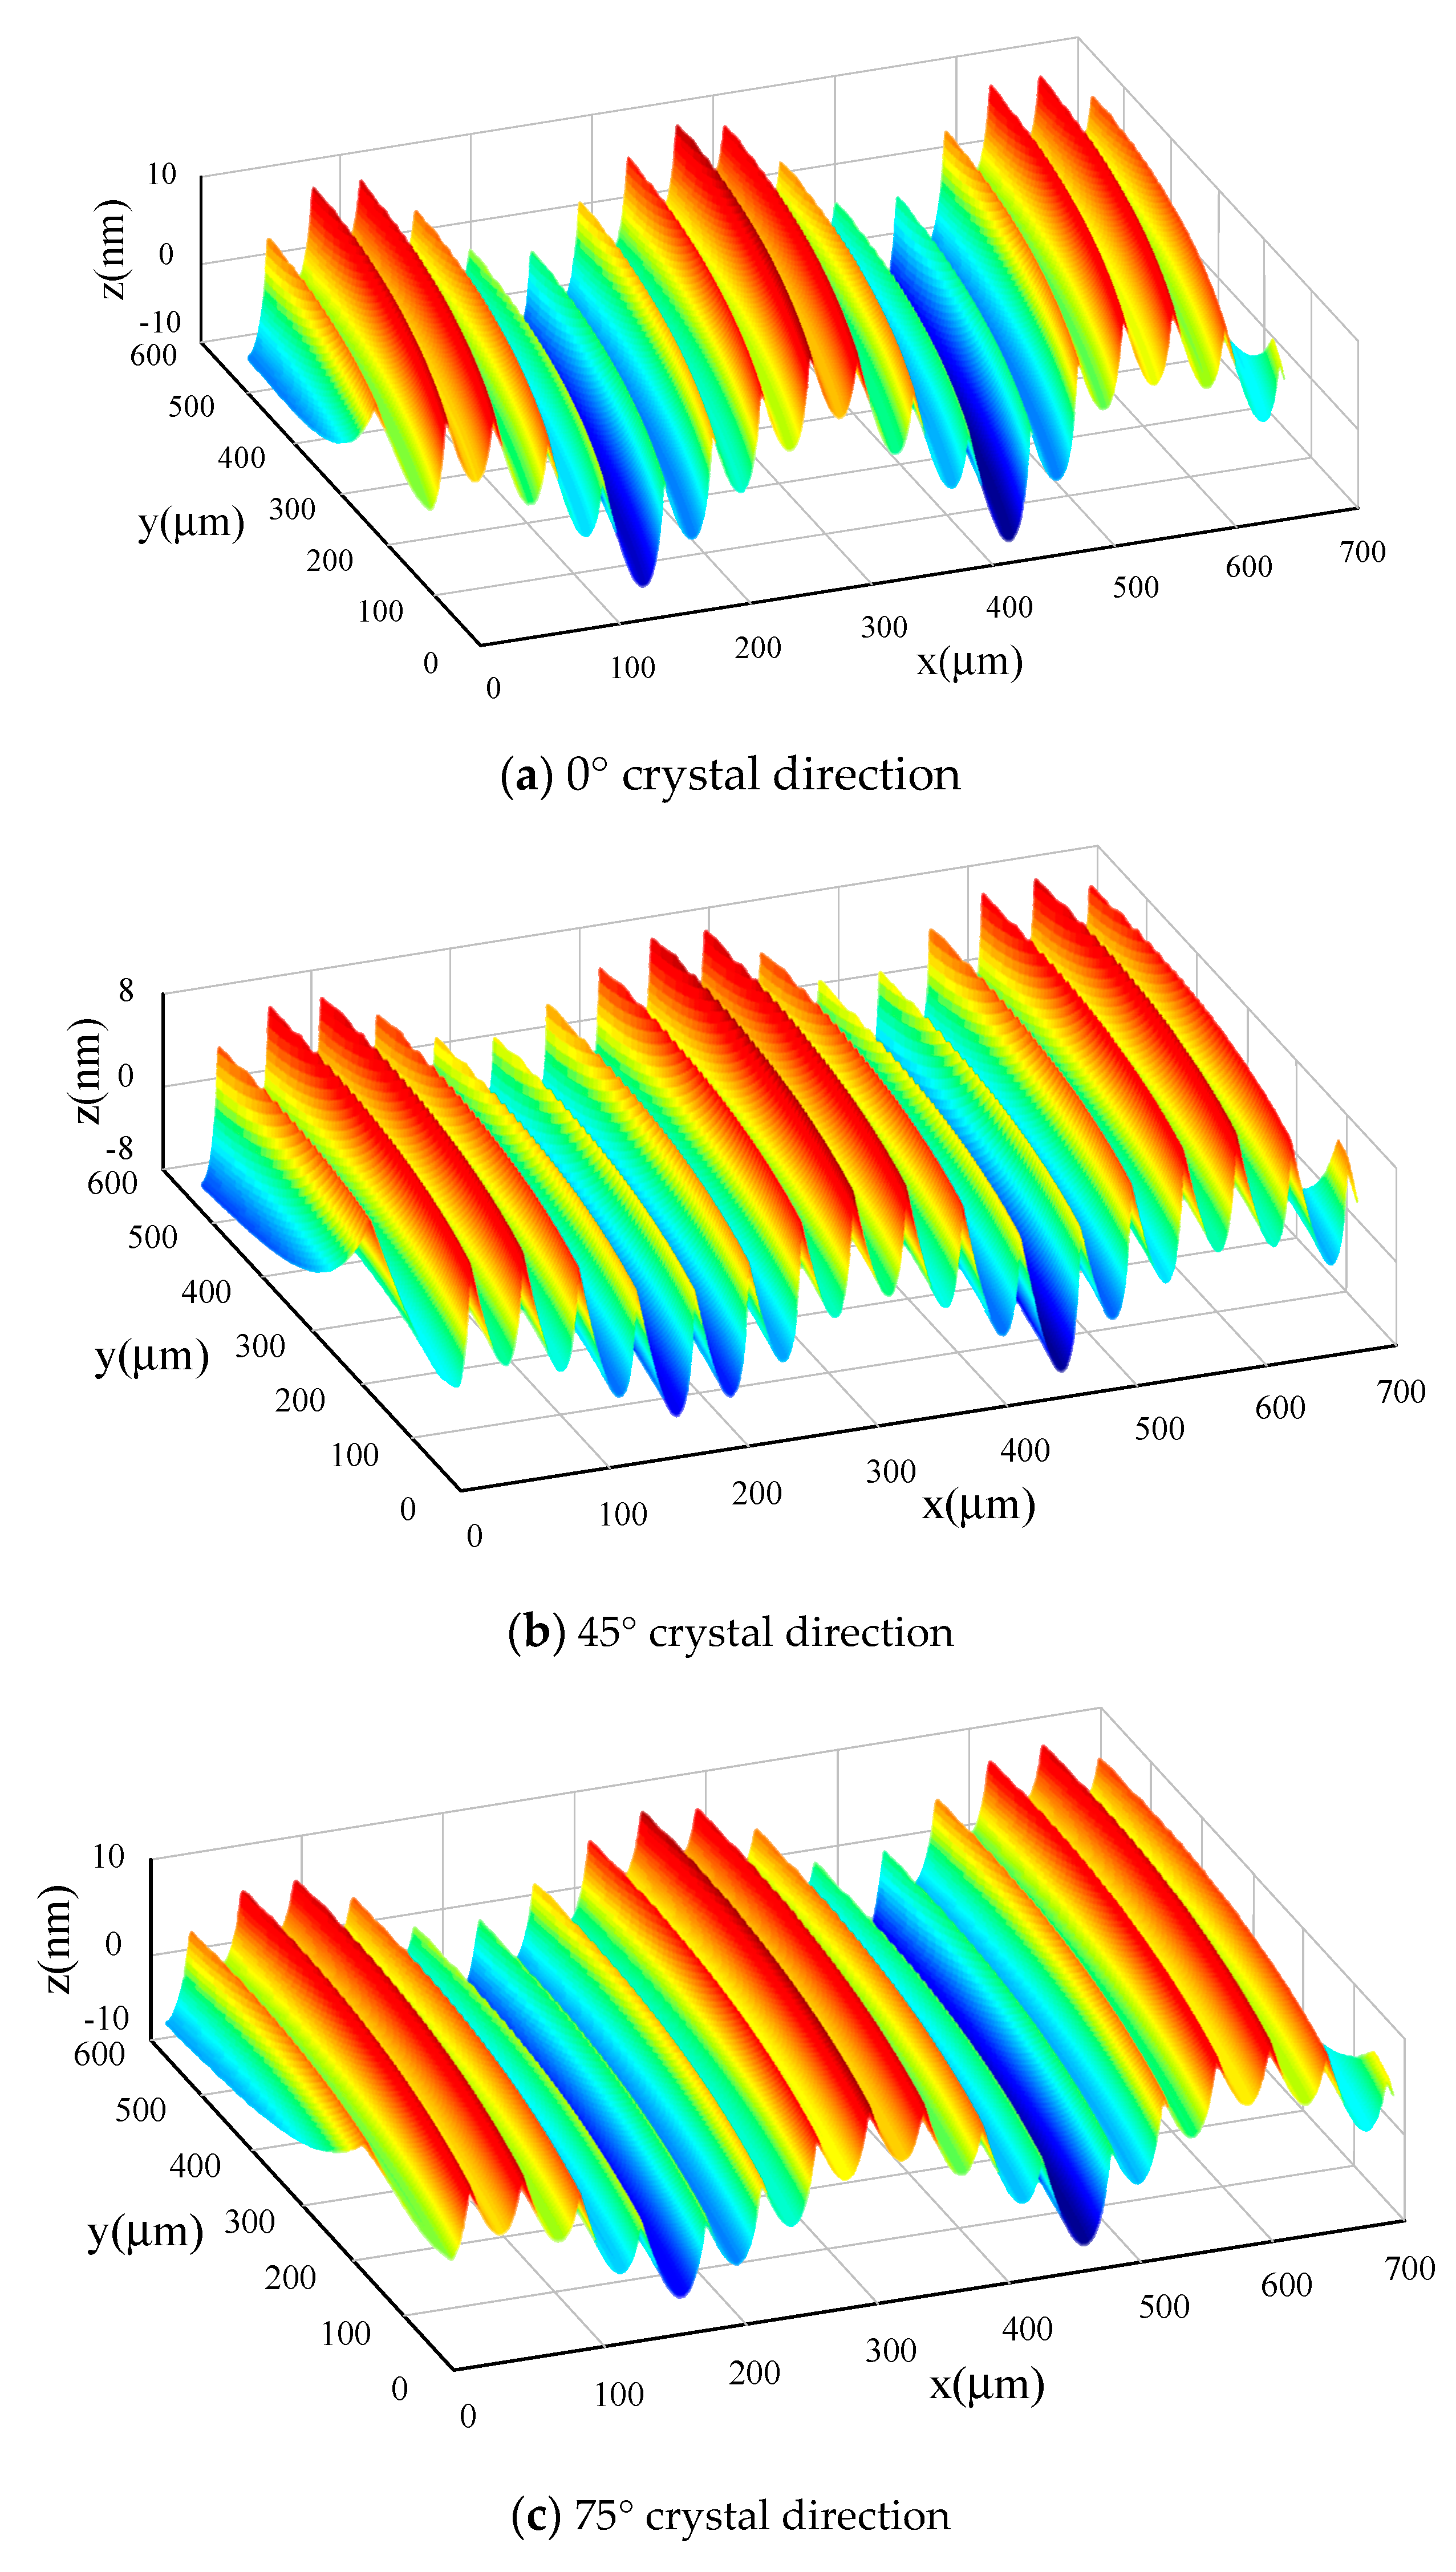
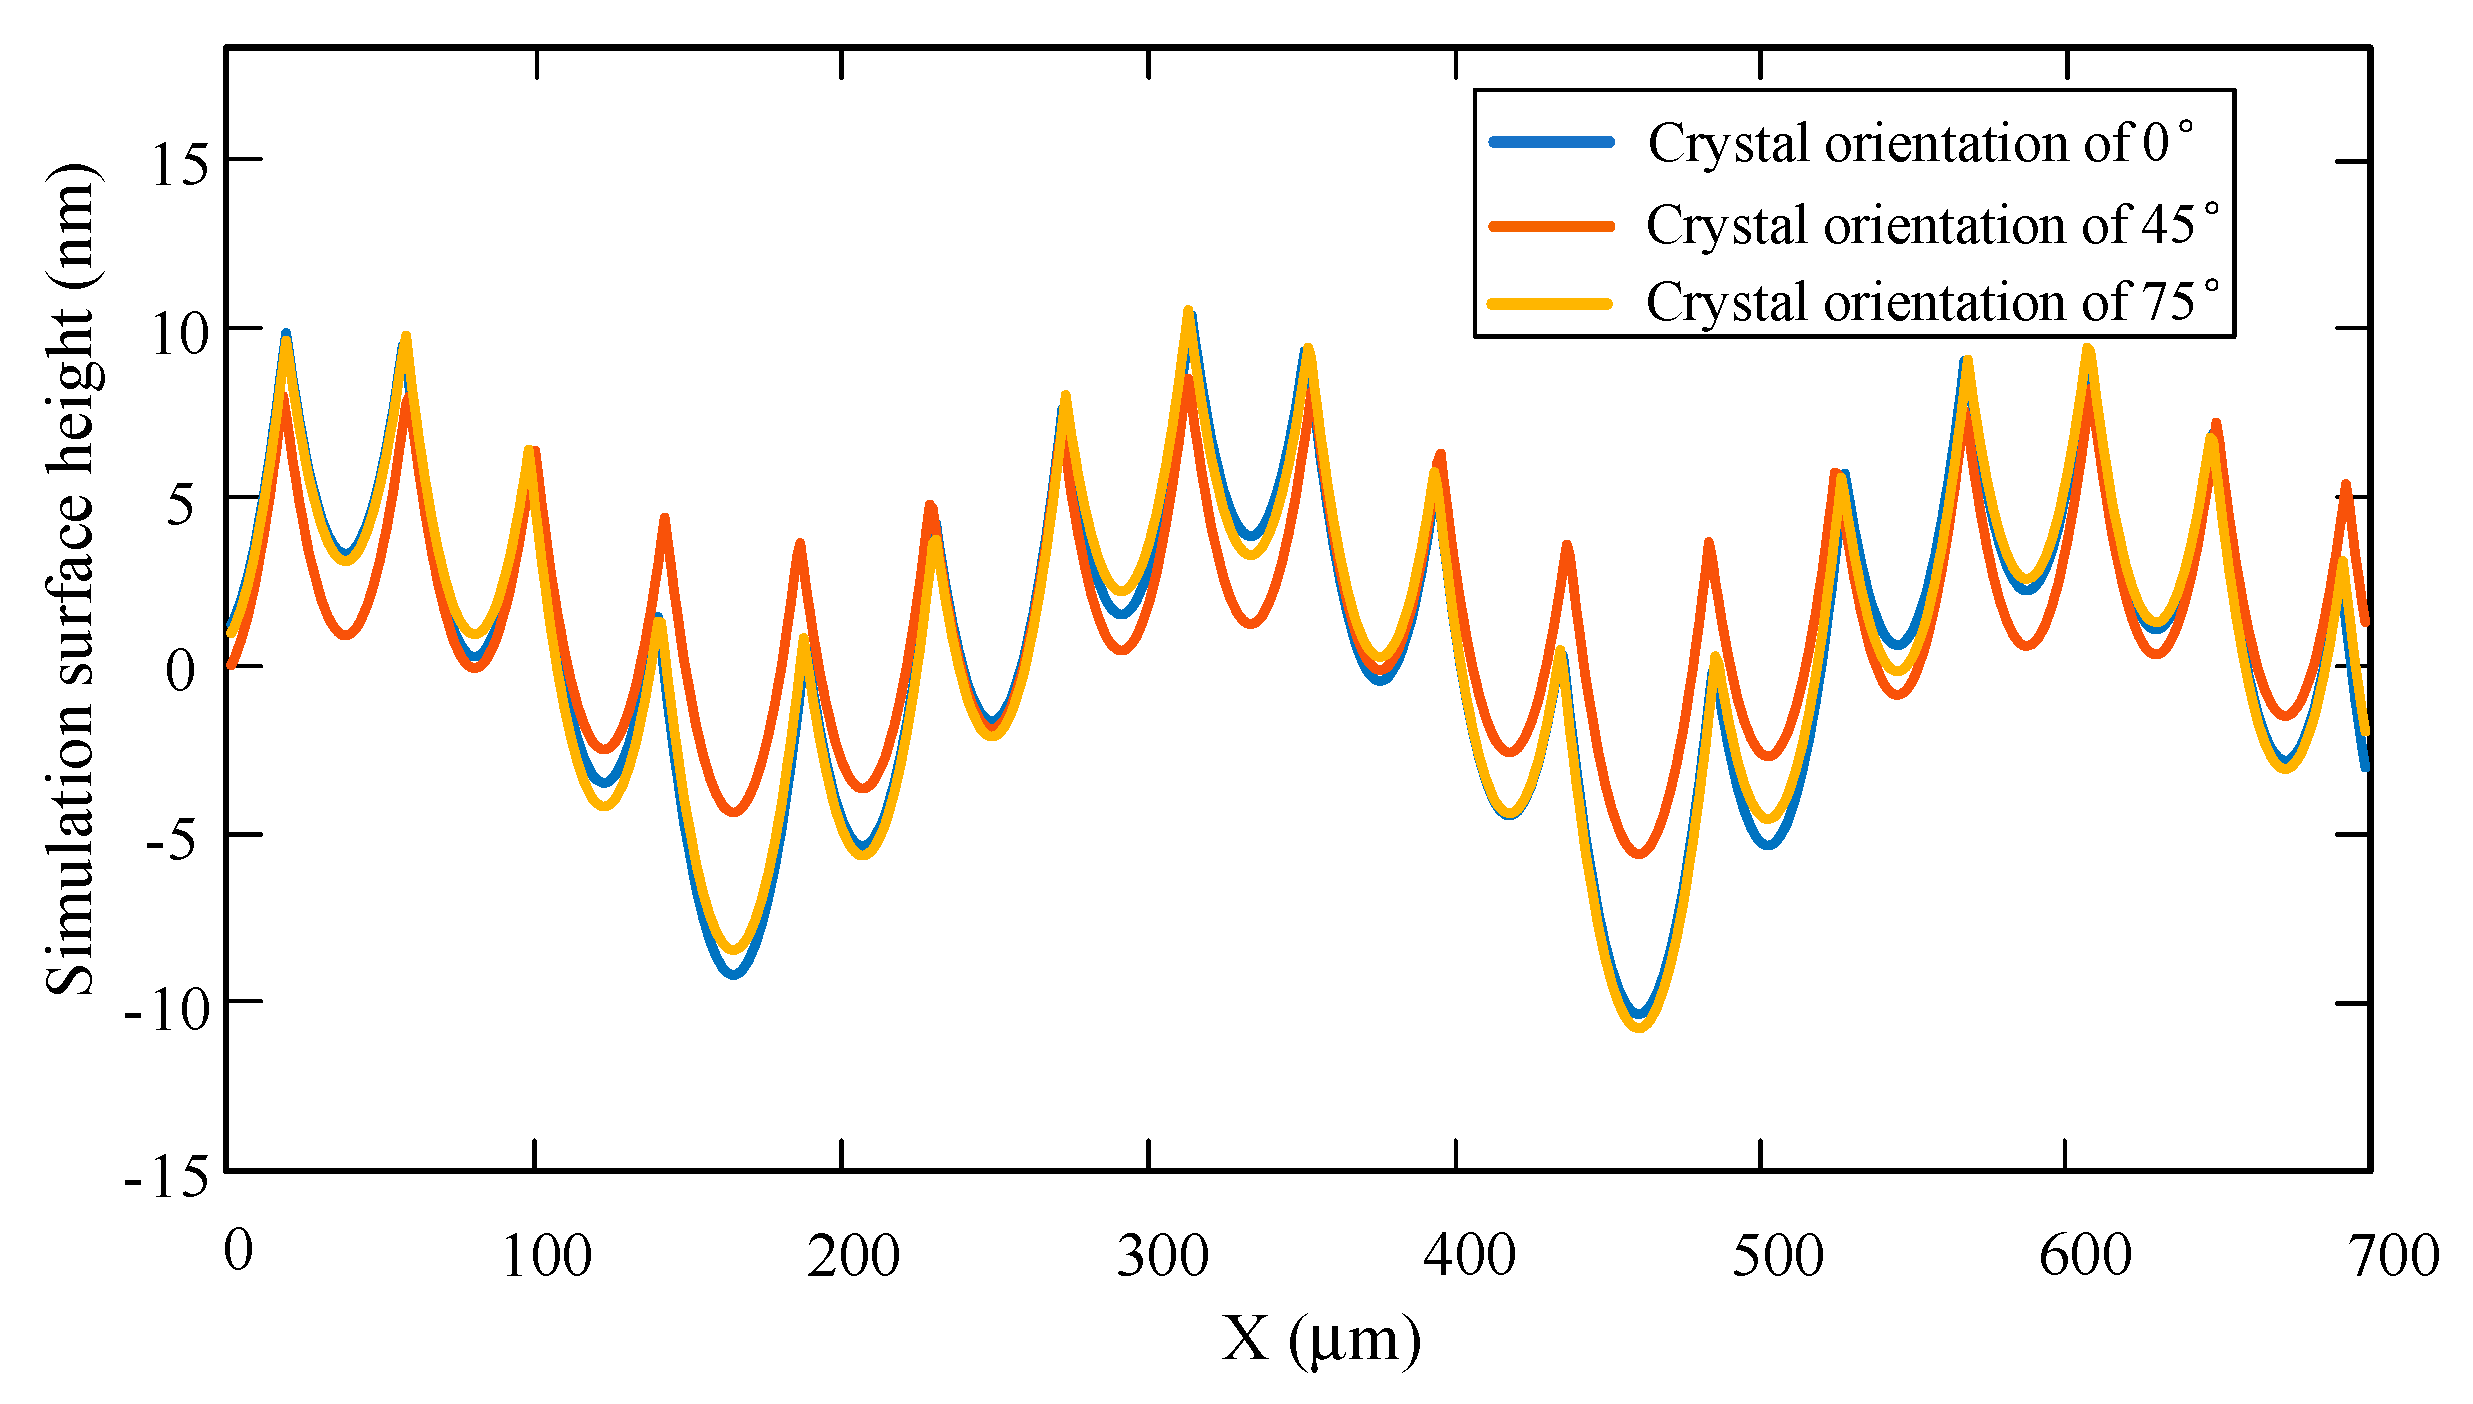
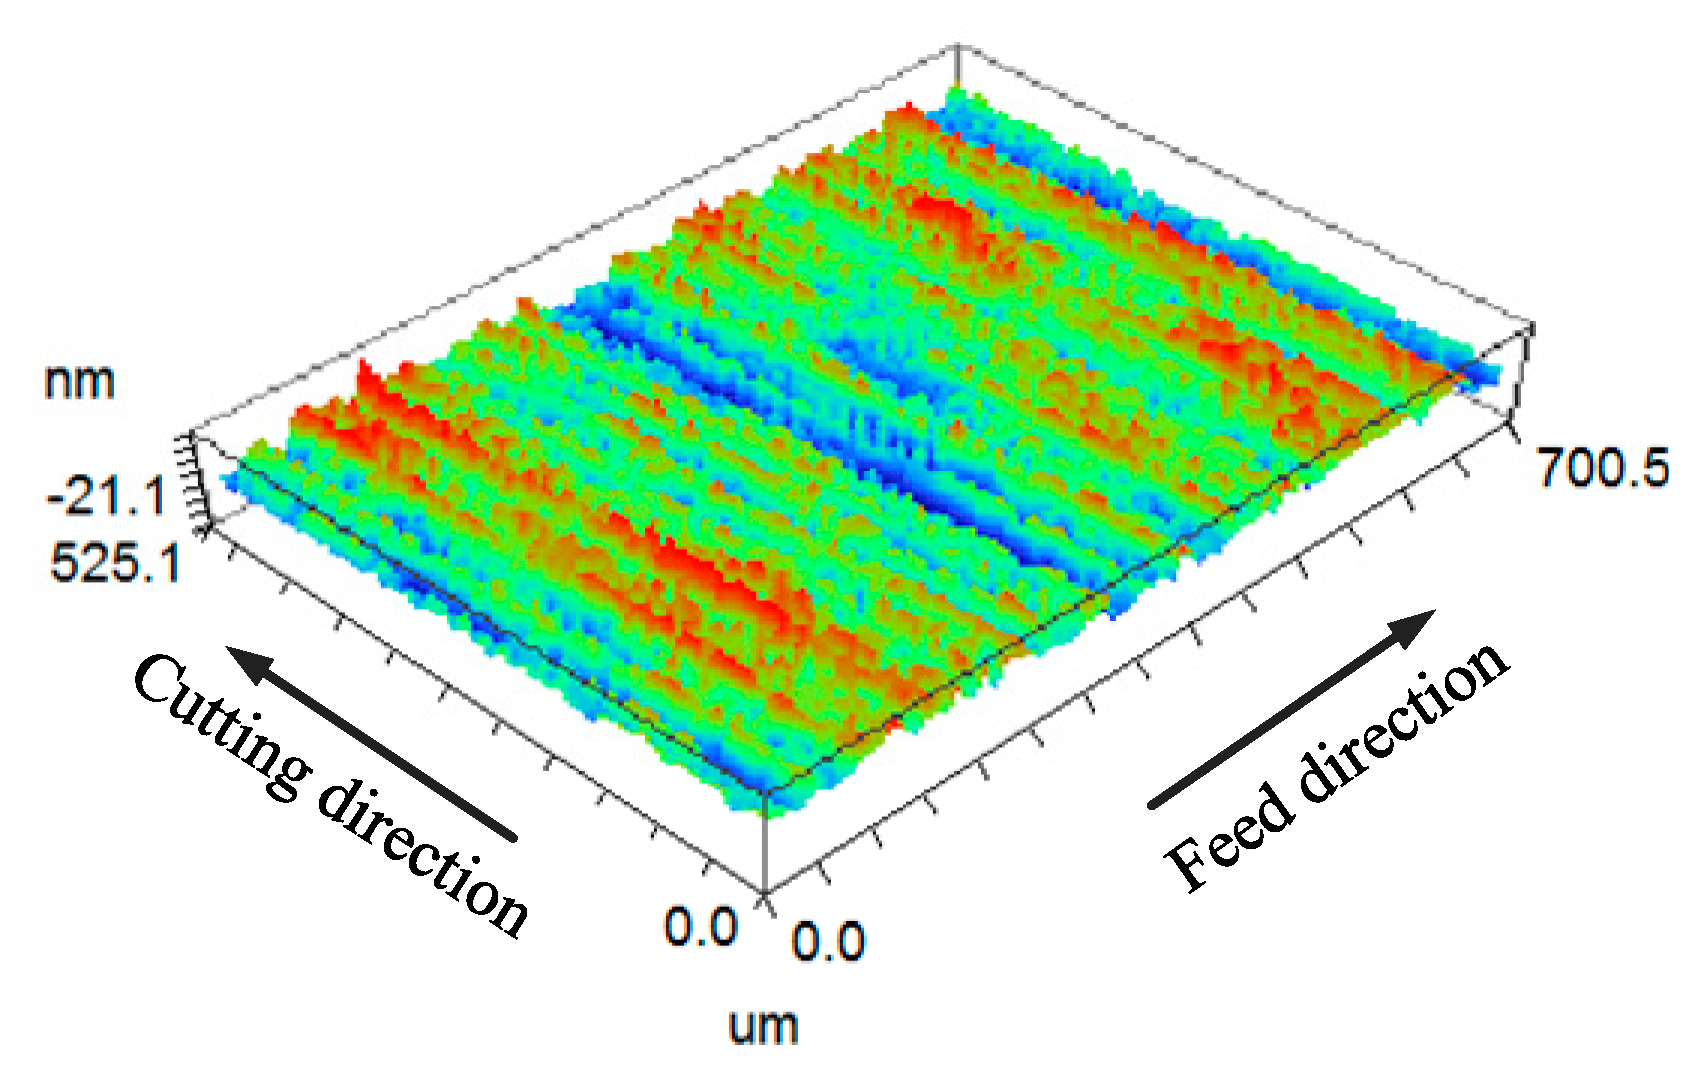
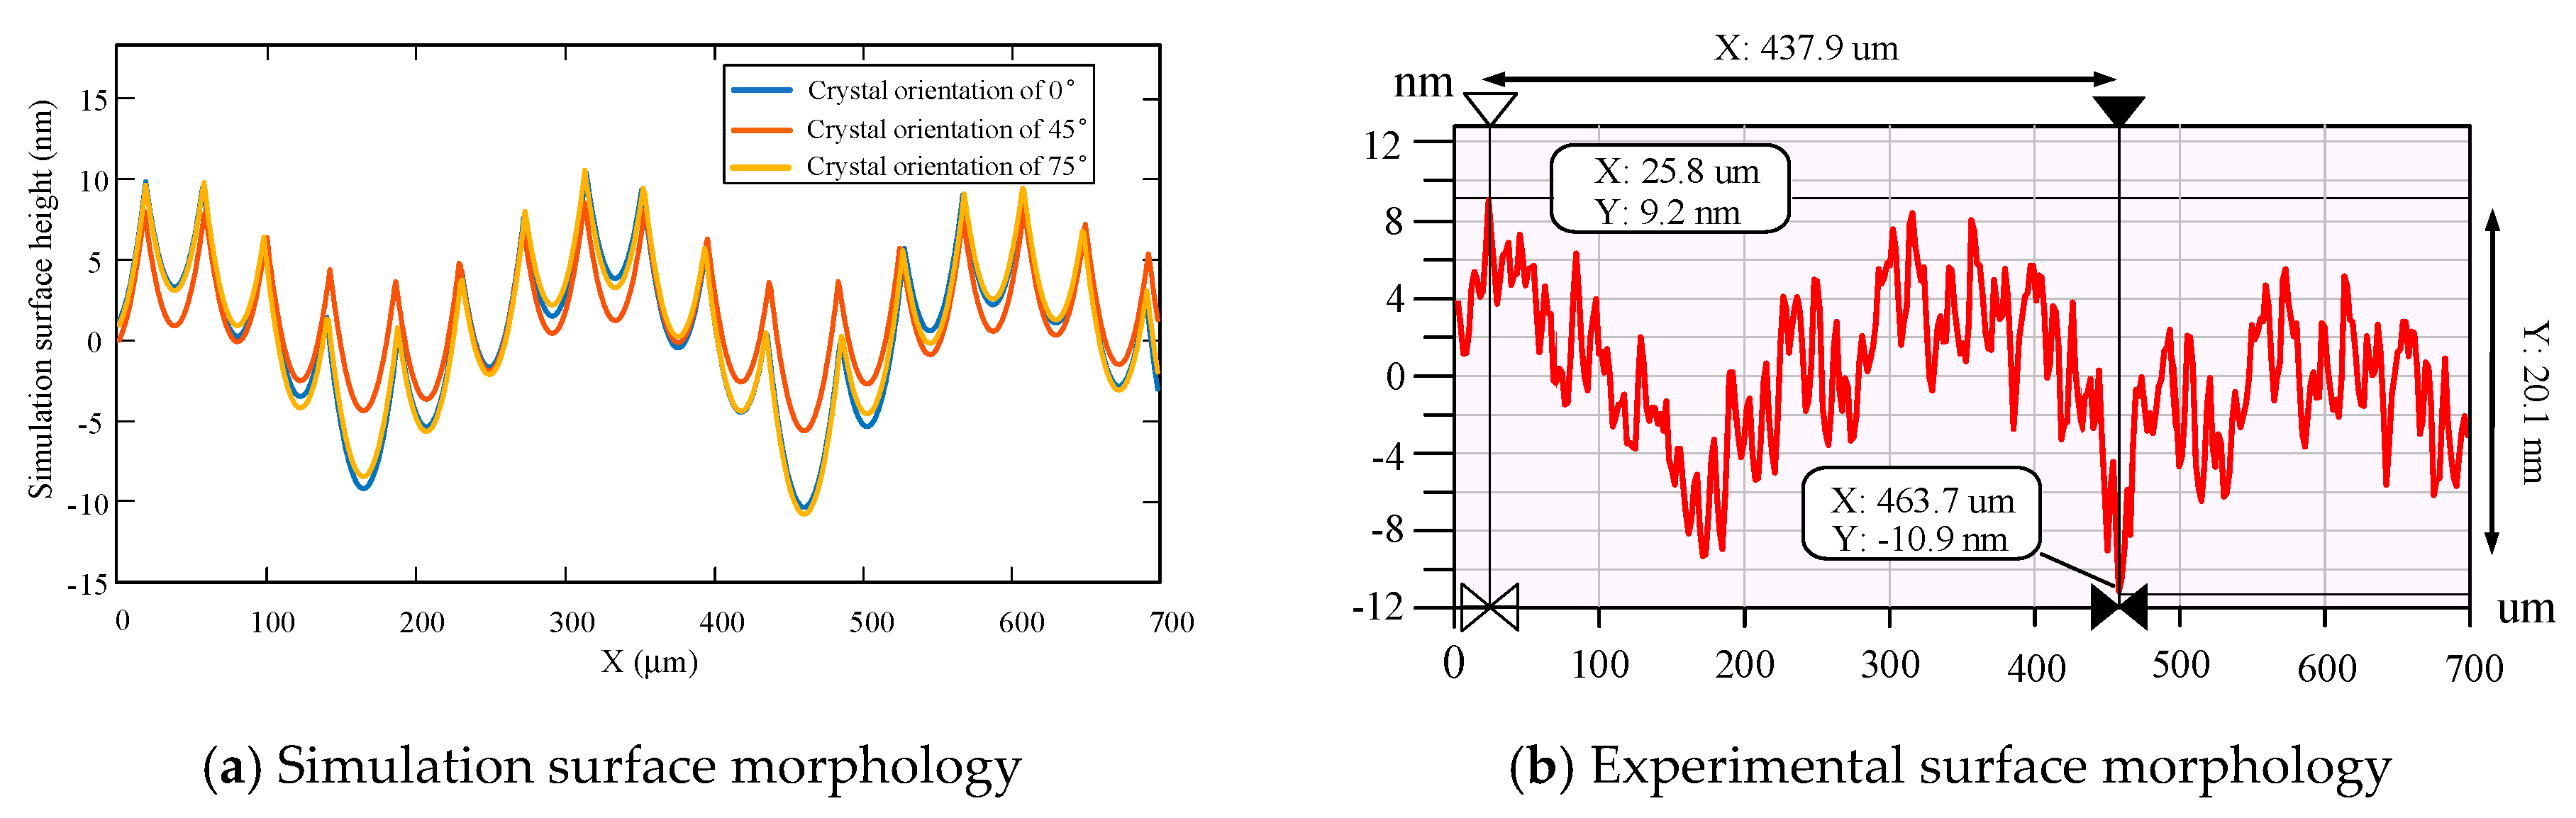
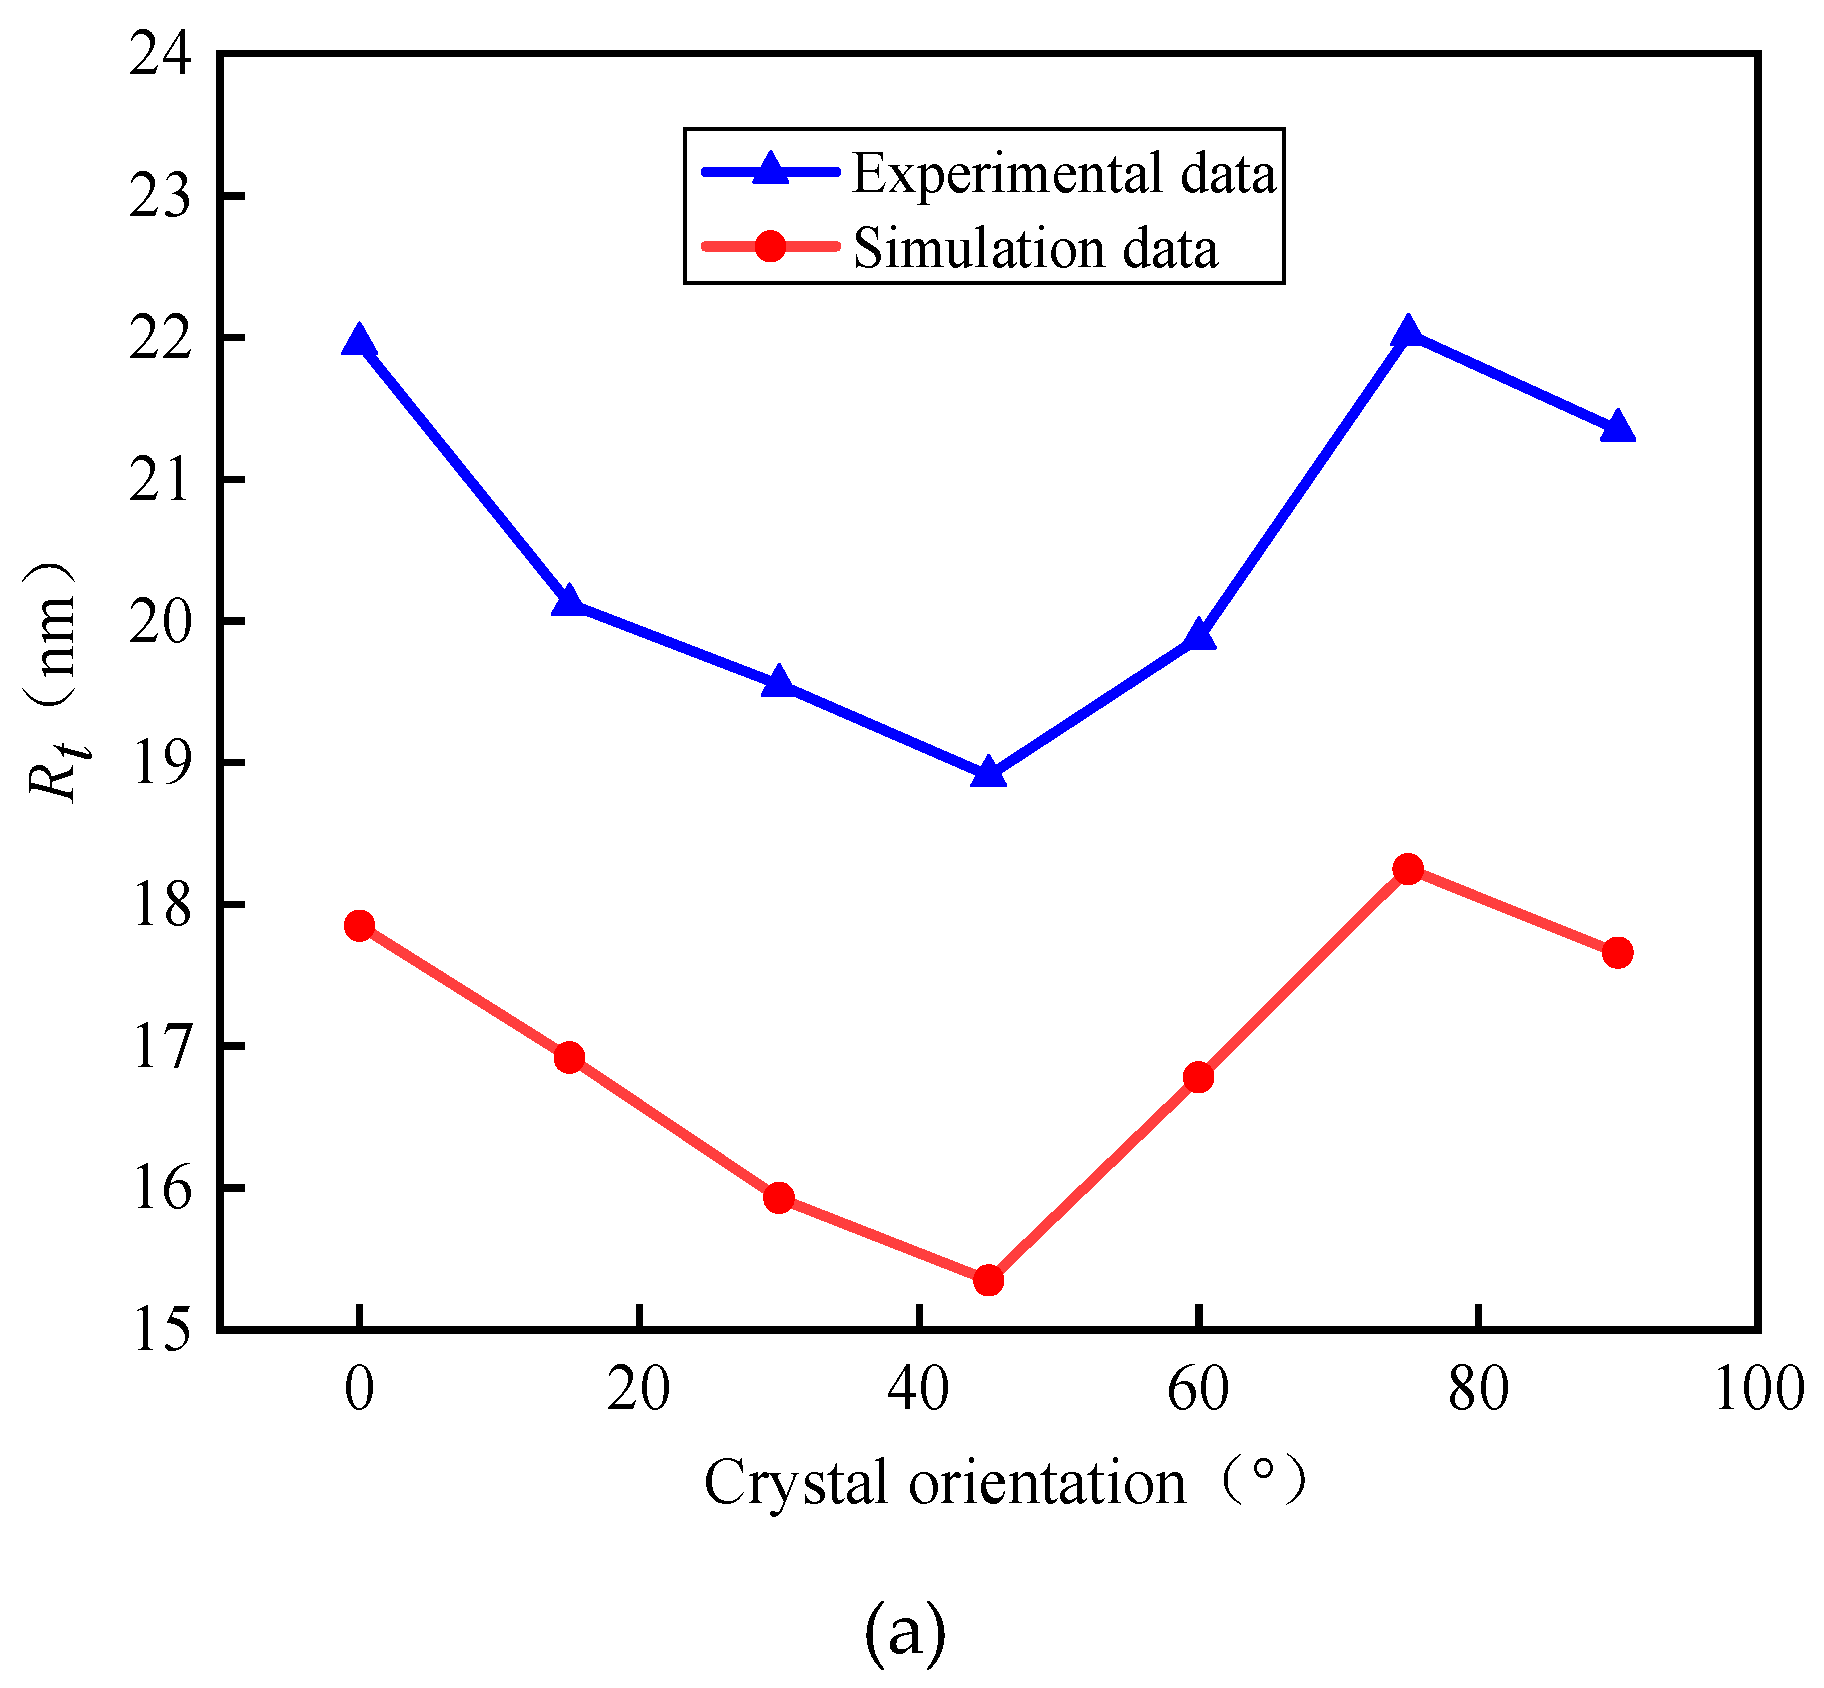
5.1. Surface Morphology Analysis
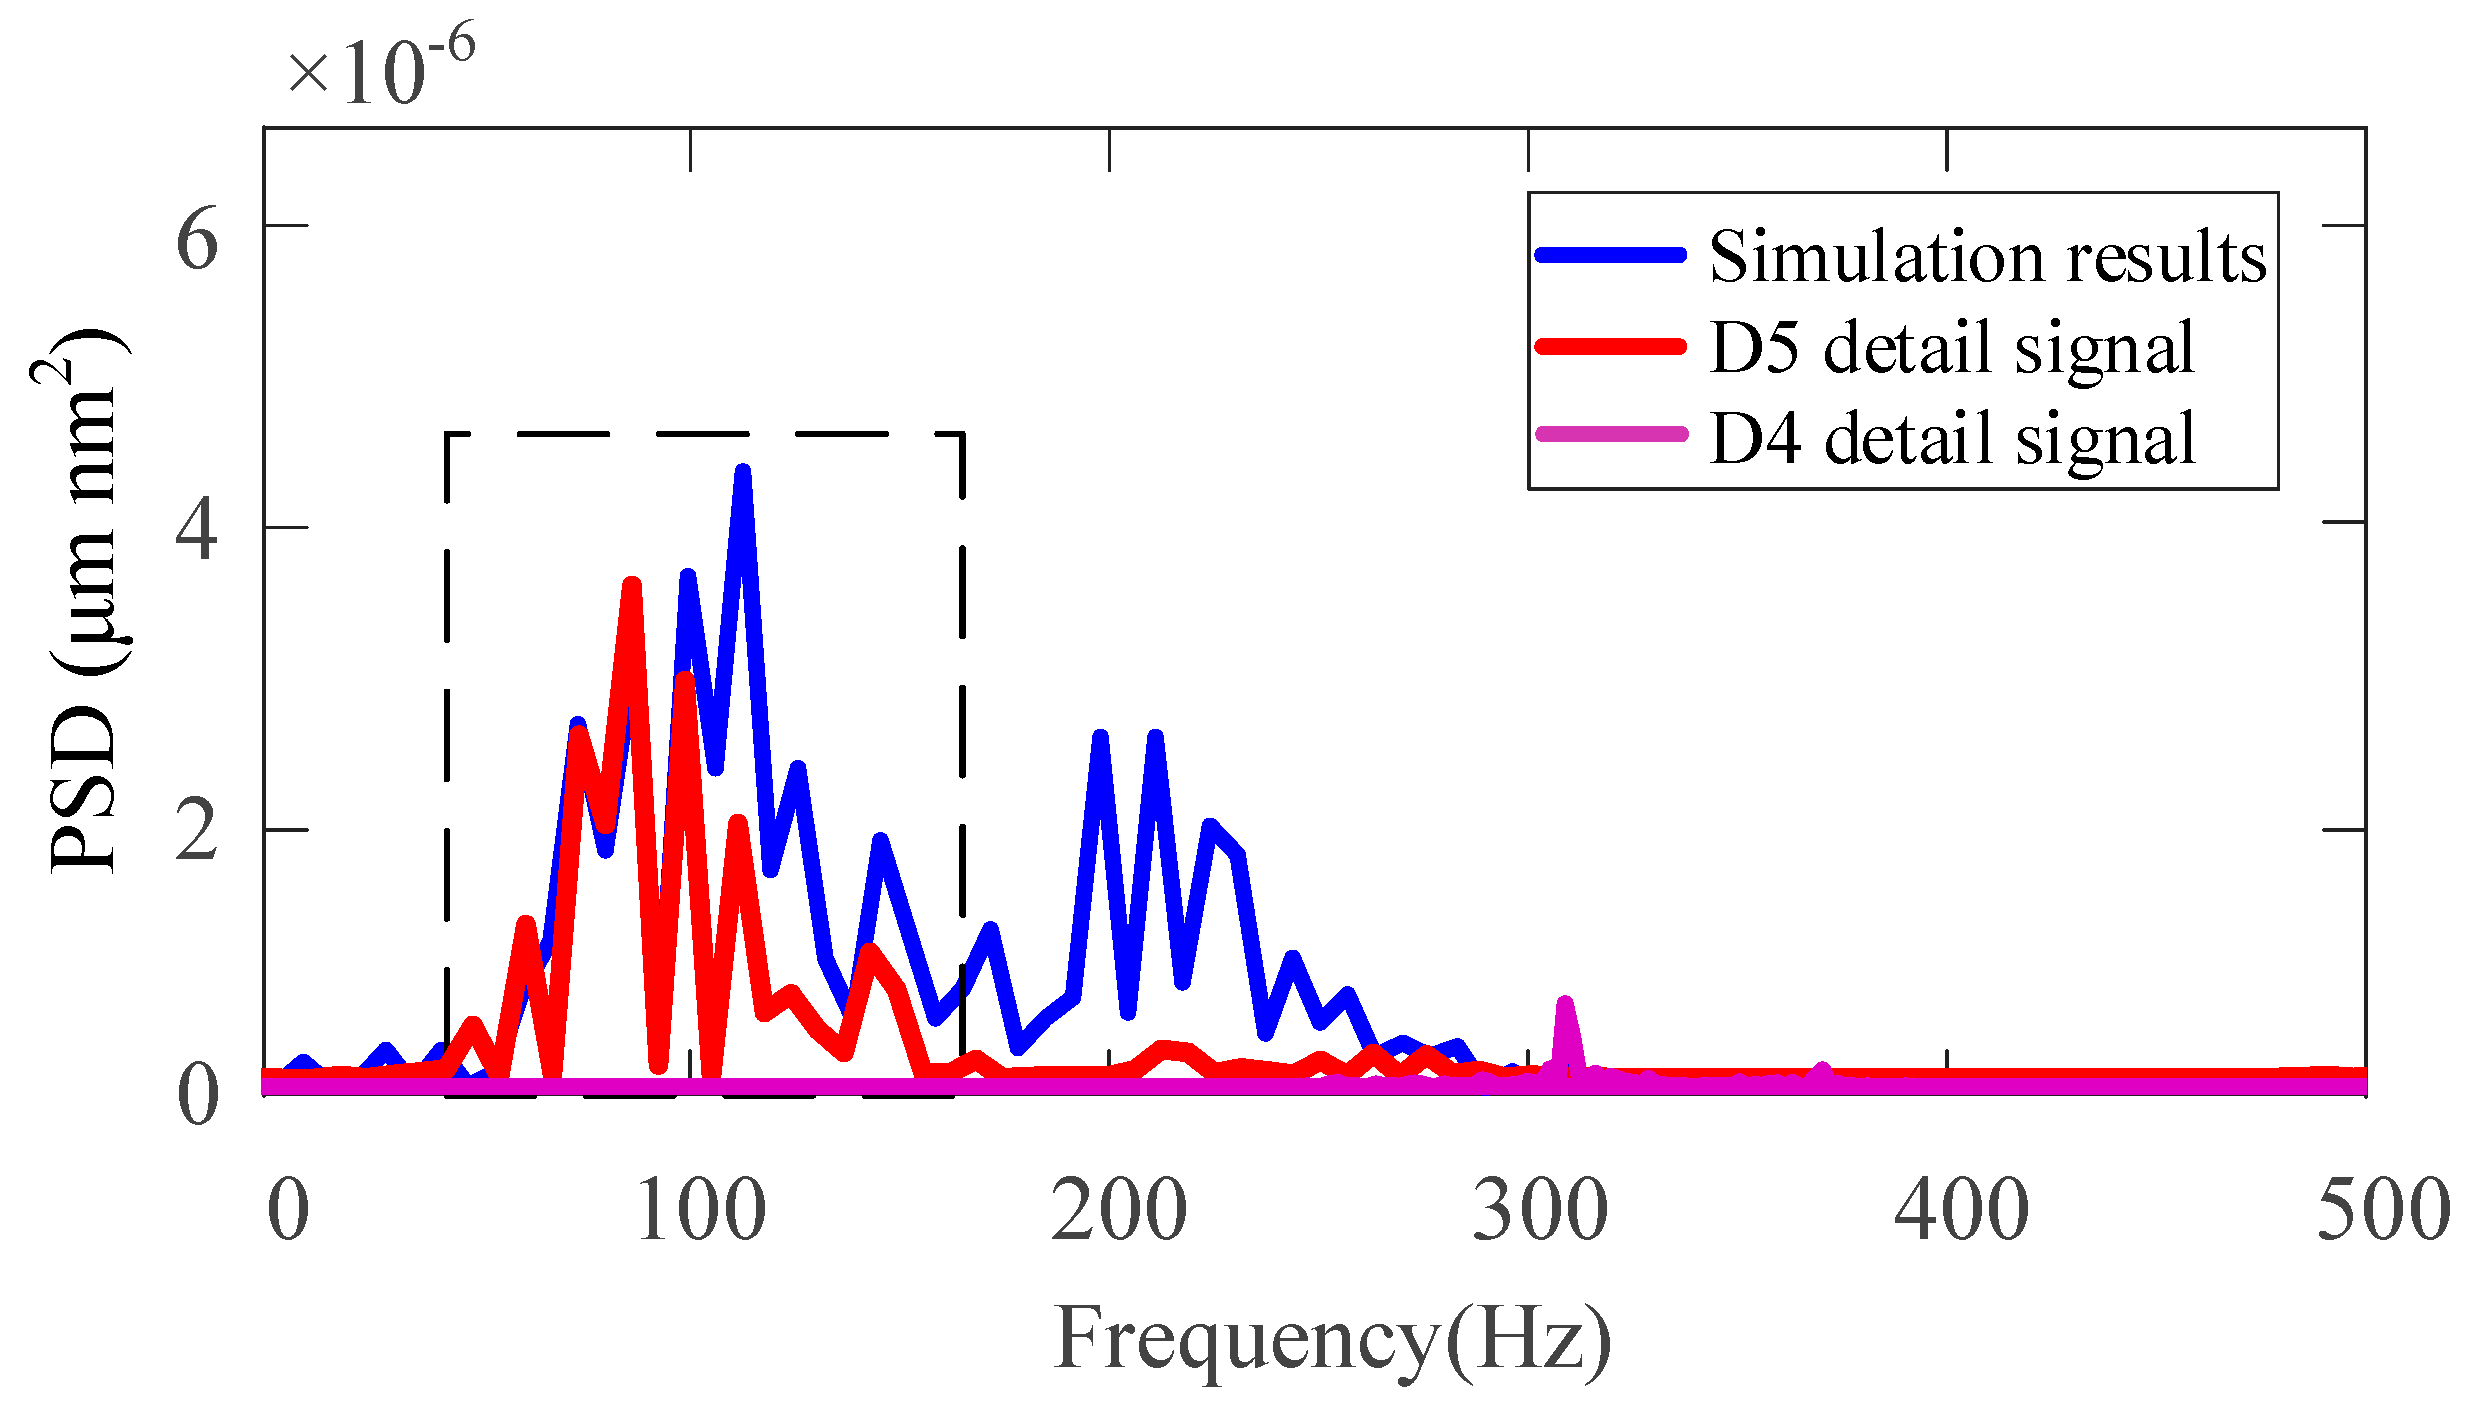
5.2. Signal Processing and Frequency Identification
6. Conclusions
Author Contributions
Funding
Conflicts of Interest
References
- Kanimozhi, D.; Nandhini, S.; Indirajith, R. Effects of dyes in the growth (optical, mechanical and dielectric properties of KDP crystals. J. Mater. Sci. Mater. Electron. 2019, 30, 10244–10255. [Google Scholar] [CrossRef]
- Cai, T.; Zhang, M.; Zhu, Y.; Hu, J. Error modeling and analysis of an ultra-precision stage with an aerostatic bearing. J. Tsinghua Univ. 2011, 51, 857–861. [Google Scholar]
- Chen, W.; Sun, Y. Influence of low-spatial frequency ripples in machined potassium dihydrogen phosphate crystal surfaces on wave front errors based on the wavelet method. Opt. Eng. 2015, 54, 024101. [Google Scholar] [CrossRef]
- Zhang, S.J.; To, S.; Wang, H.T. A theoretical and experimental investigation into five-DOF dynamic characteristics of an aerostatic bearing spindle in ultra-precision diamond turning. Int. J. Mach. Tools Manuf. 2013, 71, 1–10. [Google Scholar] [CrossRef]
- Wang, S.J.; To, S.; Cheung, C.F. An investigation into material-induced surface roughness in ultra-precision milling. Int. J. Adv. Manuf. Technol. 2013, 68, 607–616. [Google Scholar] [CrossRef]
- Rajesh, N.P.; Kannan, V.; Ramasamy, P.S.; Ramasamy, P.; Lan, C.W. Optical and microhardness studies of KDP crystals grown from aqueous solutions with organic additives. Mater. Lett. 2002, 52, 326–328. [Google Scholar] [CrossRef]
- Sengupta, S.; Sengupta, S.P. Microhardness studies in gel-grown ADP and KDP single crystals. Bull. Mater. Sci. 1992, 15, 333–338. [Google Scholar] [CrossRef]
- Zhang, J.; Wang, D.; Feng, P.; Wu, Z.; Zhang, C. Material Removal Characteristics of KDP Crystal in Ultrasonic Vibration-Assisted Scratch Process. Mater. Manuf. Process. 2016, 31, 1037–1045. [Google Scholar] [CrossRef]
- Wang, S.; An, C.; Zhang, F.; Wang, J.; Lei, X.; Zhang, J. An experimental and theoretical investigation on the brittle ductile transition and cutting force anisotropy in cutting KDP crystal. Int. J. Mach. Tools Manuf. 2016, 106, 98–108. [Google Scholar] [CrossRef]
- Borc, J.; Sangwal, K.; Pritula, I.; Dolzhenkova, E. Investigation of pop-in events and indentation size effect on the (001) and (100) faces of KDP crystals by nanoindentation deformation. Mater. Sci. Eng. A 2017, 708, 1–10. [Google Scholar] [CrossRef]
- Fang, F.Z.; Wu, H.; Zhou, W.; Hu, X.T. A study on mechanism of nano-cutting single crystal silicon. J. Mater. Process. Technol. 2007, 184, 407–410. [Google Scholar] [CrossRef]
- Lee, Y.J.; Chong, J.Y.; Chaudhari, A.; Wang, H. Enhancing ductile-mode cutting of calcium fluoride single crystals with solidified coating. Int. J. Precis. Eng. Manuf. Green Technol. 2019, 74, 50–55. [Google Scholar] [CrossRef]
- Yoon, H.S.; Kwon, S.B.; Nagaraj, A.; Min, S. Effect of the initial-flaw on crack propagation in two-step cutting of monocrystalline sapphire. Manuf. Process. 2020, 56, 1211. [Google Scholar] [CrossRef]
- Cheung, C.F.; Lee, W.B. A theoretical and experimental investigation of surface roughness formation in ultra-precision diamond turning. Int. J. Mach. Tools Manuf. 2000, 40, 979–1002. [Google Scholar] [CrossRef]
- Lee, W.B.; To, S.; Chan, C.Y. Deformation band formation in metal cutting. Scr. Mater. 1999, 40, 795–800. [Google Scholar] [CrossRef]
- Omar, O.E.E.K.; El-Wardany, T. An improved cutting force and surface topography prediction model in end milling. Int. J. Mach. Tools Manuf. 2007, 47, 1263–1275. [Google Scholar] [CrossRef]
- Dong, Z.; Zhang, S.; Xiong, Z.; Rao, X. A generalized dynamic model for spindle vibration influencing surface topography in different ultra-precision machining processes. Int. J. Adv. Manuf. Technol. 2018, 96, 2471–2478. [Google Scholar] [CrossRef]
- Huo, D.; Chen, W.; Teng, X. Modeling the Influence of Tool Deflection on Cutting Force and Surface Generation in Micro-Milling. Micromachines 2017, 8, 188. [Google Scholar] [CrossRef]
- Neto, H.K.; Diniz, A.E.; Pederiva, R. The influence of cutting forces on surface roughness in the milling of curved hardened steel surfaces. Int. J. Adv. Manuf. Technol. 2016, 84, 1209–1218. [Google Scholar]
- Zhou, L.; Cheng, K. Dynamic cutting process modelling and its impact on the generation of surface topography and texture in nano/micro cutting. Proc. Inst. Mech. Eng. 2009, 223, 247–266. [Google Scholar] [CrossRef]
- Lu, X.; Hu, X. Model for the prediction of 3D surface topography and surface roughness in micro-milling Inconel 718. Int. J. Adv. Manuf. Technol. 2018, 94, 2043–2056. [Google Scholar] [CrossRef]
- Chen, H.F.; Dai, Y.F.; Zheng, Z.W.; Gao, H.; Li, X.P. Effect of crystallographic orientation on cutting forces and surface finish in ductile cutting of KDP crystals. Mach. Sci. Technol. 2011, 15, 231–242. [Google Scholar] [CrossRef]
- Lai, X.; Li, H.; Li, C.; Lin, Z.; Ni, J. Modelling and analysis of micro scale milling considering size effect micro cutter edge radius and minimμm chip thickness. Int. J. Mach. Tools Manuf. 2008, 48, 1–14. [Google Scholar] [CrossRef]
- Giang, N.A.; Seupel, A. Dislocation pile-up and cleavage: Effects of strain gradient plasticity on micro-crack initiation in ferritic steel. Int. J. Fract. 2018, 214, 1–15. [Google Scholar] [CrossRef]
- Wang, M.; Wang, W.; Lu, Z. Critical cutting thickness in ultra-precision machining of single crystal silicon. Int. J. Adv. Manuf. Technol. 2013, 65, 843–851. [Google Scholar] [CrossRef]
- Gadelmawla, E.S.; Koura, M.M.; Maksoud, T.M.A.; Elewaa, I.M.; Soliman., H.H. Roughness parameters. J. Mater. Process. Technol. 2002, 123, 133–145. [Google Scholar] [CrossRef]
- Qu, J.; Shih, A.J. Analytical surface roughness parameters of a theoretical profile consisting of elliptical arcs. Mach. Sci. Technol. 2003, 7, 281–294. [Google Scholar] [CrossRef]
- Hocheng, H.; Hsieh, M.L. Signal analysis of surface roughness in diamond turning of lens molds. Int. J. Mach. Tools Manuf. 2004, 44, 1607–1618. [Google Scholar] [CrossRef]
- Bougharriou, A.; Bouzid, W.; Sai, K. Analytical modeling of surface profile in turning and burnishing. Int. J. Adv. Manuf. Technol. 2014, 75, 547–558. [Google Scholar] [CrossRef]
- Sung, A.N.; Ratnam, M.M.; Loh, W.P. Effect of wedge angle on surface roughness in finish turning: Analytical and experimental study. Int. J. Adv. Manuf. Technol. 2014, 74, 139–150. [Google Scholar] [CrossRef]
- Blackmore, D.; Zhou, G. A new fractal model for anisotropic surfaces. Int. J. Mach. Tools Manuf. 1998, 38, 551–557. [Google Scholar] [CrossRef]
- Luo, X.; Cheng, K. Nonlinear Effects in Precision Machining Engineering Materials. Proceedings of 18th American Society of Precision Engineering Annual Meeting. SPIE 2003, 489–493. [Google Scholar]
- Podsiadlo, P.; Stachowiak, G.W. Fractal-wavelet based classification of tribological surfaces. Wear 2003, 254, 1189–1198. [Google Scholar] [CrossRef]
- Li, H.; Qiu, L.; Zhang, S.; Tan, J.; Wang, Z.; Liu, X. A surface modeling method for product virtual assembly based on the root mean square of the regional residuals. Proc. Inst. Mech. Eng. Part B J. Eng. Manuf. 2020, 234, 229–242. [Google Scholar] [CrossRef]
- Liu, D.; Dunstan, D.J. Material length scale of strain gradient plasticity: A physical interpretation. Int. J. Plast. 2017, 98, 156–174. [Google Scholar] [CrossRef]
- Kocks, U.F. The relation between polycrystal deformation and single-crystal deformation. Met. Mater. Trans. 1970, 1, 1121–1143. [Google Scholar] [CrossRef]
- Wu, J.; Liu, Z. Modeling of flow stress in orthogonal micro-cutting process based on strain gradient plasticity theory. Int. J. Adv. Manuf. Technol. 2010, 46, 143–149. [Google Scholar] [CrossRef]
- Chen, N.; Chen, M.; Wu, C.; Pei, X.; Qian, J.; Reynaerts, D. Research in minimum undeformed chip thickness and size effect in micro end-milling of potassium dihydrogen phosphate crystal. Int. J. Mech. Sci. 2017, 134, 387–398. [Google Scholar] [CrossRef]
- Chen, H.-F.; Wang, J.-M.; Dai, Y.-F.; Zheng, Z.-W.; Peng, X.-Q. Research on critical cutting thickness of KDP crystals by spirally grooving. J. Synth. Cryst. 2011, 40, 22–26. [Google Scholar]
- Chen, M.J.; Pang, Q.L.; Wang, J.H.; Cheng, K. Analysis of 3D microtopography in machined KDP crystal surfaces based on fractal and wavelet methods. Int. J. Mach. Tools Manuf. 2008, 48, 905–913. [Google Scholar] [CrossRef]
- Rahman, M.A.; Rahman, M.; Kumar, A.S. Modelling of flow stress by correlating the material grain size and chip thickness in ultra-precision machining. Int. J. Mach. Tools Manuf. 2017, 123, 57–75. [Google Scholar] [CrossRef]


| S | S11 | S12 | S13 | S33 | S44 | S66 |
|---|---|---|---|---|---|---|
| value(1/100 GPa) | 1.51 | 0.18 | −0.40 | 1.95 | 7.81 | 16.2 |
| Machining Parameters | Values |
|---|---|
| Feed rate f (μm/s) | 150 |
| Cutting depth ap (nm) | 40 |
| Tool rake angle γ (°) | 10 |
| Tool clearance α (°) | 5 |
| Radius of tool nose arc r (μm) | 10 |
| Cutting width d (μm) | 215 |
| Modal Mass (kg) | Damping | Stiffness (N/m) | |
|---|---|---|---|
| X direction | 26.8 | 0.931 | 18.105 |
| Y direction | 27.3 | 0.381 | 23.538 |
| Machining Parameters | Values |
|---|---|
| Spindle speed w (rpm) | 1000 |
| Feed rate f (μm/s) | 150 |
| Cutting depth ap (nm) | 40 |
| Tool rake angle γ (°) | −10 |
| Tool clearance α (°) | 5 |
| Radius of flying cutter disk R (mm) | 315 |
| Radius of tool nose arc r (μm) | 10 |
| Workpiece width W (mm) | 410 |
| Relative vibration amplitude of tool and workpiece A (μm) | 0.05 |
| Crystal Orientation (°) | 0 | 15 | 30 | 45 | 60 | 75 | 90 | |
|---|---|---|---|---|---|---|---|---|
| Rt (nm) | Simulation | 17.85 | 16.92 | 15.93 | 15.35 | 16.78 | 18.25 | 17.66 |
| Experiment | 21.96 | 20.12 | 19.55 | 18.91 | 19.88 | 22.02 | 21.35 | |
| Prediction error E | 15.3% | 18.7% | 15.9% | 18.5% | 18.8% | 15.6% | 17.1% | |
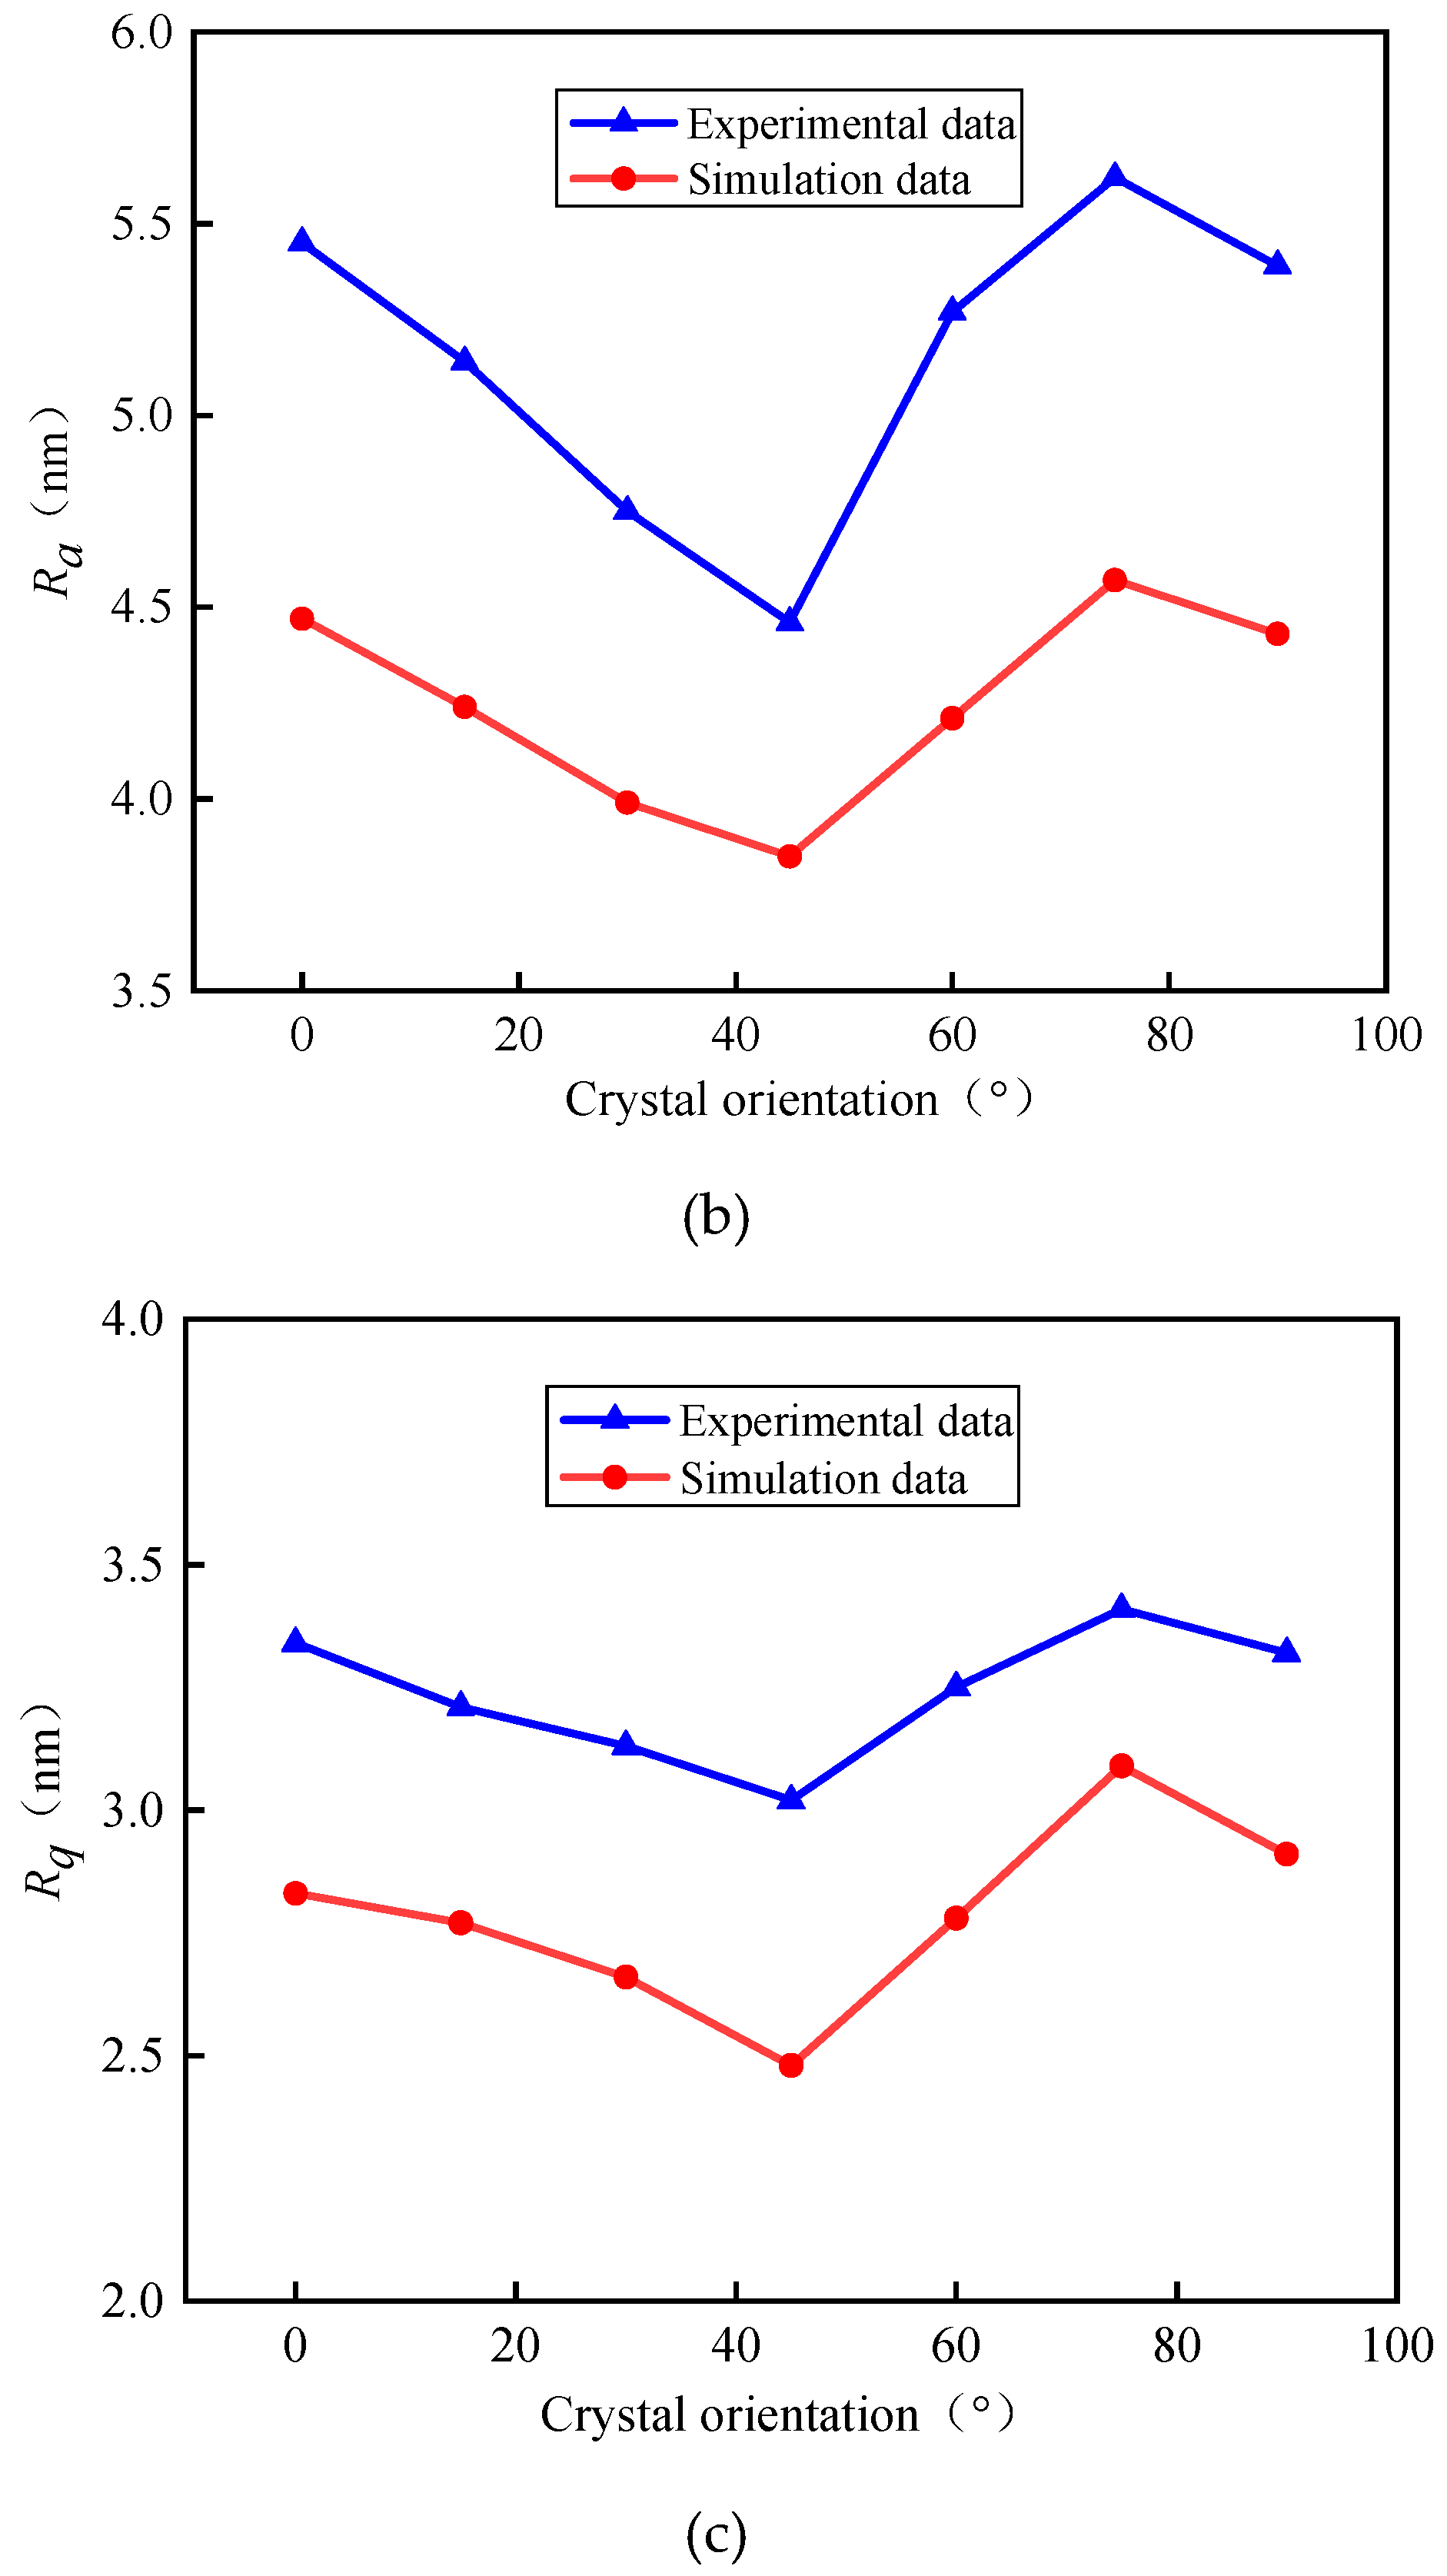
| Ra (nm) | Simulation | 4.47 | 4.24 | 3.99 | 3.85 | 4.21 | 4.57 | 4.43 |
| Experiment | 5.45 | 5.14 | 4.75 | 4.46 | 5.27 | 5.62 | 5.39 | |
| Prediction error E | 14.3% | 18.0% | 17.5% | 16.0% | 13.7% | 20.1% | 18.7% | |
| Rq (nm) | Simulation | 2.83 | 2.77 | 2.66 | 2.48 | 2.78 | 3.09 | 2.91 |
| Experiment | 3.34 | 3.21 | 3.13 | 3.02 | 3.25 | 3.41 | 3.32 | |
| Prediction error E | 14.3% | 15.3% | 13.7% | 15.0% | 17.9% | 14.5% | 9.4% | |
© 2020 by the authors. Licensee MDPI, Basel, Switzerland. This article is an open access article distributed under the terms and conditions of the Creative Commons Attribution (CC BY) license (http://creativecommons.org/licenses/by/4.0/).
Share and Cite
Chen, D.; Li, S.; Fan, J. Effect of KDP-Crystal Material Properties on Surface Morphology in Ultra-Precision Fly Cutting. Micromachines 2020, 11, 802. https://doi.org/10.3390/mi11090802
Chen D, Li S, Fan J. Effect of KDP-Crystal Material Properties on Surface Morphology in Ultra-Precision Fly Cutting. Micromachines. 2020; 11(9):802. https://doi.org/10.3390/mi11090802
Chicago/Turabian StyleChen, Dongju, Shupei Li, and Jinwei Fan. 2020. "Effect of KDP-Crystal Material Properties on Surface Morphology in Ultra-Precision Fly Cutting" Micromachines 11, no. 9: 802. https://doi.org/10.3390/mi11090802
APA StyleChen, D., Li, S., & Fan, J. (2020). Effect of KDP-Crystal Material Properties on Surface Morphology in Ultra-Precision Fly Cutting. Micromachines, 11(9), 802. https://doi.org/10.3390/mi11090802