Article

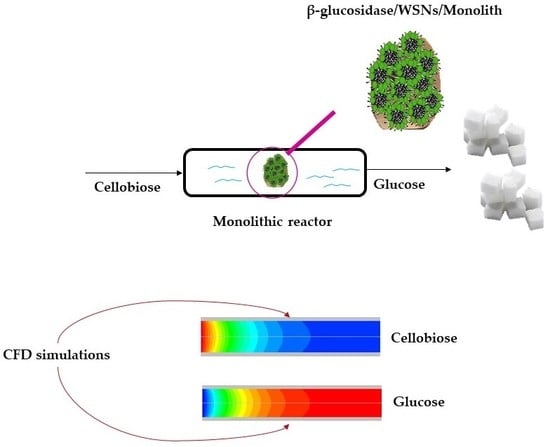
CFD Simulations of Microreactors for the Hydrolysis of Cellobiose to Glucose by β-Glucosidase Enzyme

1
Dipartimento di Ingegneria Chimica, dei Materiali e della Produzione Industriale, University of Naples Federico II, 80125 Naples, Italy
2
Istituto Motori-CNR, 80125 Naples, Italy
3
Instutute for Researches on Combustion-CNR, 80125 Naples, Italy
*
Authors to whom correspondence should be addressed.
Micromachines 2020, 11(9), 790; https://doi.org/10.3390/mi11090790
Submission received: 27 July 2020 / Revised: 19 August 2020 / Accepted: 19 August 2020 / Published: 21 August 2020
(This article belongs to the Special Issue Micro-Reaction Engineering)

Abstract

:
The enzymatic hydrolysis of lignocellulosic biomass-derived compounds represents a valid strategy to reduce the dependence on fossil fuels, with geopolitical and environmental benefits. In particular, β-glucosidase (BG) enzyme is the bottleneck in the degradation of cellulose because it catalyzes the hydrolysis of cellobiose, a known inhibitor of the other cellulolytic enzymes. However, free enzymes are unstable, expensive and difficult to recover. For this reason, the immobilization of BG on a suitable support is crucial to improve its catalytic performance. In this paper, computational fluid dynamics (CFD) simulations were performed to test the hydrolysis reaction in a monolith channel coated by BG adsorbed on a wrinkled silica nanoparticles (WSNs) washcoat. We initially defined the physical properties of the mixture, the parameters related to kinetics and mass transfers and the initial and boundary conditions thanks to our preliminary experimental tests. Numerical simulation results have shown great similarity with the experimental ones, demonstrating the validity of this model. Following this, it was possible to explore in real time the behavior of the system, varying other specified parameters (i.e., the mixture inlet velocity or the enzymatic load on the reactor surface) without carrying out other experimental analyses.

Graphical Abstract

1. Introduction

The exhaustion of fossil fuels and environmental pollution, particularly due to the global phenomena of atmospheric degradation (i.e., greenhouse effect, acid rains, ozone hole), led to a search for alternative, eco-sustainable and renewable energy sources such as biofuels. With respect to fossil fuels, they offer advantages in terms of global pollution and the greenhouse effect [1]. In this regard, lignocellulosic biomass has been considered a source of strategic fuel because it does not compete with food crops and it is abundant in vegetation. The main component of lignocellulosic biomass is cellulose, a polymer composed of glucose molecules which can be hydrolyzed into fermentable glucose [2].
The enzymatic hydrolysis of cellulose is carried out by the enzyme complex cellulase [3]. It is composed of endo-1,4-β-glucanases (EC 3.2.1.4), exo-1,4-β-glucanase (EC 3.2.1.91) and β-glucosidase (EC 3.2.1.21), which perform their function sequentially and synergistically [4]. Our attention has been focused on BG since it plays a crucial role in the enzymatic degradation of cellulose by hydrolyzing cellobiose to two glucose molecules. Indeed, cellobiose hydrolysis is the rate limiting factor for the whole process of the enzymatic degradation of cellulose because this species acts as an inhibitor of both endo- and exoglucanase activities [4,5].
However, free enzymes are unstable, expensive and difficult to recover, causing high costs and low production efficiency. Immobilization technology allows us to improve both the catalytic performance and thermal and operational stability of the enzyme, allowing multiple reuses of the enzyme, separation and continuous operation in industrial applications [6]. Among the techniques of enzyme immobilization, physical adsorption is the most straightforward and takes place in mild conditions so that the biocatalyst can retain its native structure and activity [7]. For this reason, we used physical immobilization to link the enzyme to an inorganic porous carrier [8].
Enzymatic hydrolysis processes are usually carried out by incubating the substrate of the reaction, cellobiose, with the free or immobilized enzyme in a batch reactor. However, a discontinuous reactor has several disadvantages related to the high consumption of the costly enzyme, idle periods in which the reactor is not operative and mass transfer limitations.
To overcome these issues, immobilized enzyme microreactors (IEMs) have proven to be a good alternative [9,10,11,12,13,14,15,16]. Microreactors allow the use of small amounts of reagents and reduce mass transfer limitations. In microfluidic reactors, reactions occur continuously and under conditions similar to those of macroscopic reactors, but they are characterized by surfaces and dimensions in terms of microns [17]. Their use is well suited to reactions that take place in a short time and which, in batch systems, are characterized by a certain inefficiency in mass and heat transfer. Additionally, the laminar flow rate occurring within the microchannels can avoid the foam formation and turbulence that often affect discontinuous reactors [10,17].
For these reasons, process intensification transforms conventional chemical processes into more economical, productive and green processes. The application of microreactors to enzyme catalyzed reactions has shown very good results in terms of reaction times and performance with respect to batch processes [11].
Recently, we realized the intensification and the engineering of the enzymatic hydrolysis process through the transition from a batch reactor to a plug-flow microreactor by the application of ceramic cordierite monoliths whose washcoat consisted of β-glucosidase immobilized into a mesoporous silica nanoparticle support [18].This inorganic matrix can be used for many applications such as drug delivery and fluorescence biological probes and can be an efficient support for enzyme adsorption [19,20,21,22]. Silica nanoparticles have high chemical, mechanical and thermal stability. In our previous works, we used Wrinkled silica nanoparticles (WSNs), whose peculiar morphology created a favorable microenvironment for catalysis [8,23,24,25]. We showed the great potential of the microreactor with respect to batch, leading to higher conversion in lower reaction times. The use of an enzyme-loaded honeycomb monolith within a microfluidic reactor can improve reaction efficiency and facilitate continuous operation, reuse and regeneration [16,17,18,19,20,21,22,23,24,25,26].
In order to properly design the microreactor and to optimize the performance, full investigations of the role of the operating conditions are required. In this context, mathematical modeling plays a crucial role in the development and design of chemical (micro) reactors.
To this end, computational fluid dynamics (CFD) models have been extensively used [27,28,29]. In this work, we developed a CFD model of the IEMs to simulate the effect of temperature reaction, mixture inlet velocity and enzymatic load on the WSNs washcoat on the reaction performance. The model results will also support the experimental activity to optimize the IEMs operation.

2. Model Description

In our CFD simulations, a two-dimensional axisymmetric model has been developed to simulate the behavior of the enzymatic reaction in a single channel of cordierite monolith [30].
In Figure 1, the channel of monolith (D = 1 mm, L = 10 mm) is shown.
It has been assumed that the enzyme was uniformly deposited onto the walls of the channel.
Since the Reynolds number is around 10−2, reactive flow in the channel is laminar, avoiding the foam formation and turbulence often affecting batch reactors.
The equations for conservation of total mass, momentum, energy and chemical species are solved in liquid phase and are coupled to the Stokes equations.
Continuity equation:
( ρ u ) z + 1 r   r ( ρ v ) r
Momentum equations:
( ρ u u ) z + 1 r   r ρ v u r =   p z + 1 r   r τ z r r + τ z z z
ρ u v z + 1 r   r ρ v v r =   p r + 1 r r τ r r r + τ z r z
In the above equations, ρ is the density of the mixture, v and u are the radial and axial component of the flow velocity of the fluid, respectively; r and z are the radial and axial coordinates in the system, respectively; τ is the stress tensor working on the liquid mixture, and p is the pressure of the fluid.
Catalytic experimental tests were run isothermally. However, the current reaction temperature can change due to the reaction, which is weakly exothermic. To preliminarily quantify the reaction thermicity, we calculated the adiabatic temperature increase (ΔTad) according Equation (4):
Δ T a d = C C · Δ H r c p · ρ
where CC is the cellobiose concentration in the starting solution ( mol / m 3 ), ΔHr is reaction heat ( kJ / mol ), cp is the specific heat of the reacting mixture ( kJ / ( kg K ) ), and ρ is the density of the reacting mixture ( kg m 3 ).
The reaction heat has been calculated as follows:
Δ H r = Σ ν i Δ H i
where νi is the stoichiometric coefficient (positive for the products and negative for the reagents) and ΔHi is the heat of formation ( kJ / mol ). The reaction is as follows:
C 12 H 22 O 11 + H 2 O 2 C 6 H 12 O 6
Table 1 shows the values of the parameters used to calculate the ΔTad.
The value of ΔTad is equal to 3.5 K. Therefore, we can consider the reactor isothermal.
Chemical species balance in the liquid phase:
ρ u y i z + 1 r r ρ v y i   r = z ( J z , i ) + 1 r r ( r J r , i ) + S r         i = 1 , , N s 1
where yi is the mass fraction, Jz,i and Jr,i are the axial and radial components of the diffusion velocity of the i-th liquid species, while r is the reaction rate, respectively. The latest species mass fraction is computed as one minus the sum of the other species mass fractions.
The boundary conditions are listed in the following.
At the inlet, we assumed the Dirichlet type boundary conditions.
@   z   =   0       and       0   <   r   <   D 2 :               u   =   u i n ,       v   =   0 ,     y i   =   y i , i n @   z   =   L       and       0   <   r   <   D 2 :
µ ( u r + v z ) = 0
2   µ u z   =   p     p atm
y i z
where µ is the dynamic viscosity of the mixture.
@   0 < z   <   L   and   r   =   0 :         u r   =   v   =   y i r   =   0 ;
@   0 < z   <   L   and   r   =   D 2 :       u   =   v   =   0 ,   Surface   Area   Washcoat   Factor ;
The surface area washcoat factor (SF) refers to the catalyst/support mass ratio, according to the following equation:
S F =     m adsorbed   enzyme m support
where madsorbed enzyme is the amount of immobilized enzyme on the wall surface of the monolith, while msupport is the amount of WSNs deposited on a single monolith. This parameter was assessed through our previous experimental analysis [18].
The enzymatic kinetics followed a Michaelis−Menten behavior. The simulations were carried out by choosing a very low inlet cellobiose concentration. Since the experimental conditions have proven that cellobiose concentrations higher than 0.01 kmol/m3 can inhibit β-glucosidase, reactants and products, in this case, it is possible to consider a first order reaction. The value of the kinetic constants was derived by fitting our experimental data [18].
In particular,
K0 = 2.0 × 10⁹ 1 s
Ea = 6.65 × 10⁷ J/kmol
The stoichiometric coefficient and the rate exponent are given in Table 2.
The mixture molecular viscosity is considered equal to that of water (5.5 × 10⁻⁴ kg / ( m s ) ) since the solution is very diluted, while species diffusivity in aqueous media was 5 × 10⁻⁶ m 2 / s .
The model equations are discretized using a finite volume formulation on a structured mesh built by means of the Design Modeler and Meshing packages by Ansys (Release 19.0).
Mesh parameters are reported in Table 3.
The spatial discretization of the model equations uses second order schemes for all terms, except for the momentum term that is treated with a first order central difference scheme.
Computations were performed by means of the segregated solver of the Fluent ANSYS code, adopting the SIMPLE method for treating the pressure-velocity coupling.
Inlet temperature, velocities and liquid compositions are specified as the feed conditions.
Table 4 summarizes the inlet parameter values.
Some CFD simulations were carried out on the basis of the following experimental data in order to obtain the validation with the experimental results [18]:
T = 50 °C, 60 °C or 70 °C
SF = 0.15
Molar concentration of cellobiose = 8.4 × 10⁻⁵
K0 = 2.0 × 10⁹ 1 s
Ea = 6.65 × 10⁷ J/kmol
Inlet mixture velocity: 1.3 × 10⁻⁵ m/s
In our experiments [18], the flow rate entering the reactor flows through a 1-inch tube, resulting in a flat velocity profile at the inlet of the monolithic reactor. Our experimental inlet liquid velocity (1.3 × 10⁻⁵ m s ) was evaluated by dividing the flow rate at the inlet of the monolith by the cross-section of the same, while the cellobiose molar fraction was estimated while taking into account that its inlet concentration was 0.00467 kmol/m3 [5,8,18,23].

3. Results and Discussion

3.1. Effect of Temperature

In the following paragraph, the base case (T = 50 °C) is first discussed. The conversion of cellobiose to glucose was determined according to the following relation:
x = C c i n C c o u t C c i n 100
where ccin and ccout are the inlet and the outlet cellobiose concentration, respectively.
Figure 2 shows the contours of the molar concentration of cellobiose (A) and of the molar concentration of glucose (B) in the cordierite channel.
From Figure 1, it turns out that concentration variations are significant in the axial direction rather than in the radial direction, suggesting a plug flow reactor (PFR) like behavior.
Graph of Figure 3 shows the molar concentration of cellobiose (kmol/m3) along the axial coordinate z.
Figure 4 shows the trend of the axial velocity in the cordierite channel. The flow is laminar and the parabolic profile is found: the mixture velocity is maximum along the channel axis and decreases approaching the wall since the fluid adheres to the walls (no slip condition).
Simulations were run at varying temperatures up to 70 °C. Figure 5 shows the cellobiose conversion x as a function of temperature.
The continuous lines originate from a nonlinear fit of the numerical results, reported by the dots.
A Langmuir function has been used to fit cellobiose conversion vs. temperature. On increasing the temperature up to 70 °C, the cellobiose conversion increases from around 94% up to around 100%. The system is under kinetic control and cellobiose conversion increases by increasing the temperature. In favor of this, our experimental tests highlighted that the enzyme retained its native structure until 70 °C thanks to the immobilization process [18,23,31]. However, further increase of temperature caused the denaturation of the enzyme, leading to the fast deactivation of the catalyst.

3.2. Effect of Enzyme Immobilization Yield

In our experimental tests [5,8,18], the adsorption of the enzyme on the structured substrates was carried out in a buffer solution at pH 5 containing 0.03 mM of BG and 2 mg/mL of WSNs. The mixture was kept under gentle stirring overnight at room temperature. Then, the biocatalyst obtained was suspended in a new buffer solution at pH 5 for 10 min to remove the non-adsorbed enzyme. The amount of immobilized enzyme was equal to 6 mg for 40 mg of support.
Numerical simulations were performed at various catalyst loadings on each channel of the microreactor, taking as reference the SF corresponding to the experimental tests (SF = 0.15).
In Figure 6, the molar concentration of cellobiose is shown, as obtained at different values of SF.
A smaller amount of adsorbed enzyme (Figure 6C,D) results in lower outlet conversion.
It was found that, on decreasing SF, the cellobiose conversion significantly decreases. In particular, conversion goes from 99.6 % at SF = 0.5 (case A) to 75.7% when lowering SF to 0.0375 (case D).
Figure 7 shows the cellobiose conversion x over the SF factor.
The continuous lines originate from the nonlinear fit of the numerical results, reported by the dots.
A Michaelis–Menten curve has been considered the most appropriate to describe both cellobiose conversion and SF. When the SF factor is 0.075, the conversion reaches a plateau, corresponding to the complete conversion of cellobiose. Therefore, an increase in the amount of the adsorbed biocatalyst is useless to improve the final glucose concentration and would only cause extra costs. Consequently, we proved that a very low amount of immobilized enzyme can maximize the glucose production.

3.3. Effect of Mixture Inlet Velocity

In batch reactors, the mass transport of the substrate from the bulk of the reaction medium to the active site of the enzyme significantly affects the reaction and, therefore, cellobiose conversion. To prove that, in a continuous reactor, mass transfer is not limiting, we performed simulations by changing the inlet liquid velocity.
In Figure 8, the molar concentration of cellobiose obtained at four values of the inlet liquid velocity is shown.
Cellobiose conversion decreases on increasing uin. As a consequence, the reaction rate is controlled by intrinsic kinetics and it is mainly affected by the residence time.
This result was highlighted as evaluating the cellobiose conversion for different values of Damköler number (Da) [28], which is defined as follows:
D a = flow   time   scale chemical   time   scale
For a first order reaction, Da follows this relation:
D a = k τ
where k is the Arrhenius constant and τ is the residence time of the liquid mixture in the channel of the microreactor. In particular, τ is expressed as follows:
τ = V Q
where V is the volume of a single channel (m3), while Q is the volumetric flow rate (m3/s) at the inlet of the channel.
Since both the section and the length of microchannel were fixed, we expressed the variation of cellobiose conversion with uin by plotting x vs. Da, as shown in Figure 9.
The continuous lines originate from a nonlinear fit of the numerical results, reported by the dots.
A Michaelis–Menten curve was considered the most appropriate to describe cellobiose conversion vs. Da. We can observe that, for values of Da higher than 0.27, x approaches the asymptotic value of around 94%; on the other hand, lowering Da below 0.27, cellobiose conversion decreases dramatically. This happens because higher values of Da number correspond to lower values of uin and, therefore, higher values of τ, favoring complete conversion.

4. Conclusions

Enzymatic hydrolysis of cellobiose to glucose in a microchannel reactor was investigated through CFD simulations. In order to evaluate the performance of this system, the effects of three different variables of interest were investigated:
  • The temperature of the reaction;
  • The catalyst loading by evaluating the SF factor;
  • The mixture inlet velocity.
The results prove that the reaction is under kinetic control and that maximum conversion is reached at 70 °C. Moreover, this evidence was confirmed by our preliminary experimental tests since immobilized BG retains its maximum activity at temperatures up to 70 °C.
Numerical simulations were performed at various catalyst loadings SF on the inner surface of the microreactor. The results showed that a higher amount of adsorbed enzyme led to higher outlet conversion. In particular, the conversion goes from 75.7% at SF = 0.0375 to 99.6% at SF = 0.5.
Cellobiose conversion increases if the mixture inlet velocity decreases. As a consequence, the reaction rate is controlled by intrinsic kinetics and it is mainly affected by the residence time rather than by diffusional limitations.
These aspects were evaluated by taking into account the Da number: when the adimensional number is greater than 0.27, complete cellobiose conversion is accomplished.
Finally, result simulations showed great affinity with experimental ones, demonstrating the validity of this model. Other simulations were carried out to estimate cellobiose conversion under different inlet conditions (i.e., mixture inlet velocity variation), without carrying out further experimental analyses.

Author Contributions

Conceptualization, A.D.B., V.V., G.L., A.C.; software, A.D.B. and V.V.; validation, V.C., G.P., A.C., G.L.; investigation, V.V., V.C., A.D.B., A.C., G.L., data curation, A.D.B., V.V., A.C., writing—original draft preparation, A.D.B., V.V.; writing—review and editing, G.L., V.V., V.C., G.P., A.D.B., A.C.; supervision A.D.B., A.C., G.L.; project administration, A.D.B. All authors have read and agreed to the published version of the manuscript.

Funding

This research received no external funding.

Conflicts of Interest

The authors declare no conflict of interest.

References

  1. Chen, L.; Gao, K.; Zhang, C.; Lang, W. Alternative Fuels for IC Engines and Jet Engines and Comparison of Their Gaseous and Particulate Matter Emissions; Woodhead Publishing: Sarston, UK, 2019; ISBN 9780081027912. [Google Scholar]
  2. Cherubini, F. The biorefinery concept: Using biomass instead of oil for producing energy and chemicals. Energy Convers. Manag. 2010, 51, 1412–1421. [Google Scholar] [CrossRef]
  3. Taherzadeh, M.J.; Karimi, K. Enzyme-based hydrolysis processes for ethanol from lignocellulosic materials: A review. BioResources 2007, 2, 707–738. [Google Scholar]
  4. Woodward, J. Immobilized cellulases for cellulose utilization. J. Biotechnol. 1989, 11, 299–311. [Google Scholar] [CrossRef]
  5. Venezia, V.; Sannino, F.; Costantini, A.; Silvestri, B.; Cimino, S.; Califano, V. Mesoporous silica nanoparticles for β-glucosidase immobilization by templating with a green material: Tannic acid. Microporous Mesoporous Mater. 2020, 302. [Google Scholar] [CrossRef]
  6. Di Cosimo, R.; Mc Auliffe, J.; Poulose, A.J.; Bohlmann, G. Industrial use of immobilized enzymes. Chem. Soc. Rev. 2013, 42, 6437–6474. [Google Scholar] [CrossRef]
  7. Jesionowski, T.; Zdarta, J.; Krajewska, B. Enzyme immobilization by adsorption: A review. Adsorption 2014, 20, 801–821. [Google Scholar] [CrossRef] [Green Version]
  8. Califano, V.; Sannino, F.; Costantini, A.; Avossa, J.; Cimino, S.; Aronne, A. Wrinkled Silica Nanoparticles: Efficient Matrix for β-Glucosidase Immobilization. J. Phys. Chem. C 2018, 122, 8373–8379. [Google Scholar] [CrossRef]
  9. Miyazaki, M.; Honda, T.; Yamaguchi, H.; Briones, M.P.P.; Maeda, H. Enzymatic processing in microfluidic reactors. Biotechnol. Genet. Eng. Rev. 2008, 25, 405–428. [Google Scholar] [CrossRef]
  10. Seo, T.Y.; Eum, K.W.; Han, S.O.; Kim, S.W.; Kim, J.H.; Song, K.H.; Choe, J. Immobilized cell microchannel bioreactor for evaluating fermentation characteristics of mixed substrate consumption and product formation. Process Biochem. 2012, 47, 1011–1015. [Google Scholar] [CrossRef]
  11. Thomsen, M.S.; Nidetzky, B. Coated-wall microreactor for continuous biocatalytic transformations using immobilized enzymes. Biotechnol. J. 2009, 4, 98–107. [Google Scholar] [CrossRef]
  12. Barsan, M.M.; David, M.; Florescu, M.; Ţugulea, L.; Brett, C.M.A. A new self-assembled layer-by-layer glucose biosensor based on chitosan biopolymer entrapped enzyme with nitrogen doped graphene. Bioelectrochemistry 2014, 99, 46–52. [Google Scholar] [CrossRef]
  13. Kecskemeti, A.; Gaspar, A. Preparation and characterization of a packed bead immobilized trypsin reactor integrated into a PDMS microfluidic chip for rapid protein digestion. Talanta 2017, 166, 275–283. [Google Scholar] [CrossRef] [Green Version]
  14. Barbato, P.S.; Di Benedetto, A.; Landi, G.; Lisi, L. Structuring CuO/CeO2 Catalyst as Option to Improve Performance Towards CO-PROX. Top. Catal. 2016, 59, 1371–1382. [Google Scholar] [CrossRef]
  15. Křenková, J.; Foret, F. Immobilized microfluidic enzymatic reactors. Electrophoresis 2004, 25, 3550–3563. [Google Scholar] [CrossRef]
  16. Wei, C.; Zhou, Y.; Zhuang, W.; Li, G.; Jiang, M.; Zhang, H. Improving the performance of immobilized β-glucosidase using a microreactor. J. Biosci. Bioeng. 2018, 125, 377–384. [Google Scholar] [CrossRef]
  17. Lévesque, F.; Seeberger, P.H. Continuous-flow synthesis of the anti-malaria drug artemisinin. Angew. Chem. Int. Ed. 2012, 51, 1706–1709. [Google Scholar] [CrossRef]
  18. Venezia, V.; Costantini, A.; Landi, G.; Di Benedetto, A.; Sannino, F.; Califano, V. Immobilization of β-glucosidase over structured cordierite monoliths washcoated with wrinkled silica nanoparticles. Catalysts 2020, 10, 889. [Google Scholar]
  19. Branda, F.; Silvestri, B.; Costantini, A.; Luciani, G. Effect of exposure to growth media on size and surface charge of silica based Stöber nanoparticles: A DLS and ζ-potential study. J. Sol Gel Sci. Technol. 2014, 73, 54–61. [Google Scholar] [CrossRef]
  20. Díaz, J.F.; Balkus, K.J., Jr. Enzyme immobilization in MCM-41 molecular sieve. J. Mol. Catal. B Enzym. 1996, 2, 115–126. [Google Scholar] [CrossRef]
  21. Hartono, S.B.; Qiao, S.Z.; Liu, J.; Jack, K.; Ladewig, B.P.; Hao, Z.; Lu, G.Q.M. Functionalized mesoporous silica with very large pores for cellulase immobilization. J. Phys. Chem. C 2010, 114, 8353–8362. [Google Scholar] [CrossRef]
  22. Silvestri, B.; Vitiello, G.; Luciani, G.; Calcagno, V.; Costantini, A.; Gallo, M.; Parisi, S.; Paladino, S.; Iacomino, M.; D’Errico, G.; et al. Probing the Eumelanin-Silica Interface in Chemically Engineered Bulk Hybrid Nanoparticles for Targeted Subcellular Antioxidant Protection. ACS Appl. Mater. Interfaces 2017, 9, 37615–37622. [Google Scholar] [CrossRef]
  23. Califano, V.; Costantini, A.; Silvestri, B.; Venezia, V.; Cimino, S.; Sannino, F. The effect of pore morphology on the catalytic performance of β-glucosidase immobilized into mesoporous silica. Pure Appl. Chem. 2019. [Google Scholar] [CrossRef]
  24. Sannino, F.; Costantini, A.; Ruffo, F.; Aronne, A.; Venezia, V.; Califano, V. Covalent immobilization of β-glucosidase into mesoporous silica nanoparticles from anhydrous acetone enhances its catalytic performance. Nanomaterials 2020, 10, 108. [Google Scholar] [CrossRef] [Green Version]
  25. Moon, D.-S.; Lee, J.-K. Tunable synthesis of hierarchical mesoporous silica nanoparticles with radial wrinkle structure. Langmuir 2012, 28, 12341–12347. [Google Scholar] [CrossRef]
  26. Tang, L.; Zhao, Z.; Li, K.; Yu, X.; Wei, Y.; Liu, J.; Peng, Y.; Li, Y.; Chen, Y. Highly Active Monolith Catalysts of LaKCoO3 Perovskite-type Complex Oxide on Alumina-washcoated Diesel Particulate Filter and the Catalytic Performances for the Combustion of Soot. Catal. Today 2020, 339, 159–173. [Google Scholar] [CrossRef]
  27. An, H.; Li, A.; Sasmito, A.P.; Kurnia, J.C.; Jangam, S.V.; Mujumdar, A.S. Computational fluid dynamics (CFD) analysis of micro-reactor performance: Effect of various configurations. Chem. Eng. Sci. 2012, 75, 85–95. [Google Scholar] [CrossRef]
  28. Chen, J.; Gao, X.; Yan, L.; Xu, D. Computational fluid dynamics modeling of the millisecond methane steam reforming in microchannel reactors for hydrogen production. Rsc. Adv. 2018, 8, 25183–25200. [Google Scholar] [CrossRef] [Green Version]
  29. Zhai, X.; Ding, S.; Chang, Y.; Jin, Y.; Cheng, Y. CFD simulation with detailed chemistry of steam reforming of methane for hydrogen production in an integrated micro-reactor. Int. J. Hydrog. Energy 2010, 35, 5383–5392. [Google Scholar] [CrossRef]
  30. Gómez, L.E.; Sollier, B.M.; Lacoste, A.M.; Miró, E.E.; Boix, A.V. Hydrogen purification for fuel cells through CO preferential oxidation using PtCu/Al2O3 structured catalysts. J. Environ. Chem. Eng. 2019, 7. [Google Scholar] [CrossRef]
  31. Alftrén, J.; Hobley, T.J. Covalent immobilization of β-Glucosidase on Magnetic particles for Lignocellulose Hydrolysis. Appl. Biochem. Biotechnol. 2013, 169, 2076–2087. [Google Scholar] [CrossRef]
Figure 1. Scheme of a cordierite channel.
Micromachines 11 00790 g001
Figure 2. Contours of molar concentration of cellobiose (A) and molar concentration of glucose (B).
Micromachines 11 00790 g002
Figure 3. Molar concentration of cellobiose (kmol/m3) along the axial coordinate z.
Micromachines 11 00790 g003
Figure 4. Trend of the axial velocity.
Micromachines 11 00790 g004
Figure 5. Cellobiose conversion x (%) vs. temperature, K.
Micromachines 11 00790 g005
Figure 6. Molar concentration of cellobiose by varying the adsorbed enzyme mass: (A) SF = 0.5; (B) SF = 0.15; (C) SF = 0.075; (D) SF = 0.0375.
Micromachines 11 00790 g006
Figure 7. Cellobiose conversion x (%) over SF.
Micromachines 11 00790 g007
Figure 8. Molar concentration of cellobiose by varying mixture inlet velocity. (A) uin = 0.1297 m s , (B) uin = 1.297 × 10⁻² m s , (C) uin = 1.297 × 10⁻³ m s , (D) uin = 1.297 × 10⁻⁵ m s .
Micromachines 11 00790 g008
Figure 9. Cellobiose conversion x (%) vs. Da.
Micromachines 11 00790 g009
Table 1. Parameters used to calculate the ΔTad.
ΔHi, kJ/molνic, mol/m3cp, (kJ/(kg*K)ρ, kg/m3
Cellobiose−5401.50−14.67
Water−285.85−1
Glucose−1273.302
Mixture 4.1861000
Table 2. Stoichiometric coefficient and rate exponent.
SpeciesStoichiometric CoefficientsRate Exponent
Cellobiose11
H2O10
Glucose20
Table 3. Mesh parameters.
Mesh ParametersNumber
Cells12,006
Faces30,029
Nodes12,692
Partitions1
Table 4. Inlet parameter values.
ParameterValue
Mixture inlet temperature, Tin (K)323–343
Mixture inlet velocity, uin (m s−1)0.13; 0.013; 1.3 × 10⁻³; 1.3 × 10⁻⁵
Inlet C12H22O11 molar fraction8.4 × 10−5
Surface area washcoat factor0.0375–0.075–0.15–0.5

