Study of Ultrasonic Near-Field Region in Ultrasonic Liquid-Level Monitoring System


Abstract
1. Introduction
2. Theory and Methods
2.1. Principle of Ultrasonic Impedance Method
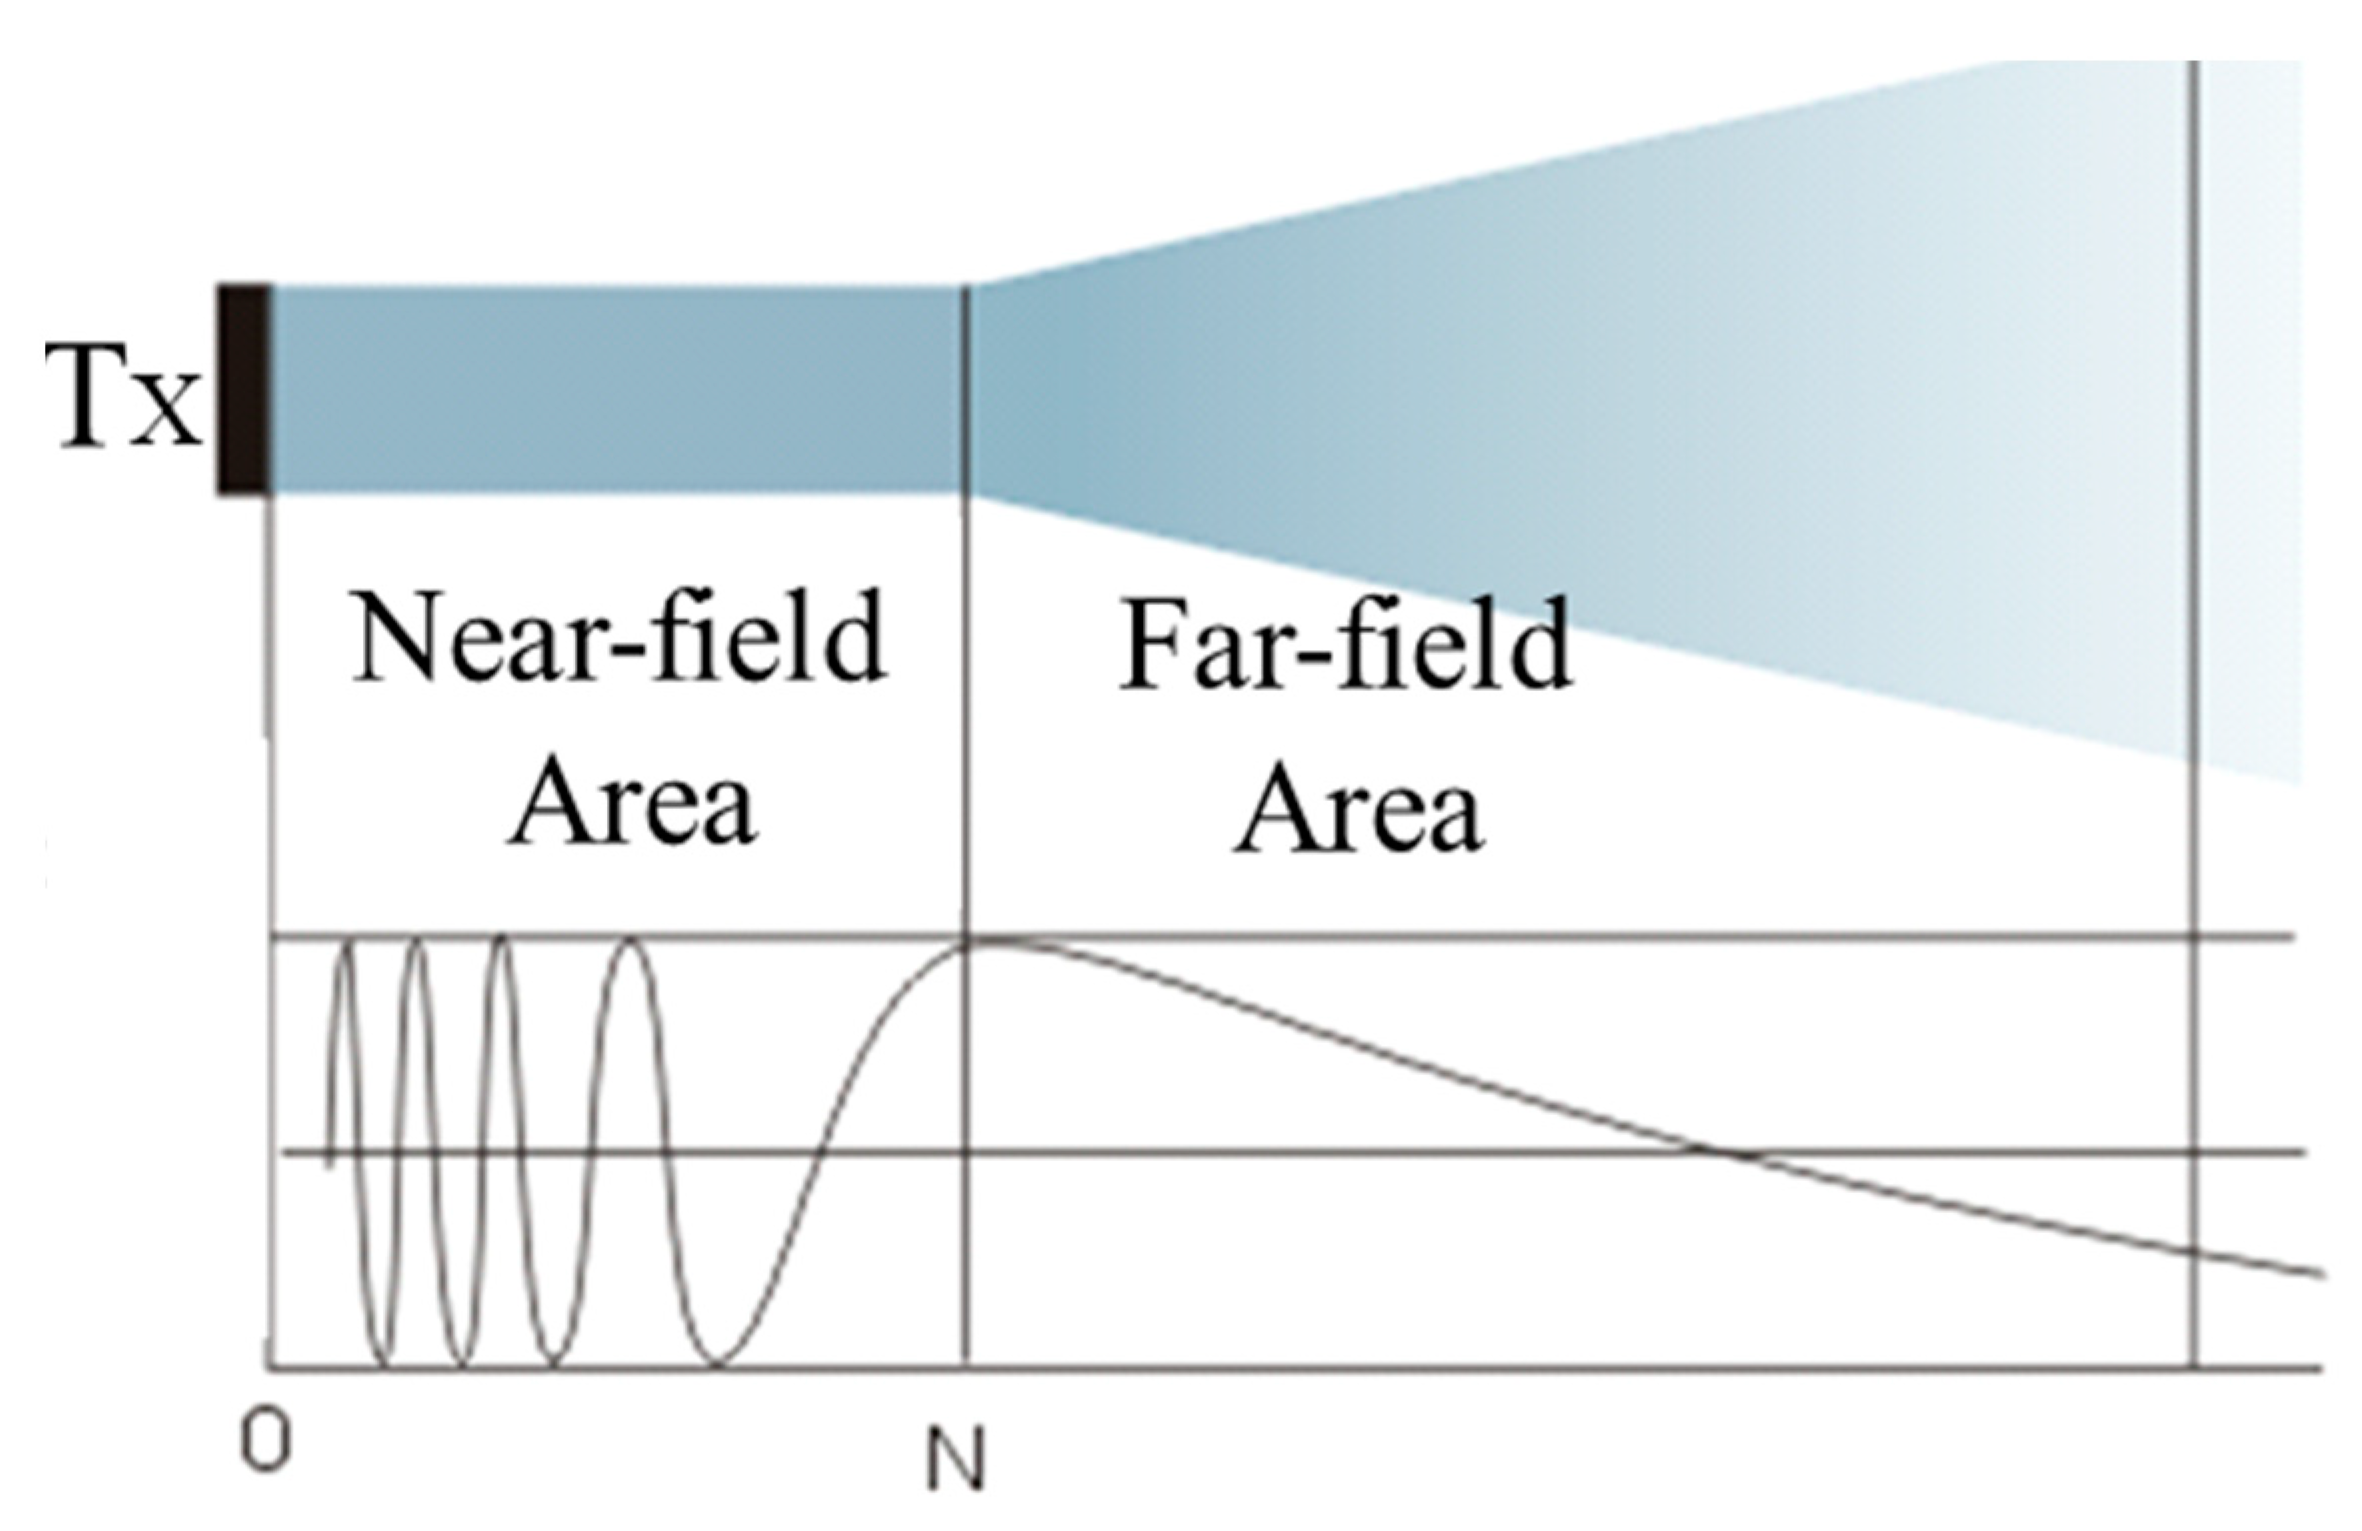
2.2. Ultrasonic Near-Field and Far-Field Areas
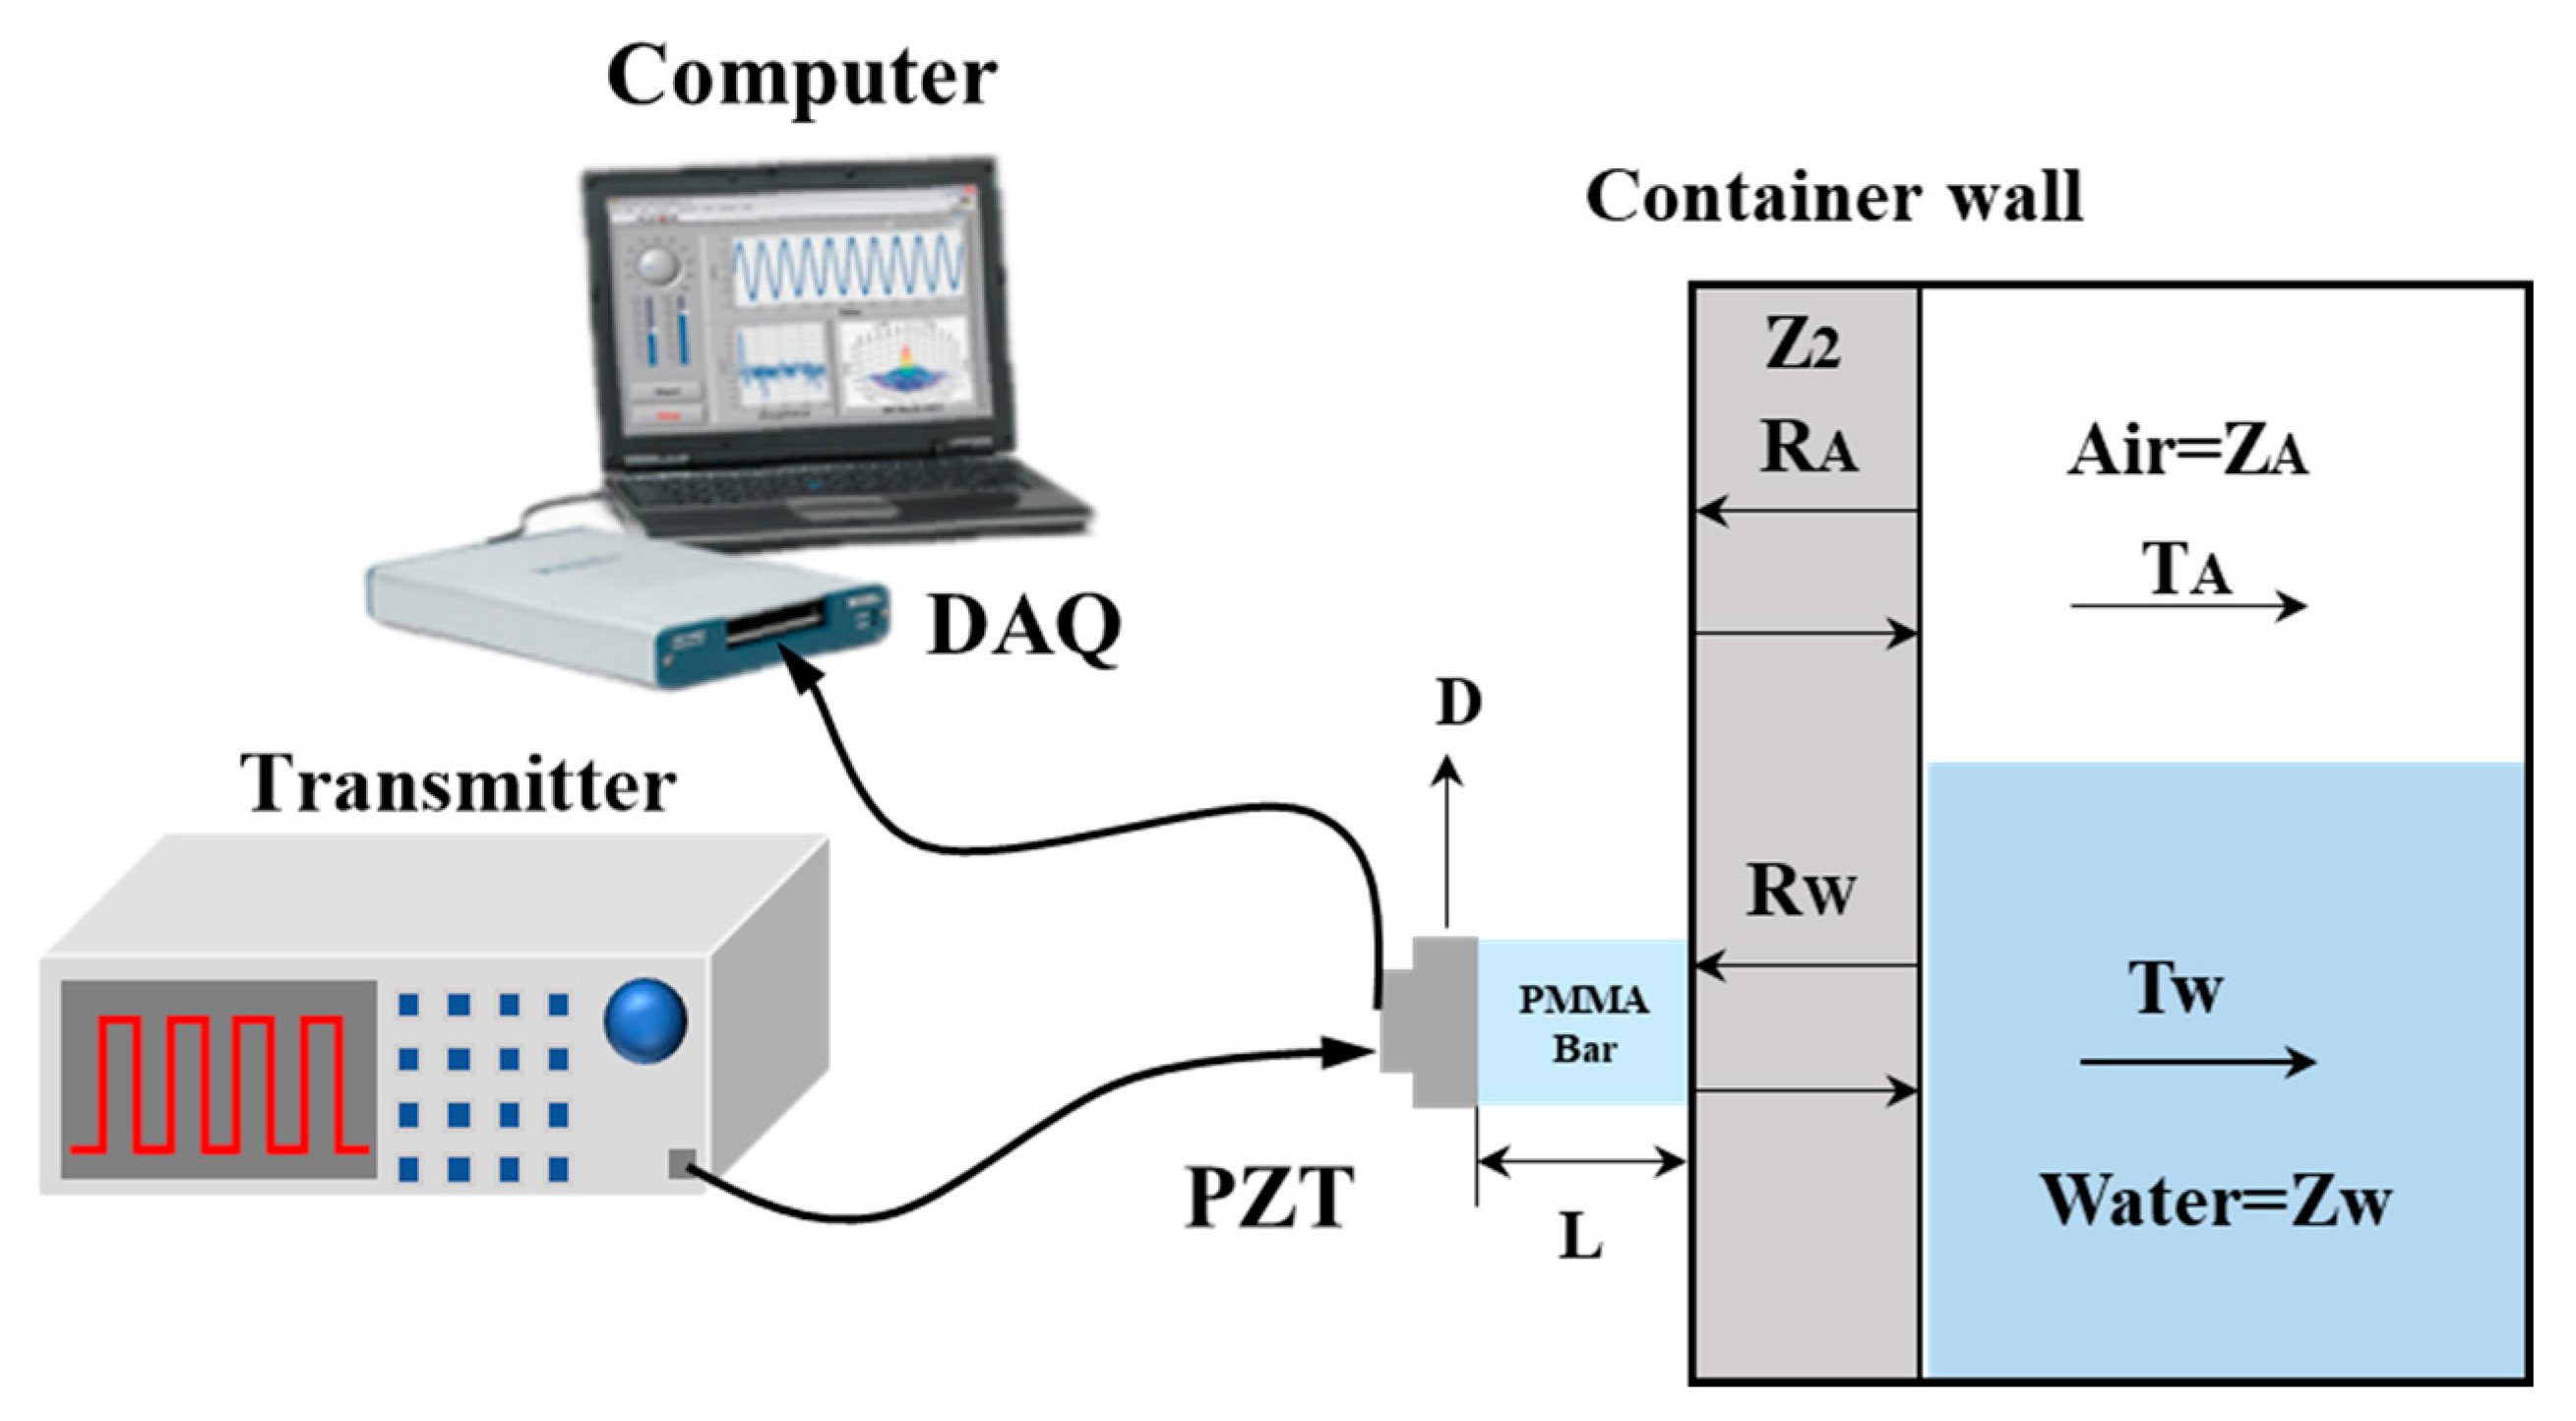
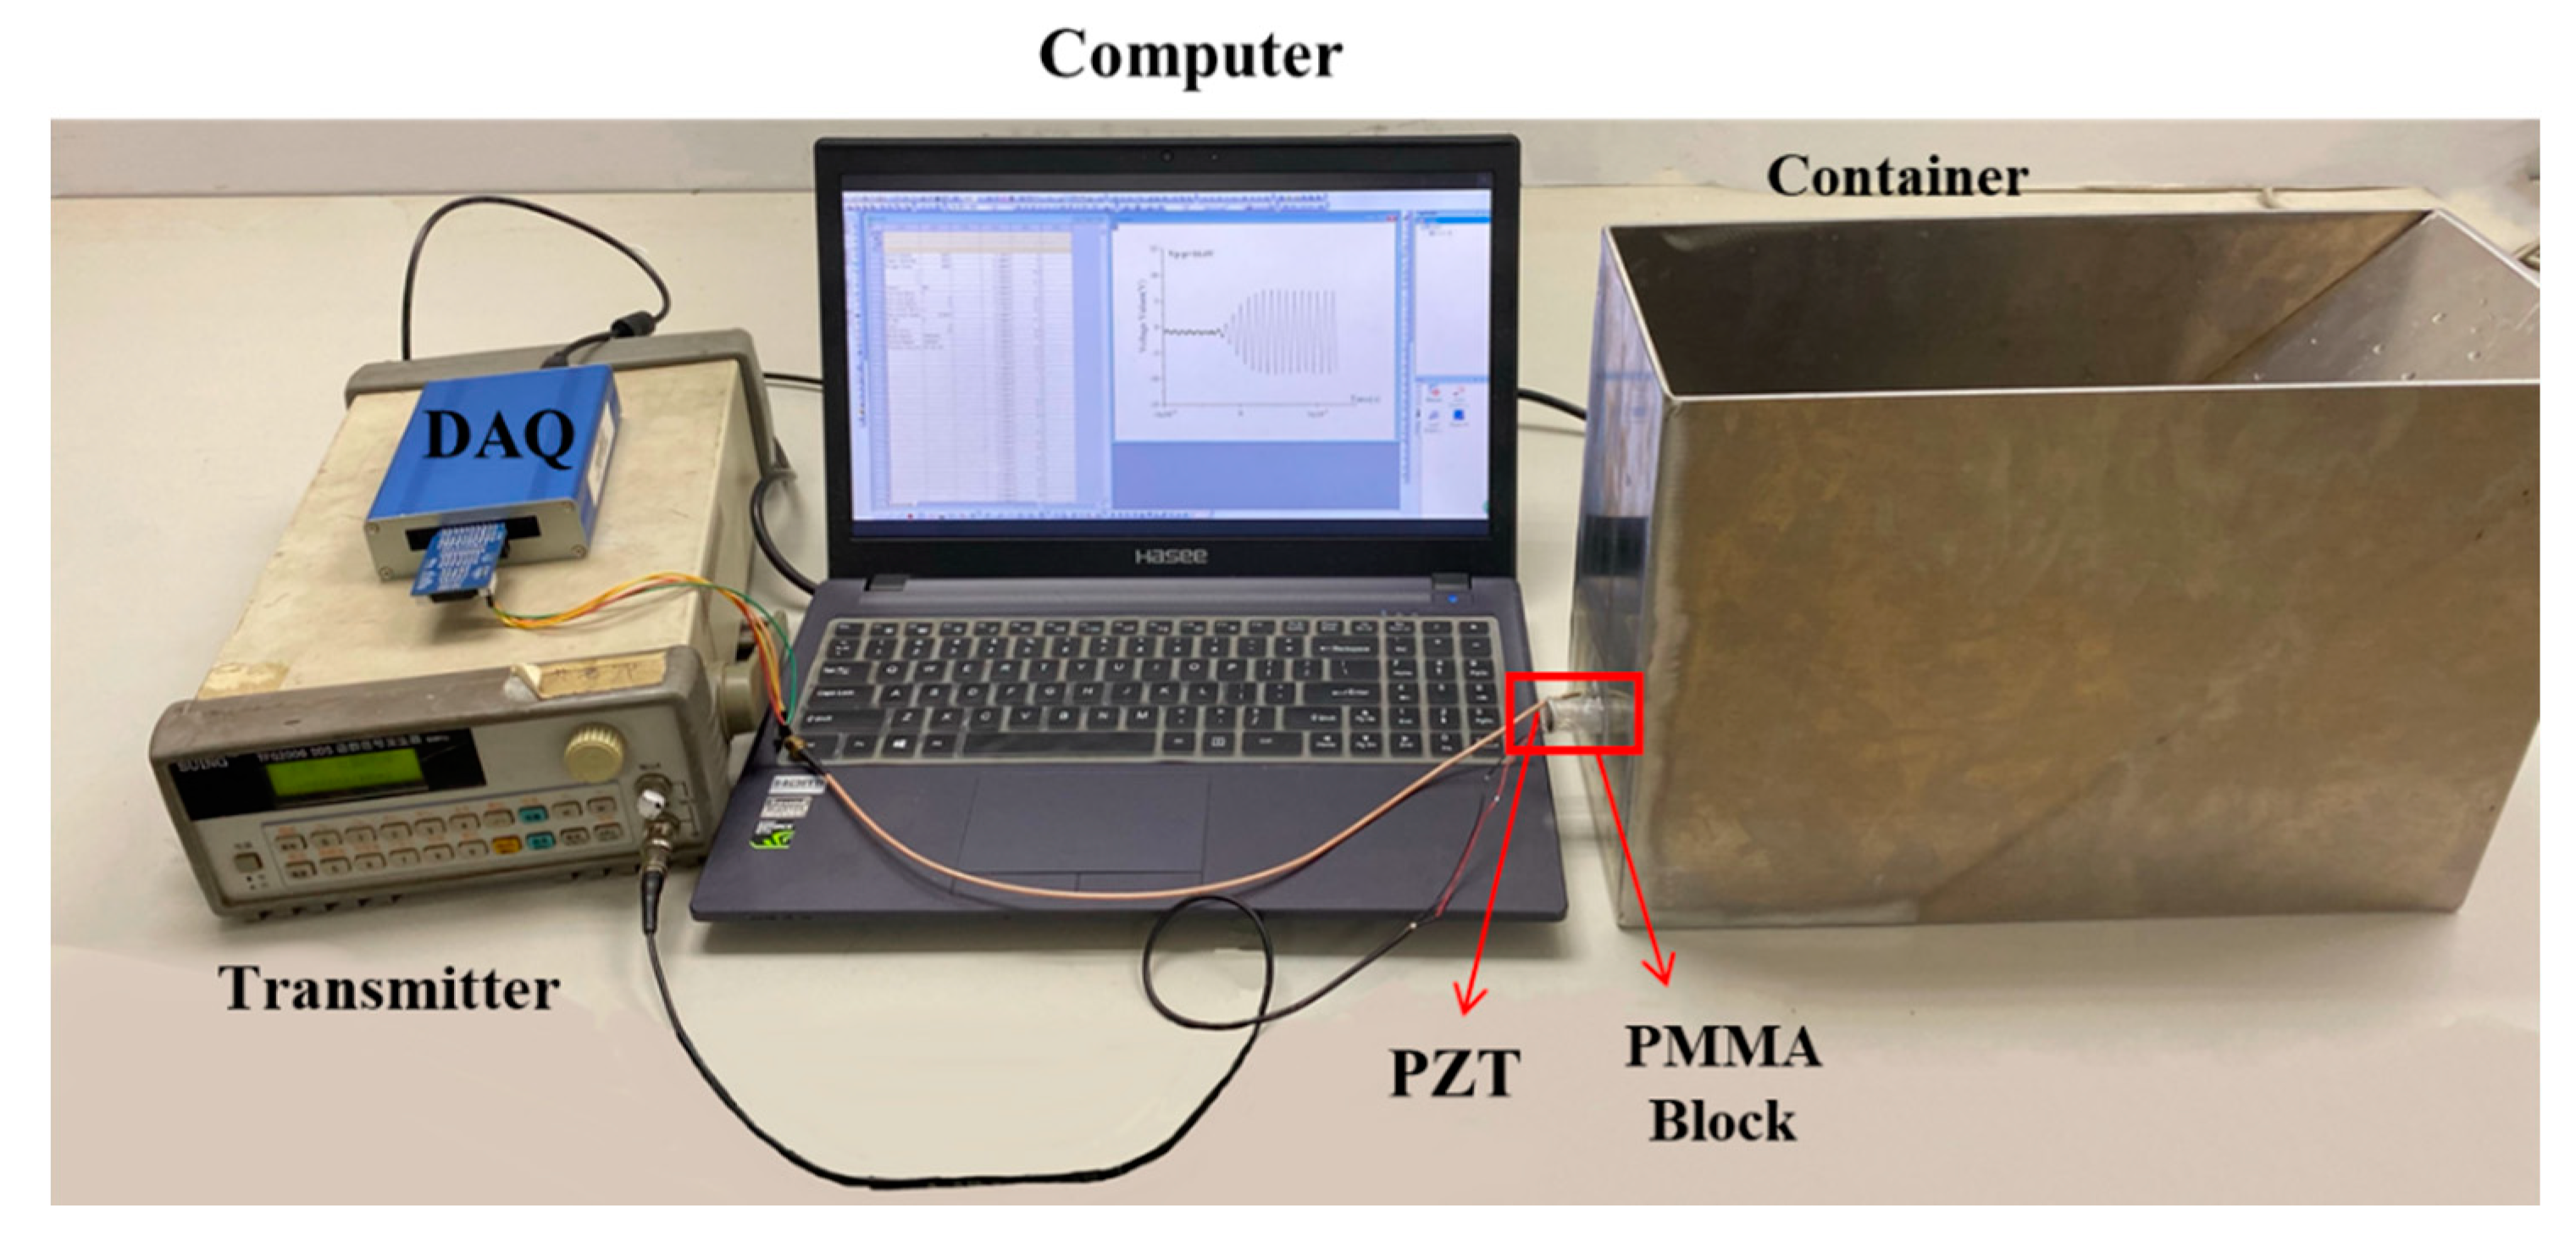
2.3. Establishment of Experimental Platform
3. Results and Discussion
3.1. Optimum Length Selection
3.2. Minimum Length Selection
4. Conclusions
Author Contributions
Funding
Conflicts of Interest
References
- Sakharov, V.; Kuznetsov, S.; Zaitsev, B.; Kuznetsova, I.; Joshi, S. Liquid level sensor using ultrasonic Lamb waves. Ultrasonics 2003, 41, 319–322. [Google Scholar] [CrossRef]
- Vargas, E.A.; Ceres, R.; Marti’n, J.M.; Caldero’n, L. Ultrasonic sensor for liquid-level inspection in bottles. Sens. Actuators A Phys. 1997, 61, 256–259. [Google Scholar] [CrossRef]
- Zakaria, Z.; Idroas, M.; Samsuri, A.; Adam, A.A. Ultrasonic instrumentation system for Liquefied Petroleum Gas level monitoring. J. Nat. Gas Sci. Eng. 2017, 45, 428–435. [Google Scholar] [CrossRef]
- Yin, L.; Qin, Y.; Liu, X.-W. A new interface weak-capacitance detection ASIC of capacitive liquid level sensor in the rocket. Mod. Phys. Lett. B 2017, 31, 1750302. [Google Scholar] [CrossRef]
- Lata, A.; Kumar, B.; Mandal, N. Design and development of a level transmitter using force resistive sensor as a primary sensing element. IET Sci. Meas. Technol. 2018, 12, 118–125. [Google Scholar] [CrossRef]
- Kumar, B.; Mandal, N. Study of an Electro-Optic Technique of Level Transmitter Using Mach-Zehnder Interferometer and Float as Primary Sensing Elements. IEEE Sens. J. 2016, 16, 4211–4218. [Google Scholar] [CrossRef]
- Yoo, J.H.; Jones, N.J.; Flynn, K.; Jacobs, R. Development of a water level sensor using magnetostrictive materials. AIP Adv. 2019, 9, 035119. [Google Scholar] [CrossRef]
- Wang, N.; Zhang, Y.; Jin, B.; Wang, Y.; Zhang, M. Quasi-Distributed Optical Fiber Sensor for Liquid-Level Measurement. IEEE Photon. J. 2017, 9, 1–7. [Google Scholar] [CrossRef]
- Vrba, J.; Karch, J.; Vrba, D. Phantoms for Development of Microwave Sensors for Noninvasive Blood Glucose Monitoring. Int. J. Antennas Propag. 2015, 2015, 1–5. [Google Scholar] [CrossRef]
- Khairi, M.T.M.; Ibrahim, S.; Yunus, M.A.M.; Faramarzi, M. Contact and non-contact ultrasonic measurement in the food industry: A review. Meas. Sci. Technol. 2015, 27, 012001. [Google Scholar] [CrossRef]
- Greenwood, M.; Bamberger, J.A. Ultrasonic sensor to measure the density of a liquid or slurry during pipeline transport. Ultrasonics 2002, 40, 413–417. [Google Scholar] [CrossRef]
- Tenoudji, F.C.; Citerne, J.M.; Dutilleul, H.; Busquet, D. Non-contact ultrasonic defect imaging in composites. AIP Conf. Proc. 2016, 1706, 080003. [Google Scholar]
- Zhang, M.; Li, S. A method of the untouched ultrasonic liquid level measurement with high precision. In Proceedings of the 2010 International Conference on Computer Application and System Modeling (ICCASM 2010), Taiyuan, China, 22–24 October 2010; Institute of Electrical and Electronics Engineers (IEEE): Piscataway, NJ, USA, 2010; Volume 7, pp. V7–V144. [Google Scholar]
- Jun, L. Impact of pressure and temperature upon ultrasonic velocity in two sorts of hydraulic oil. Tech. Acoust. 2007, 26, 1155. [Google Scholar]
- Hao, H.-H.; Xiong, J.-Q. A method of liquid level measurement based on ultrasonic echo characteristics. In Proceedings of the 2010 International Conference on Computer Application and System Modeling (ICCASM 2010), Taiyuan, China, 22–24 October 2010; Institute of Electrical and Electronics Engineers (IEEE): Piscataway, NJ, USA, 2010; Volume 11, pp. V11–V682. [Google Scholar]
- Muravieva, O.V.; Bogdan, O.; Dudina, Y.S.; Kuznetsov, E.P. Modeling of gas bubble dynamics in liquid media under Doppler effect of ultrasound radiation. In Proceedings of the 2018 Ural Symposium on Biomedical Engineering, Radioelectronics and Information Technology (USBEREIT), Yekaterinburg, Russia, 7–8 May 2018. [Google Scholar]
- Peng, J.-X.; Zhao, G.-P.; Liang, Z.-F. Effect of Bubble Volume Fraction on Distribution of Ultrasonic Field in Liquid. J. South China Univ. Technol. (Nat. Sci. Ed.) 2008, 26. [Google Scholar]
- Zhang, B.; Wei, Y.-J.; Liu, W.-Y.; Zhang, Y.-J.; Yao, Z.; Zhang, L.; Xiong, J.-J. A Novel Ultrasonic Method for Liquid Level Measurement Based on the Balance of Echo Energy. Sensors 2017, 17, 706. [Google Scholar] [CrossRef] [PubMed]
- Liu, B.; Wang, D.Y.; Wang, A. Liquid-Surface-Level Sensing Based on Transverse Pulse Train Technique. IEEE Sens. J. 2016, 16, 2317–2321. [Google Scholar] [CrossRef]
- Matsuda, Y.; Yoshioka, M.; Uchida, T. Absolute Hydrophone Calibration to 40 MHz Using Ultrasonic Far-Field. Mater. Trans. 2014, 55, 1030–1033. [Google Scholar] [CrossRef]
- Zhang, D.-L.; Wu, M.; Chen, Z.; Li, Y. High Performance Ultrasonic Buffer Rods with Novel Structure for Polymer Process Monitoring. J. Test. Eval. 2016, 45, 1231–1237. [Google Scholar] [CrossRef]
- Hoppe, N.; Püttmer, A.; Hauptmann, P. Optimization of buffer rod geometry for ultrasonic sensors with reference path. IEEE Trans. Ultrason. Ferroelectr. Freq. Control 2003, 50, 170–178. [Google Scholar] [CrossRef]
- Fischer, B.; Magori, V.D.P.; Von, J.A. Ultrasonic Device for Measuring Specific Density of a Fluid. EP, 0483491B1 AI [P], 5 June 1991. [Google Scholar]
- Liu, J.; Li, G. Frequency and Temperature Characteristics of an Ultrasonic Method for Measuring the Specific Gravity of Lead-Acid Battery Electrolyte. Jpn. J. Appl. Phys. 2012, 51, 026601. [Google Scholar] [CrossRef]
- Dikov, I.; Boychuk, A. The review of FRP volume porosity definition with ultrasonic non-destructive technique (review). Proc. VIAM 2017, 10. [Google Scholar] [CrossRef]
- Castagnède, B.; Aknine, A.; Melon, M.; Depollier, C. Ultrasonic characterization of the anisotropic behavior of air-saturated porous materials. Ultrasonics 1998, 36, 323–341. [Google Scholar] [CrossRef]
- Liu, Y.; Li, H.-J. Wave reflection and transmission by porous breakwaters: A new analytical solution. Coast. Eng. 2013, 78, 46–52. [Google Scholar] [CrossRef]
- Ohbuchi, T.; Mizutani, K.; Wakatsuki, N.; Nishimiya, K.; Masuyama, H. Reconstruction of Three-Dimensional Sound Field from Two-Dimensional Sound Field Using Optical Computerized Tomography and Near-Field Acoustical Holography. Jpn. J. Appl. Phys. 2009, 48, 07GC03. [Google Scholar] [CrossRef]
- Lukosevicius, A.; Jurkonis, R. Ultrasonic near field in lossy media: Method of simulation. Ultragarsas “Ultrasound” 1997, 27, 33–37. [Google Scholar]
- Breakey, D.; Jordan, P.; Cavalieri, A.V.G.; Léon, O. Near-field Wavepackets and the Far-field Sound of a Subsonic Jet. In Proceedings of the 19th AIAA/CEAS Aeroacoustics Conference, Berlin, Germany, 27–29 May 2013; American Institute of Aeronautics and Astronautics (AIAA): Reston, VA, USA, 2013. [Google Scholar]
- Lim, C.W.; Tong, L.; Li, Y. Theory of suspended carbon nanotube thinfilm as a thermal-acoustic source. J. Sound Vib. 2013, 332, 5451–5461. [Google Scholar] [CrossRef]
- Püttmer, A.; Höppe, N.; Henning, B.; Hauptmann, P. Ultrasonic density sensor—Analysis of errors due to thin layers of deposits on the sensor surface. Sens. Actuators A Phys. 1999, 76, 122–126. [Google Scholar] [CrossRef]
- Liu, J.-X.; Wang, Z.-Q.; Li, G.-F.; Wang, N. Acoustic method for obtaining the pressure reflection coefficient using a half-wave layer. Ultrasonics 2011, 51, 359–368. [Google Scholar] [CrossRef]
- Mcclements, D.J.; Fairley, P. Ultrasonic pulse echo reflectometer. Ultrasonics 1991, 29, 58–62. [Google Scholar] [CrossRef]
- Kuskibiki, J.; Akashi, N.; Sannomiya, T.; Chubachi, N.; Dunn, F. VHF/UHF range bioultrasonic spectroscopy system and method. IEEE Trans. Ultrason. Ferroelectr. Freq. Control 1995, 42, 1028–1039. [Google Scholar] [CrossRef]
- Bjorndal, E.; FrOysa, K.-E.; Engeseth, S.-A. A novel approach to acoustic liquid density measurements using a buffer rod based measuring cell. IEEE Trans. Ultrason. Ferroelectr. Freq. Control 2008, 55, 1794–1808. [Google Scholar] [CrossRef]


| Materials | Material Types | Acoustic Impedance (Mrayl) | Reflectance (R) |
|---|---|---|---|
| Water | Liquid | 1.48 | 100% |
| PMMA [34] | Polymer | 3.26 | 37% |
| Quartz glass [35] | Glass | 13.1 | 79.50% |
| Glass ceramics [22] | Glass | 16.5 | 83.30% |
| Aluminum [36] | Metal | 17.3 | 84% |
| Specification | Symbol | Initial Values |
|---|---|---|
| Container material | MC | Aluminum alloy 2219 (AL) |
| Wall thickness | h | 3 mm |
| Transducer material | MTX | Piezoelectric ceramic (PZT)-5A |
| Buffer material | MB | PMMA |
| AL acoustic impedance | Z2 | 32 Mrayl |
| Water acoustic impedance | ZW | 1.48 Mrayl |
| Air acoustic impedance | ZA | Mrayl |
| PMMA acoustic impedance | ZPMMA | 3.26 Mrayl |
| Ultrasound velocity | c | 2775 m/s |
| Transducer diameter | D | 10 mm, 15 mm |
| Working frequency | f0 | MHz |
| Ultrasonic amplitude | Am | ±15 V |
| Experimental temperature | T | 20 °C |
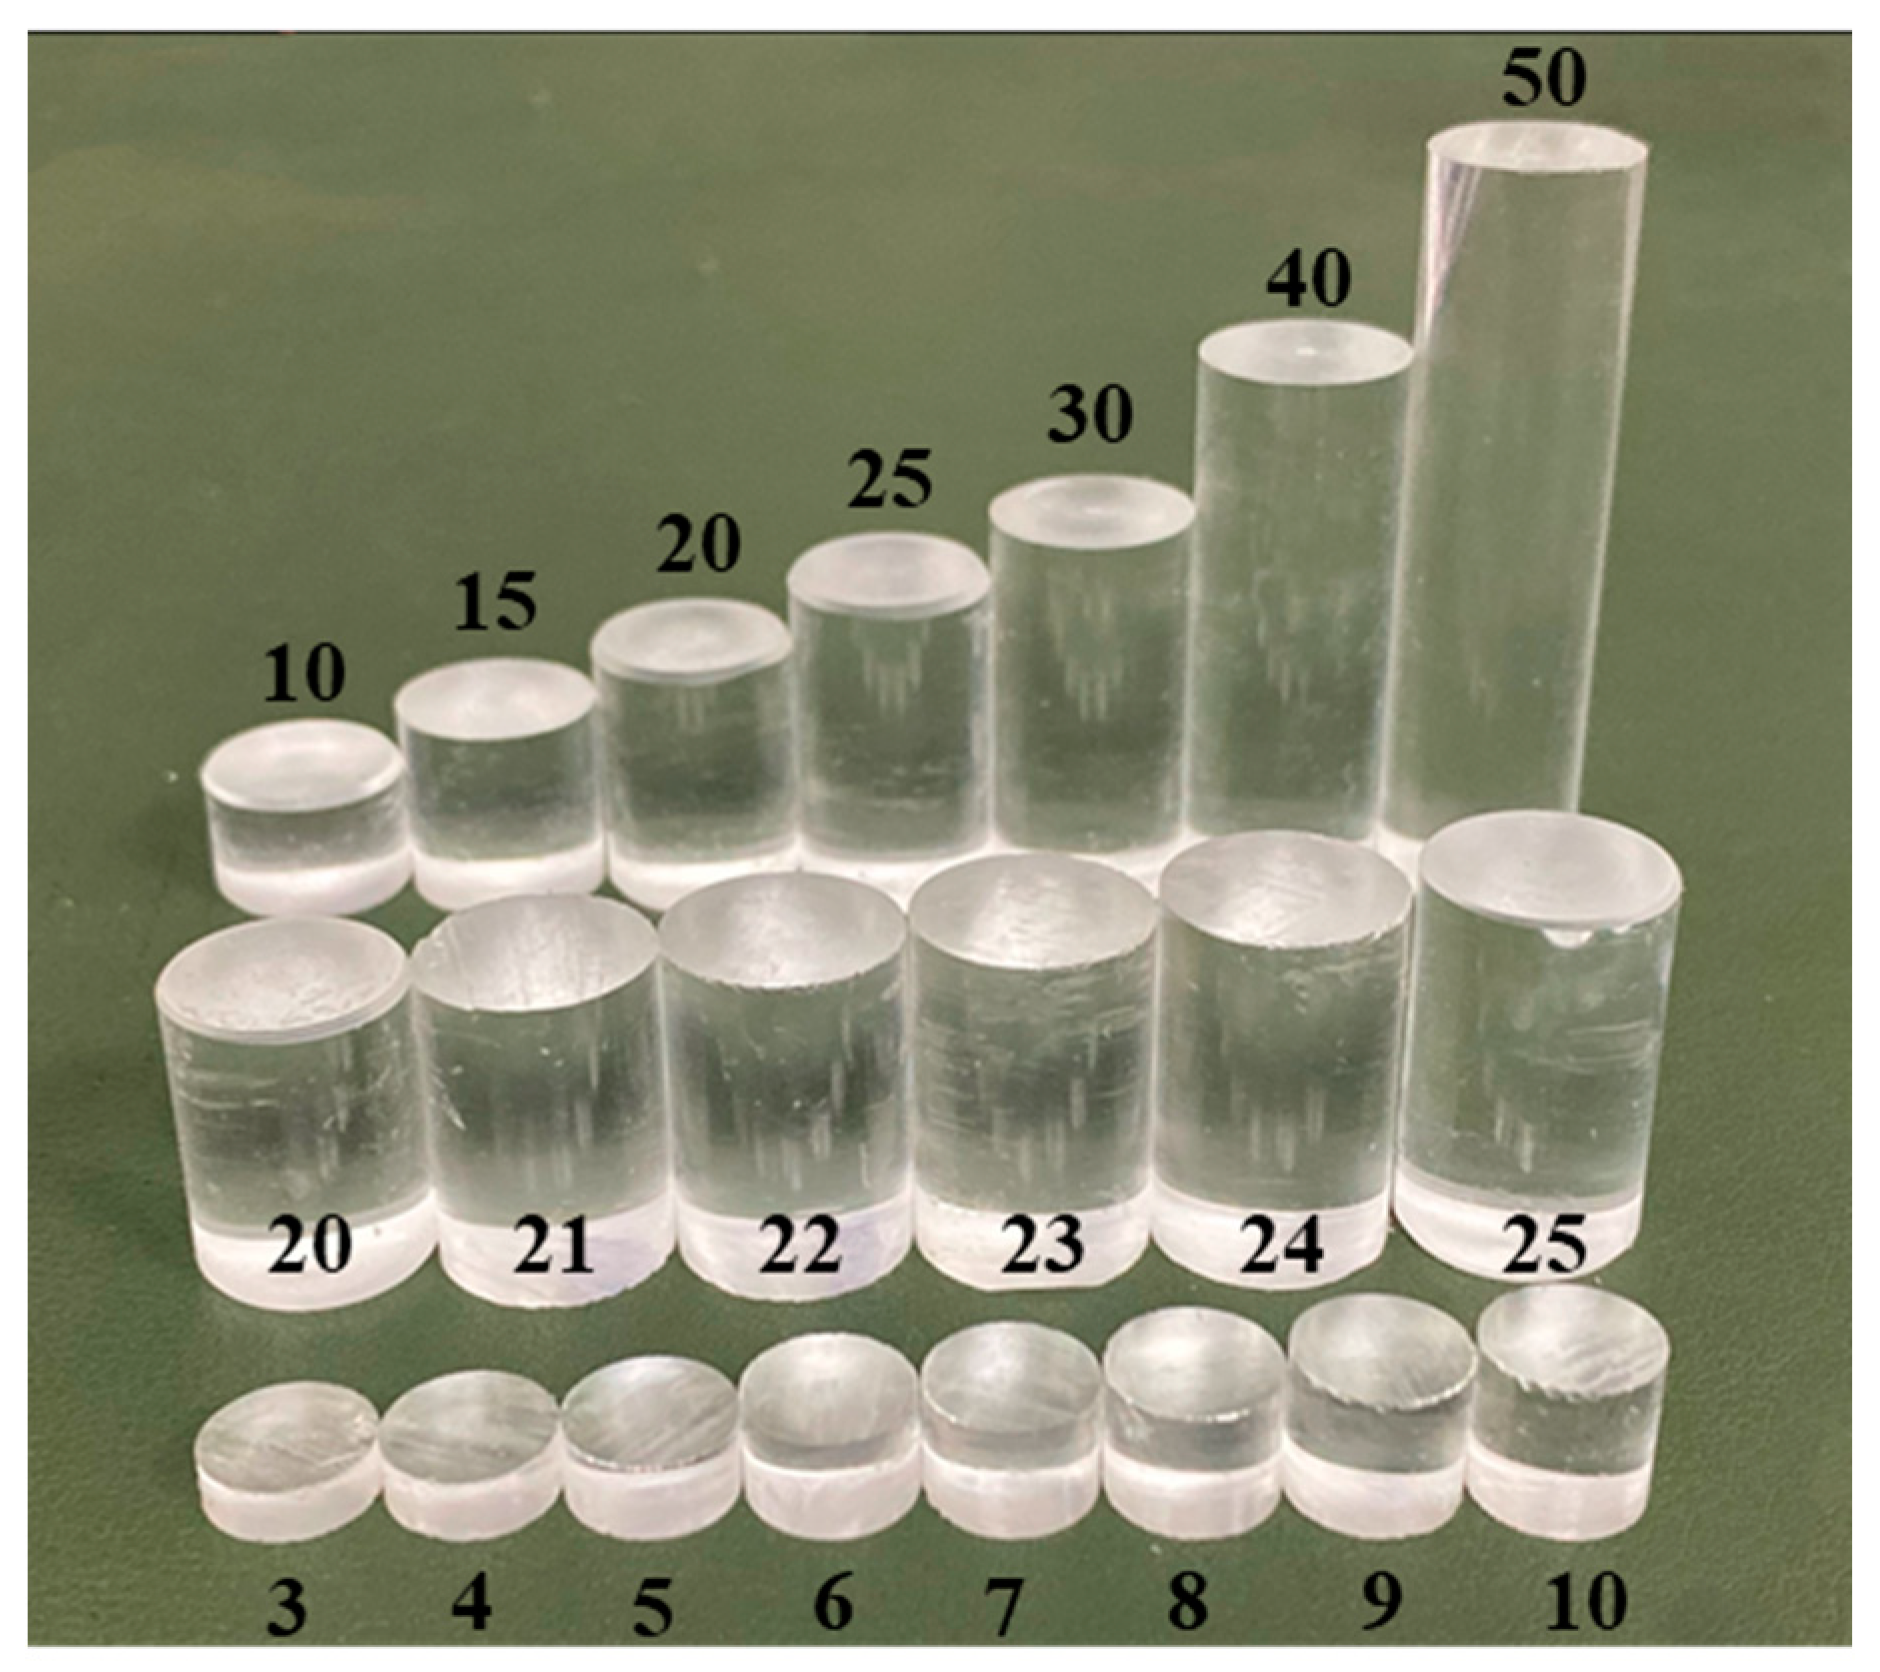
| PMMA Diameters (mm) | PMMA Lengths (mm) |
|---|---|
| 10 | 3, 4, 5, 6, 7, 8, 9, 10 |
| 15 | 10, 15, 20, 21, 22, 23, 24, 25, 30, 40, 50 |
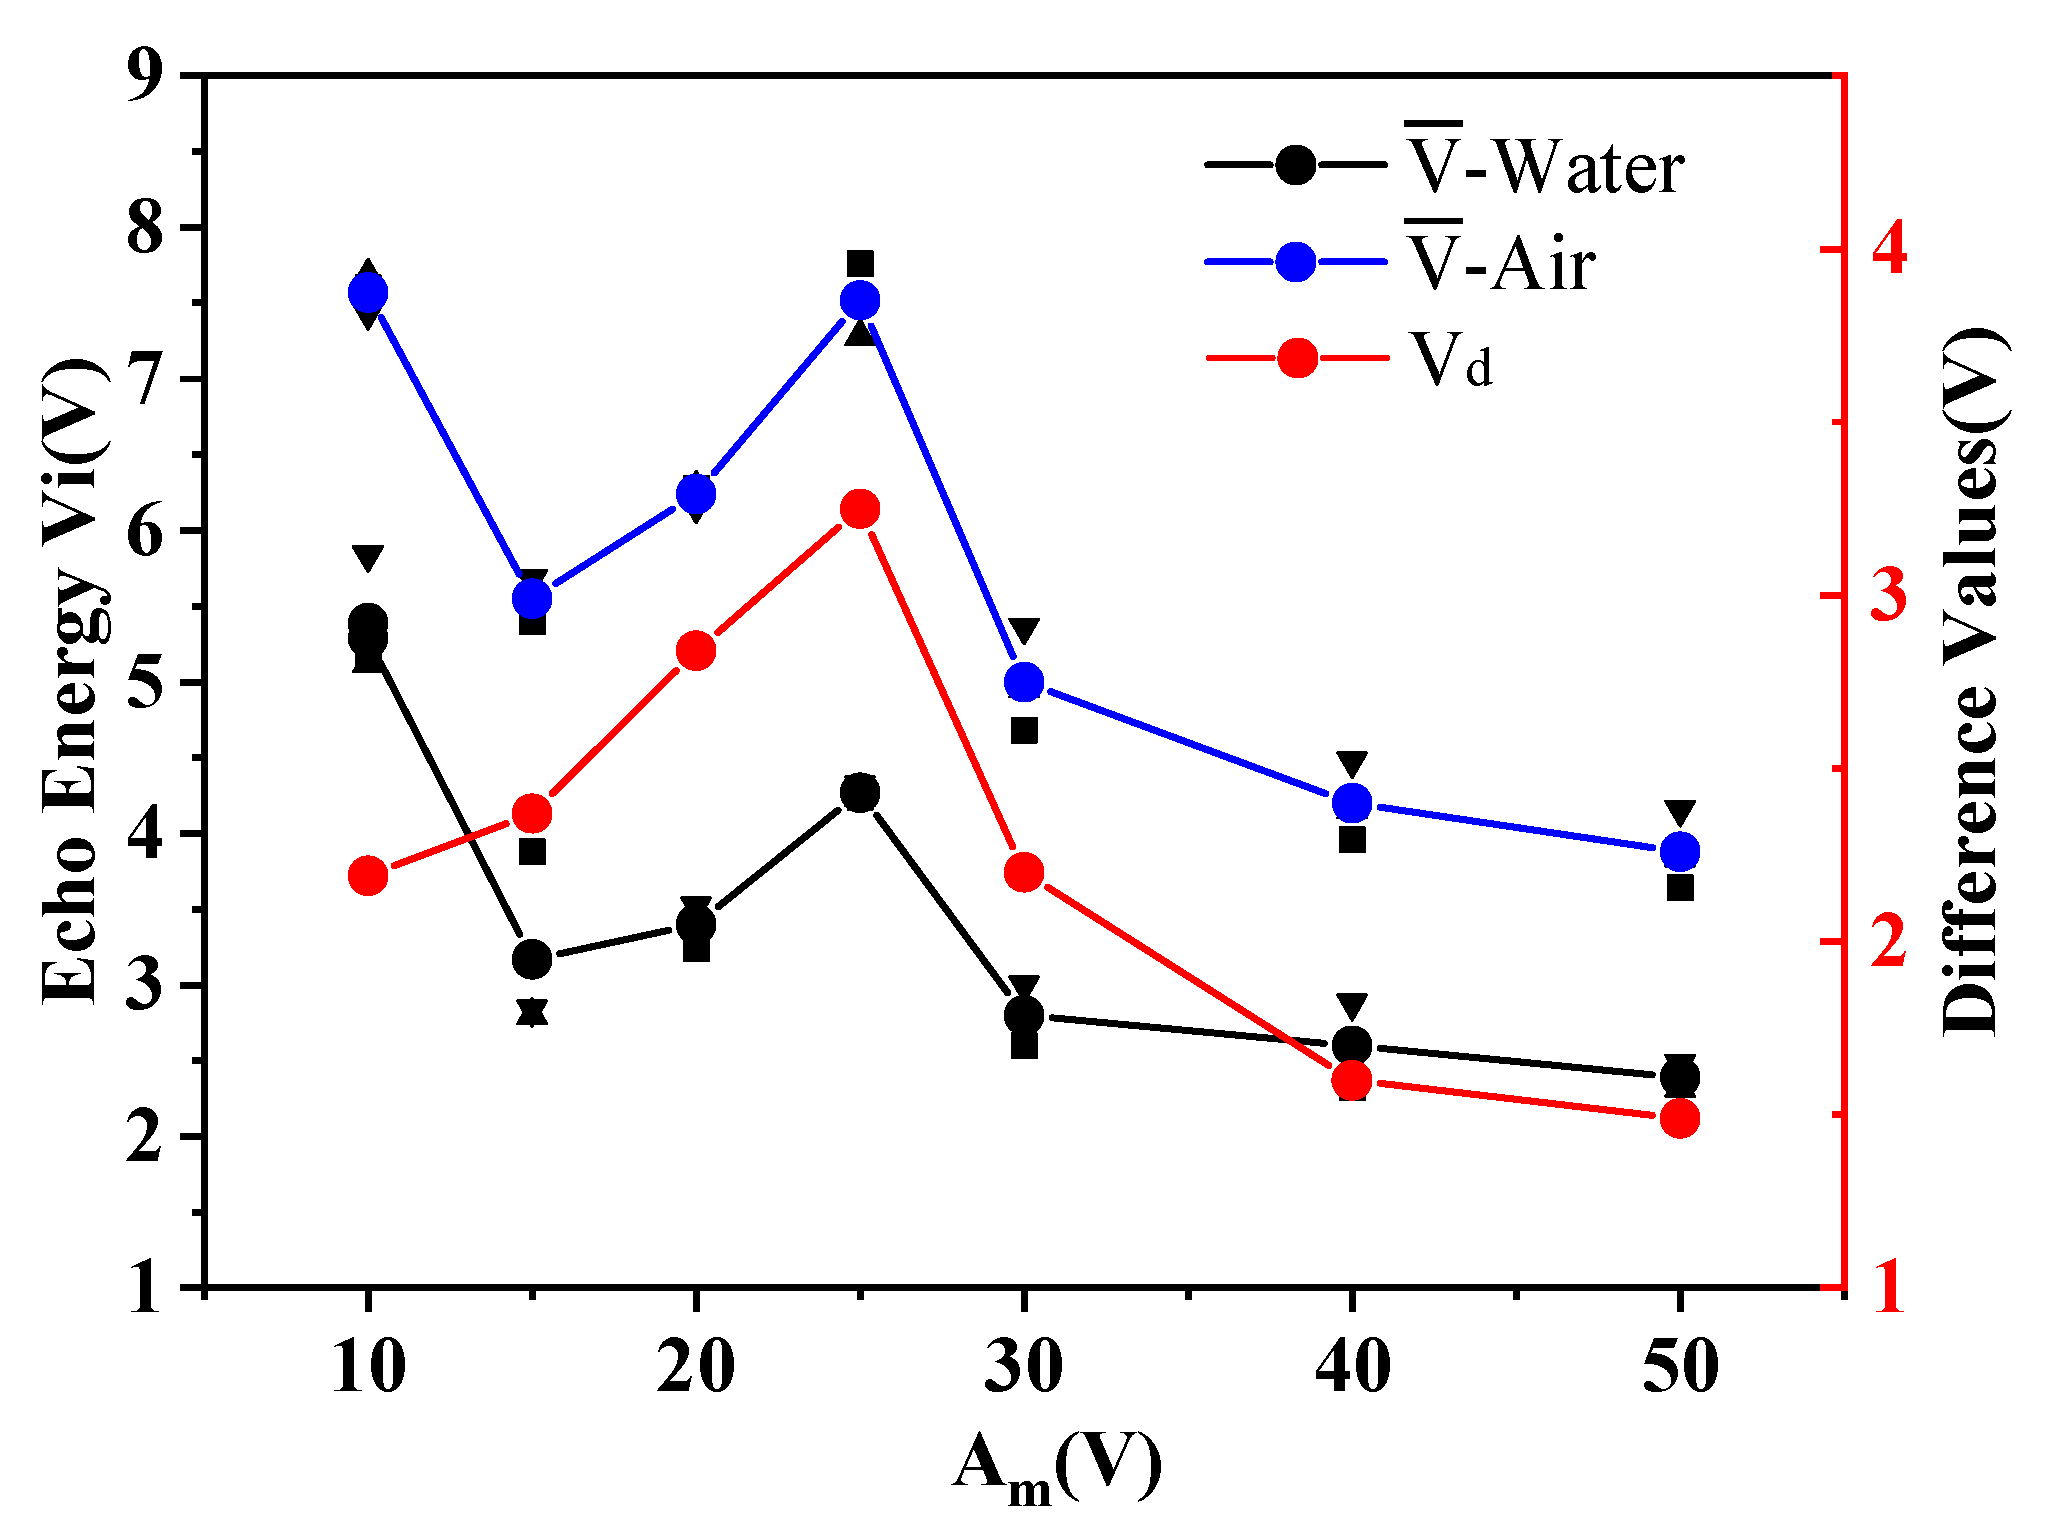
| L (mm) | Medium | V1 (V) | V2 (V) | V3 (V) | (V) | |ΔE| (V) | Vd (V) |
|---|---|---|---|---|---|---|---|
| 10 | Water | 5.20 | 5.12 | 5.84 | 5.39 | 0.30 | 2.19 |
| Air | 7.60 | 7.68 | 7.44 | 7.57 | 0.09 | ||
| 15 | Water | 3.88 | 2.80 | 2.84 | 3.17 | 0.47 | 2.37 |
| Air | 5.40 | 5.56 | 5.68 | 5.55 | 0.10 | ||
| 20 | Water | 3.24 | 3.44 | 3.52 | 3.40 | 0.11 | 2.84 |
| Air | 6.28 | 6.28 | 6.16 | 6.24 | 0.05 | ||
| 25 | Water | 4.24 | 4.24 | 4.32 | 4.27 | 0.04 | 3.25 |
| Air | 7.76 | 7.28 | 7.52 | 7.52 | 0.16 | ||
| 30 | Water | 2.60 | 2.80 | 3.00 | 2.80 | 0.13 | 2.20 |
| Air | 4.68 | 4.96 | 5.36 | 5.00 | 0.24 | ||
| 40 | Water | 2.32 | 2.60 | 2.88 | 2.60 | 0.19 | 1.60 |
| Air | 3.96 | 4.16 | 4.48 | 4.20 | 0.19 | ||
| 50 | Water | 2.36 | 2.32 | 2.48 | 2.39 | 0.06 | 1.49 |
| Air | 3.64 | 3.84 | 4.16 | 3.88 | 0.19 |
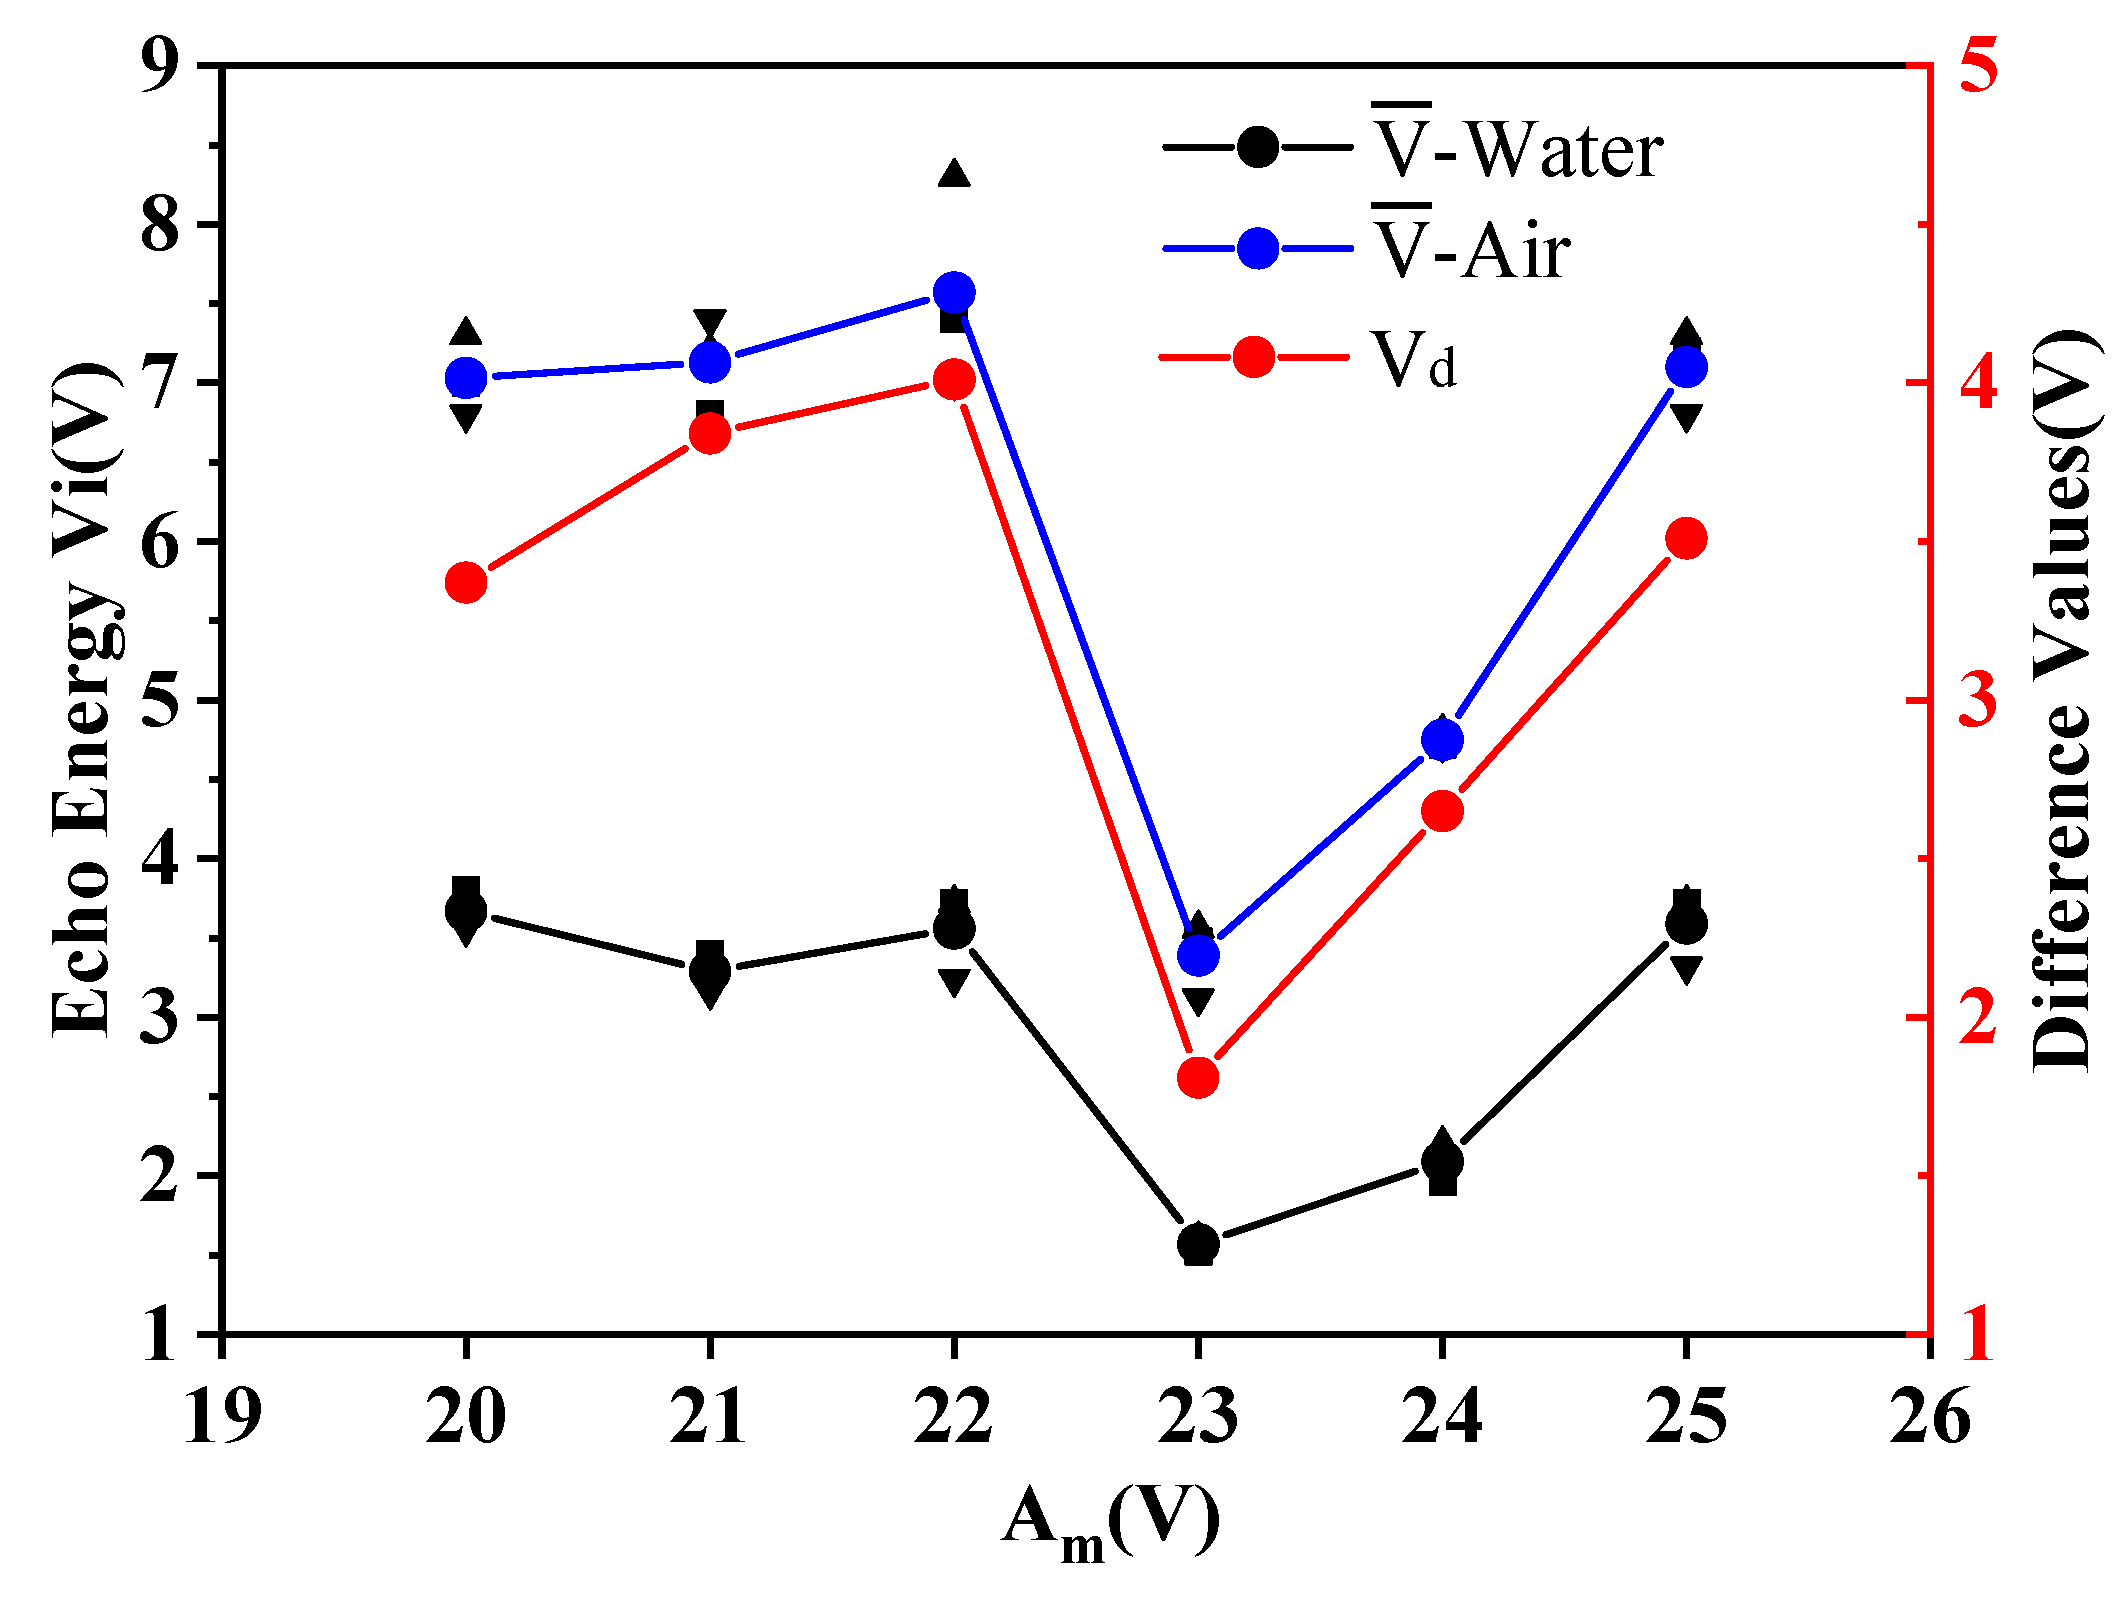
| L (mm) | Medium | V1 (V) | V2 (V) | V3 (V) | (V) | |∆E| (V) | Vd (V) |
|---|---|---|---|---|---|---|---|
| 20 | Water | 3.56 | 3.80 | 3.64 | 3.67 | 0.09 | 3.37 |
| Air | 6.80 | 7.00 | 7.30 | 7.03 | 0.18 | ||
| 21 | Water | 3.16 | 3.40 | 3.32 | 3.29 | 0.09 | 3.84 |
| Air | 7.40 | 6.80 | 7.20 | 7.13 | 0.22 | ||
| 22 | Water | 3.24 | 3.72 | 3.72 | 3.56 | 0.21 | 4.01 |
| Air | 7.00 | 7.40 | 8.30 | 7.57 | 0.49 | ||
| 23 | Water | 1.60 | 1.52 | 1.60 | 1.57 | 0.04 | 1.81 |
| Air | 3.12 | 3.48 | 3.56 | 3.39 | 0.18 | ||
| 24 | Water | 2.12 | 1.96 | 2.20 | 2.09 | 0.09 | 2.65 |
| Air | 4.72 | 4.72 | 4.80 | 4.75 | 0.04 | ||
| 25 | Water | 3.32 | 3.72 | 3.72 | 3.59 | 0.18 | 3.51 |
| Air | 6.80 | 7.20 | 7.30 | 7.10 | 0.20 |
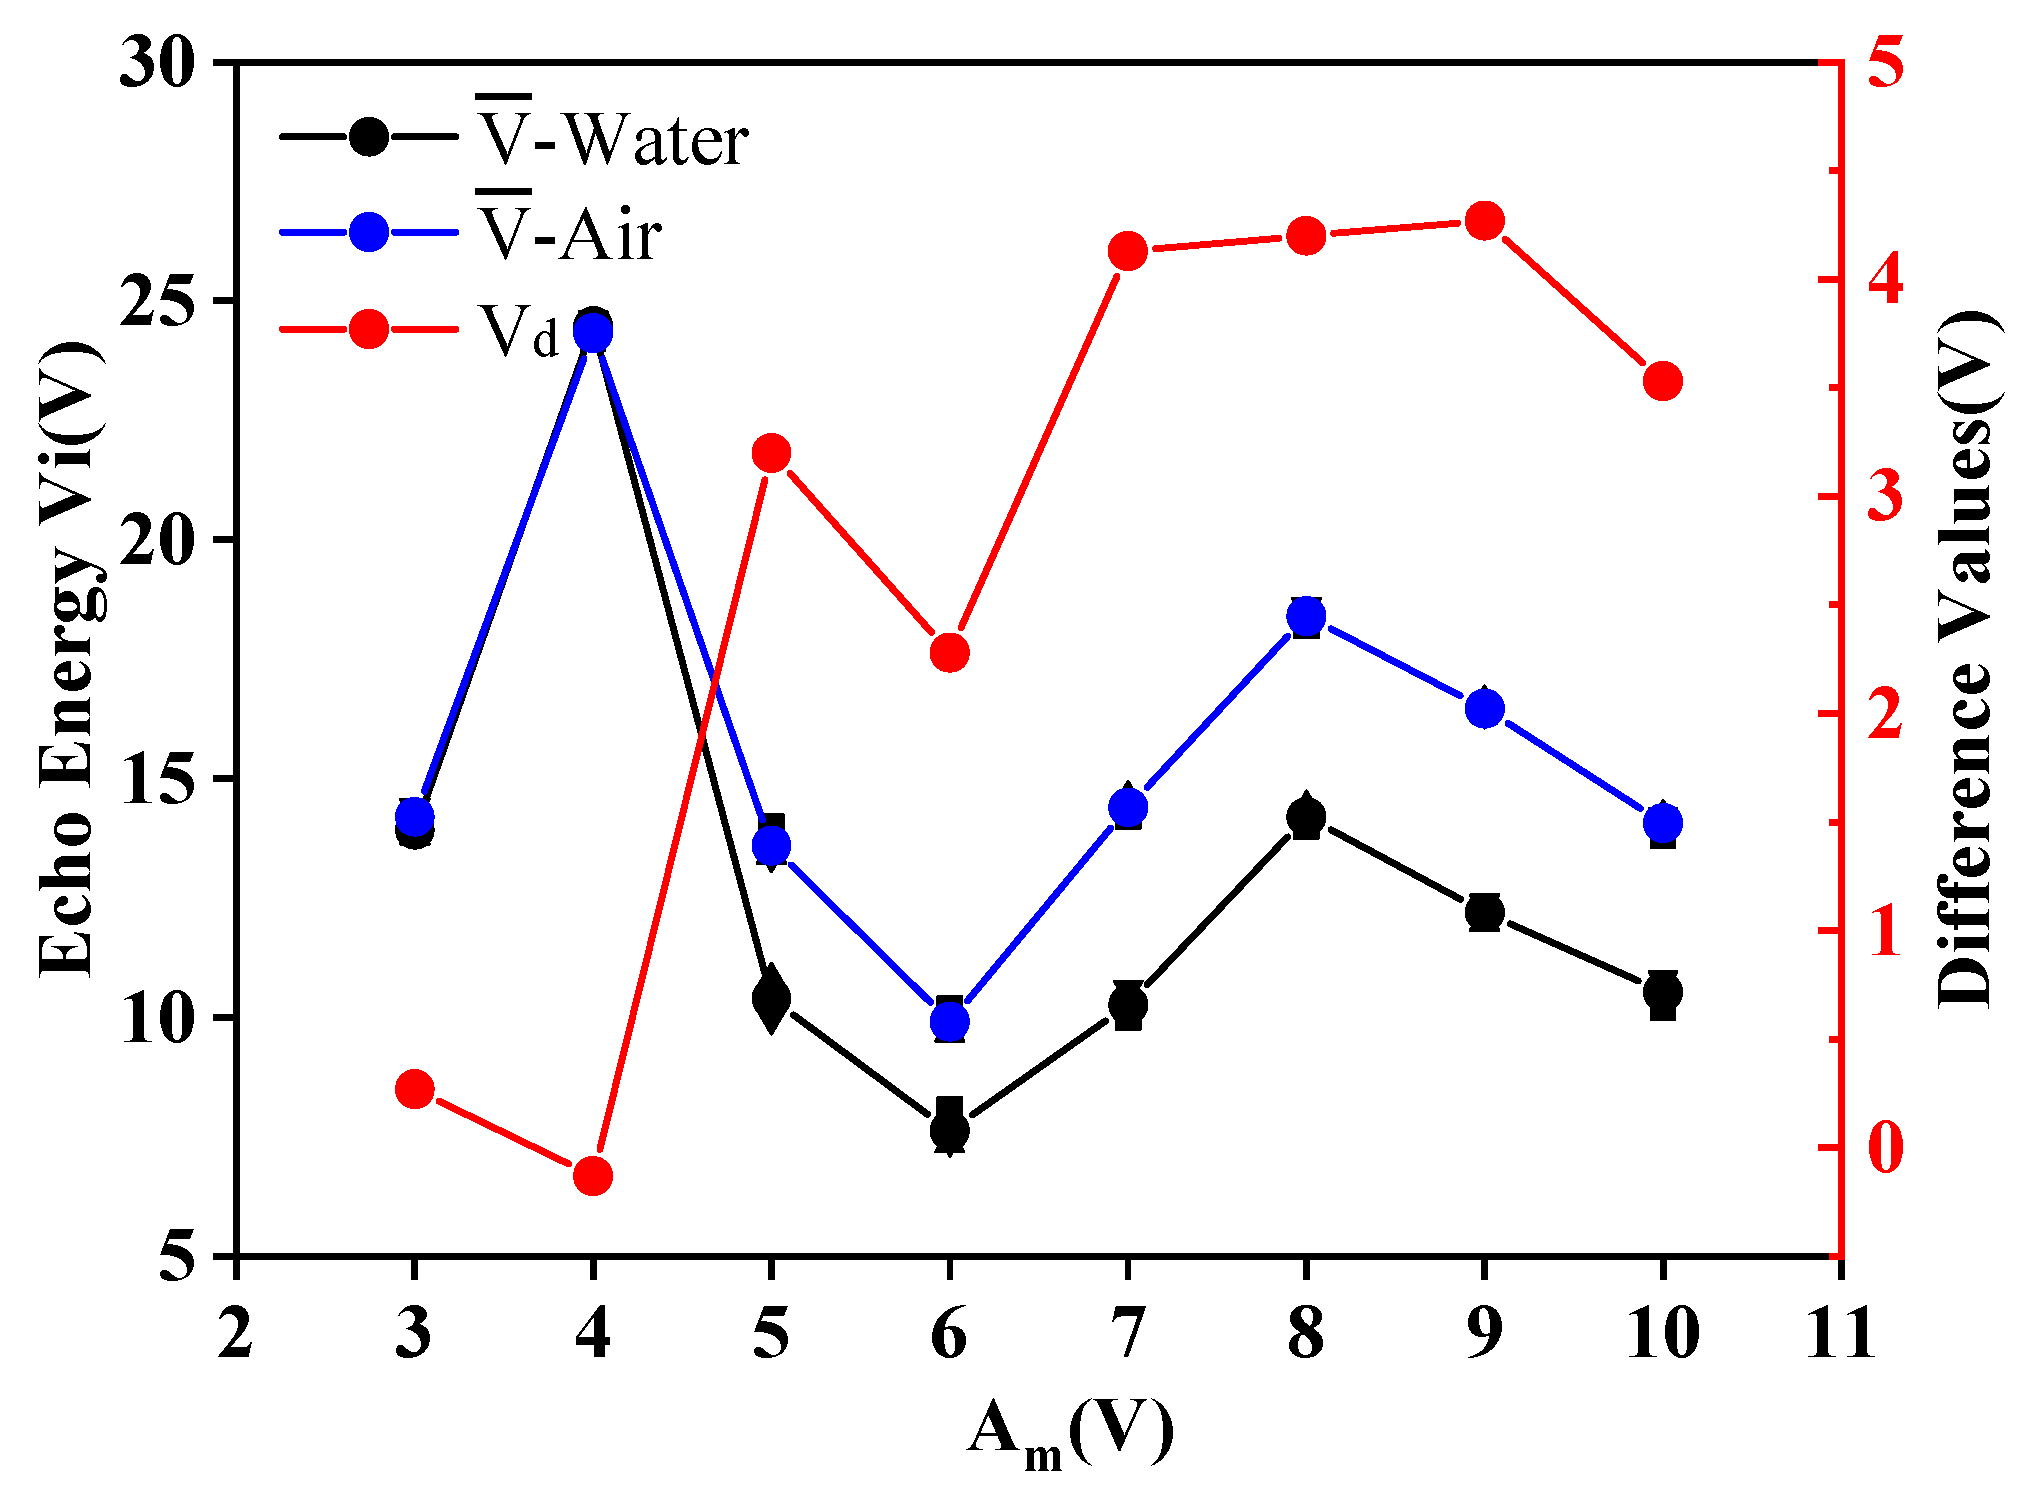
| L (mm) | Medium | V1 (V) | V2 (V) | V3 (V) | (V) | |∆E| (V) | Vd (V) |
|---|---|---|---|---|---|---|---|
| 10 | Water | 10.60 | 10.80 | 10.20 | 10.53 | 0.22 | 3.53 |
| Air | 14.20 | 14.20 | 13.80 | 14.07 | 0.18 | ||
| 9 | Water | 12.00 | 12.40 | 12.20 | 12.20 | 0.13 | 4.27 |
| Air | 16.60 | 16.40 | 16.40 | 16.47 | 0.09 | ||
| 8 | Water | 14.40 | 14.20 | 14.00 | 14.20 | 0.13 | 4.20 |
| Air | 18.40 | 18.60 | 18.20 | 18.40 | 0.13 | ||
| 7 | Water | 10.20 | 10.60 | 10.00 | 10.27 | 0.22 | 4.13 |
| Air | 14.60 | 14.40 | 14.20 | 14.40 | 0.13 | ||
| 6 | Water | 7.36 | 7.44 | 8.08 | 7.63 | 0.30 | 2.28 |
| Air | 9.68 | 9.84 | 10.20 | 9.91 | 0.20 | ||
| 5 | Water | 10.80 | 10.00 | 10.40 | 10.40 | 0.27 | 3.20 |
| Air | 13.40 | 13.40 | 14.00 | 13.60 | 0.27 | ||
| 4 | Water | 24.40 | 24.60 | 24.40 | 24.47 | 0.09 | −0.13 |
| Air | 24.40 | 24.40 | 24.20 | 24.33 | 0.09 | ||
| 3 | Water | 13.80 | 14.00 | 14.00 | 13.93 | 0.09 | 0.27 |
| Air | 14.00 | 14.40 | 14.20 | 14.20 | 0.13 | ||
| 0 | Water | 53.60 | 54.00 | 53.00 | 53.53 | 0.36 | 2.27 |
| Air | 56.00 | 55.60 | 55.80 | 55.80 | 0.13 |
© 2020 by the authors. Licensee MDPI, Basel, Switzerland. This article is an open access article distributed under the terms and conditions of the Creative Commons Attribution (CC BY) license (http://creativecommons.org/licenses/by/4.0/).
Share and Cite
Gao, W.; Liu, W.; Hu, Y.; Wang, J. Study of Ultrasonic Near-Field Region in Ultrasonic Liquid-Level Monitoring System. Micromachines 2020, 11, 763. https://doi.org/10.3390/mi11080763
Gao W, Liu W, Hu Y, Wang J. Study of Ultrasonic Near-Field Region in Ultrasonic Liquid-Level Monitoring System. Micromachines. 2020; 11(8):763. https://doi.org/10.3390/mi11080763
Chicago/Turabian StyleGao, Wanjia, Wenyi Liu, Yanjun Hu, and Jun Wang. 2020. "Study of Ultrasonic Near-Field Region in Ultrasonic Liquid-Level Monitoring System" Micromachines 11, no. 8: 763. https://doi.org/10.3390/mi11080763
APA StyleGao, W., Liu, W., Hu, Y., & Wang, J. (2020). Study of Ultrasonic Near-Field Region in Ultrasonic Liquid-Level Monitoring System. Micromachines, 11(8), 763. https://doi.org/10.3390/mi11080763