Capturing Human Perceptual and Cognitive Activities via Event-Related Potentials Measured with Candle-Like Dry Microneedle Electrodes


Abstract
1. Introduction
2. Methods
2.1. ERP Measurement with CMEs and Conventional Wet Electrodes
2.1.1. Oddball Task
2.1.2. Measurement
2.1.3. Analysis
2.2. ERP Measurement with CMEs and NIRS
2.2.1. Oddball Task
2.2.2. Measurement
2.2.3. Analysis
3. Results and Discussion
3.1. ERP Measurement with CMEs and Conventional Wet Electrodes
3.2. Correlation Between ERPs Measured with CMEs and NIRS
3.2.1. Preliminary Experiments
3.2.2. Simultaneous Measurement of EEG and NIRS
4. Conclusions
Supplementary Materials
Author Contributions
Funding
Acknowledgments
Conflicts of Interest
References
- Belliveau, J.W.; Rosen, B.R.; Kantor, H.L.; Rzedzian, R.R.; Kennedy, D.N.; McKinstry, R.C.; Vevea, J.M.; Cohen, M.S.; Pykett, I.L.; Brady, T.J. Functional cerebral imaging by susceptibility-contrast NMR. Magn. Reson. Med. 1990, 14, 538–546. [Google Scholar] [CrossRef] [PubMed]
- Vrba, J.; Robinson, S.E. Signal processing in magnetoencephalography. Perspect. Biol. Med. 2001, 25, 249–271. [Google Scholar] [CrossRef] [PubMed]
- Villringer, A.; Planck, J.; Hock, C.; Schleinkofer, L.; Dirnagl, U. Near infrared spectroscopy (NIRS): A new tool to study hemodynamic changes during activation of brain function in human adults. Neurosci. Lett. 1993, 154, 101–104. [Google Scholar] [CrossRef]
- Millett, D.; Hans, B. From Psychic Energy to the EEG. Perspect. Biol. Med. 2001, 44, 522–542. [Google Scholar] [CrossRef] [PubMed]
- Dehais, F.; Duprès, A.; Di Flumeri, G.; Verdière, K.J.; Borghini, G.; Babiloni, F.; Roy, R.N. Monitoring pilot’s cognitive fatigue with engagement features in simulated and actual flight conditions using an hybrid fNIRS-EEG passive BCI. In Proceedings of the 2018 IEEE International Conference on Systems, Man, and Cybernetics, Miyazaki, Japan, 7–10 October 2018. [Google Scholar]
- Aricò, P.; Borghini, G.; Di Flumeri, G.; Sciaraffa, N.; Babiloni, F. Passive BCI beyond the lab: current trends and future directions. Physiol. Meas. 2018, 39, 08TR02. [Google Scholar]
- Lehmann, D. Multichannel topography of human alpha EEG fields. Electroencephalogr. Clin. Neurophysiol. 1971, 31, 439–449. [Google Scholar] [CrossRef]
- Yasoshima, A.; Hayashi, H.; Iijima, S.; Sugita, Y.; Teshima, Y.; Shimizu, T.; Hishikawa, Y. Potential distribution of vertex sharp wave and saw-toothed wave on the scalp. Electroencephalogr. Clin. Neurophysiol. 1984, 58, 73–76. [Google Scholar] [CrossRef]
- Hua, H.Q.; Tang, W.; Xu, X.M.; Feng, D.D.; Shu, L. Flexible multi-layer semi-dry electrode for scalp EEG measurements at hairy sites. Micromachines 2019, 10, 518. [Google Scholar] [CrossRef]
- Chen, Y.C.; Lin, B.S.; Pan, J.S. Novel noncontact dry electrode with adaptive mechanical design for measuring EEG in a hairy site. IEEE Trans. Instrum. Meas. 2015, 64, 3361–3368. [Google Scholar] [CrossRef]
- Lin, S.; Liu, J.C.; Li, W.Z.; Wang, D.; Huang, Y.; Jia, C.; Li, Z.W.; Murtaza, M.; Wang, H.Y.; Song, J.N.; et al. A flexible, robust, and gel-free electroencephalogram electrode for noninvasive brain-computer interfaces. Nano Lett. 2019, 19, 6853–6861. [Google Scholar] [CrossRef]
- Lin, B.S.; Huan, Y.K.; Lin, B.S. Design of smart EEG cap. Comput. Methods Programs Biomed. 2019, 178, 41–46. [Google Scholar] [CrossRef]
- Liu, J.T.; Liu, X.Y.; He, E.H.; Gao, F.; Li, Z.Y.; Xiao, G.H.; Xu, S.W.; Cai, X.X. A novel dry-contact electrode for measuring electroencephalography signals. Sens. Actuators A-Phys. 2019, 294, 73–80. [Google Scholar] [CrossRef]
- Zander, T.O.; Andreessen, L.M.; Berg, A.; Bleuel, M.; Pawlitzki, J.; Zawallich, L.; Krol, L.R.; Gramann, K. Evaluation of a dry EEG system for application of passive brain-computer interfaces in autonomous driving. Front. Hum. Neurosci. 2017, 11, 78. [Google Scholar] [CrossRef] [PubMed]
- Di Flumeri, G.; Aricò, P.; Borghini, G.; Sciaraffa, N.; Di Florio, A.; Babiloni, F. The dry revolution: evaluation of three different EEG dry electrode types in terms of signal spectral features, mental states classification and usability. Sensors 2019, 19, 1365. [Google Scholar]
- Lopez-Gordo, M.A.; Sanchez-Morillo, D.; Pelayo Valle, F. Dry EEG electrodes. Sensors 2014, 14, 12847. [Google Scholar]
- Arai, M.; Kudo, Y.; Miki, N. Polymer-based candle-shaped microneedle electrodes for electroencephalography on hairy skin. Jpn. J. Appl. Phys. 2016, 55, 06GP16. [Google Scholar] [CrossRef]
- Kudo, Y.; Arai, M.; Miki, N. Fatigue assessment by electroencephalogram measured with candle-like dry microneedle electrodes. Micro Nano Lett. 2017, 12, 545–549. [Google Scholar] [CrossRef]
- Pritchard, W.S. Psychophysiology of P300. Psychol. Bull. 1981, 89, 506. [Google Scholar] [CrossRef]
- Schroger, E. Application of ERP measures in psychological research. Behav. Res. Methods Instrum. Comput. 1998, 30, 131–145. [Google Scholar]
- Näätänen, R.; Paavilainen, P.; Rinne, T.; Alho, K. The mismatch negativity (MMN) in basic research of central auditory processing: A review. Clin. Neurophysiol. 2007, 118, 2544–2590. [Google Scholar] [CrossRef]
- Furuya, I.; Mroi, K. Cerebral Lateralization in Spoken Language Processing Measured by Multi-Channel Near-Infrared Spectroscopy (NIRS). Brain Nerve 2003, 55, 226–231. [Google Scholar]
- Sato, Y.; Mori, K.; Furuya, I.; Hayashi, R.; Minagawa-Kawai, Y.; Koizumi, T. Developmental changes in cerebral lateralization during speech processing measured by near infrared spectroscopy. Jpn. J. Logop. Phoniatr. 2003, 44, 165–171. [Google Scholar] [CrossRef]
- Imaizumi, S.; Mori, K.; Kiritani, S.; Hosoi, H.; Tonoike, M. Task-dependent laterality for cue decoding during spoken language processing. Neuroreport 1998, 9, 899–903. [Google Scholar] [CrossRef]
- Dawson, G.D. A summation technique for the detection of small evoked potentials. Electroencephalogr. Clin. Neurophysiol. 1954, 6, 65–84. [Google Scholar] [CrossRef]
- Klem, G.; Luders, H.; Jasper, H.; Elger, C. The ten-twenty electrode system of the International Federation. Electroencephalogr. Clin. Neurophysiol. 1958, 10, 371–375. [Google Scholar]
- Duncan-Johnson, C.C.; Donchin, E. On Quantifying Surprise: The Variation of Event-Related Potentials with Subjective Probability. Psychophysiology 1977, 14, 456–467. [Google Scholar] [CrossRef] [PubMed]
- Koyama, S.; Gunji, A.; Yabe, H.; Oiwa, S.; Akahane-Yamada, R.; Kakigi, R.; Näätänen, R. Hemispheric lateralization in an analysis of speech sounds. Cogn. Brain Res. 2000, 10, 119–124. [Google Scholar] [CrossRef]
- Näätänen, R.; Lehtokoski, A.; Lennes, M.; Cheour, M.; Huotilainen, M.; Iivonen, A.; Vainio, M.; Alku, P.; Ilmoniemiet, R.J.; Luuk, A.; et al. Language-specific phoneme representations revealed by electric and magnetic brain responses. Nature 1997, 385, 432–434. [Google Scholar] [CrossRef]
- Näätänen, R.; Simpson, M.; Loveless, N.E. Stimulus deviance and evoked potentials. Biol. Psychol. 1982, 14, 53–98. [Google Scholar] [CrossRef]


| Participant | CME Deviant vs. Wet Deviant | CME Standard vs. Wet Standard | CME Deviant vs. Wet Standard | CME Standard vs. Wet Deviant |
|---|---|---|---|---|
| 1 | 0.99 | 0.99 | 0.44 | 0.39 |
| 2 | 0.88 | 0.93 | 0.11 | −0.06 |
| 3 | 0.99 | 0.94 | 0.24 | 0.18 |
| 4 | 1.00 | 1.00 | 0.82 | 0.81 |
| 5 | 0.91 | 0.44 | 0.56 | −0.27 |
| 6 | 0.72 | 0.73 | 0.82 | 0.12 |
| 7 | 0.99 | 1.00 | −0.05 | 0.04 |
| 8 | 1.00 | 0.93 | 0.55 | 0.39 |
| 9 | 0.95 | 0.94 | −0.04 | 0.08 |
| 10 | 0.93 | 0.92 | 0.06 | −0.03 |
| 11 | 0.98 | 0.99 | 0.47 | 0.52 |
| mean ± SD | 0.94 ± 0.08 | 0.89 ± 0.17 | 0.36 ± 0.32 | 0.20 ± 0.31 |
| ERP | Characteristics | Left | Right | ||
|---|---|---|---|---|---|
| /itte/ | /itta?/ | /itte/ | /itta?/ | ||
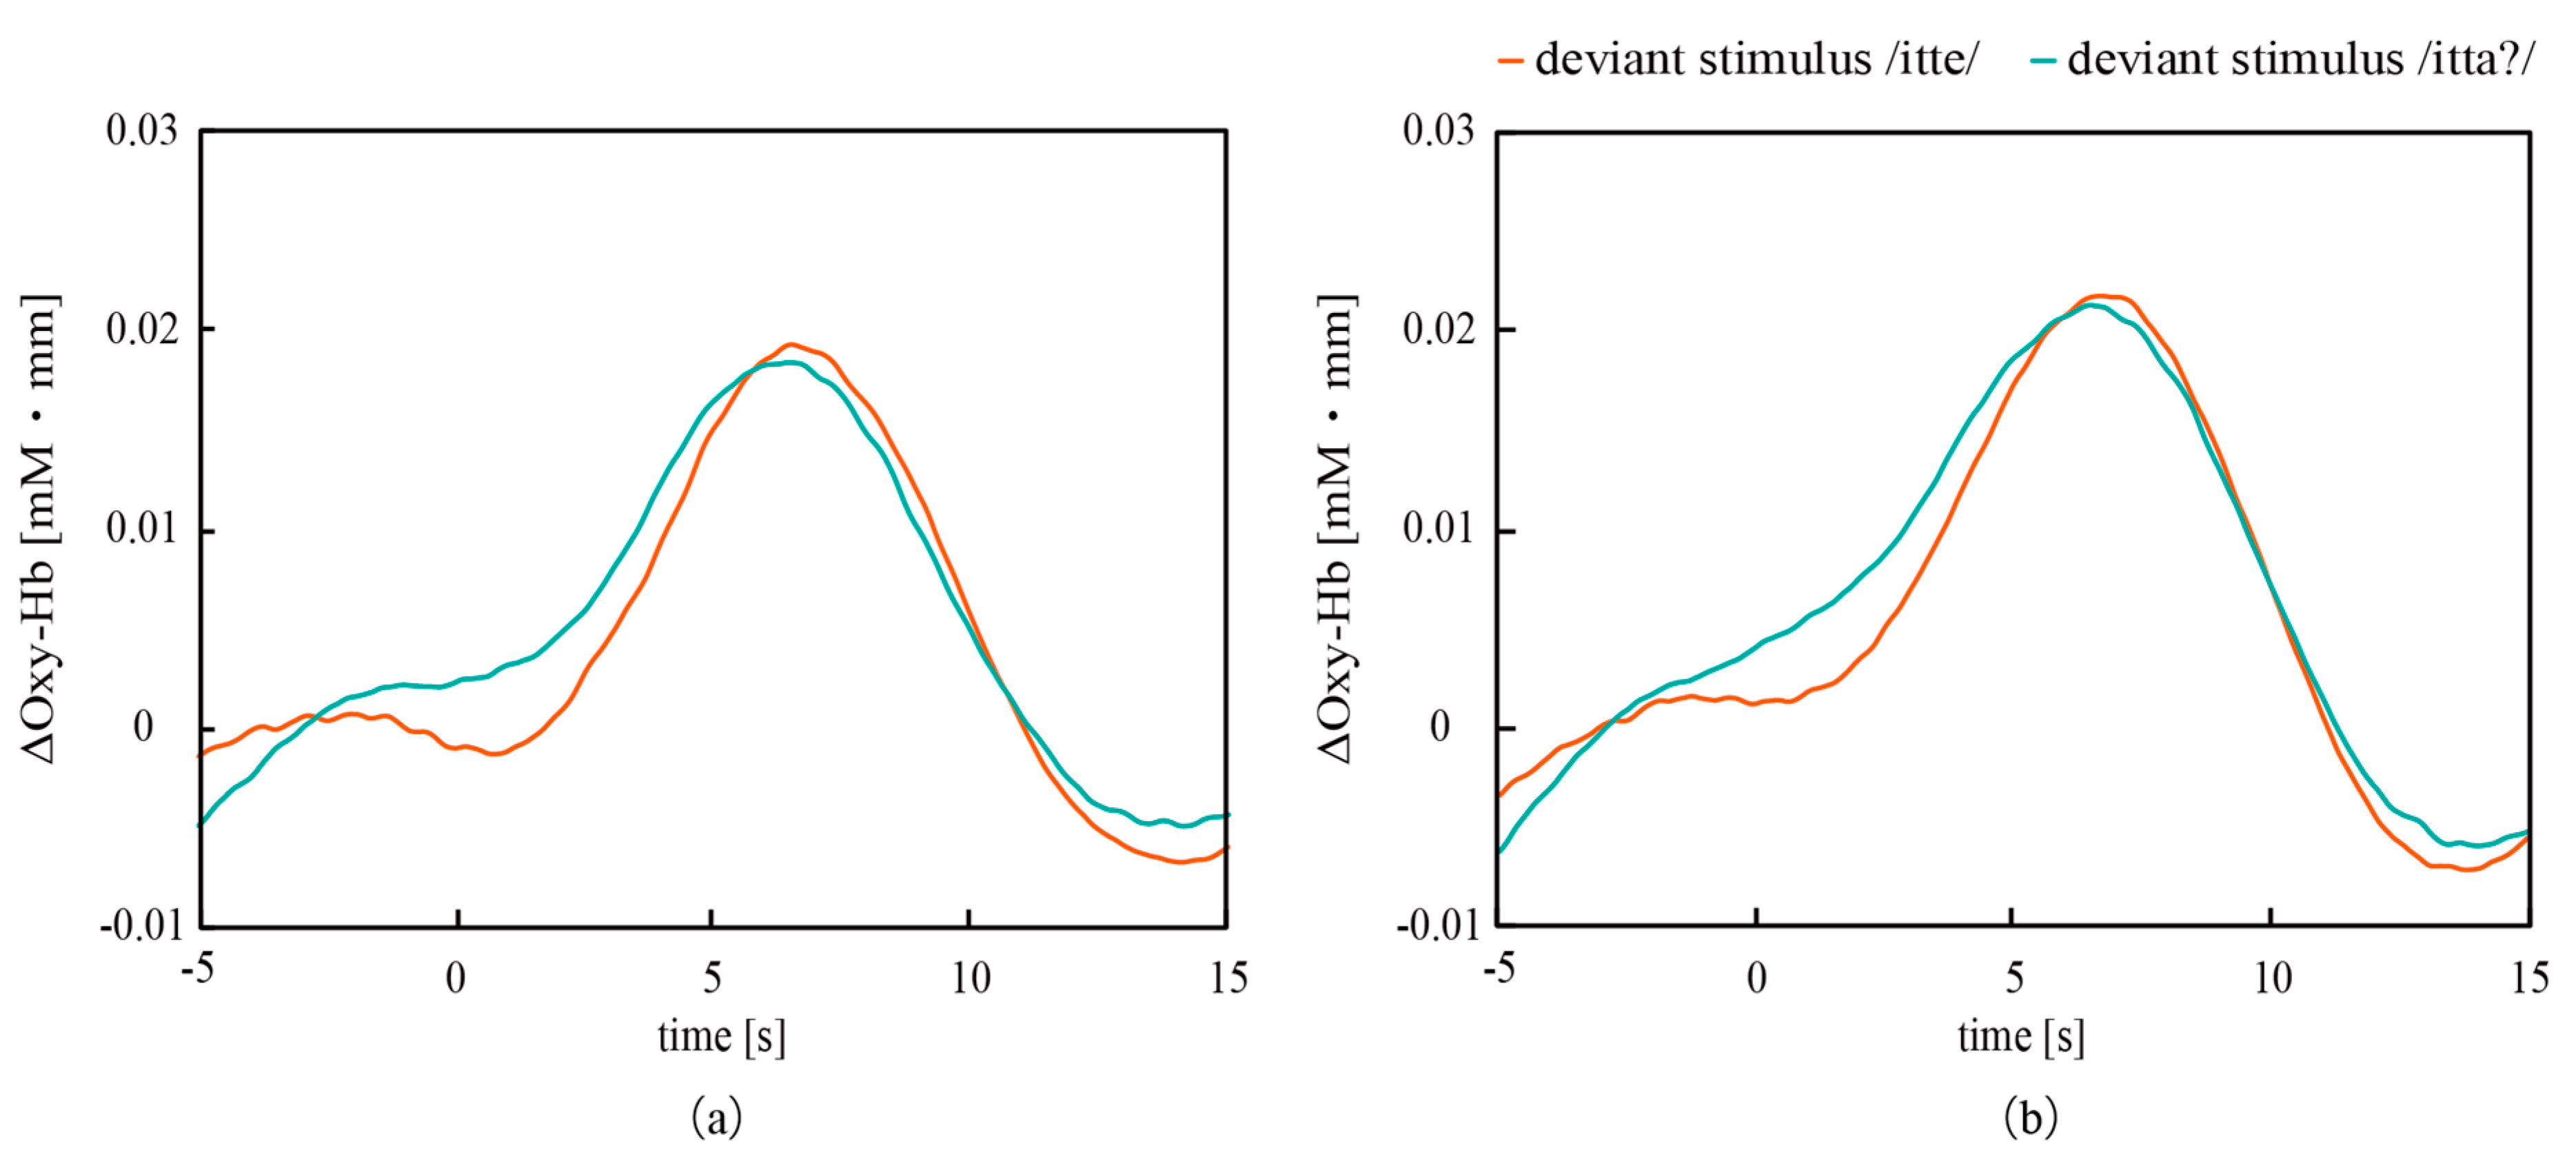
| NIRS | ΔOxy-Hb (−) | 0.0192 | 0.0183 | 0.0218 | 0.0212 |
| Latency (s) | 6.5 | 6.5 | 6.7 | 6.5 | |
| MMN | Amplitude (µV) | −3.69 | −2.74 | −3.51 | −4.25 |
| Latency (ms) | 225 | 237 | 225 | 207 | |
| P300 | Amplitude (µV) | 1.48 | 1.63 | 2.16 | 1.36 |
| Latency (ms) | 397 | 395 | 399 | 388 | |
© 2020 by the authors. Licensee MDPI, Basel, Switzerland. This article is an open access article distributed under the terms and conditions of the Creative Commons Attribution (CC BY) license (http://creativecommons.org/licenses/by/4.0/).
Share and Cite
Yoshida, Y.; Kawana, T.; Hoshino, E.; Minagawa, Y.; Miki, N. Capturing Human Perceptual and Cognitive Activities via Event-Related Potentials Measured with Candle-Like Dry Microneedle Electrodes. Micromachines 2020, 11, 556. https://doi.org/10.3390/mi11060556
Yoshida Y, Kawana T, Hoshino E, Minagawa Y, Miki N. Capturing Human Perceptual and Cognitive Activities via Event-Related Potentials Measured with Candle-Like Dry Microneedle Electrodes. Micromachines. 2020; 11(6):556. https://doi.org/10.3390/mi11060556
Chicago/Turabian StyleYoshida, Yuri, Takumi Kawana, Eiichi Hoshino, Yasuyo Minagawa, and Norihisa Miki. 2020. "Capturing Human Perceptual and Cognitive Activities via Event-Related Potentials Measured with Candle-Like Dry Microneedle Electrodes" Micromachines 11, no. 6: 556. https://doi.org/10.3390/mi11060556
APA StyleYoshida, Y., Kawana, T., Hoshino, E., Minagawa, Y., & Miki, N. (2020). Capturing Human Perceptual and Cognitive Activities via Event-Related Potentials Measured with Candle-Like Dry Microneedle Electrodes. Micromachines, 11(6), 556. https://doi.org/10.3390/mi11060556