Article

Squeezing Dynamic Mechanism of High-Viscosity Droplet and its Application for Adhesive Dispensing in Sub-Nanoliter Resolution

1
Key Laboratory for Micro/Nano Technology and System of Liaoning Province, Dalian University of Technology, Dalian 116024, China
2
Key Laboratory for Precision and Non-Traditional Machining Technology of Ministry of Education, Dalian University of Technology, Dalian 116085, China
*
Authors to whom correspondence should be addressed.
Micromachines 2019, 10(11), 728; https://doi.org/10.3390/mi10110728
Submission received: 16 September 2019 / Revised: 25 October 2019 / Accepted: 26 October 2019 / Published: 28 October 2019
(This article belongs to the Section D:Materials and Processing)

Abstract

:
The dispensing resolution of high-viscosity liquid is essential for adhesive micro-bonding. In comparison with the injection technique, the transfer printing method appears to be promising. Herein, an analytical model was developed to describe the dynamic mechanism of squeezing-and-deforming a viscous droplet between plates in a transfer printing process: as the distance between plates decreases, the main constituents of contact force between the droplet and substrate can be divided into three stages: surface tension force, surface tension force and viscous force, and viscous force. According to the above analysis, the transfer printing method was built up to dispense high-viscosity adhesives, which replaced the geometric parameters, utilized the critical contact force to monitor the adhesive droplet status, and served as the criterion to trigger the liquid-bridge stretching stage. With a home-made device and a simple needle-stamp, the minimum dispensed amount of 0.05 nL (93.93 Pa·s) was achieved. Moreover, both the volume and the contact area of adhesive droplet on the substrate were approximately linear to the critical contact force. The revealed mechanism and proposed method have great potential in micro-assembly and other applications of viscous microfluidics.

1. Introduction

Adhesive micro-bonding mainly refers to joining micro-components with liquid adhesive at approximately the picoliter to nanoliter level. In comparison with welding, thermal bonding, electrostatic bonding etc., it has many advantages including no requirement of high temperature and pressure, simple implementation, and low stress [1,2,3]. Therefore, it is widely used in assembly of microsystems such as micro-gyroscopes, micro-accelerometers etc. [4,5]. Since the bonding strength is generally proportional to the viscosity, a high-viscosity adhesive (>1 Pa·s) is often selected to ensure the joint strength. However, excessive adhesive at the joint will lead to creeping, contamination etc., whereas insufficient adhesive will directly lead to the decline of joint strength [6,7,8]. Obviously, the dispensing resolution is essential for adhesive micro-bonding. Traditionally, the injection has been often used for liquid dispensing [9,10]. However, to obtain the sub-nanoliter liquid, the inner diameter of a hollow needle has to be decreased to a few microns, thus the flow resistance caused by high-viscosity will become very high and the needle is easily blocked too [11]. Therefore, the application of injection is still difficult for the dispensing of high-viscosity adhesive in sub-nanoliter resolution.
Alternatively, the method of transfer printing appears to be promising, in which a stamp is used to dip liquid and then the dipped liquid is transferred onto the substrate by contact printing. Since it is based on surface flow rather than internal pipe flow, the effect of high flow resistance can be significantly reduced. Transfer printing with microarray has been utilized to produce micropatterns of various biomolecules and photoresists [12,13]. However, the viscosity in transfer printing was mostly limited to no more than 1 Pa·s [14]. Thus only effects of surface tension and solute-diffusion were considered in detail and viscous effect was often neglected.
The essence of common transfer printing is a break-up process of the liquid-bridge between an upper plate (stamp) and a lower one (substrate). Previous research has indicated that the initial geometric parameters at the beginning of liquid-bridge stretching have critical influences on the final transferred volume on the substrate. For example, Zhang et al. studied the liquid-bridge break-up phenomenon between two cylindrical rods. It was found that the transfer ratio increases about from 70% to 90% with the increase of contact area of the droplet on the lower rod from 314 to 2826 mm2, following the decrease of distance between two rods [15]. Chen et al. investigated the liquid-bridge break-up in the microliter level. Their results indicated that the transfer ratio increases by about two times as the initial distance of the two plates decreases from 0.778 to 0.302 mm [16]. Huang et al. developed two-dimensional (2D) axisymmetric models about the stretching of the liquid-bridge and compared the theoretical predictions with the previously published experimental data (Chen et al.). The resulting predictions were consistent with the experimental observations. The prediction results also showed that the factor that mainly dominates the transfer ratio changes from the wettability difference between two plates to the viscous force with the increase of capillary numbers [17]. However, as the amount of transferred volume reduces to the sub-nanoliter level, the initial distance of the two plates and contact area of fluid on substrate will decrease to a few microns and dozens of square microns respectively. It is inconvenient and time-consuming to measure and adjust them with optical microscopy for industrial applications.
Herein, an analytical model was developed to describe the dynamic mechanism of squeezing-and-deforming of a droplet between plates. It showed that in the case of the squeezing process, the contribution of the viscous effect to the contact force and contact area of the droplet on the substrate is dominant, following the decrease of distance between stamp and substrate. According to the above, the transfer printing method was built up to dispense the high-viscosity adhesive, which replaced the geometric parameters, utilized the contact force to monitor the droplet status, and served as the criterion to trigger the followed stretching of the liquid-bridge. With a home-made device and a needle-stamp, the minimum dispensed amount of 0.05 nL (93.93 Pa·s) was achieved. Moreover, both the volume and contact area were approximately linear to the critical contact force. The method has a great potential in micro-assembly and other applications of viscous microfluidics.

2. Principles and Modeling

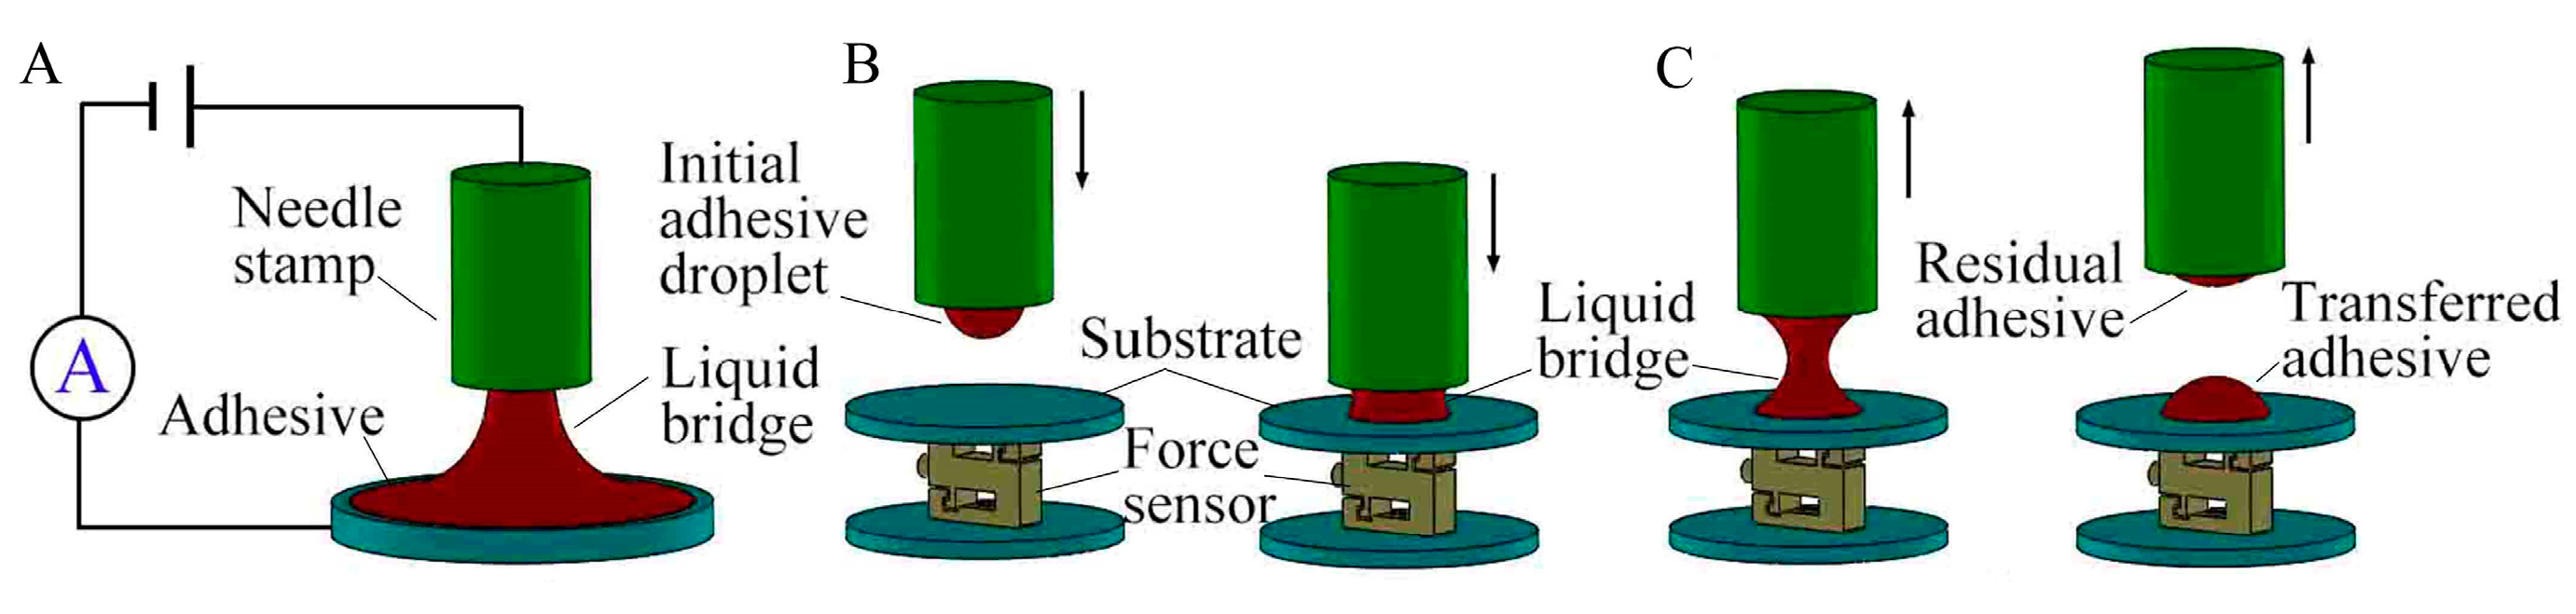
2.1. Transfer Printing Principle

The proposed transfer printing process can be divided into three stages: dipping-up, squeezing, and stretching, as shown in Figure 1.
In the dipping-up stage, a needle-stamp is kept at a constant distance from the viscous liquid level and an electric potential is applied between the liquid and the stamp. Thus, driven by Coulomb force, some liquid is stretched up to contact the stamp. Then the stamp is lifted up until the liquid-bridge breaks and thus a droplet is dipped onto the stamp. Here we only used the method to acquire the constant initial volume of droplet. An in-depth explanation of the electrokinetic phenomenon can be found in other references [18,19,20]. In the squeezing stage, the stamp with the initial droplet is positioned above the substrate. Then it slowly moves down to contact and then squeeze the substrate, during which the contact force FC is generated by the squeezing effect on the substrate. Thus the FC is defined as the force of the droplet acting on the substrate and measured with a force sensor. As a result, a liquid-bridge between the stamp and the substrate is formed and then deformed with continuous squeezing. Once the contact force FC reaches a defined threshold (critical contact force FCC), the stretching stage is triggered and the stamp is lifted up until the liquid-bridge is pulled off. Consequently, part of the liquid is transferred to the substrate.

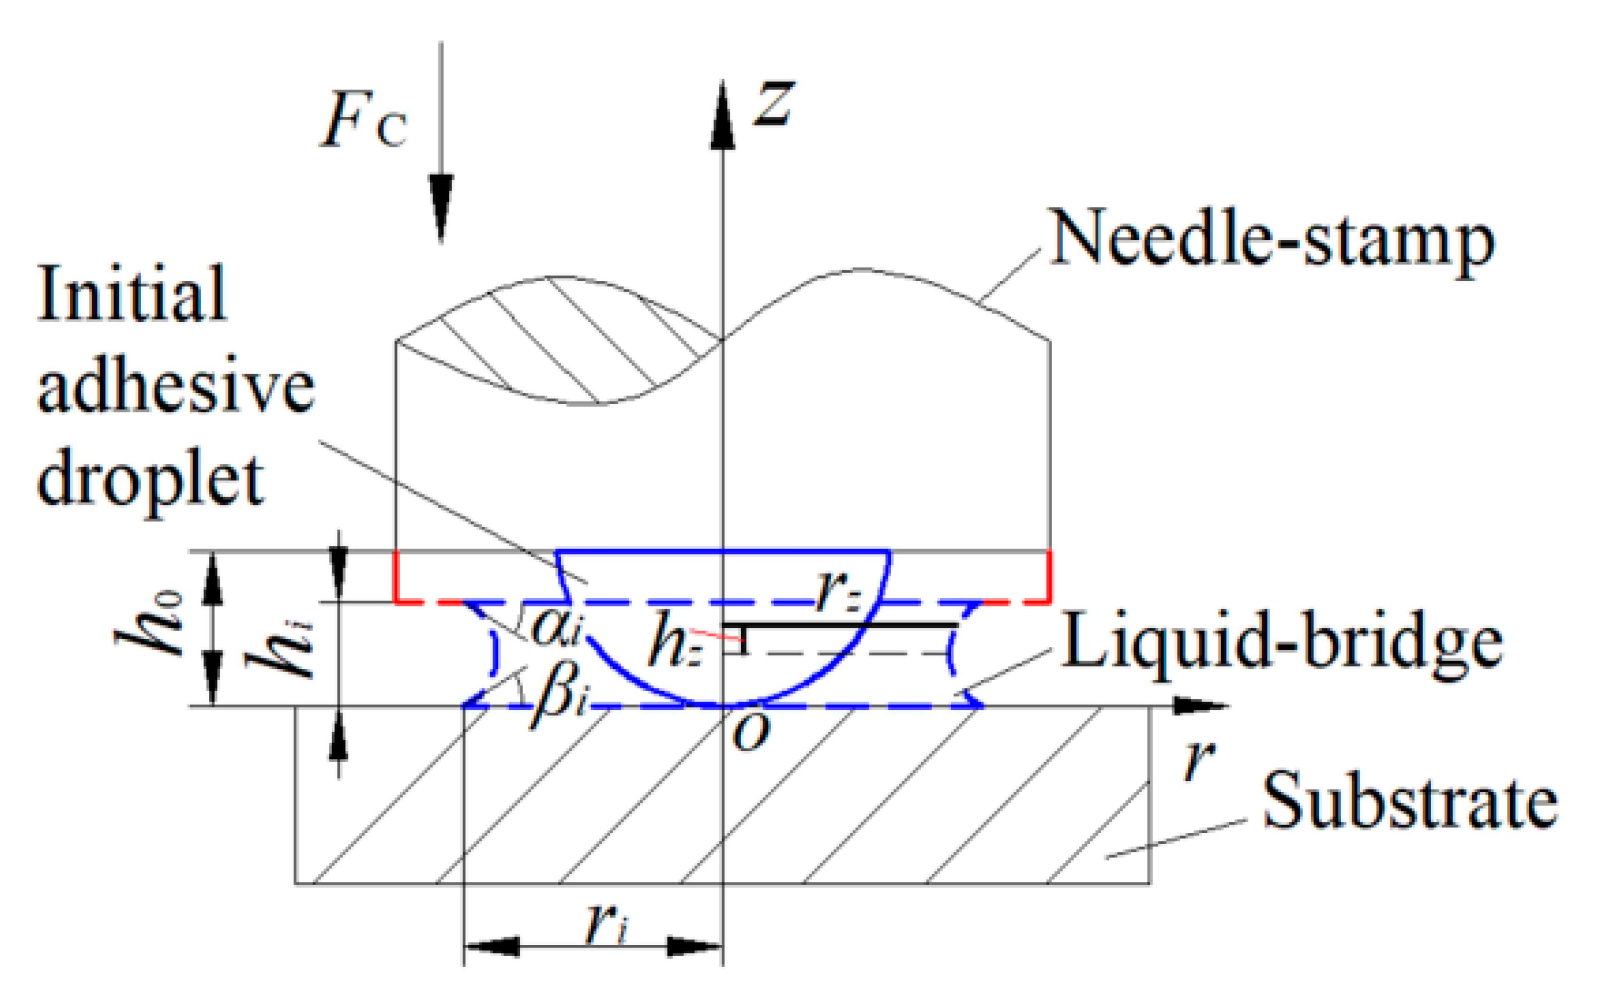
2.2. Modeling of Squeezing-and-Deforming of Initial Droplet

In the squeezing stage, the stamp keeps a constant descent velocity of U to squeeze the initial droplet. The contact force FC on the substrate mainly comes from the contribution of the viscous force (Fv) and surface tension force (Fs). Thus, the starting point is the fundamental Navier–Stokes equation under cylindrical coordinates (r, θ, z) as shown in Equation (1):
ρ u t + ρ u u = f p + μ 2 u ,
where ρ is the liquid density, t is the squeezing time, u is the flow velocity, f is the body force, p is the pressure, µ is the liquid viscosity. In order to solve Equation (1), some assumptions for the formed liquid-bridge between the needle-stamp and the substrate are made as follows:
  • The liquid-bridge is axisymmetric and incompressible with low Reynolds number Re ( Re < 1 ,   p / θ = 0 ,   ρ u / t + ρ u u 0 ).
  • The wettability of the stamp is similar to that of the substrate, thus the contact angle αi on the needle-stamp is approximately equal to the contact angle βi on the substrate, and the meniscus of the liquid-bridge is assumed to be the concave surface of the spherical cap, shown in Figure 2.
  • The height of the liquid-bridge hi is much smaller than the contact radius ri between the liquid-bridge and the substrate. Then the slit between stamp and substrate is formed, and the pitch of slit is equal to hi ( p / z = 0 ) [21].
  • The gravity in sub-nanoliter level can be ignored under low Bond number Bo ( B o < 1 ,   f = 0 ). Thus, the dominating terms are those considering the pressure gradients and the shear stress derivatives in the z-direction. Equation (1) can therefore be simplified to Equation (2).
The calculation of Reynolds and Bond numbers is shown in Section 4.1 in detail.
p r = μ 2 u r z 2 .
Based on the boundary conditions ur = 0 at z = 0 and ur = 0 at z = hi [22,23], the velocity distribution function can be solved by:
u r = p r ( 1 2 μ z 2 h i 2 μ z ) .
This velocity distribution satisfies the mass conservation equation π r 2 U = 0 h i 2 π r u r d z , thus Equation (3) can be induced to:
p ( r ) = 3 μ U h i 3 r 2 + p C .
In the Equation (4), the boundary condition p [ r i ( h i / 2 cos α i h i tan α i / 2 ) ] on the meniscus surface is equal to Δ p L . Δ p L = γ ( 1 / R 1 + 1 / R 2 ) is the Laplace pressure, γ is surface tension, R 1 = r i and R 2 = h i / 2 cos α i are the principal curvature radii of meniscus. Thus the pressure distribution function can be expressed as Equation (5) based on the boundary condition.
p ( r ) = 3 μ U h i 3 { r 2 [ r i ( h i 2 cos α i h i tan α i 2 ) ] 2 } + γ ( 1 r i + 1 h i / 2 cos α i ) .
Then the contact force FC on the substrate is given by
F C = F v + F s = 0 r i p ( r ) 2 π r d r = 6 π μ U h i 3 [ r i 4 4 r i 4 2 [ r i ( h i 2 cos α i h i tan α i 2 ) ] 2 ] [ π γ r i 2 ( 1 r i + 1 h i / 2 cos α i ) ]
where the relationship between hi and ri can be obtained by the volume conservation before and after being squeezed: 2 3 π h 0 3 = π r i 2 h i π 3 ( h i 2 cos α i h i tan α i 2 ) [ 3 h i 2 4 + ( h i 2 cos α i h i tan α i 2 ) 2 ] . Therefore, the contact force FC can be solved by the geometric parameters including the stamp descent velocity U, adhesive viscosity μ, contact radius ri, the slit pitch hi, contact angle αi, and initial droplet height h0.
In summary, the essence of this model is to control the deformation of the liquid-bridge profile by the contact force, and thus control the amount of transferred liquid that will follow. Moreover, the liquid-bridge deformation model proposed by Amirfazli et al. has also attracted our attention. The principle of this model is to obtain the profile of the liquid-bridge based on the effect of contact angle hysteresis (CAH), thereby controlling the liquid transfer [24]. Compared to the model of Amirfazli et al., the difference of two models is that the method of controlling the profile of the liquid-bridge is different. What the two models have in common is that the initial distance between the two surfaces affects the deformation behavior of the liquid-bridge during the squeezing process.

3. Materials and Methods

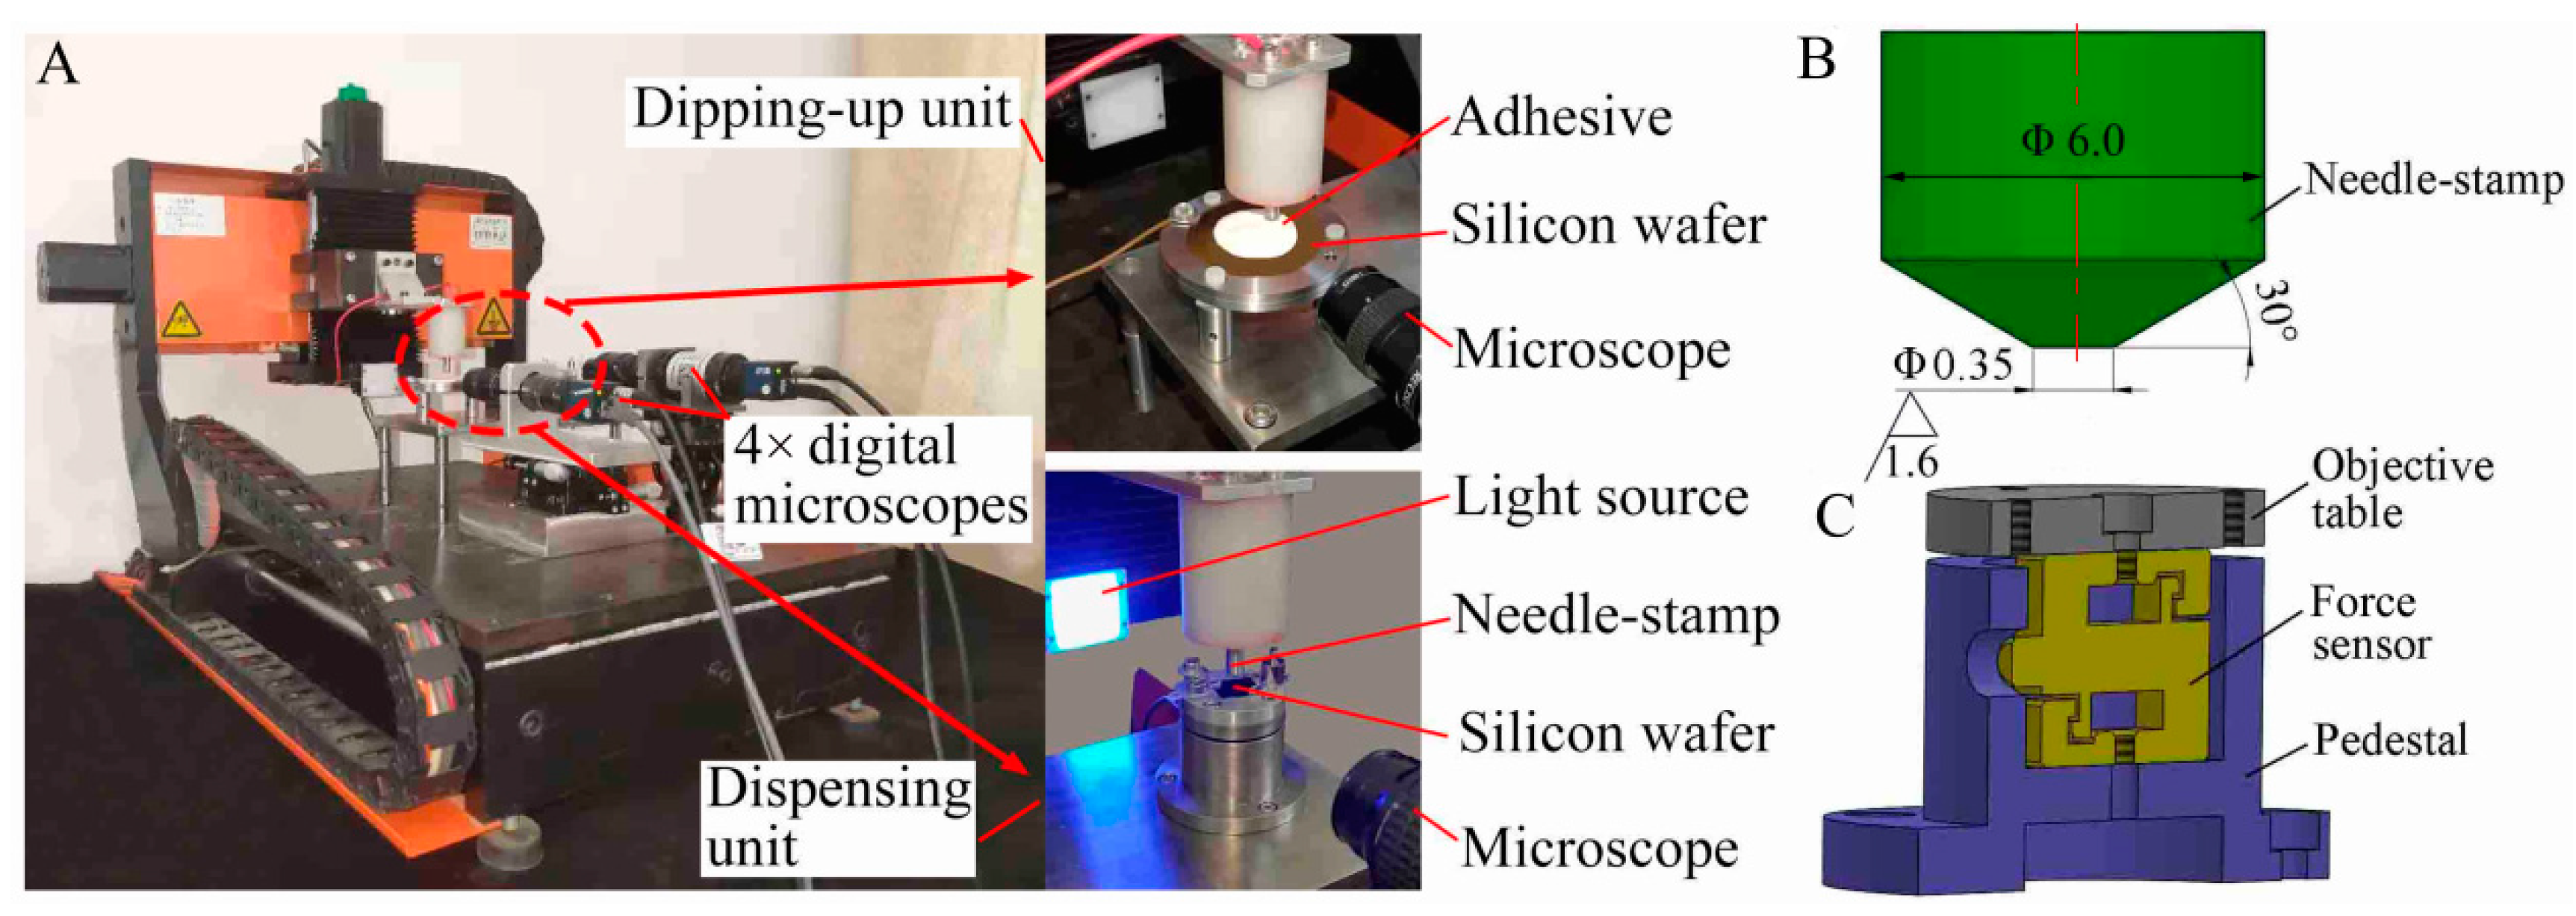
3.1. Materials and Instruments

The selected liquid for experiment was an epoxy-based structural adhesive (EA 0151 Part A, Henkel Loctite, Dusseldorf, Germany). Its surface tension and contact angle on steel and silicon wafer were measured by a drop shape analyzer (DSA100, Kruss, Hamburg, Germany). The viscosity was measured with a viscosity meter (NDJ-8S, Shanghai Precision Instrument, Shanghai, China). The density was obtained by the weighing method with an electronic balance (JA1003, Tianjin Precision Instrument, Tianjin, China) and a measuring cylinder (5 mL). Measurement of all the above parameters was performed in the clean room (constant temperature 25 °C), and the measured results are shown in Table 1.
The experimental dispensing device was home-made as shown in Figure 3A, which consisted of three units: dipping-up unit, dispensing unit, and positioning unit. The dipping-up unit mainly included a stainless-steel needle-stamp (Figure 3B), a gold-plated silicon wafer, and some fixtures for the needle-stamp and gold-plated silicon wafer. The dispensing unit mainly included the needle-stamp with the initial adhesive droplet, silicon wafer, and force sensor (resolution 1 mN, LH-S09A-200g, Shanghai Sensing Technology, Shanghai, China). The silicon wafer was placed on the force sensor, shown in Figure 3C. The positioning unit was used to move the stamp in three dimensions. In addition, the adhesive volume V and its contact area Sa–s on the substrate could be measured with a 4× digital microscope. The measured transferred volumes were verified with a confocal laser scanning microscope (CLSM, VK-X200, Keyence, Osaka, Japan), as shown in Figure 4G.

3.2. Experimental Process

The experimental process is shown in Figure 4A–F: (A) some adhesive was stretched up by Coulomb force under a suitable electric potential; (B) a liquid-bridge between the needle-stamp and the liquid level of adhesive was formed; (C) an adhesive droplet was dipped onto the needle-stamp with the liquid-bridge breakup; (D) the initial adhesive droplet was squeezed under the increasing contact force FC, during which a liquid-bridge was formed and deformed; (E) until FC reached a defined value of 1 mN (FCC), the liquid-bridge was immediately stretched; (F) the liquid-bridge breaks and part of it was kept on the silicon wafer by the adhesive effect. The dispensing process was repeated five times for each defined contact force from 1 to 5 mN, shown in Figure 5.

3.3. Calculation of Adhesive Volume

The initial adhesive droplets were obtained with electrokinetic dipping-up as shown in the red dashed rectangle of partial enlarged drawing of Figure 4C. The transferred adhesive droplet is shown in a red dashed rectangle of Figure 4F. Their volumes V and contact areas Sa–s could be obtained by image characteristic extraction and calculation with Equation (7).
V = i = 1 n π x i 2 h p   ( i = 1 ,   2 ,   3 · · · · · · ) ;   S a s = π x 1 2 ,
where the initial and transferred droplets in the image can be divided into n micro-cylinders with the height of one unit pixel hp from top to bottom. The unit pixel hp is equivalent to 1.9 μm via spatial calibration. xi is the radius of the i-th micro-cylinder. The first micro-cylinder (i = 1) is in contact with the substrate, and so on. Similarly, the initial adhesive height h0 and the slit pitch hi could be obtained, shown in Table 2.
Moreover, the difference of transferred volumes that were respectively measured with optical imaging and CLSM was about one picoliter as shown in Figure 6A. Thus the measured method with optical imaging was considered to be accurate and reliable. Under the critical contact force FCC from 1 to 5 mN, the variation of squeezed contact angles (Figure 4D) on the stamp and the substrate was obtained by image processing, shown in Figure 6B. Since the difference of squeezed contact angles αi and βi was less than 2°, αi could be considered to be approximately equal to βi in squeezing process.

4. Results and Discussions

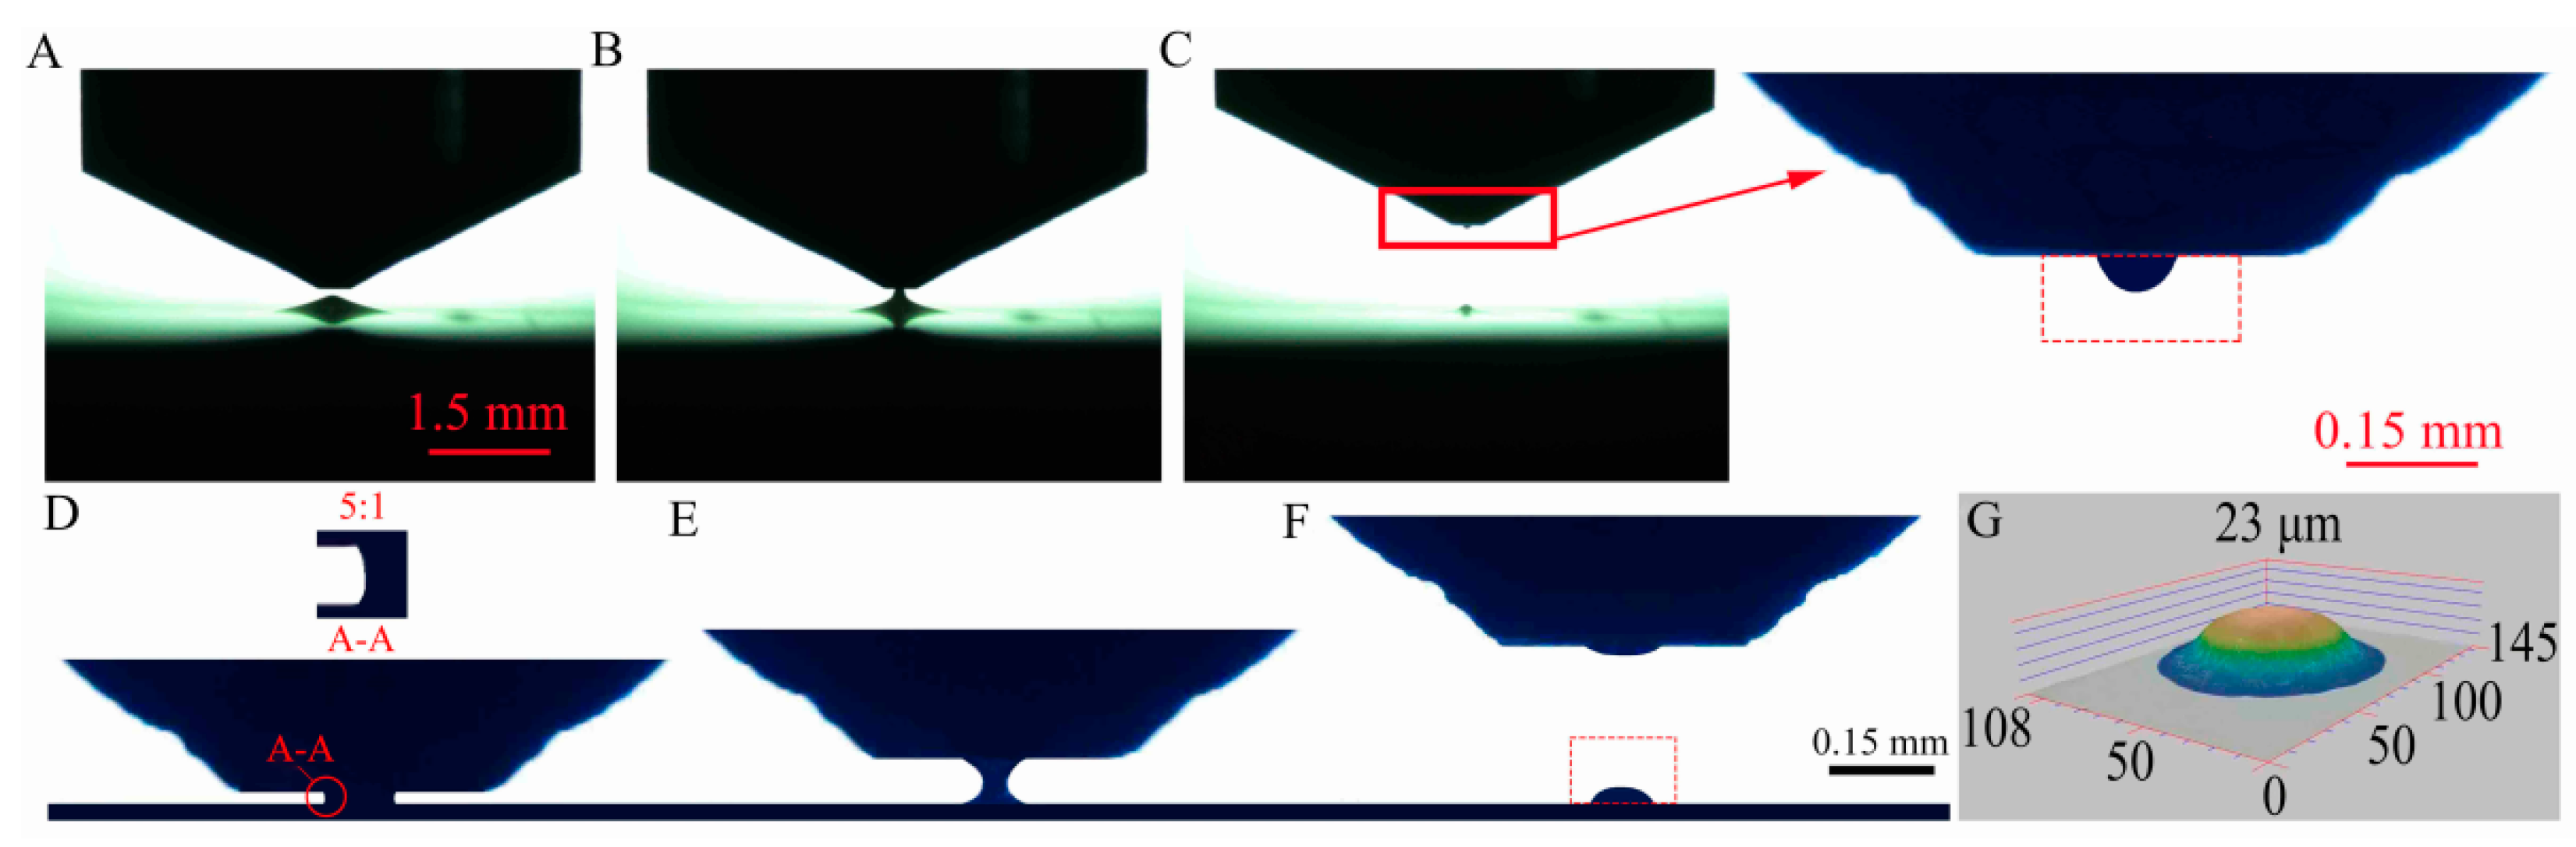
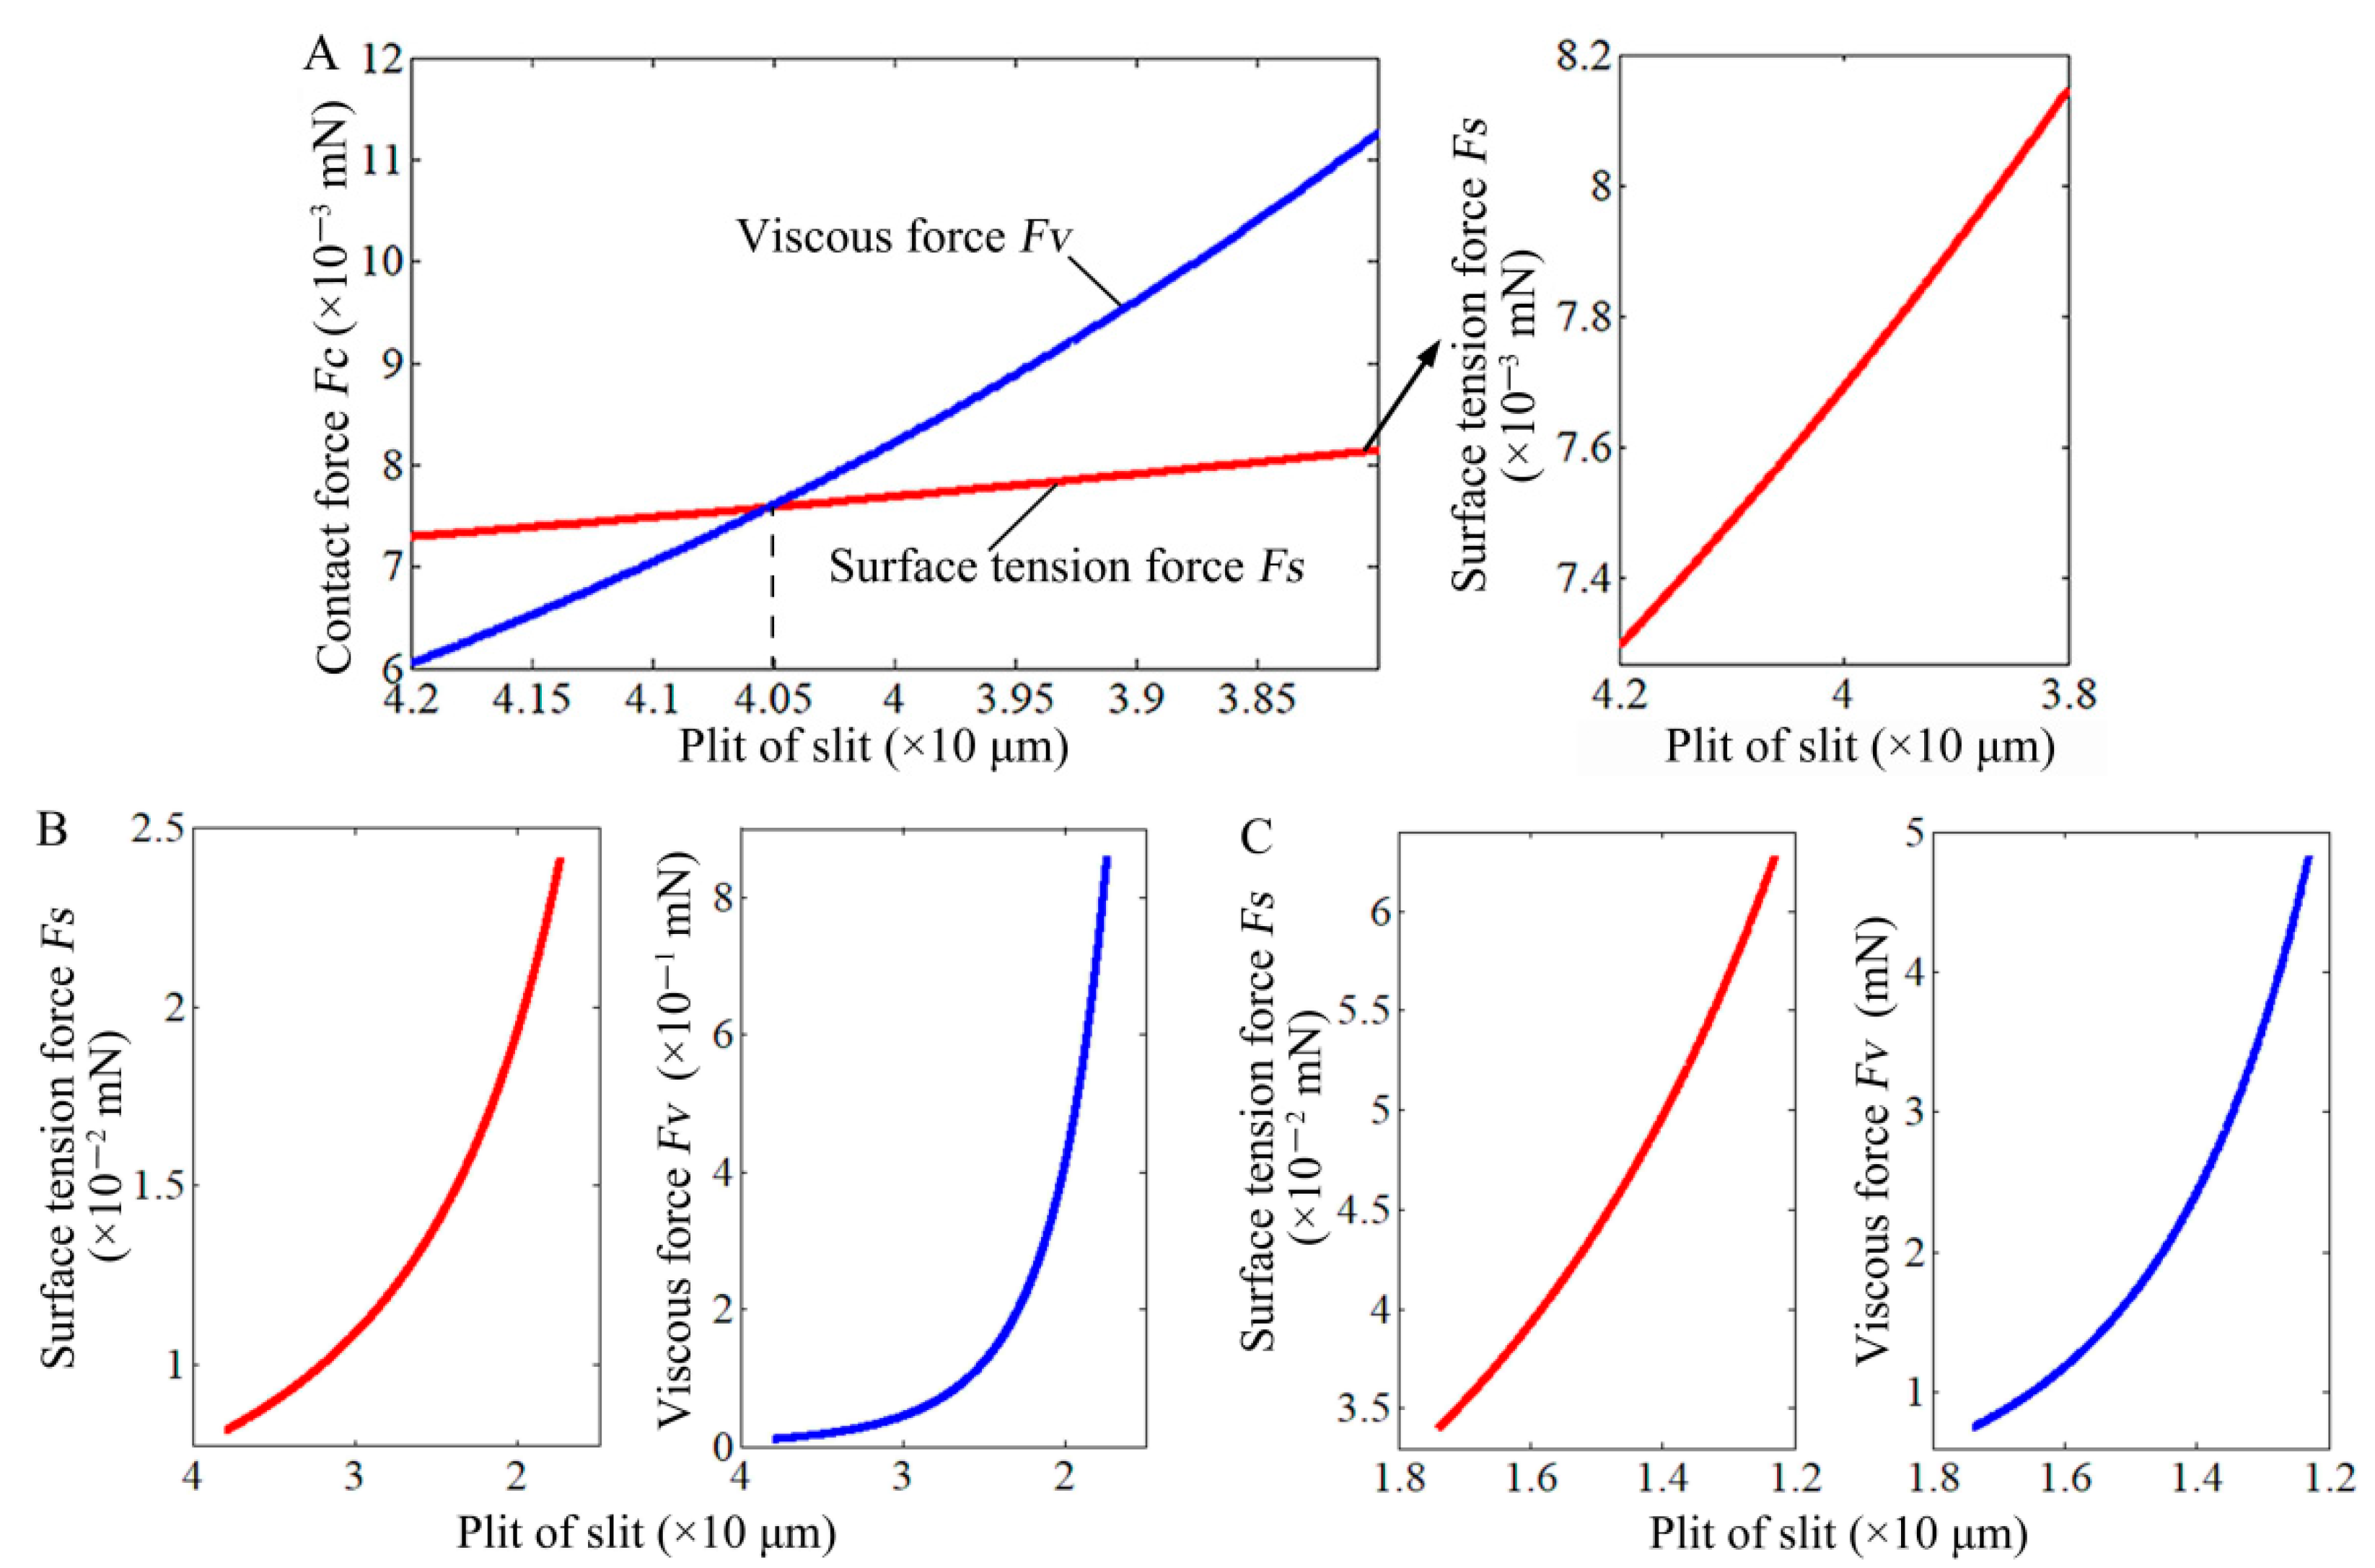
4.1. Analysis of the Squeezing-and-Deforming Process of a Droplet

The main contribution to contact force FC changed from surface tension force Fs to viscous force Fv with the decrease of slit pitch in the squeezing process. Herein, as the needle-stamp with initial droplet volume 0.15 nL pressed toward the substrate under FC from 1 to 5 mN, the variation of Fv and Fs were summarized by MATLAB based on Equation 6 (other relevant parameters as shown in Table 1 and Table 2, Figure 6B).
Generally, as a high-viscosity microdroplet was squeezed in the slit, both Re = ρ U ¯ L / μ and B o = ρ g L 2 / γ were very low due to the restriction of high-viscosity and volume of sub-nanoliter level, where ρ is the droplet density and L is the characteristic length (initial height h0 of the slit). U ¯ S m U / S c is defined as the average velocity, which could be estimated by the volume flow conservation. Sm is the average contact area at 1–5 mN, S c 2 r i h i is the longitudinal cross-sectional area of the slit (17.4–12.3 μm) at 1–5 mN. Thus U ¯ was 0.35–0.65 mm/min, Re was about 4.8 × 10⁻⁶ to 8.98 × 10⁻⁹, and Bo was about 0.9 × 10⁻³. Therefore, the squeezing-and-deforming process satisfied the requirements of low Reynolds and Bond numbers.
In the initial stage of squeezing, the initial droplet was squeezed under a smaller FC, the slit pitch decreased from 42.0 to 38.0 μm. At 42.0 μm, Fs was 7.3 × 10⁻³ mN, Fv was 6.1 × 10⁻³ mN, and Fs was greater than Fv (Figure 7A). As the slit pitch decreased, both Fs and Fv increased, but Fv increased faster, to 40.5 μm, Fv was equal to Fs. As the slit pitch continued to decrease, Fv was greater than Fs. When the slit pitch reduced to 17.4 μm with FC of 1 mN, Fs was 2.4 × 10⁻² mN, Fv was 0.9 mN (Figure 7B). The slit pitch decreased continuously to 12.3 μm with FC of 5 mN, Fs was 6.3 × 10⁻² mN, Fv was 4.8 mN (Figure 7C). Thus, Fv was far much greater than Fs as the slit pitch decreased from 17.4 to 12.3 μm.
Based on the above analysis, the main contribution to FC could be divided into three stages in the squeezing process. In the initial stage, from the variation tendency of Figure 7A, FC was primarily derived from the contribution of Fs. As the slit pitch decreased to 40.5 μm, the contribution of Fs and Fv to FC was equal. When the slit pitch continued to decrease from 17.4 to 12.3 μm (1–5 mN), Fs was increased about two times, but its contribution to FC could be ignored compared to Fv (Fv >> Fs). Thus, FC mainly came from the contribution of Fv under this stage. Especially, the smaller slit pitch would make the dominant role of Fv even more pronounced.
As a result, when the high-viscosity adhesives (93.93 Pa·s) was squeezed from 1 to 5 mN (17.4–12.3 μm) in the paper, Equation (6) could be simplified to F C 6 π μ U h i 3 [ r i 4 4 r i 4 2 ( r i C ) 2 ] , C = h i / 2 cos α i h i tan α i / 2 , the volume conservation could be simplified to 2 3 π h 0 3 = π r i 2 h i π 3 C ( 3 h i 2 4 + C 2 ) . According to the two simplified formulas, as the adhesive droplet was squeezed under 1–5 mN, the variation of contact area S a s = π r i 2 in the theoretical calculation is shown in Figure 8. The results from theoretical calculation show that the Sa–s approximately linearly increases with the increasing of force, which is consistent with the experimental results.
In the two simplified formulas, since the value of C is a constant less than 3 μm under 1–5 mN (ri >> C), Equation (6) can be further simplified to F C 3 π μ U r i 4 / 2 h i 3 , and thus the volume conservation is 2 π h 0 3 / 3 π r i 2 h i . By solving the above two equations, F C 2 π μ U h 0 6 / 3 h i 5 1 / h i 5 and F C 81 π μ U r i 10 / 16 h 0 9 r i 10 can be obtained. Thus, as the contact force FC increases, the slit pitch (height of liquid-bridge) hi and contact radius ri are amplified in power. Consequently, as the force increases, a small change in the slit can lead to a slow increase in the contact area Sa–s. This phenomenon can significantly lead to an improvement in the dispensing resolution. Interestingly, this analysis result further validated the linear increase in contact area Sa–s of Figure 8.

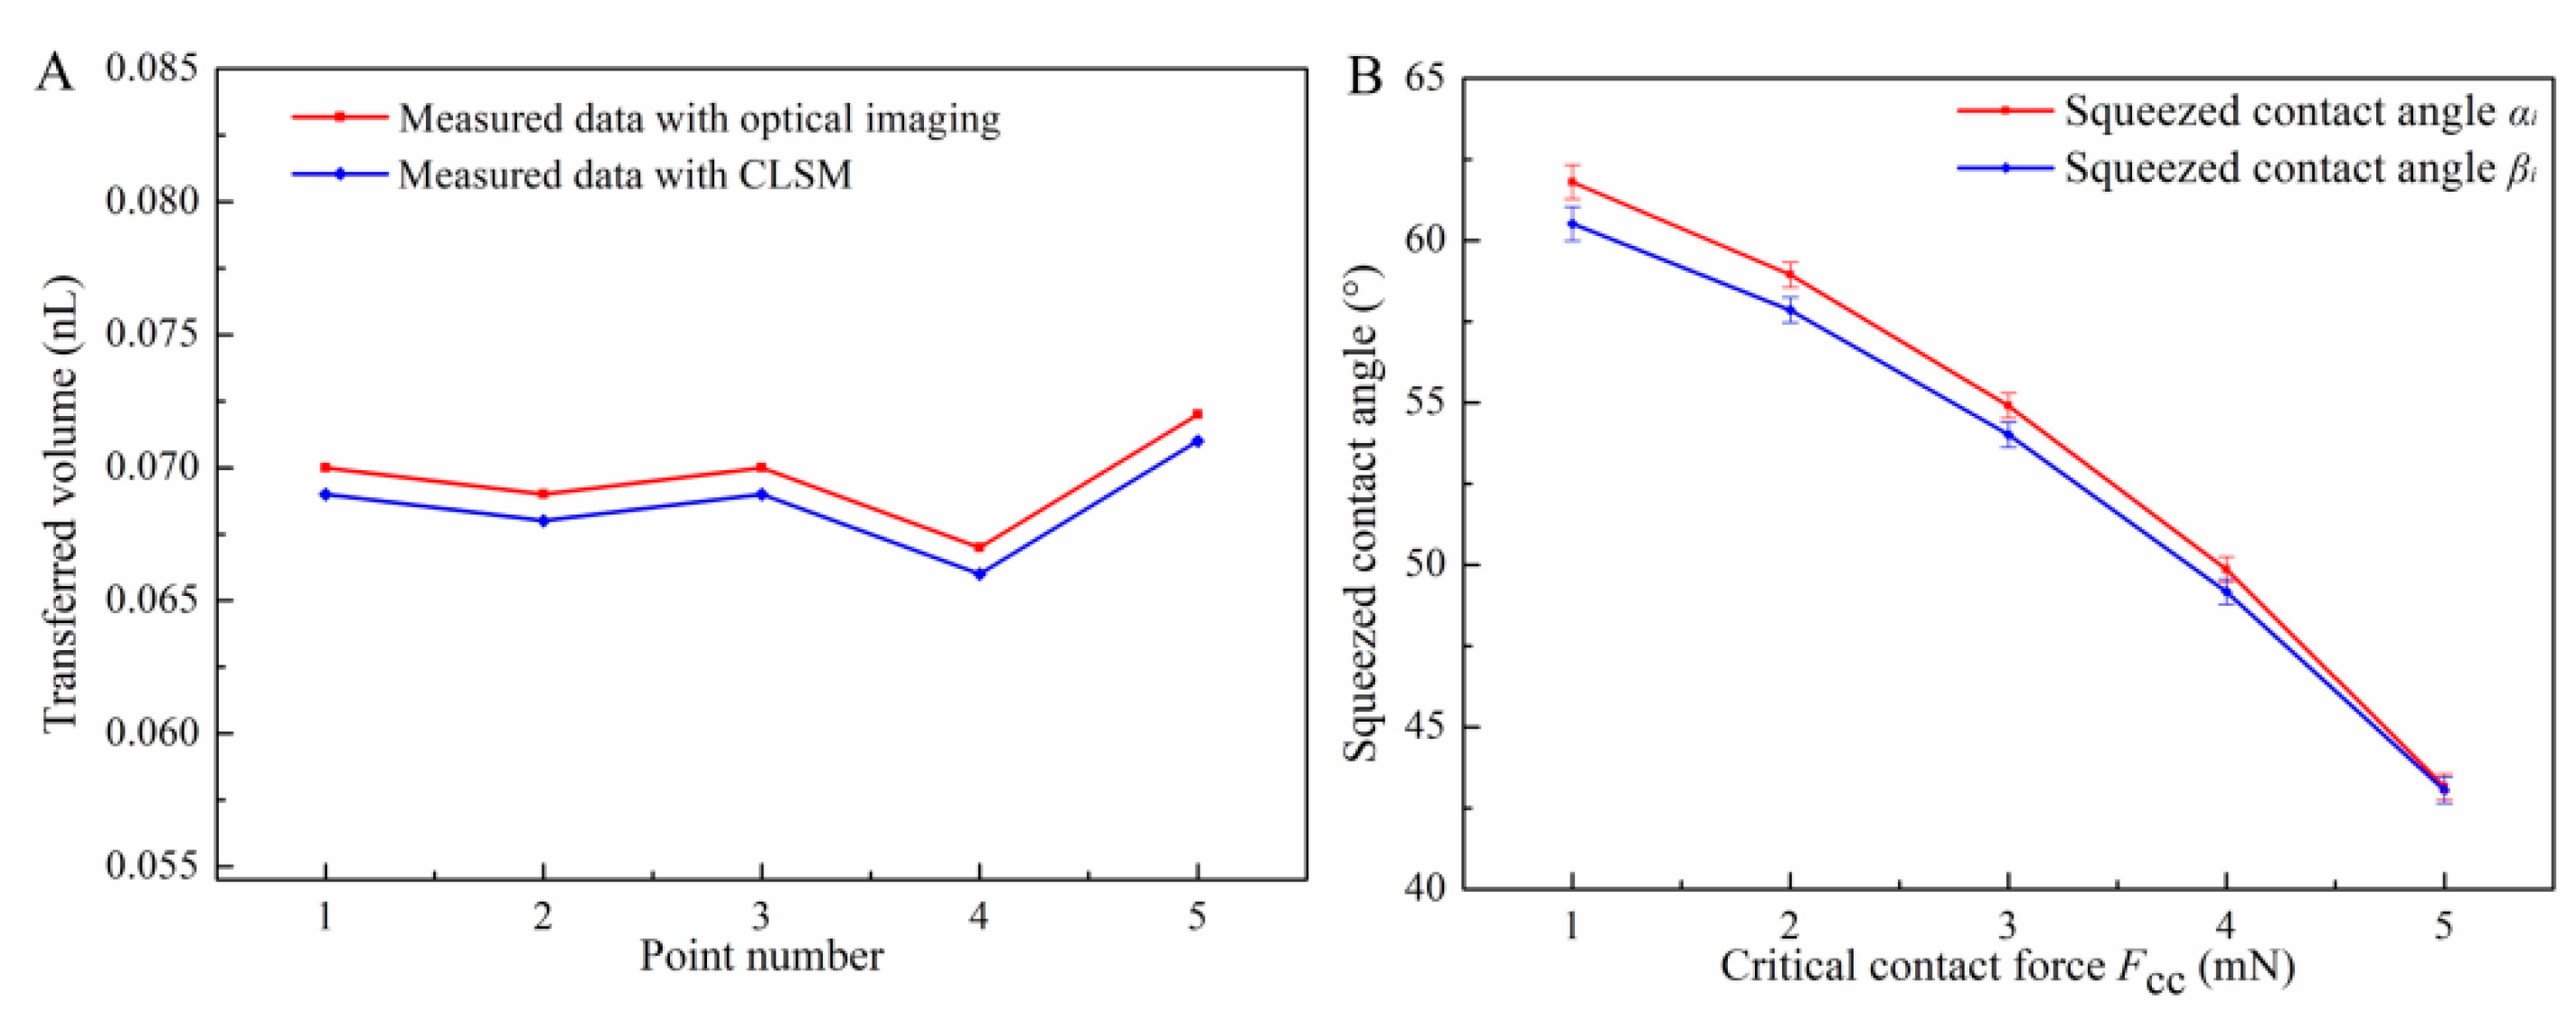
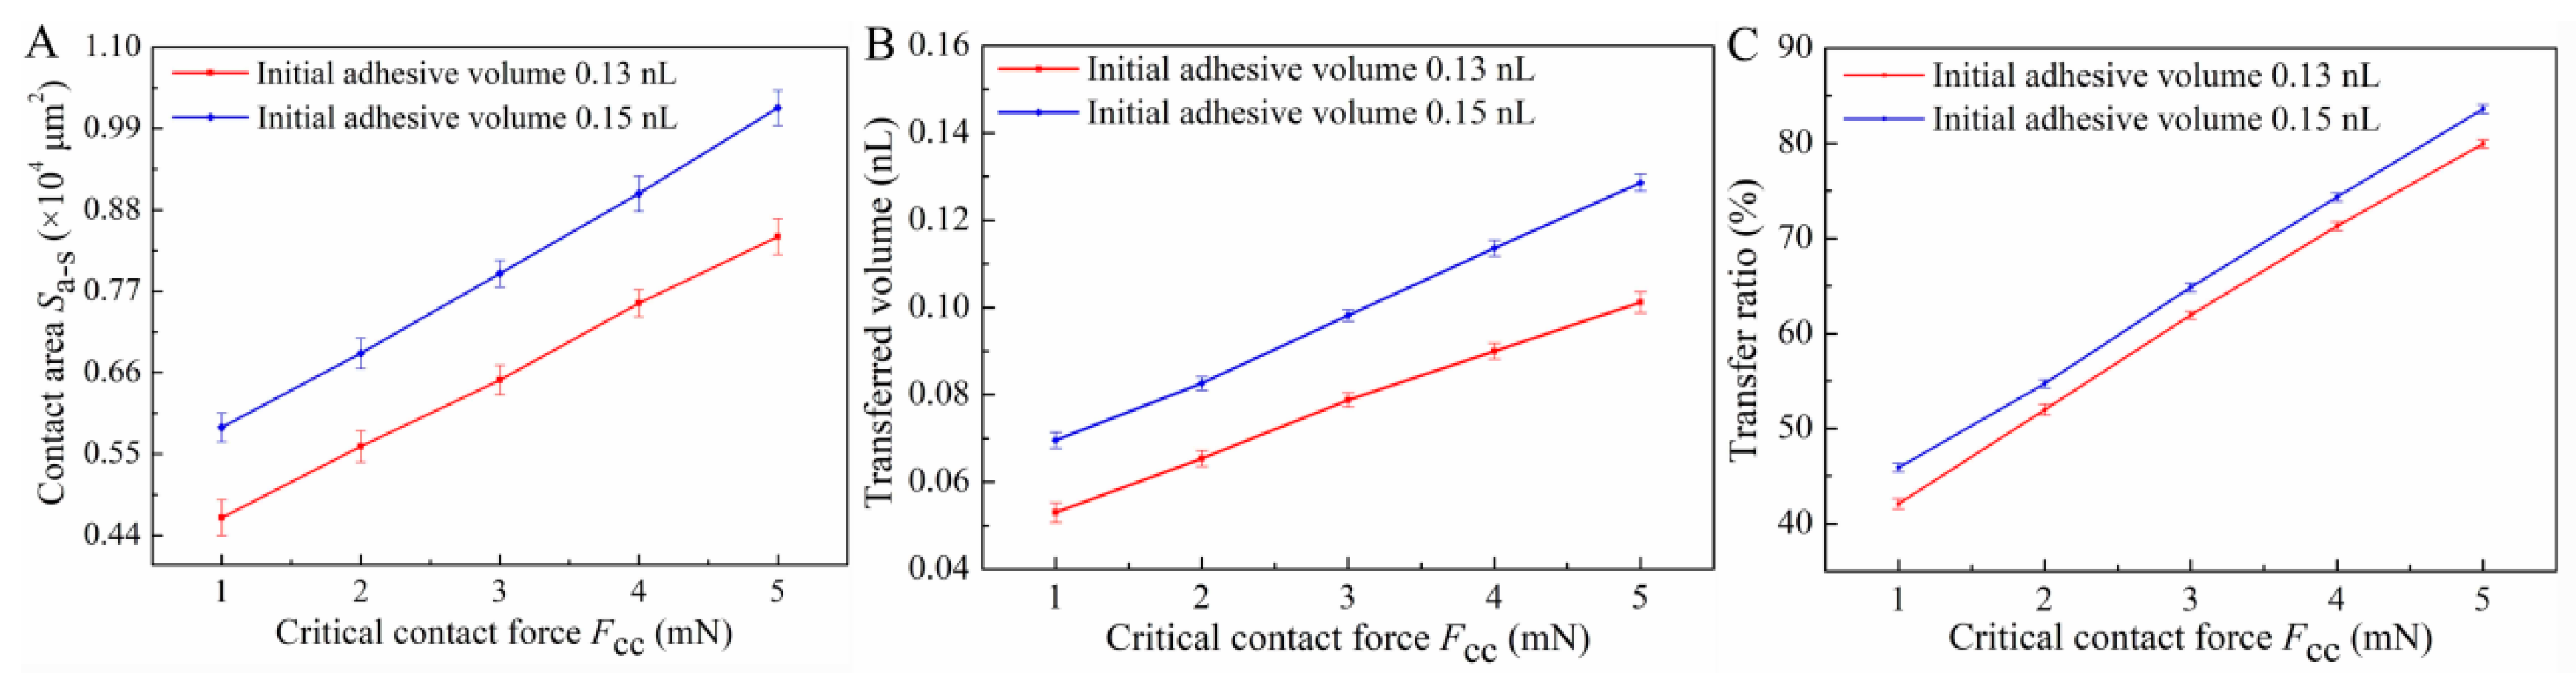
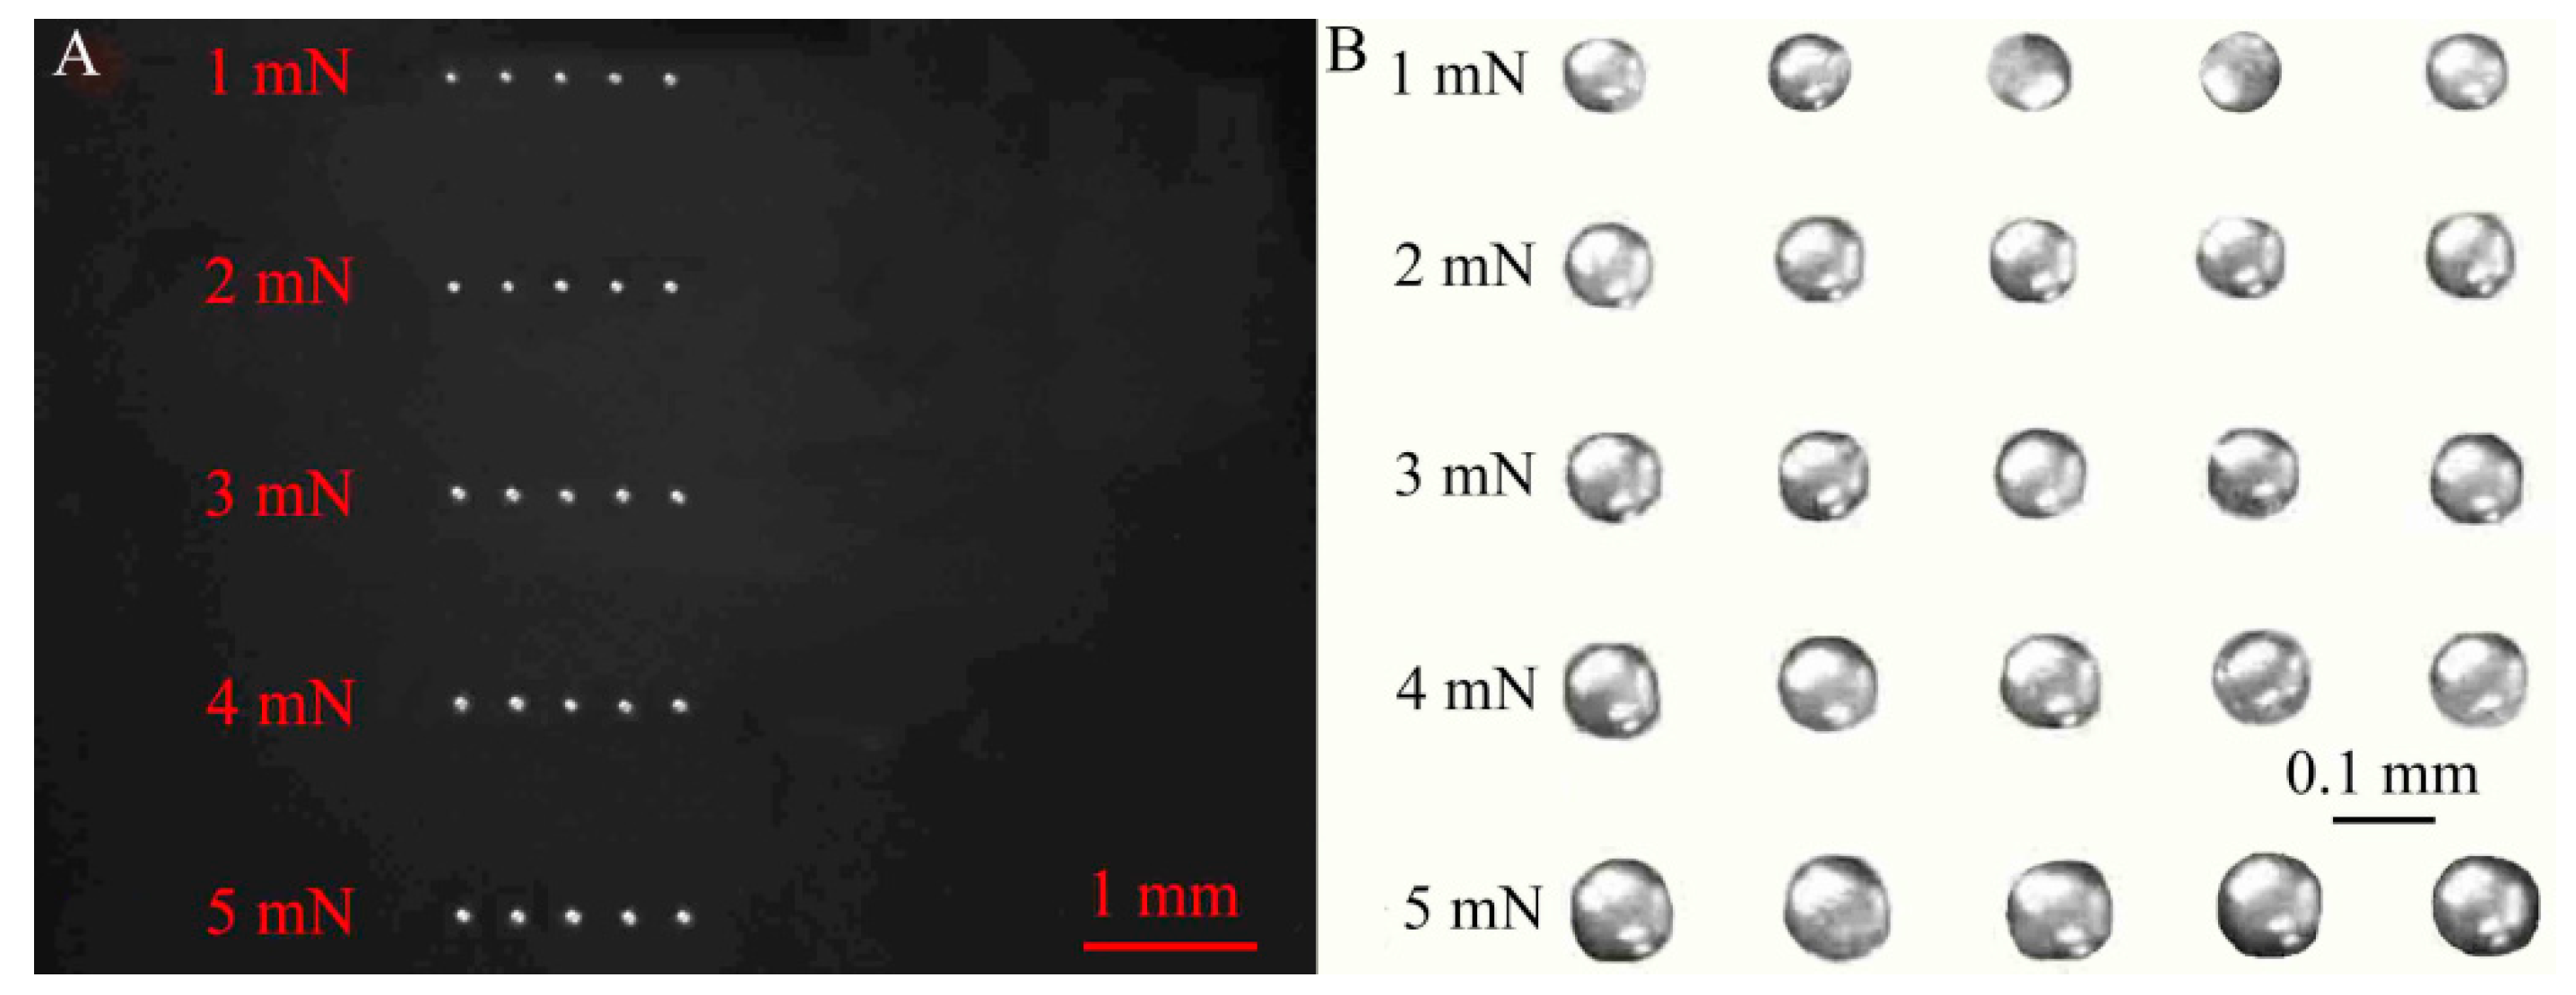
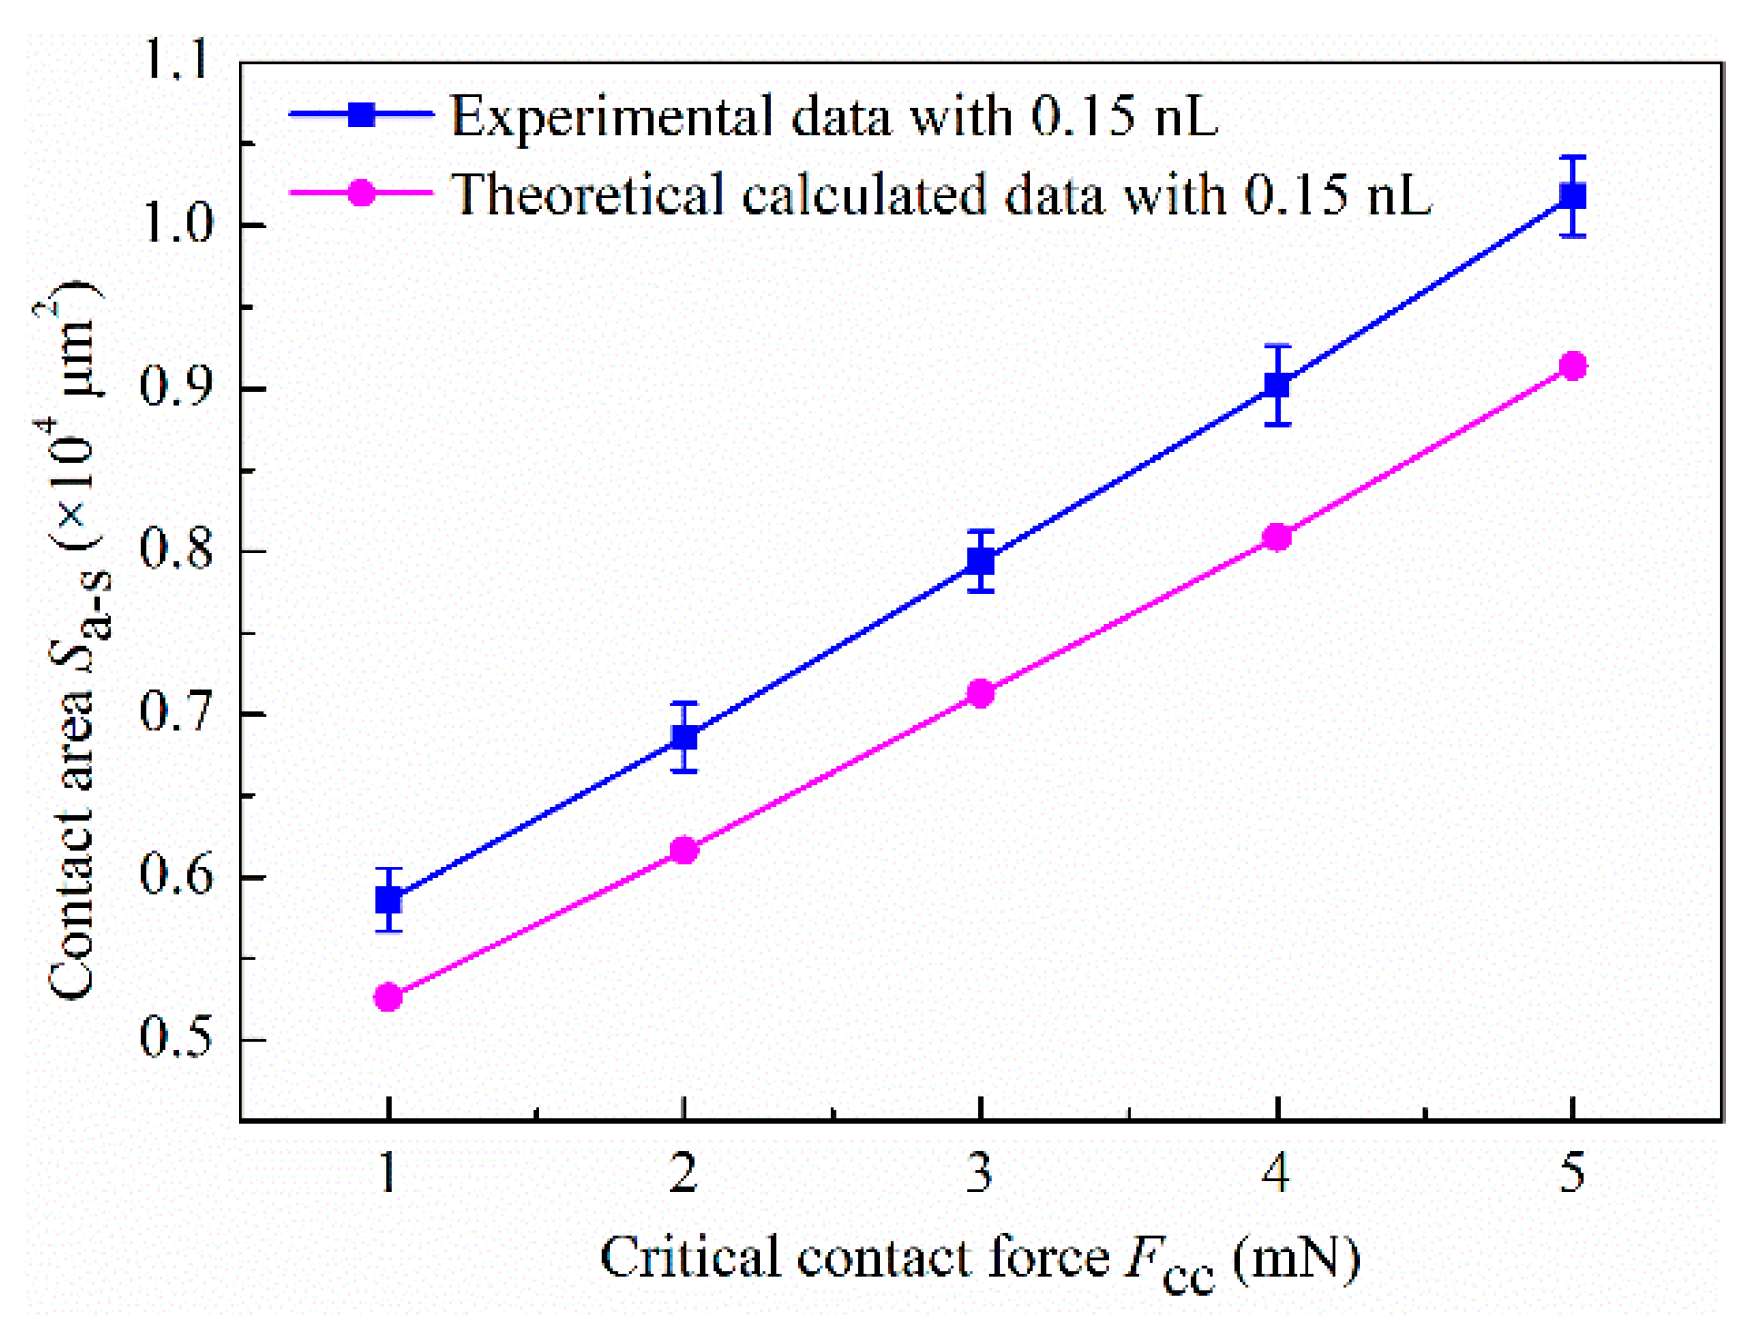
4.2. Discussion of Experimental Results

As shown in Figure 9, the experimental phenomenon that significantly improves the dispensing resolution based on force-feedback was observed. As the critical contact force FCC increased from 1 to 5 mN, the contact area Sa–s increased almost linearly with the increase of FCC, shown in Figure 9A. Thus, it was easy to infer that the increasing of Sa–s would enhance the dragging ability caused by the adhesive effect, which caused more initial droplet to remain on the substrate. The research of Cai and Bhushan also showed that the contact area is the dominant factor to the strengthening of the adhesive effect [25,26]. Thus, the transferred volume also increased with FCC increasing. As shown in Figure 9B, the approximate linear relationship of transferred volume with FCC also proved the correctness of the above analysis. Furthermore, the increase in the transferred volume also meant a higher transfer ratio, shown in Figure 9C.
The influence of initial adhesive volume on Sa–s, transferred volume, and transferred ratio was also analyzed and the results are shown in Figure 9. Obviously, the increase of initial adhesive volume would result in the increasing of Sa–s (contact radius ri), which could be deduced according to the formula F C 81 π μ U r i 10 / 16 h 0 9 . According to this formula, since the viscosity µ and the descent speed U are constant, the contact radius ri monotonically increases with the increase of h0 (the larger initial volume) under the same FCC. Based on the above analysis, the increase of initial volume will lead to the increase of Sa–s, so does the transferred volume and transfer ratio.

5. Conclusions

A theoretical model to describe the squeezing-and-deforming of highly viscous droplet was established and its dynamic mechanism was revealed. As the slit pitch decreased, the main constituents of contact force could be divided into three stages in turn: surface tension force, surface tension force and viscous force, and viscous force. Based on the analysis, the dispensing method of high-viscosity adhesives based on force-feedback was established with the home-made dispensing device. The results of experiment and theoretical calculation showed that when the critical contact force was in the range of 1–5 mN, the contact area of the adhesive droplet on the substrate was approximately linear to the critical contact force. Moreover, due to the effect of the contact area, the transferred volume in the experiment was approximately linear to the critical contact force too. As a result, the minimum dispensed amount of 0.05 nL (93.93 Pa·s) was achieved. The revealed mechanism and proposed method have great potential in micro-assembly and other applications of viscous microfluidics.

Author Contributions

Conceptualization, Z.X. and P.Z.; methodology, Z.X. and P.Z.; software, P.Z. and Y.Y.; formal analysis, Z.X. and P.Z.; investigation, Z.X., P.Z., and X.X.; writing—original draft preparation, P.Z.; writing—review and editing, Z.X., and D.W.; project administration, Z.X., X.W., and L.W.

Funding

This research was funded by the National Natural Science Foundation of China (grant number 51975102), Major Project of Basic Scientific Research of Chinese Ministry (grant number JCYK 2016 205 A003), and Fundamental Research Funds for the Central Universities (grant number DUT19LAB22).

Conflicts of Interest

All authors declare that there are no conflict of interests regarding the publication of this article.

References

  1. He, X.; Elmer, J.; DebRoy, T. Heat transfer and fluid flow in laser microwelding. J. Appl. Phys. 2005, 97, 084909. [Google Scholar] [CrossRef]
  2. Zhu, X.; Liu, G.; Guo, Y.; Tian, Y. Study of PMMA thermal bonding. Microsyst. Technol. 2007, 13, 403–407. [Google Scholar] [CrossRef]
  3. Cozma, A.; Puers, B. Characterization of the electrostatic bonding of silicon and Pyrex glass. J. Micromech. Microeng. 1995, 5, 98–102. [Google Scholar] [CrossRef]
  4. Yang, L.; King, C.K.; Bernstein, J.B. Liquid dispensing encapsulation in semiconductor packaging. Microelectron. Int. 2003, 20, 29–35. [Google Scholar] [CrossRef]
  5. Lee, S.; Park, S.; Kim, J.; Lee, S.; Cho, D.-I. Surface/bulk micromachined single-crystalline-silicon micro-gyroscope. J. Microelectromech. Syst. 2000, 9, 557–567. [Google Scholar]
  6. Adams, R.D.; Davies, R. Strength of joints involving composites. J. Adhes. 1996, 59, 171–182. [Google Scholar] [CrossRef]
  7. Heidarpour, F.; Farahani, M.; Ghabezi, P. Experimental investigation of the effects of adhesive defects on the single lap joint strength. Int. J. Adhes. Adhes. 2018, 80, 128–132. [Google Scholar] [CrossRef]
  8. Rispler, A.R.; Tong, L.; Steven, G.P.; Wisnom, M.R. Shape optimisation of adhesive fillets. Int. J. Adhes. Adhes. 2000, 20, 221–231. [Google Scholar] [CrossRef]
  9. Zhao, Y.-X.; Li, H.-X.; Ding, H.; Xiong, Y.-L. Integrated modelling of a time-pressure fluid dispensing system for electronics manufacturing. Int. J. Adv. Manuf. Technol. 2005, 26, 1–9. [Google Scholar] [CrossRef]
  10. Nguyen, Q.-H.; Choi, M.-K.; Choi, S.-B. A new type of piezostack-driven jetting dispenser for semiconductor electronic packaging: Modeling and control. Smart Mater. Struct. 2008, 17, 015033. [Google Scholar] [CrossRef]
  11. Mecozzi, L.; Gennari, O.; Coppola, S.; Olivieri, F.; Rega, R.; Mandracchia, B.; Vespini, V.; Bramanti, A.; Ferraro, P.; Grilli, S. Easy Printing of High Viscous Microdots by Spontaneous Breakup of Thin Fibers. ACS Appl. Mater. Interfaces 2018, 10, 2122–2129. [Google Scholar] [CrossRef] [PubMed]
  12. Liao, X.; Braunschweig, A.B.; Zheng, Z.; Mirkin, C.A. Force- and time-dependent feature size and shape control in molecular printing via polymer-pen lithography. Small 2010, 6, 1082–1086. [Google Scholar] [CrossRef] [PubMed]
  13. Liao, X.; Braunschweig, A.B.; Mirkin, C.A. “Force-feedback” leveling of massively parallel arrays in polymer pen lithography. Nano Lett. 2010, 10, 1335–1340. [Google Scholar] [CrossRef] [PubMed]
  14. Kumar, S. Liquid transfer in printing processes: Liquid bridges with moving contact lines. Annu. Rev. Fluid Mech. 2015, 47, 67–94. [Google Scholar] [CrossRef]
  15. Zhang, X.; Padgett, R.; Basaran, O. Nonlinear deformation and breakup of stretching liquid bridges. J. Fluid Mech. 1996, 329, 207–245. [Google Scholar] [CrossRef]
  16. Chen, H.; Tang, T.; Amirfazli, A. Fast liquid transfer between surfaces: Breakup of stretched liquid bridges. Langmuir 2015, 31, 11470–11476. [Google Scholar] [CrossRef]
  17. Huang, C.-H.; Carvalho, M.S.; Kumar, S. Stretching liquid bridges with moving contact lines: Comparison of liquid-transfer predictions and experiments. Soft Matter 2016, 12, 7457–7469. [Google Scholar] [CrossRef]
  18. Collins, R.T.; Jones, J.J.; Harris, M.T.; Basaran, O.A. Electrohydrodynamic tip streaming and emission of charged drops from liquid cones. Nat. Phys. 2007, 4, 149–154. [Google Scholar] [CrossRef]
  19. Marginean, I.; Parvin, L.; Heffernan, L.; Vertes, A. Flexing the electrified meniscus: The birth of a jet in electrosprays. Anal. Chem. 2004, 76, 4202–4207. [Google Scholar] [CrossRef]
  20. SchaÈffer, E.; Thurn-Albrecht, T.; Russell, T.P.; Steiner, U. Electrically induced structure formation and pattern transfer. Nature 2000, 403, 874. [Google Scholar] [CrossRef]
  21. Müller, M.; Tong, Y.; Fricke, H.; Vallée, T. An efficient numerical model for the evaluation of compression flow of high-viscosity adhesives. Int. J. Adhes. Adhes. 2018, 85, 251–262. [Google Scholar] [CrossRef]
  22. Engmann, J.; Servais, C.; Burbidge, A.S. Squeeze flow theory and applications to rheometry: A review. J. Non-Newton. Fluid 2005, 132, 1–27. [Google Scholar] [CrossRef]
  23. Jackson, J. A study of squeezing flow. Appl. Sci. Res. 1963, 11, 148–152. [Google Scholar] [CrossRef]
  24. Chen, H.; Amirfazli, A.; Tang, T. Modeling liquid bridge between surfaces with contact angle hysteresis. Langmuir 2013, 29, 3310–3319. [Google Scholar] [CrossRef]
  25. Cai, S.; Bhushan, B. Meniscus and viscous forces during normal separation of liquid-mediated contacts. Nanotechnology 2007, 18, 465704. [Google Scholar] [CrossRef]
  26. Cai, S.; Bhushan, B. Meniscus and viscous forces during separation of hydrophilic and hydrophobic surfaces with liquid-mediated contacts. Mater. Sci. Eng. R Rep. 2008, 61, 78–106. [Google Scholar] [CrossRef]
Figure 1. Adhesive dispensing with force-feedback: (A) dipping-up, (B) squeezing, and (C) stretching.
Micromachines 10 00728 g001
Figure 2. Schematic diagram of the initial droplet being squeezed.
Micromachines 10 00728 g002
Figure 3. (A) Home-made experimental dispensing device with force-feedback, (B) needle-stamp, and (C) force sensor.
Micromachines 10 00728 g003
Figure 4. Adhesive dispensing with the needle-stamp in experiment under 1 mN: (AC) dipping-up, (D) squeezing, (E,F) stretching, and (G) micrograph of transferred adhesive with a confocal laser scanning microscope (CLSM).
Micromachines 10 00728 g004
Figure 5. Adhesive droplets array before (A) and after (B) magnification under 1–5 mN.
Micromachines 10 00728 g005
Figure 6. (A) Measurement difference of transferred volume at 1 mN, and (B) squeezed contact angles αi and βi at 1~5 mN with initial volume 0.15 nL.
Micromachines 10 00728 g006
Figure 7. Variation of surface tension force (Fs) and viscous force (Fv) with the decrease of slit pitch at (A) initial squeezing, (B) 1 mN, and (C) 5 mN.
Micromachines 10 00728 g007
Figure 8. Variation of contact areas Sa–s of experiment and theoretical calculation with increase of critical contact force (FCC).
Micromachines 10 00728 g008
Figure 9. Variation of (A) contact areas Sa-s, (B) transferred volume, and (C) transfer ratio with increase of FCC.
Micromachines 10 00728 g009
Table 1. Properties of the adhesive.
Surface Tension γ (mN/m)Density ρ (g/cm3)Contact Angle α0 on Steel (°)Contact Angle β0 on Silicon Wafer (°)Viscosity µ (Pa·s)
36.961.84747193.93
Table 2. Dispensing parameters.
Experiment ConditionDescent
Velocity of Stamp U (mm/min)
Lifting Velocity of Stamp (mm/min)Defined Contact Force FCC (mN)Initial Average Volume
(nL)
Initial Average Height h0 (μm)Pitch of Slit hi with 1–5 mN (μm)
I0.09601~50.1339.015.9~11.3
II0.09601~50.1542.017.4~12.3

