
Disease Modifying Effects of the Spider Toxin Parawixin2 in the Experimental Epilepsy Model

 , ,
, ,  and
and 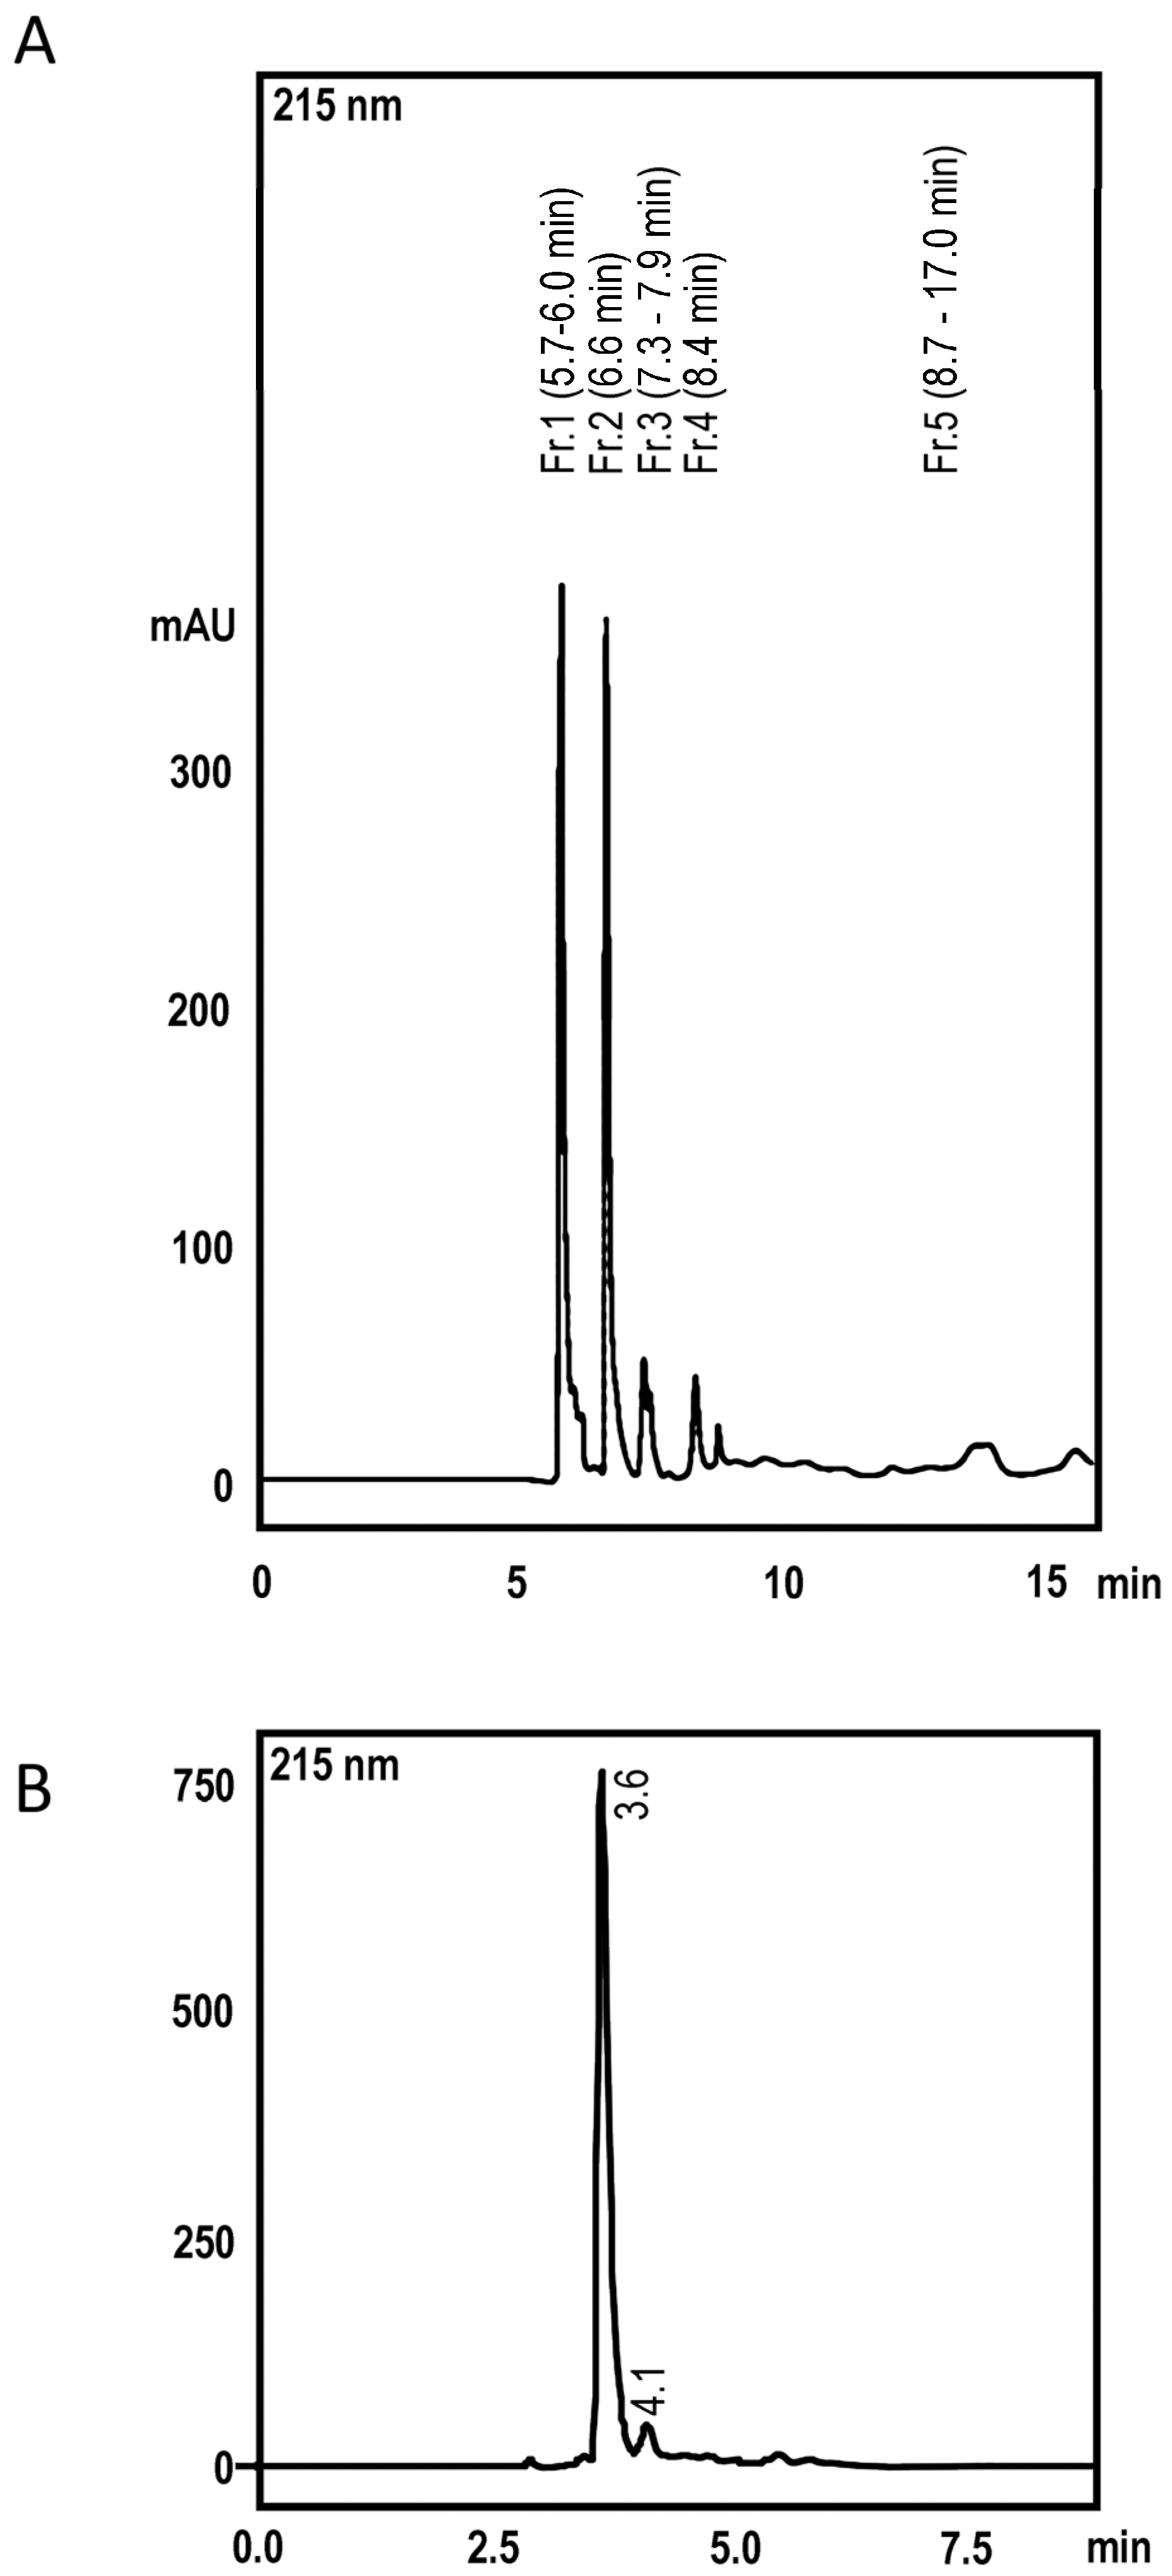
Abstract
1. Introduction
2. Results
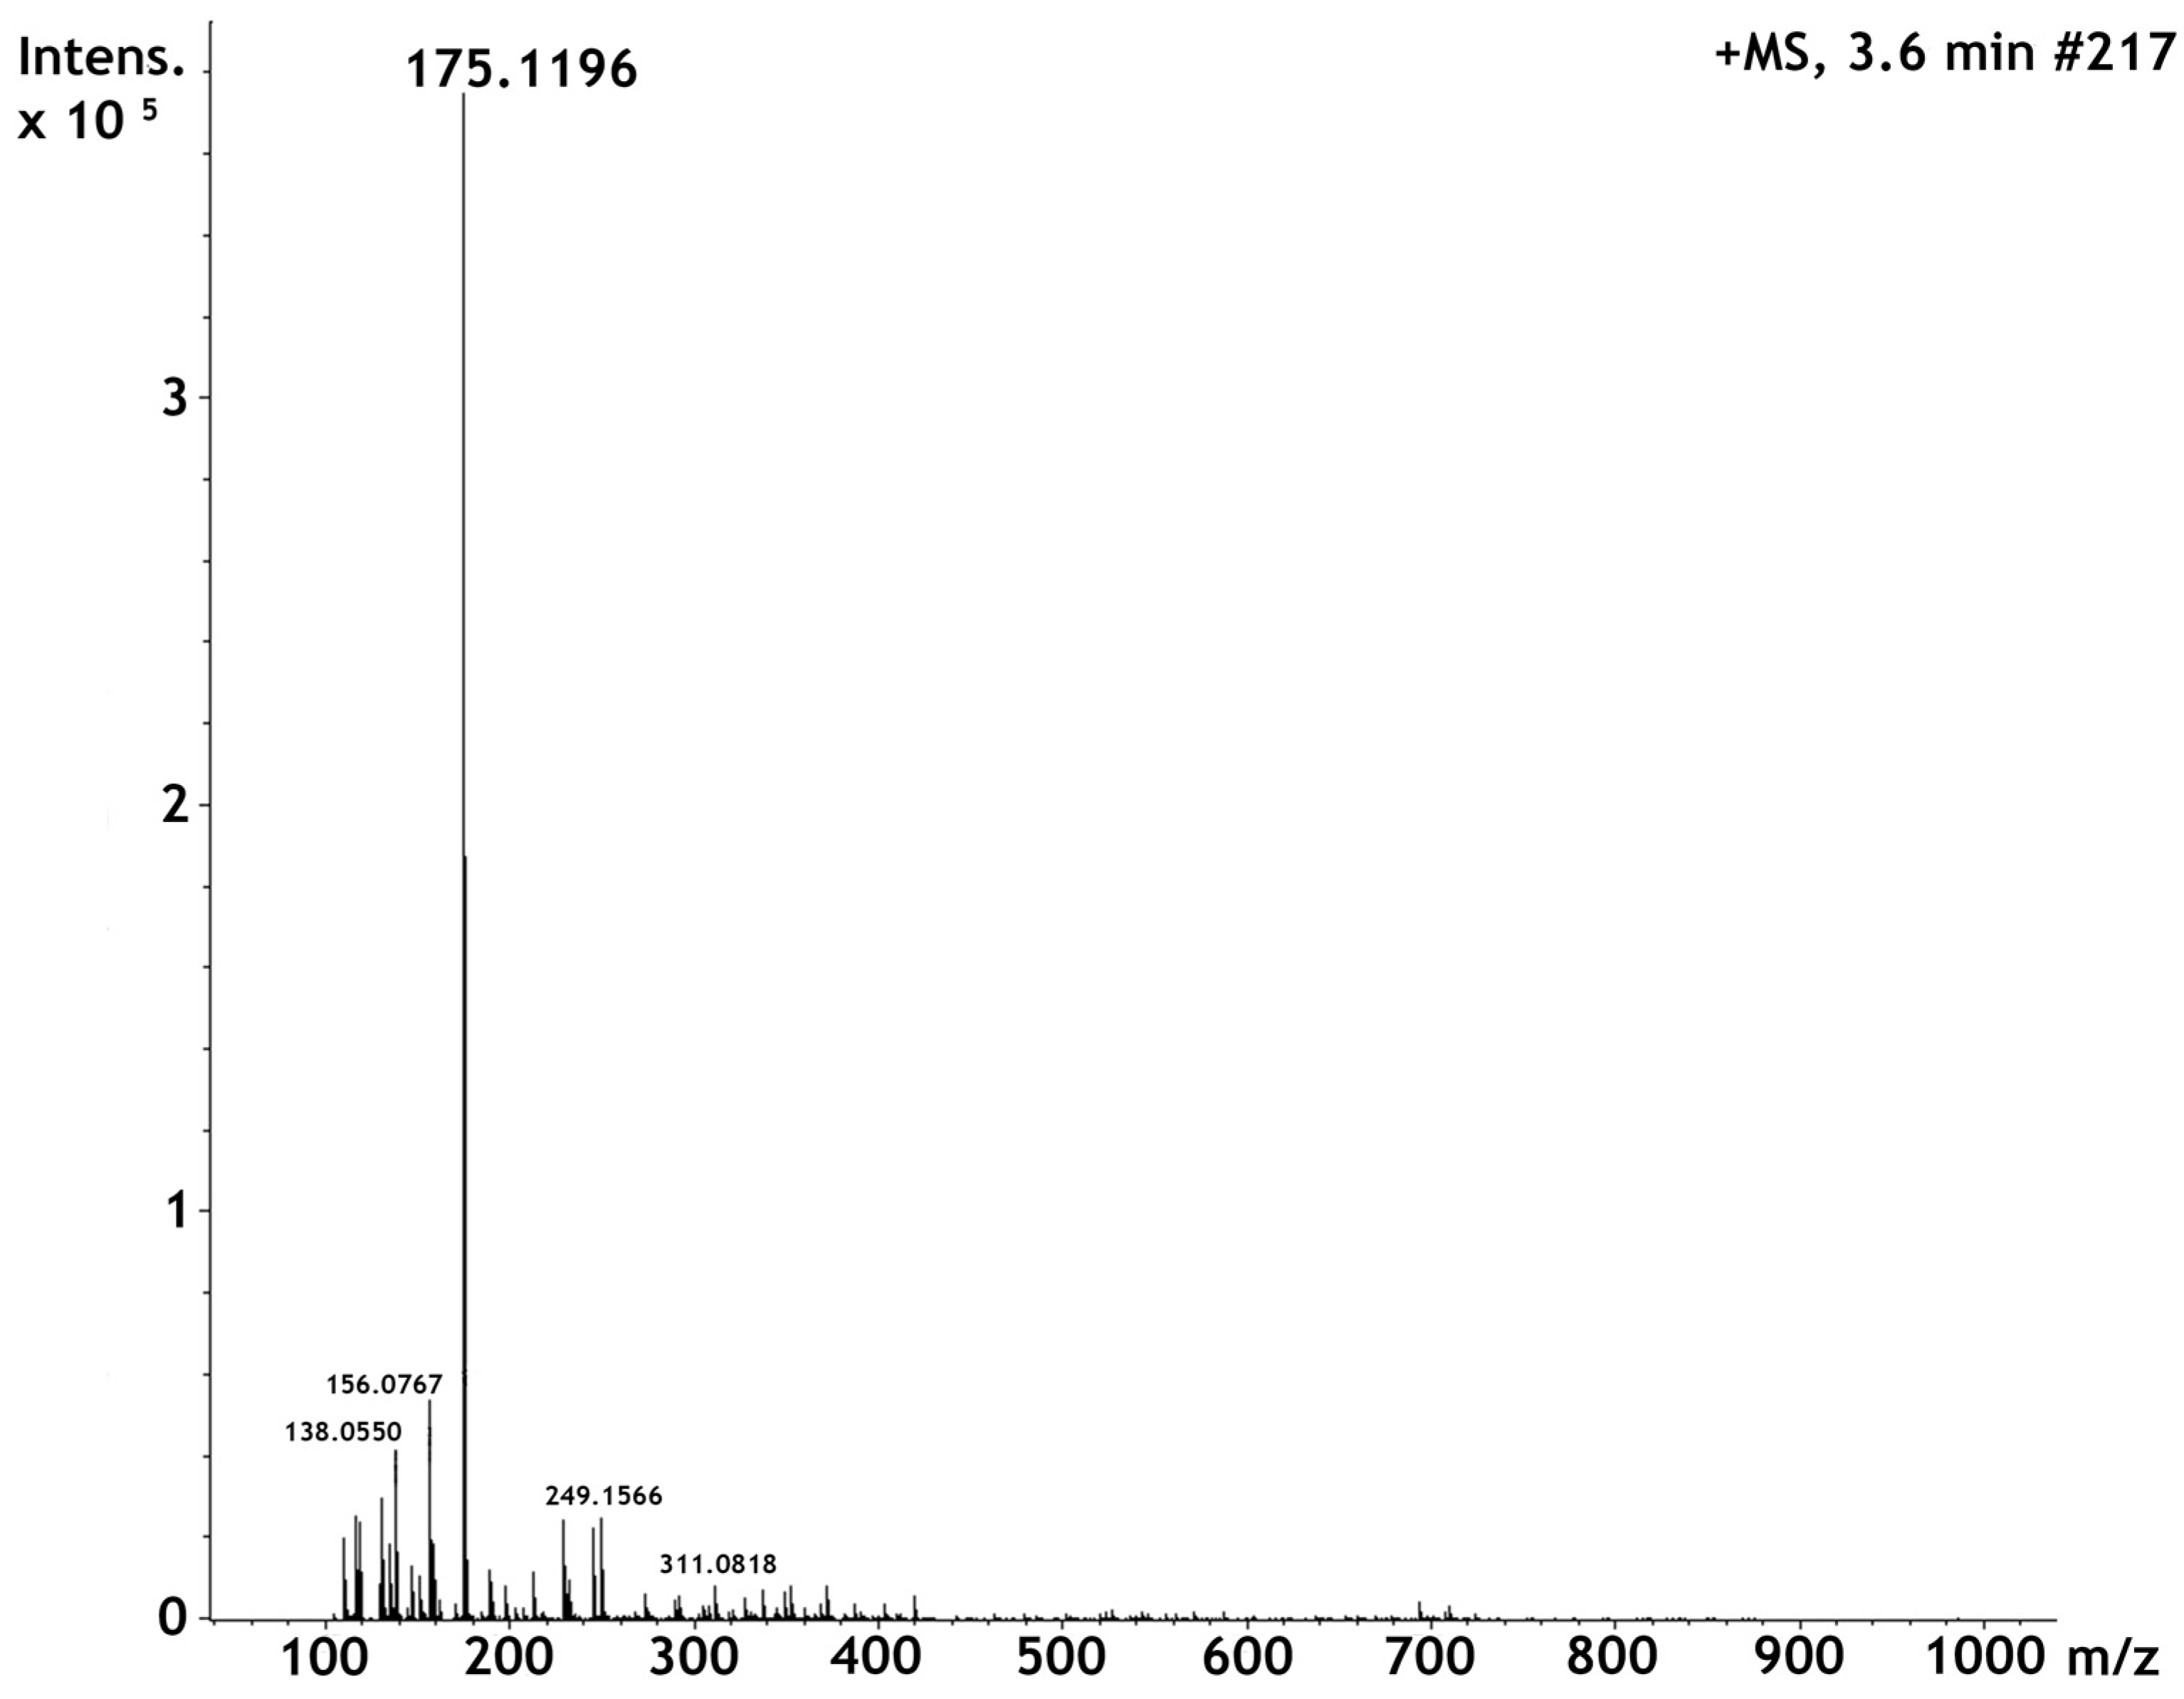
2.1. High Perfomance Liquid Cromatography and Dereplication
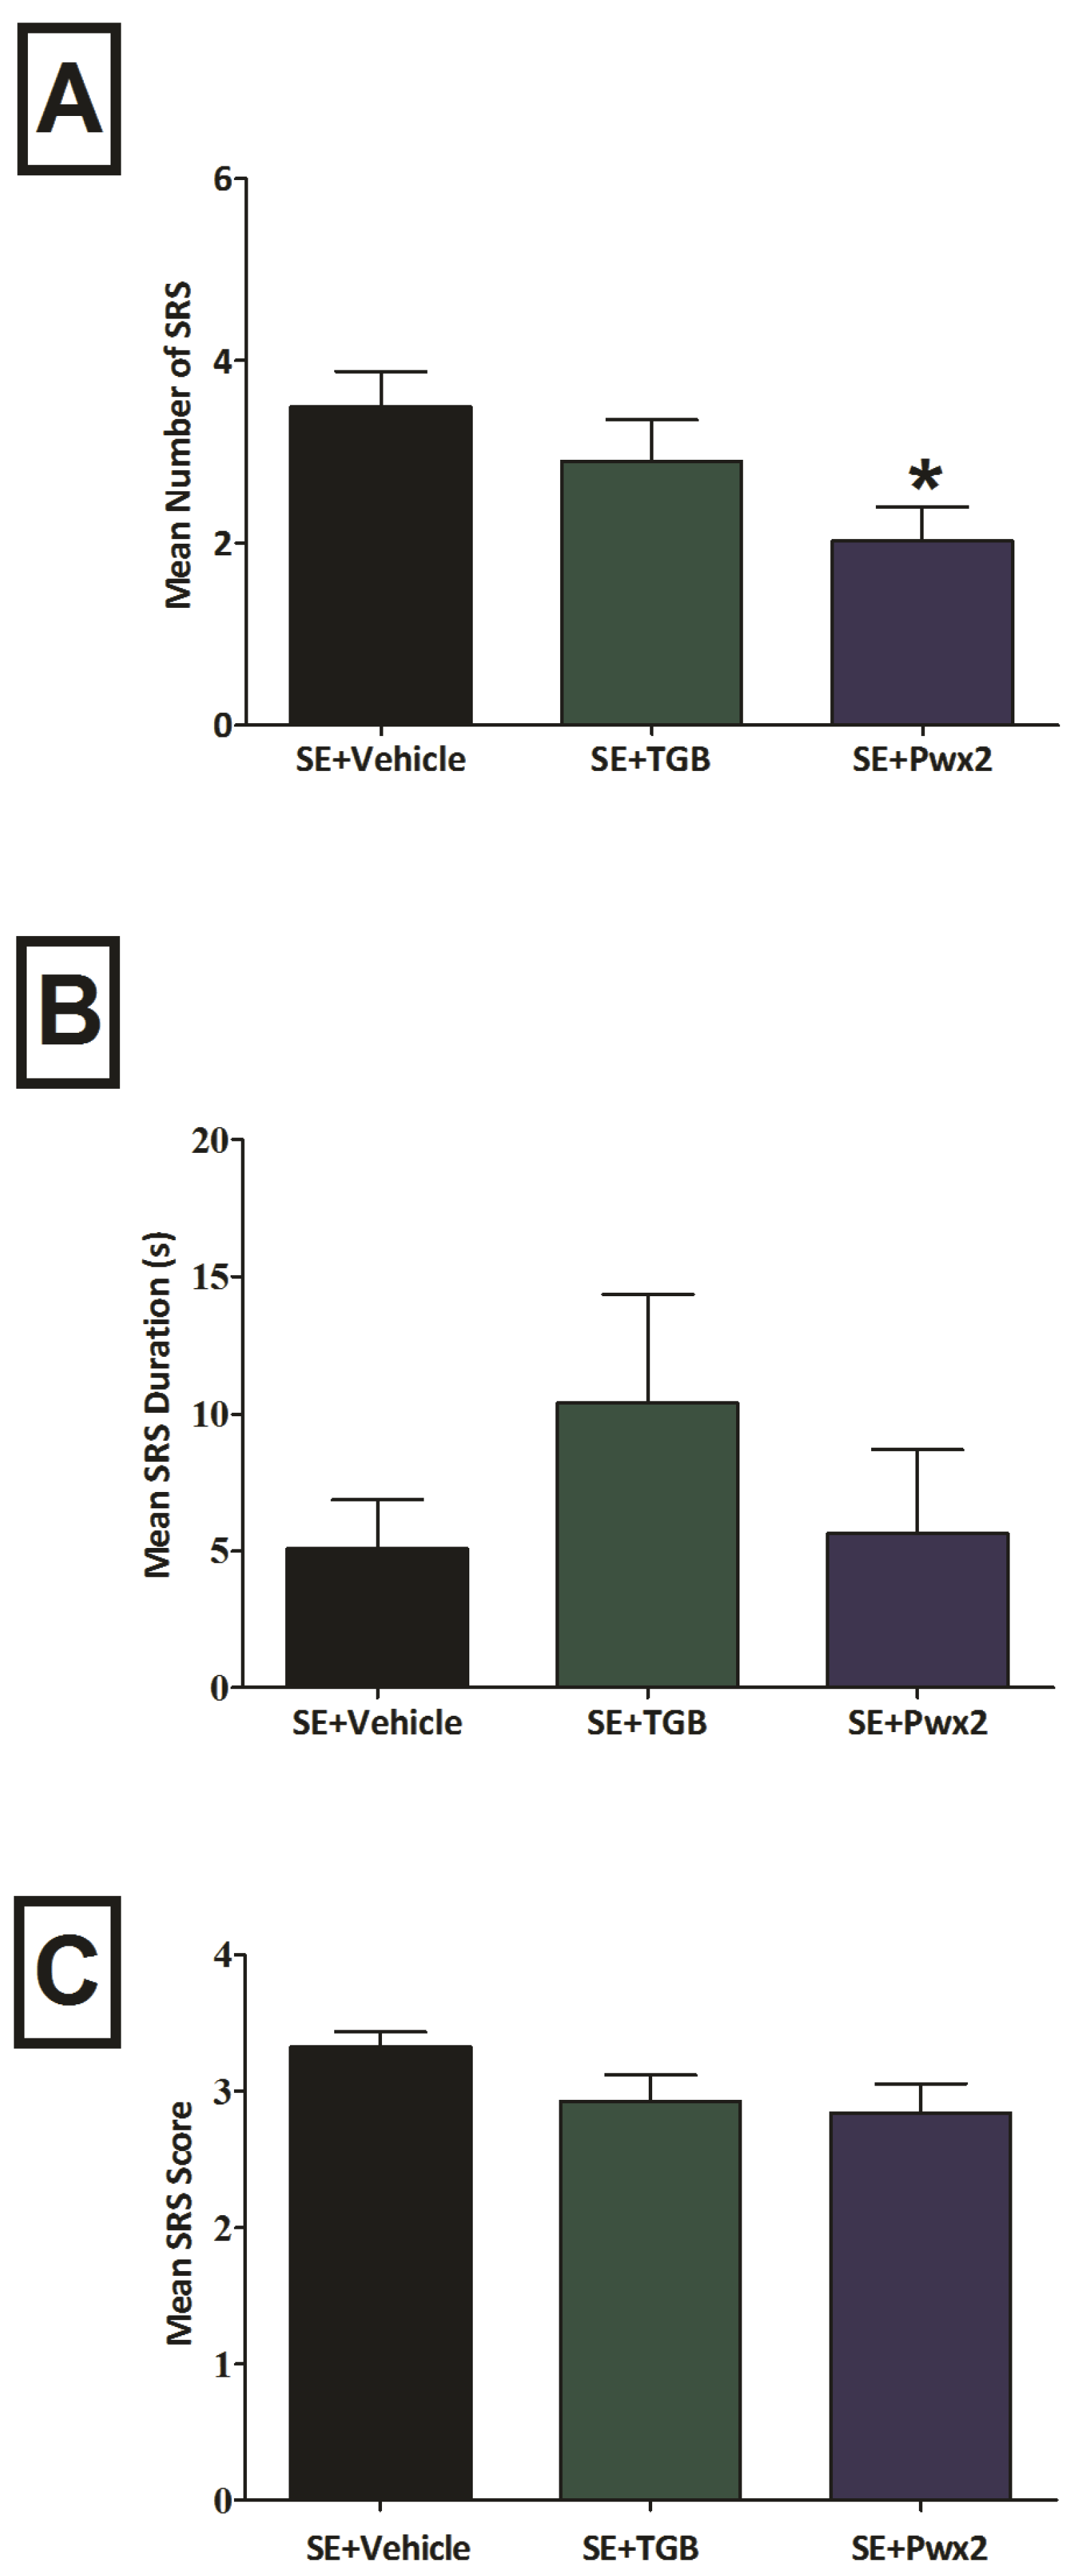
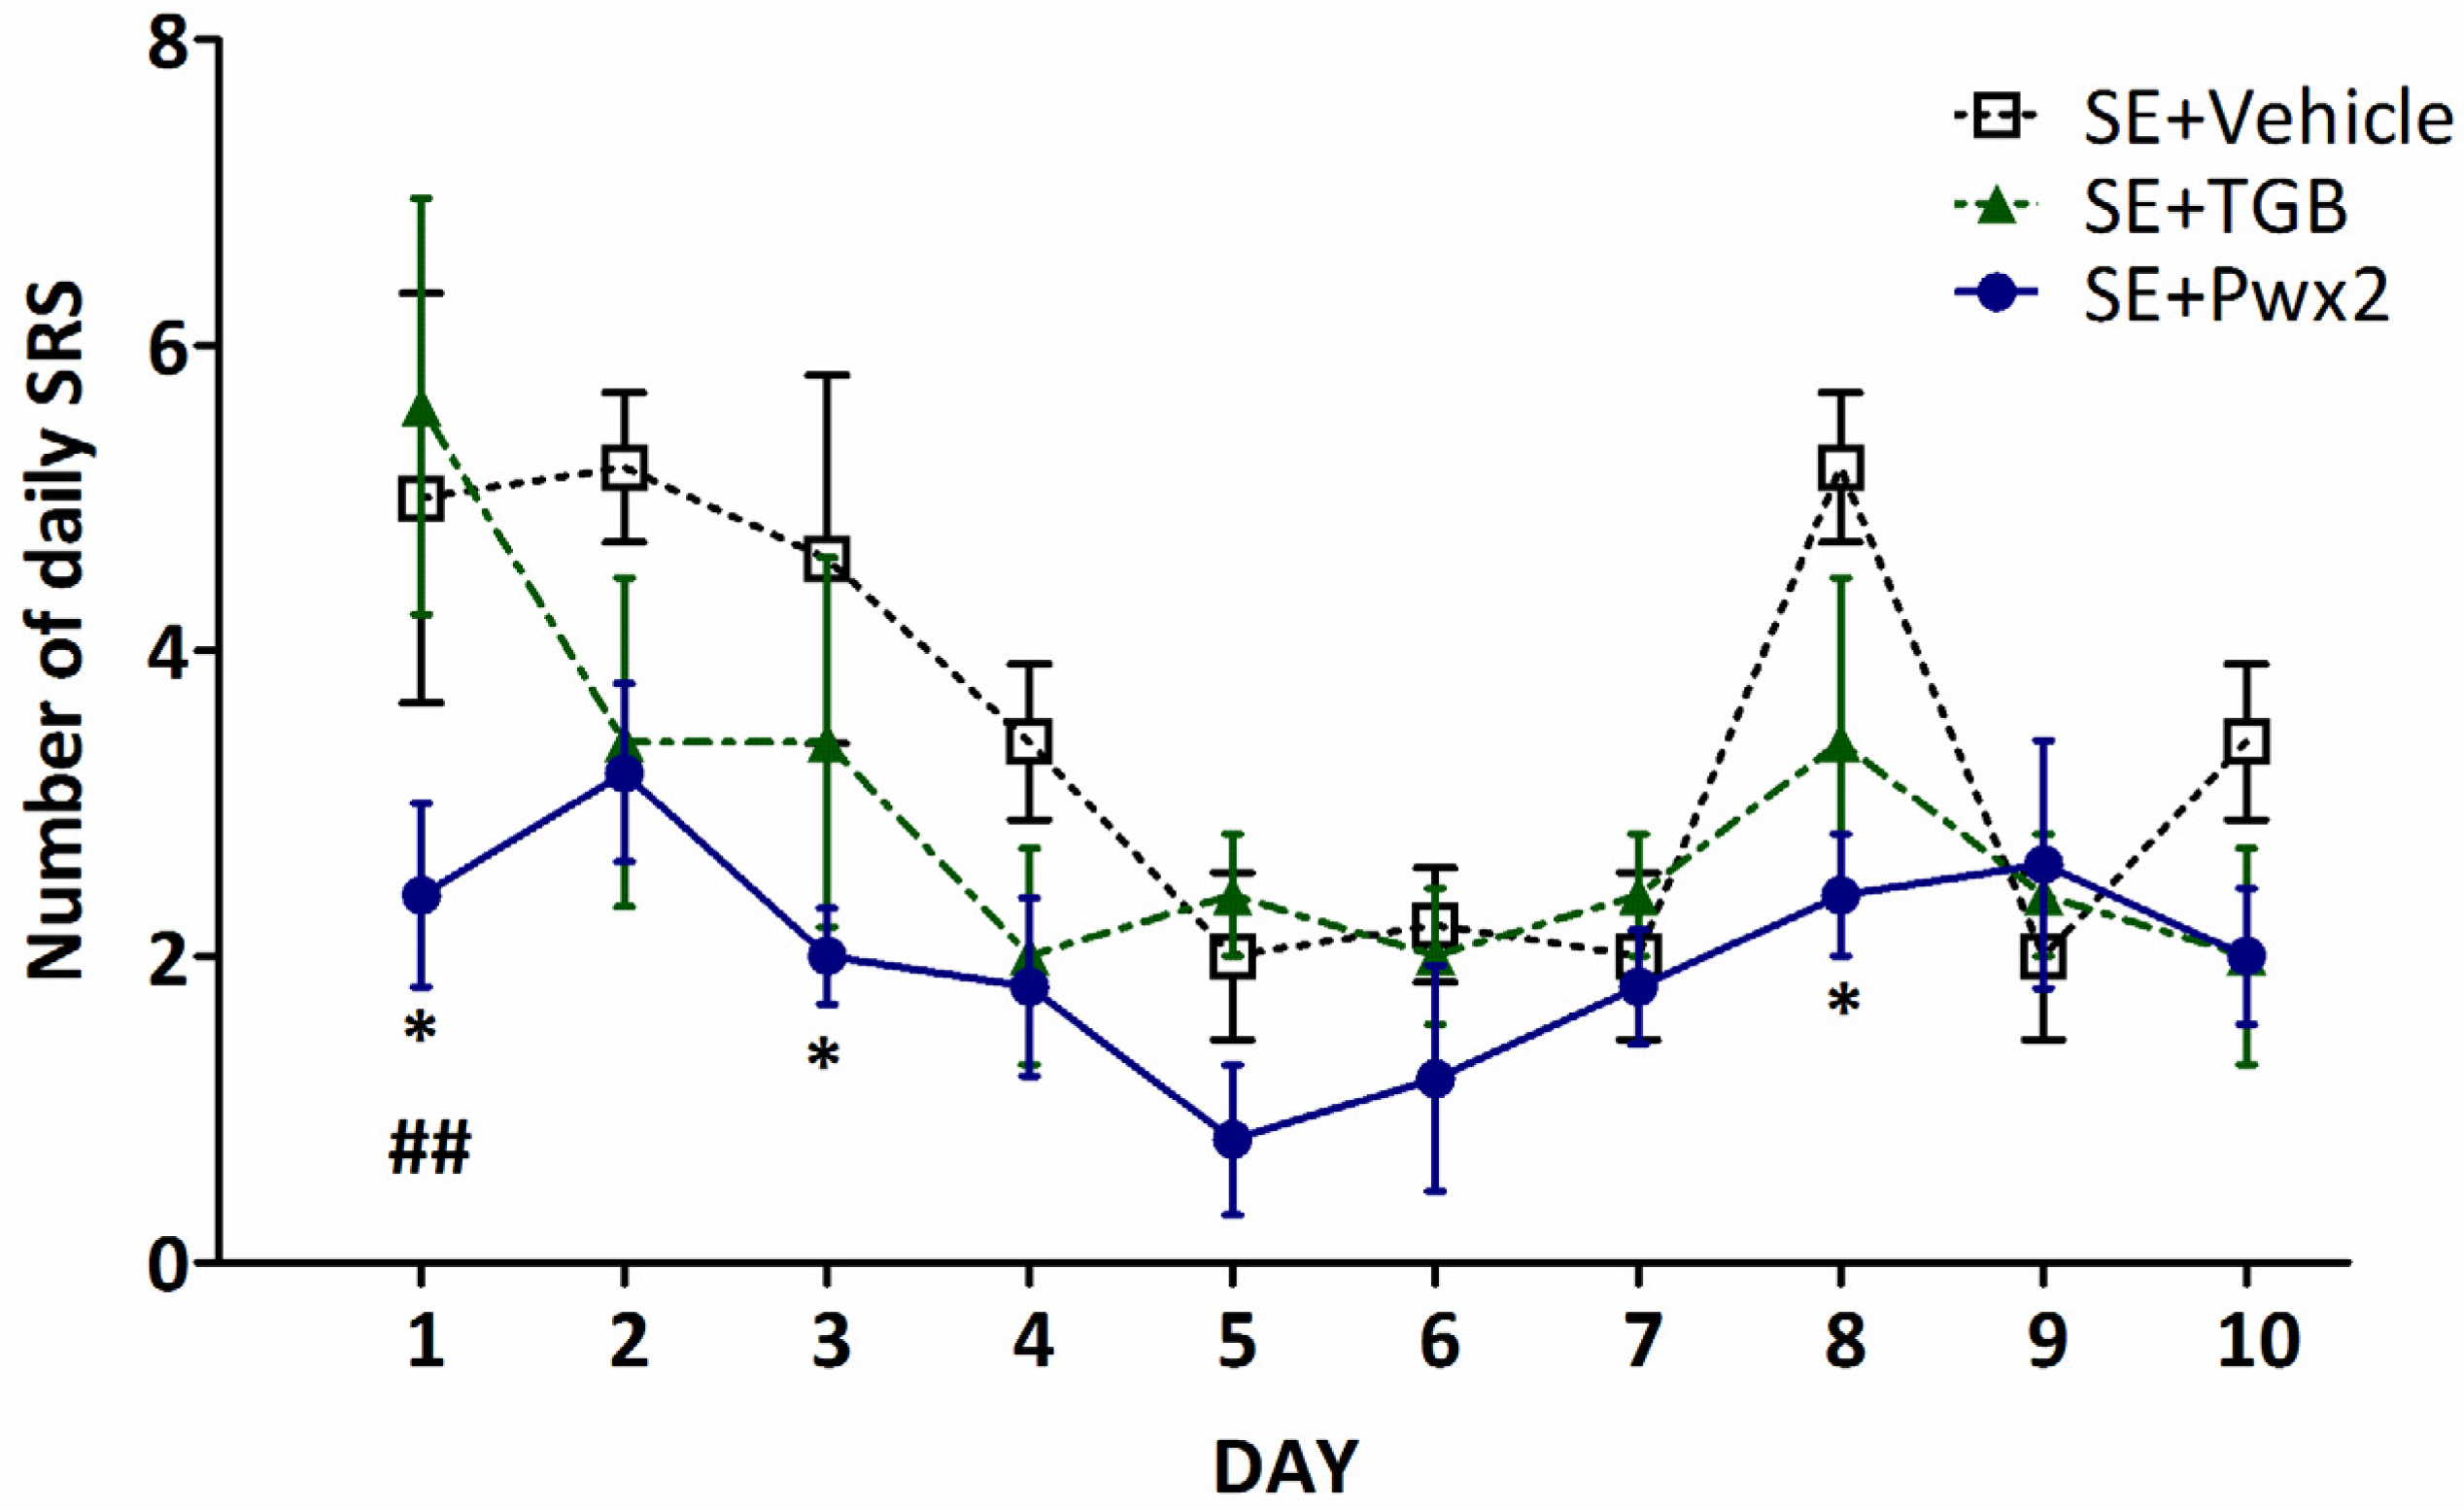
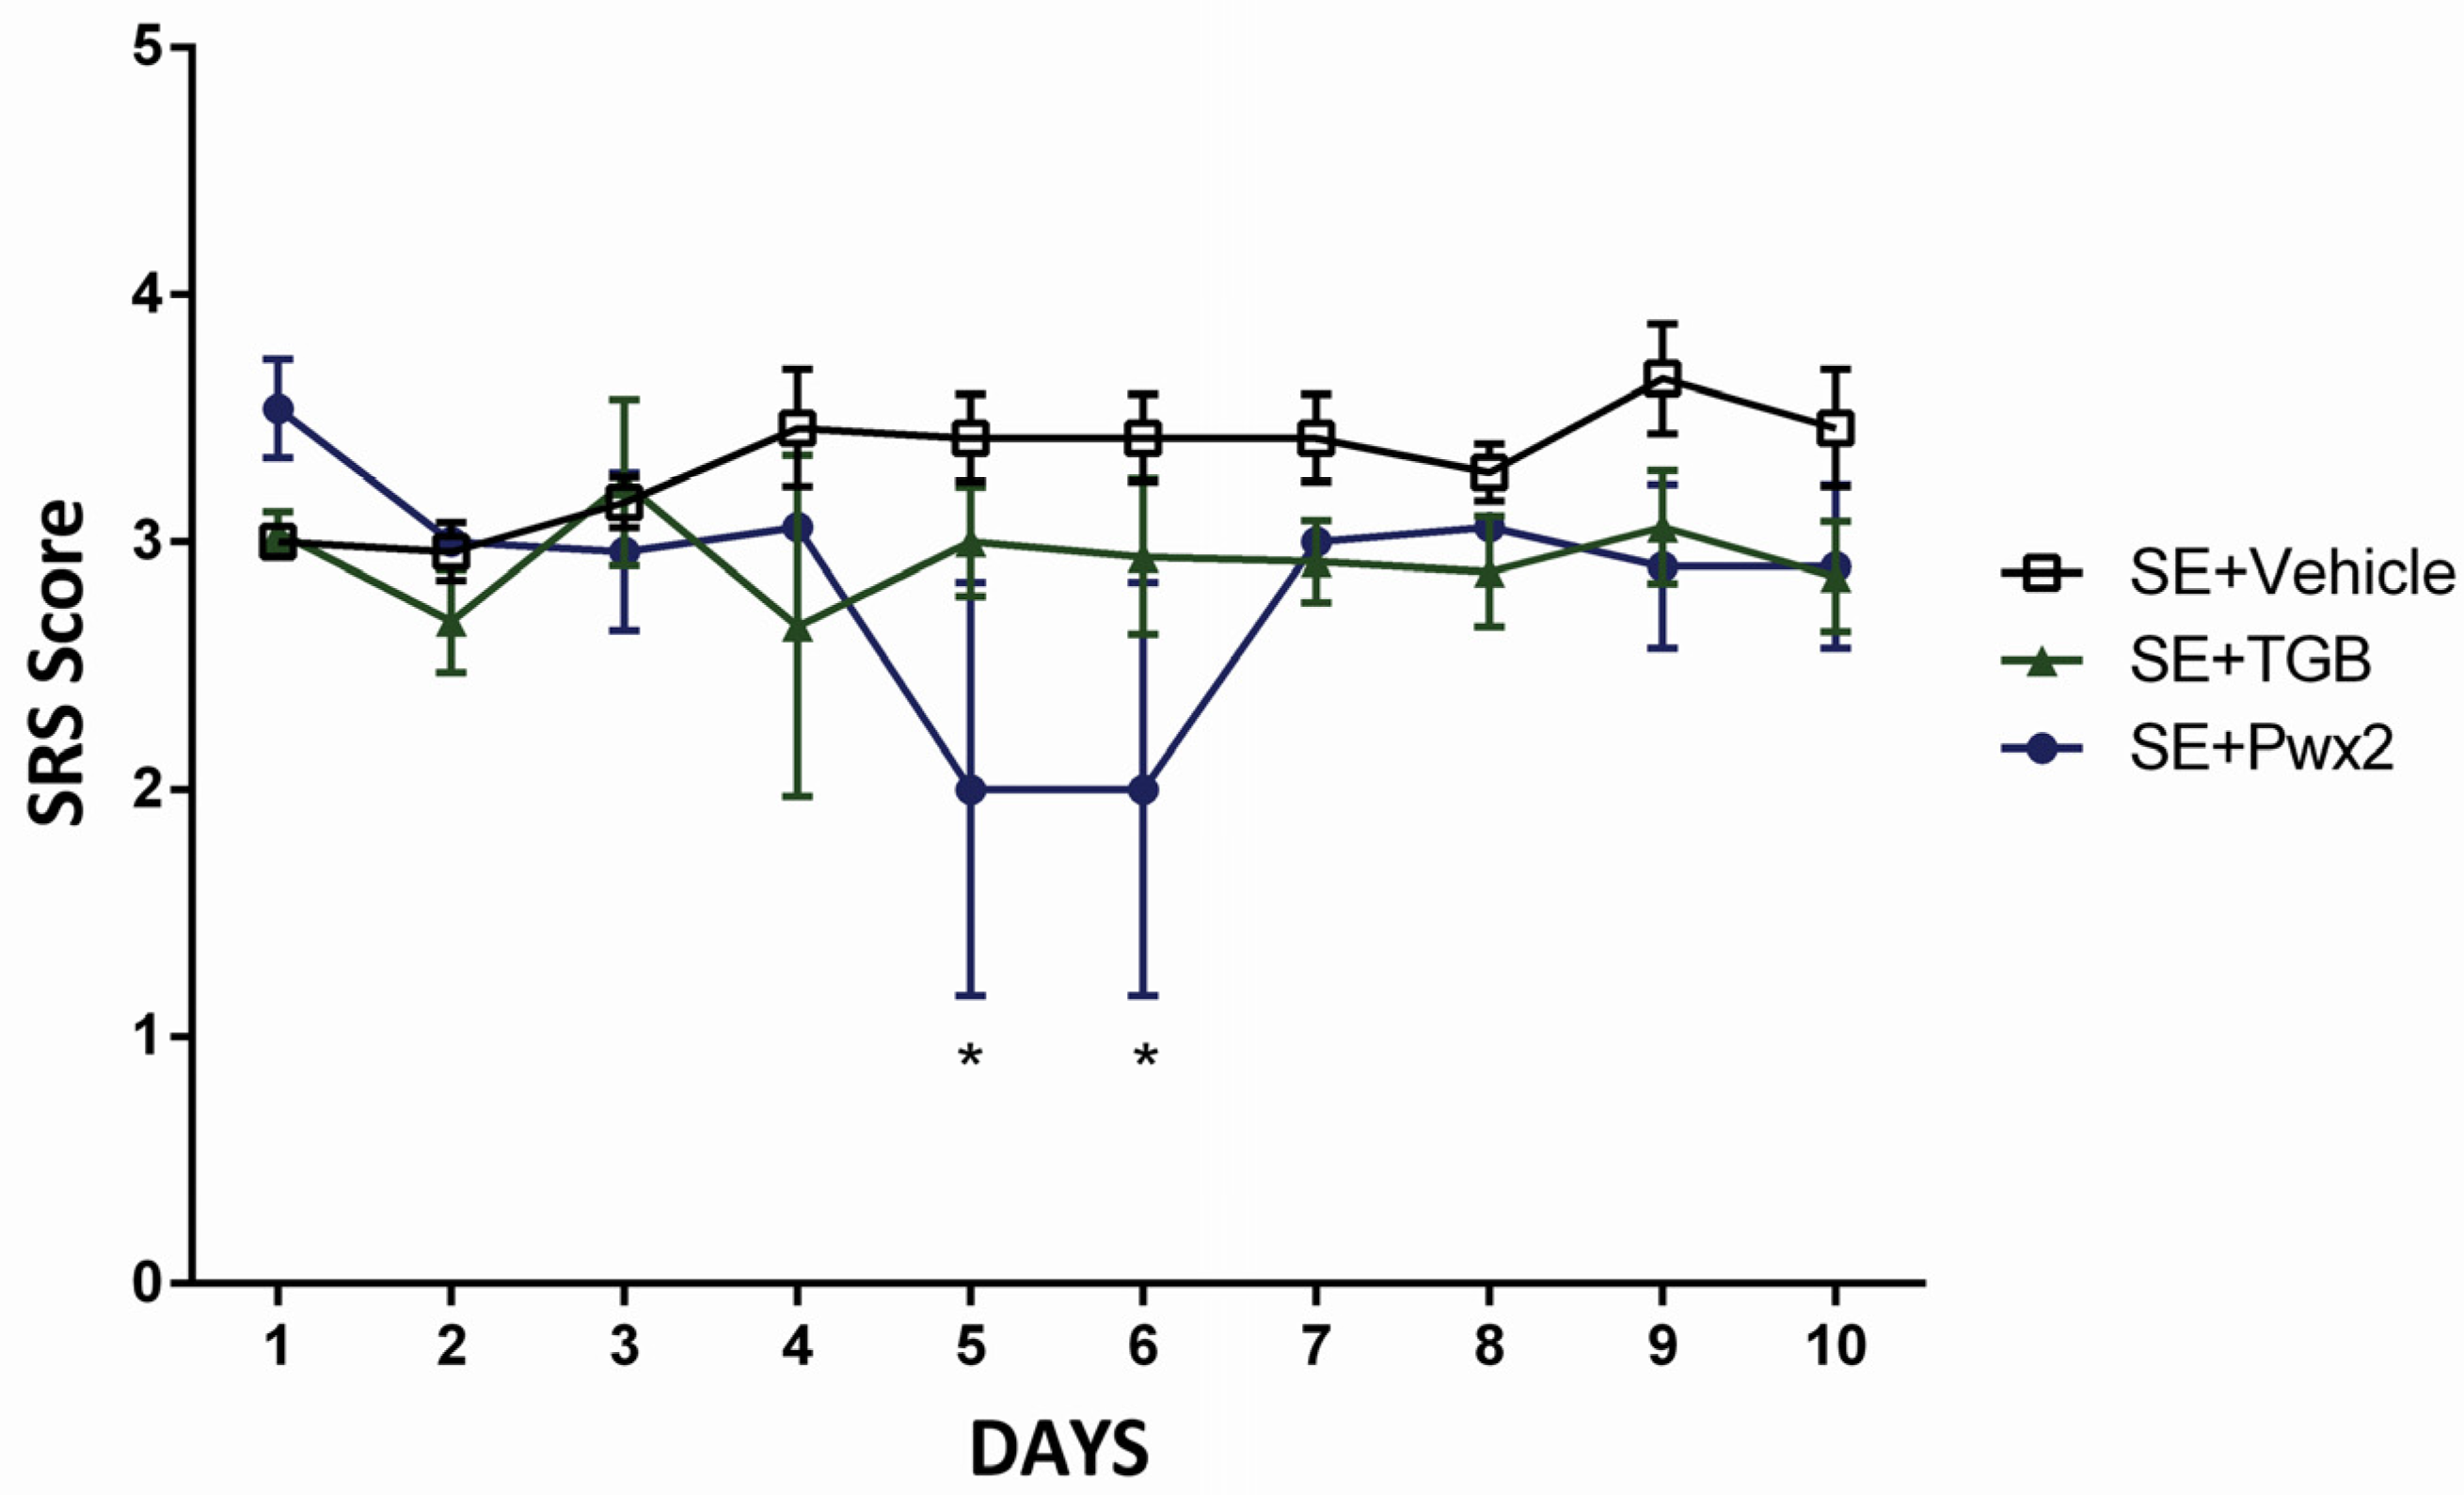
2.2. Anticonvulsant Effects of Parawixin2 on Spontaneous Recurrent Seizures (SRS)
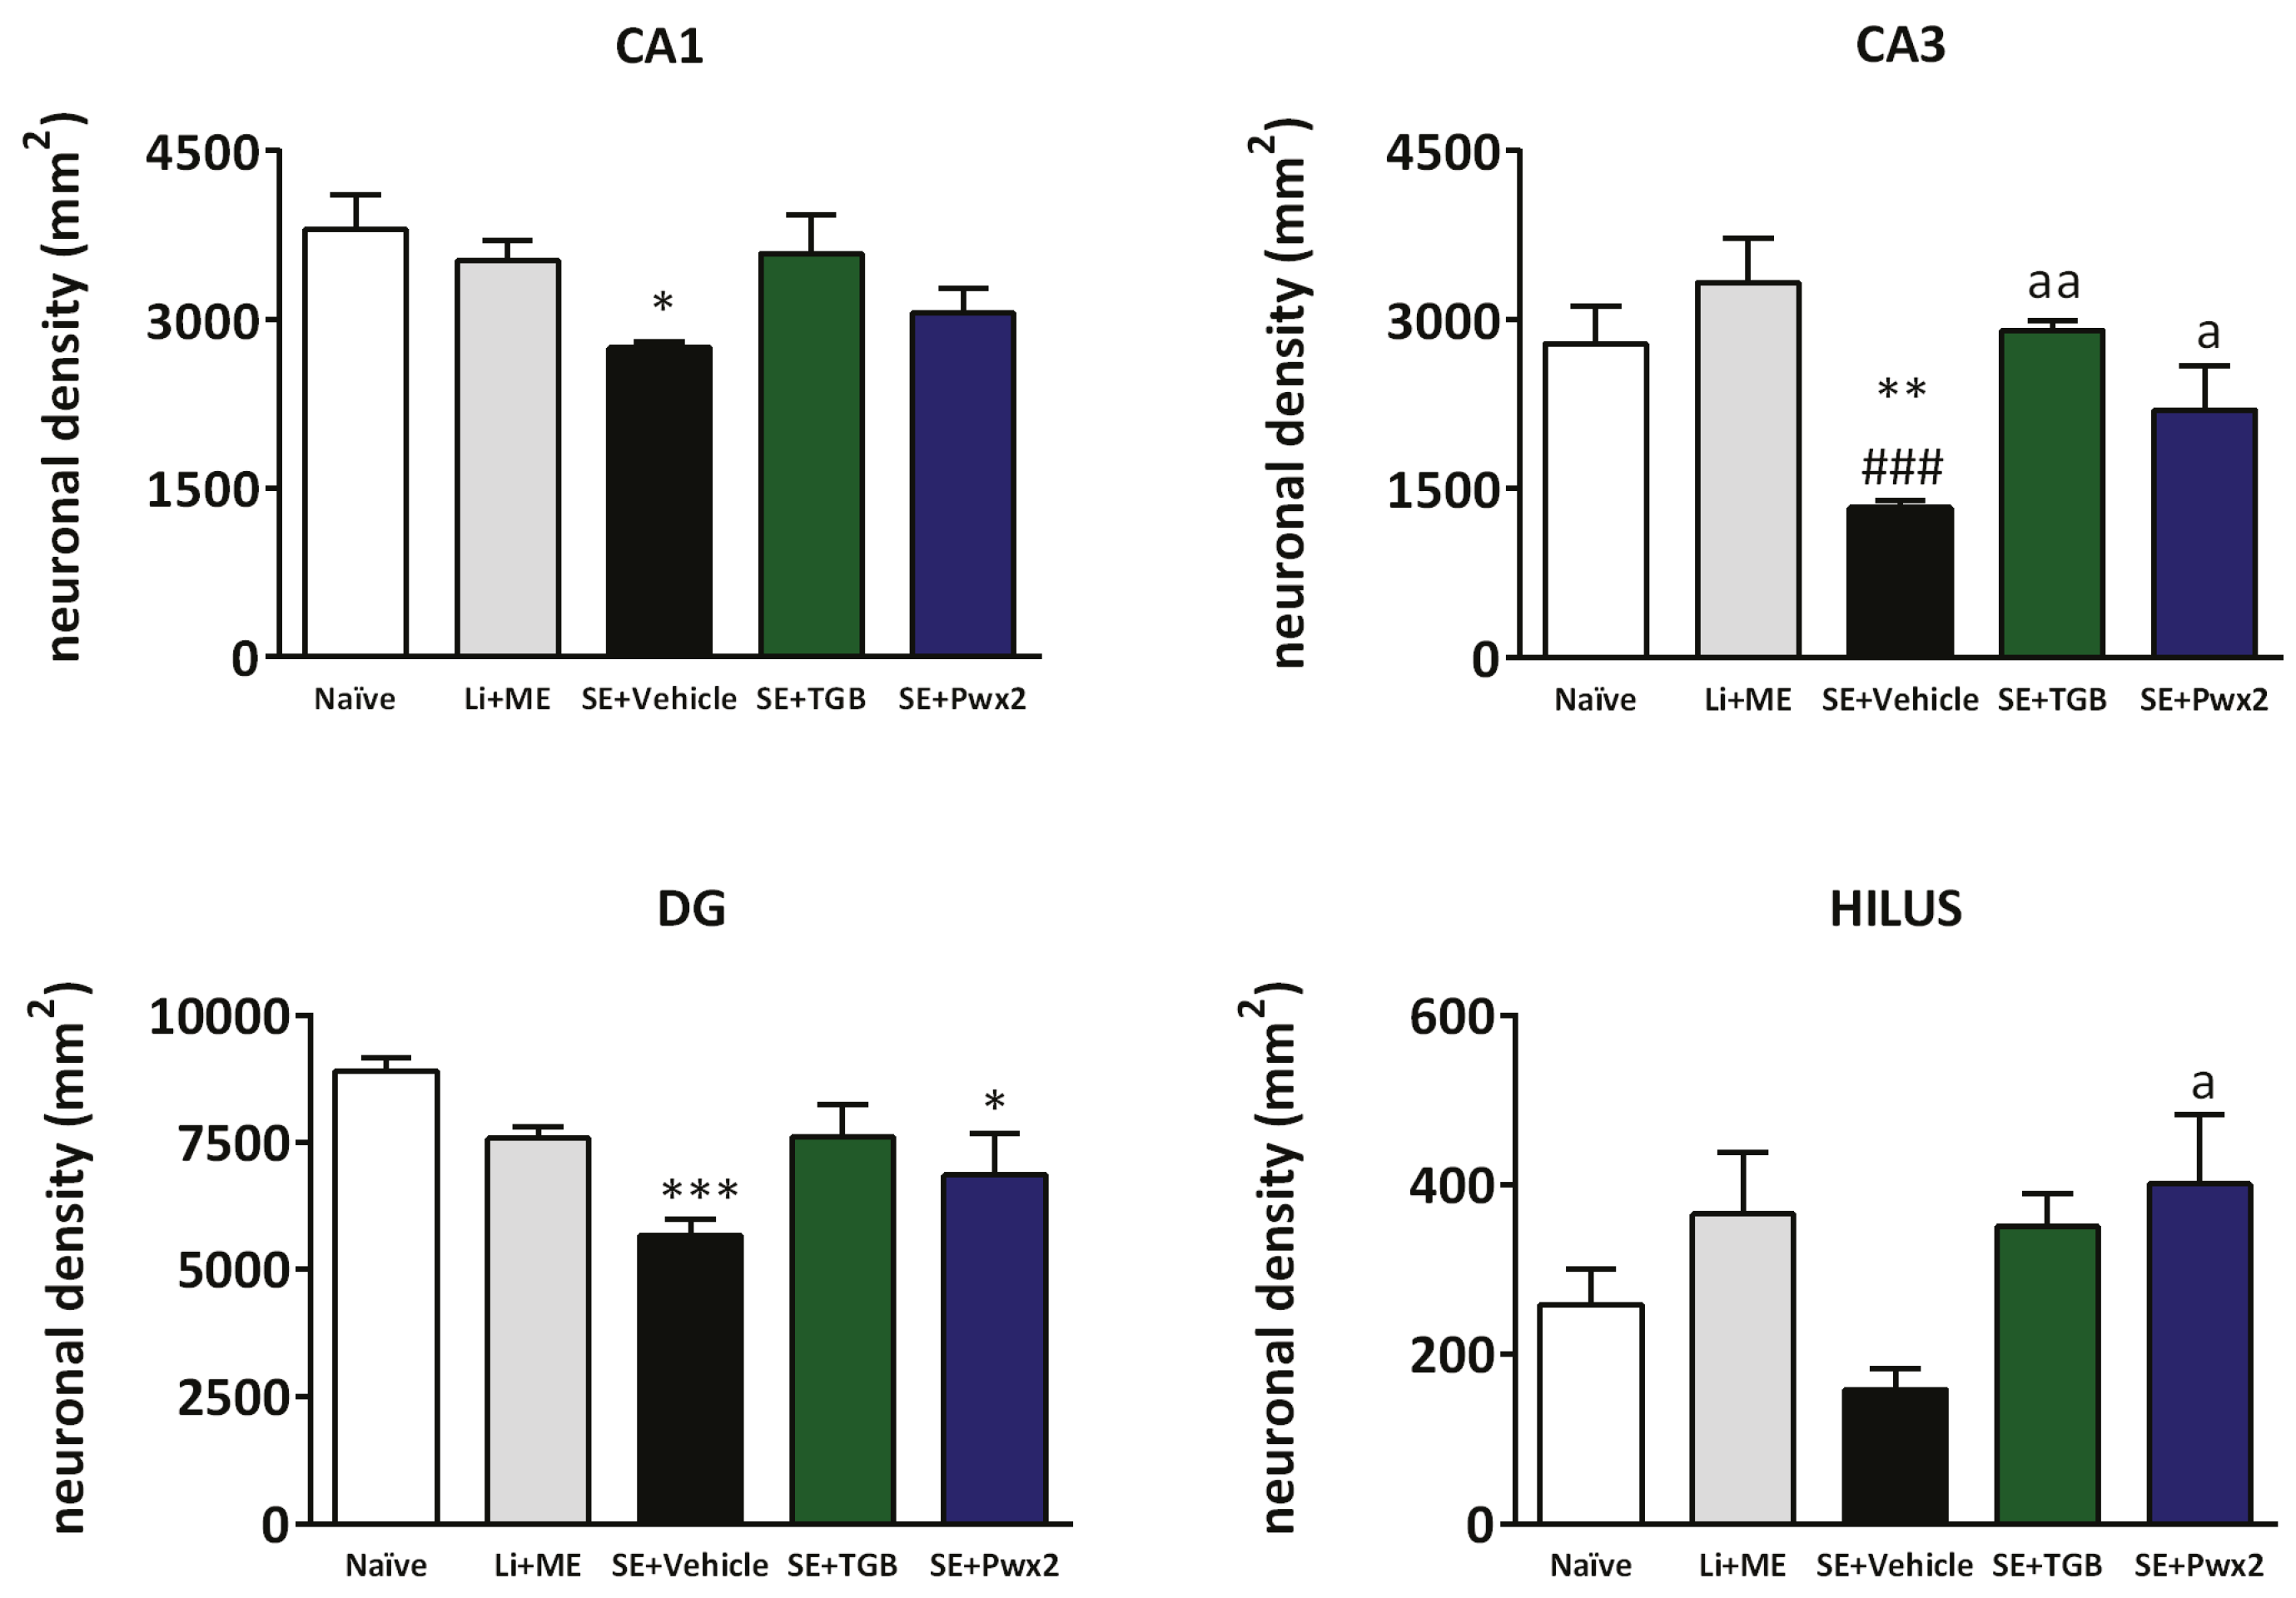
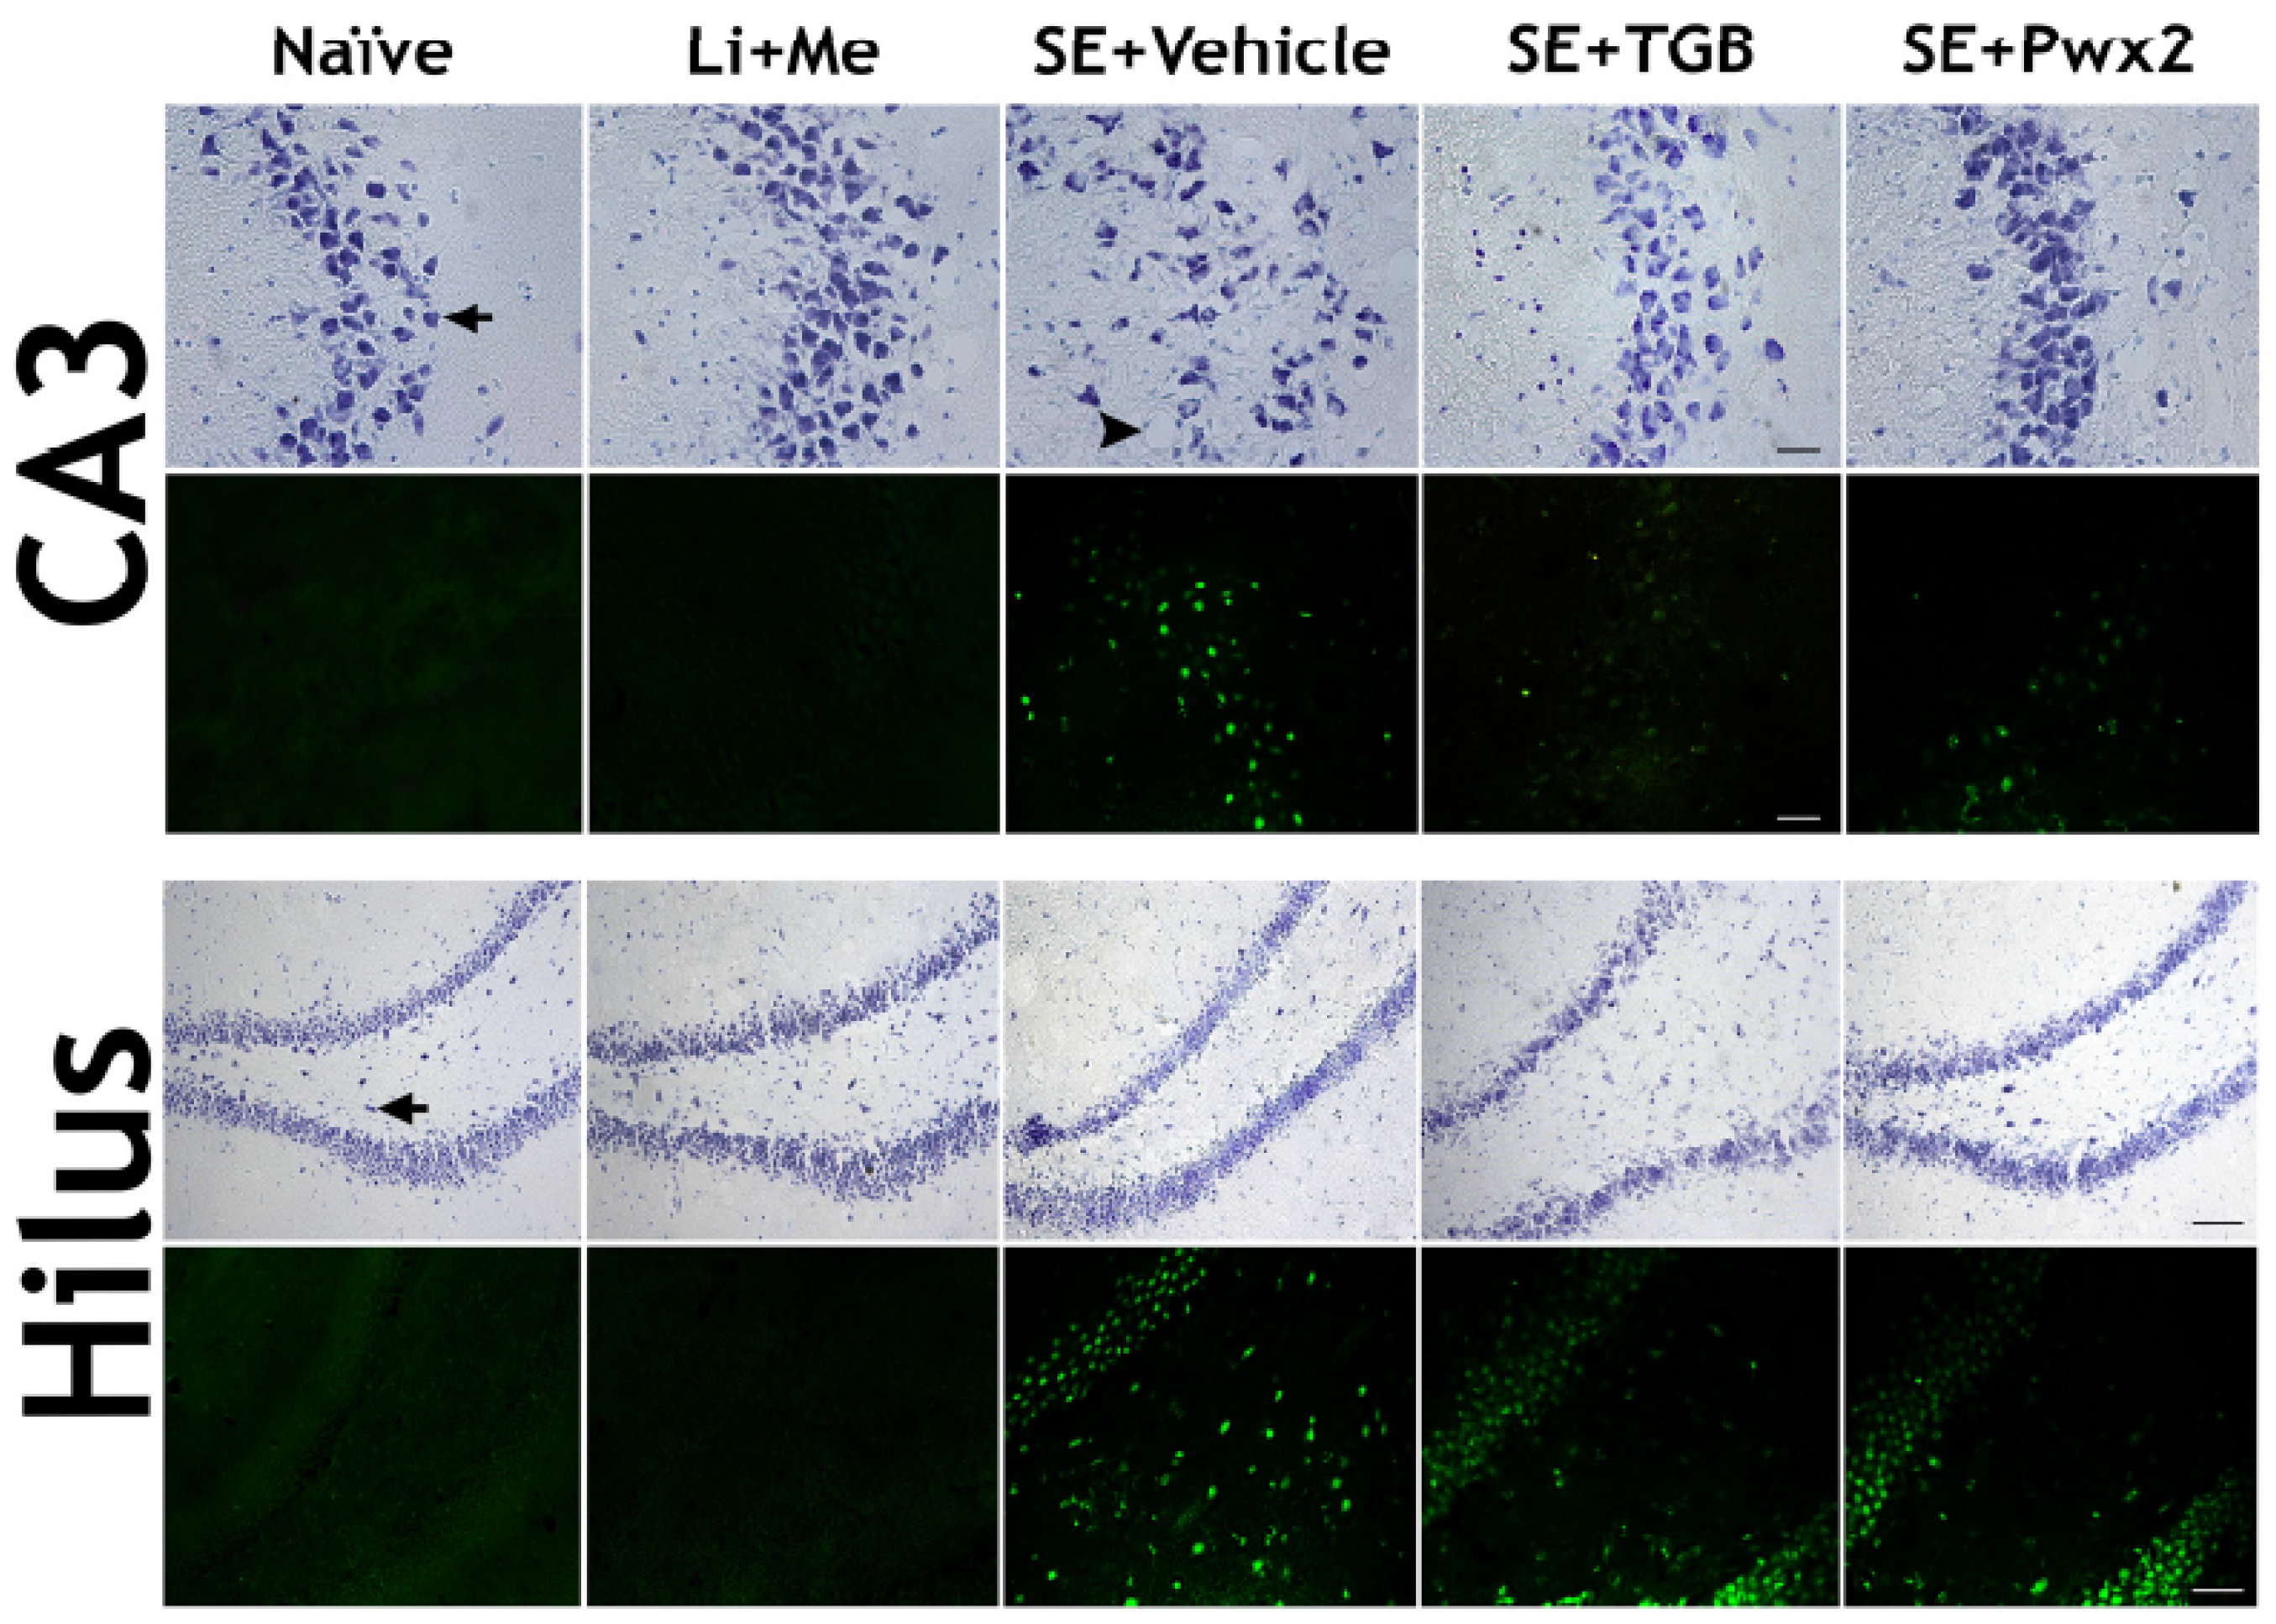
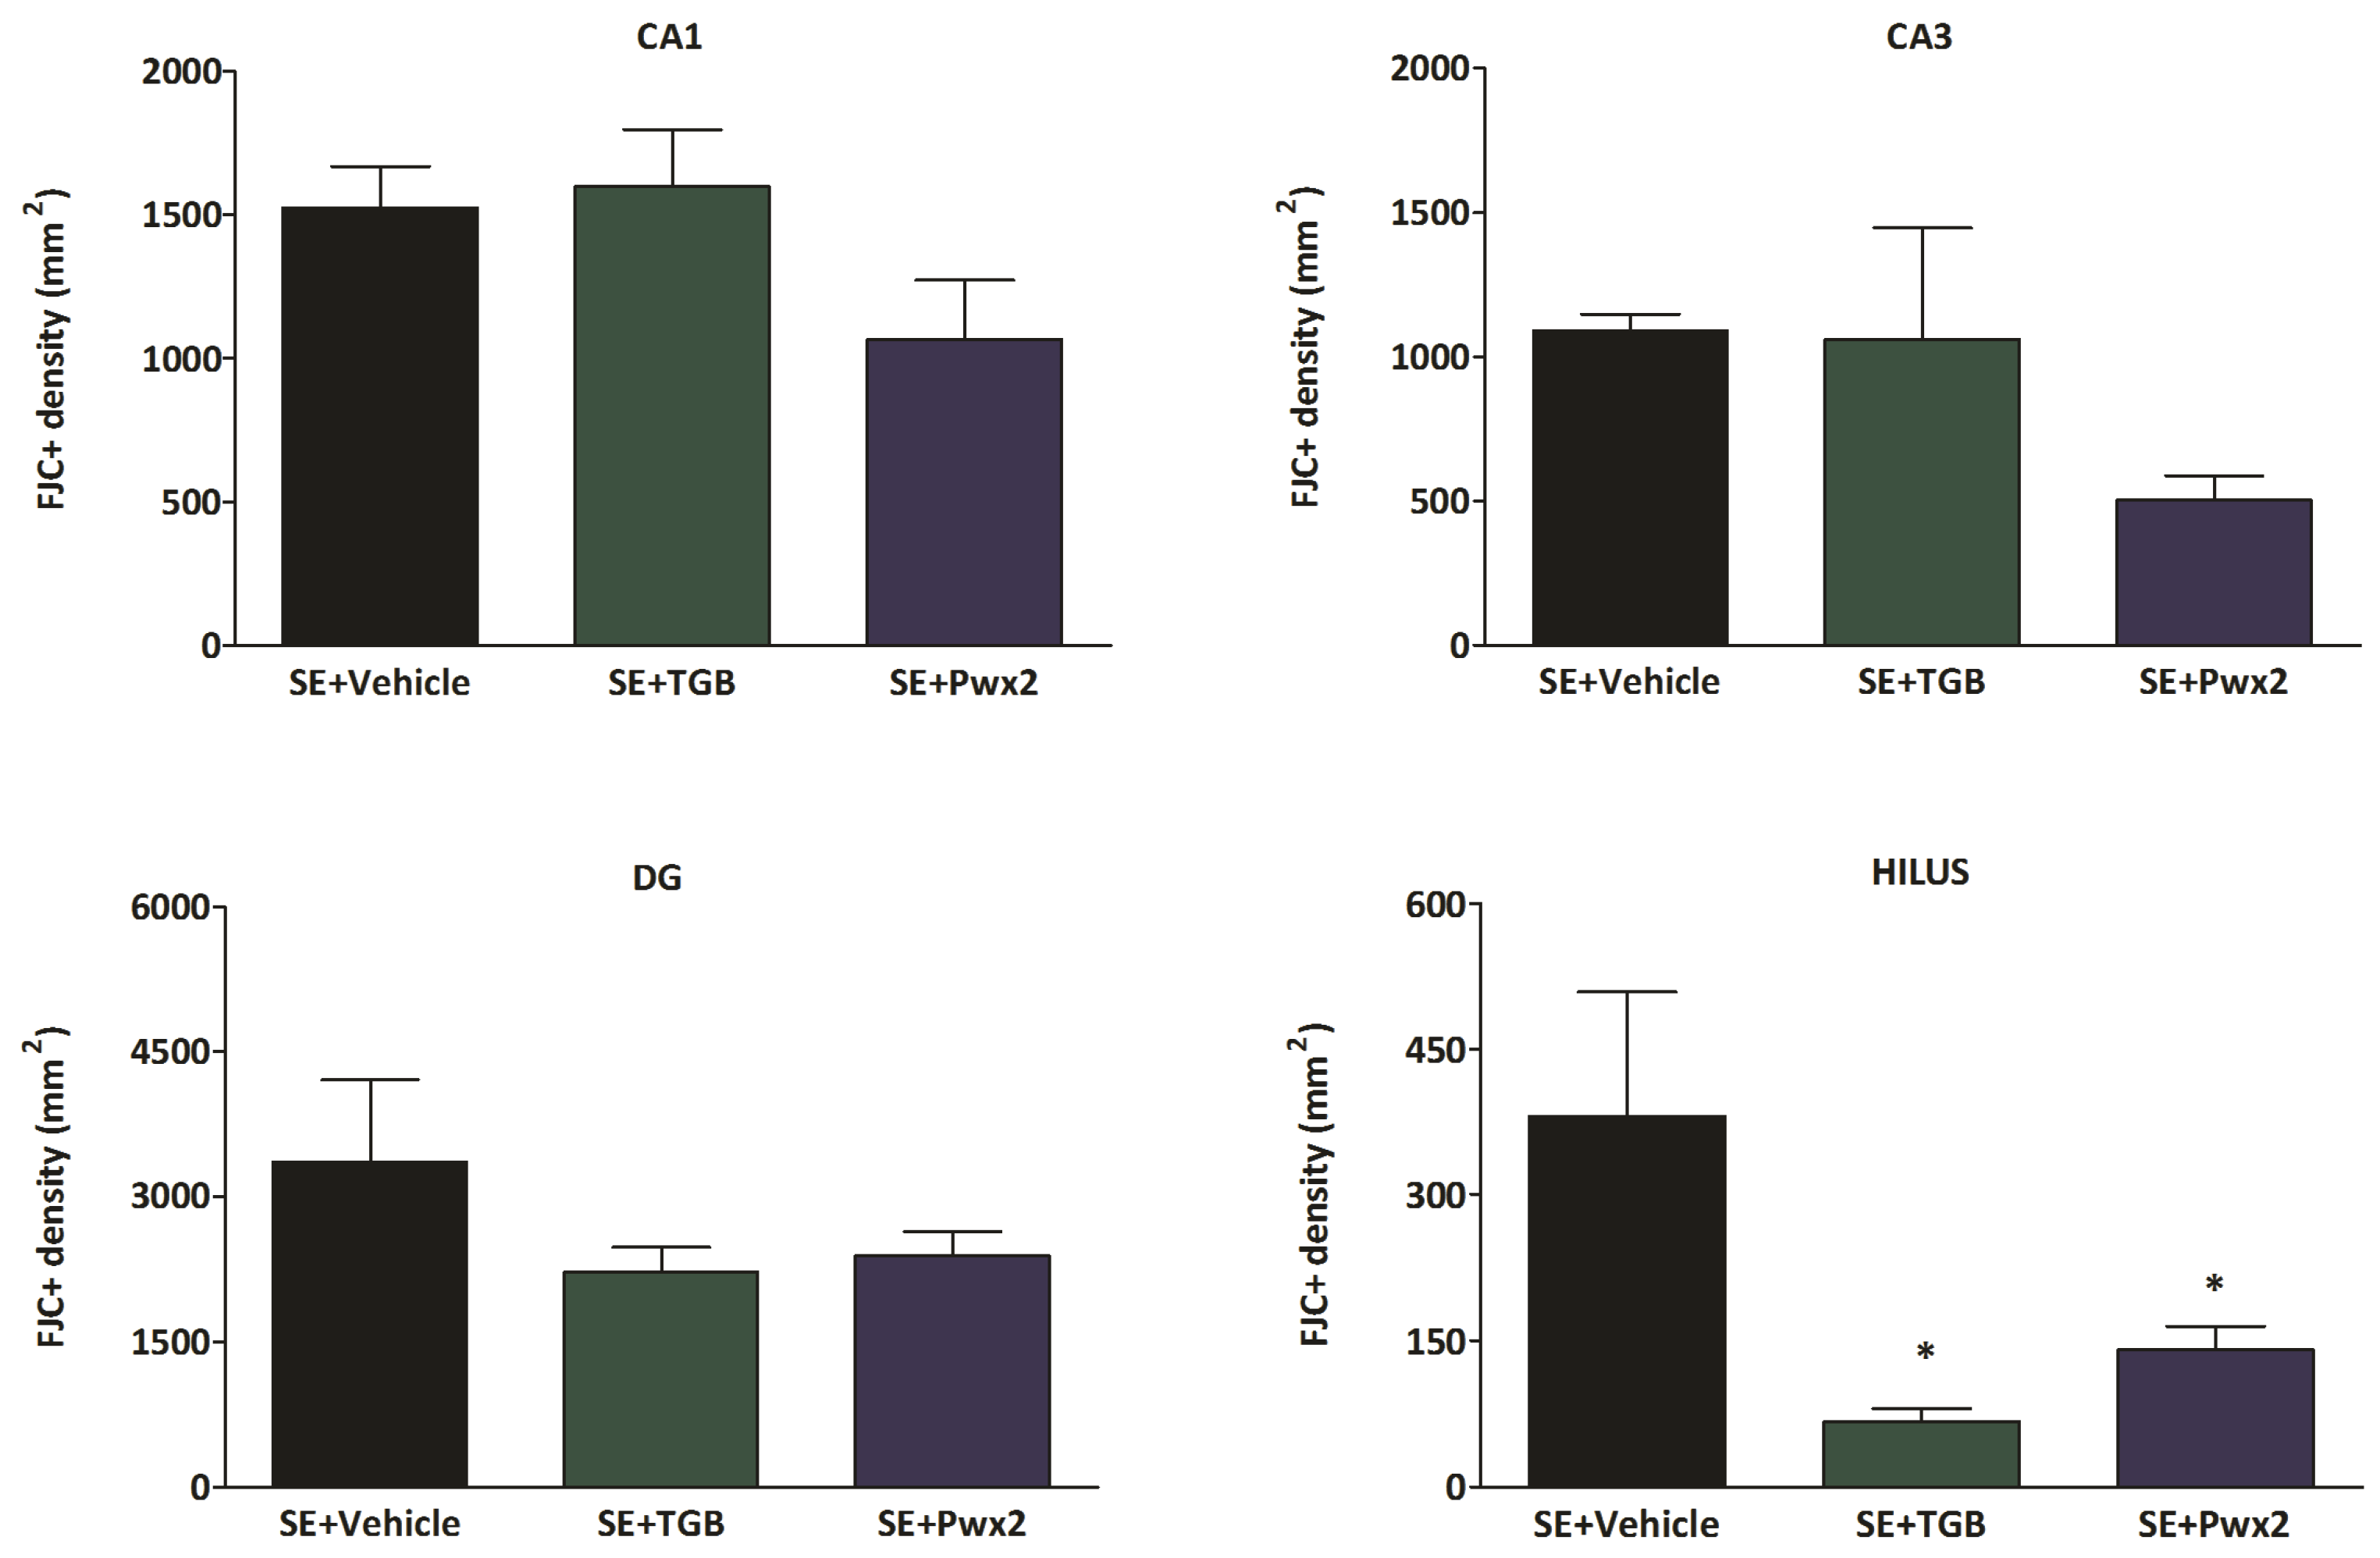
2.3. Histopathological Analysis
2.3.1. Hippocampal Neuronal Protection with Parawixin2 Treatment
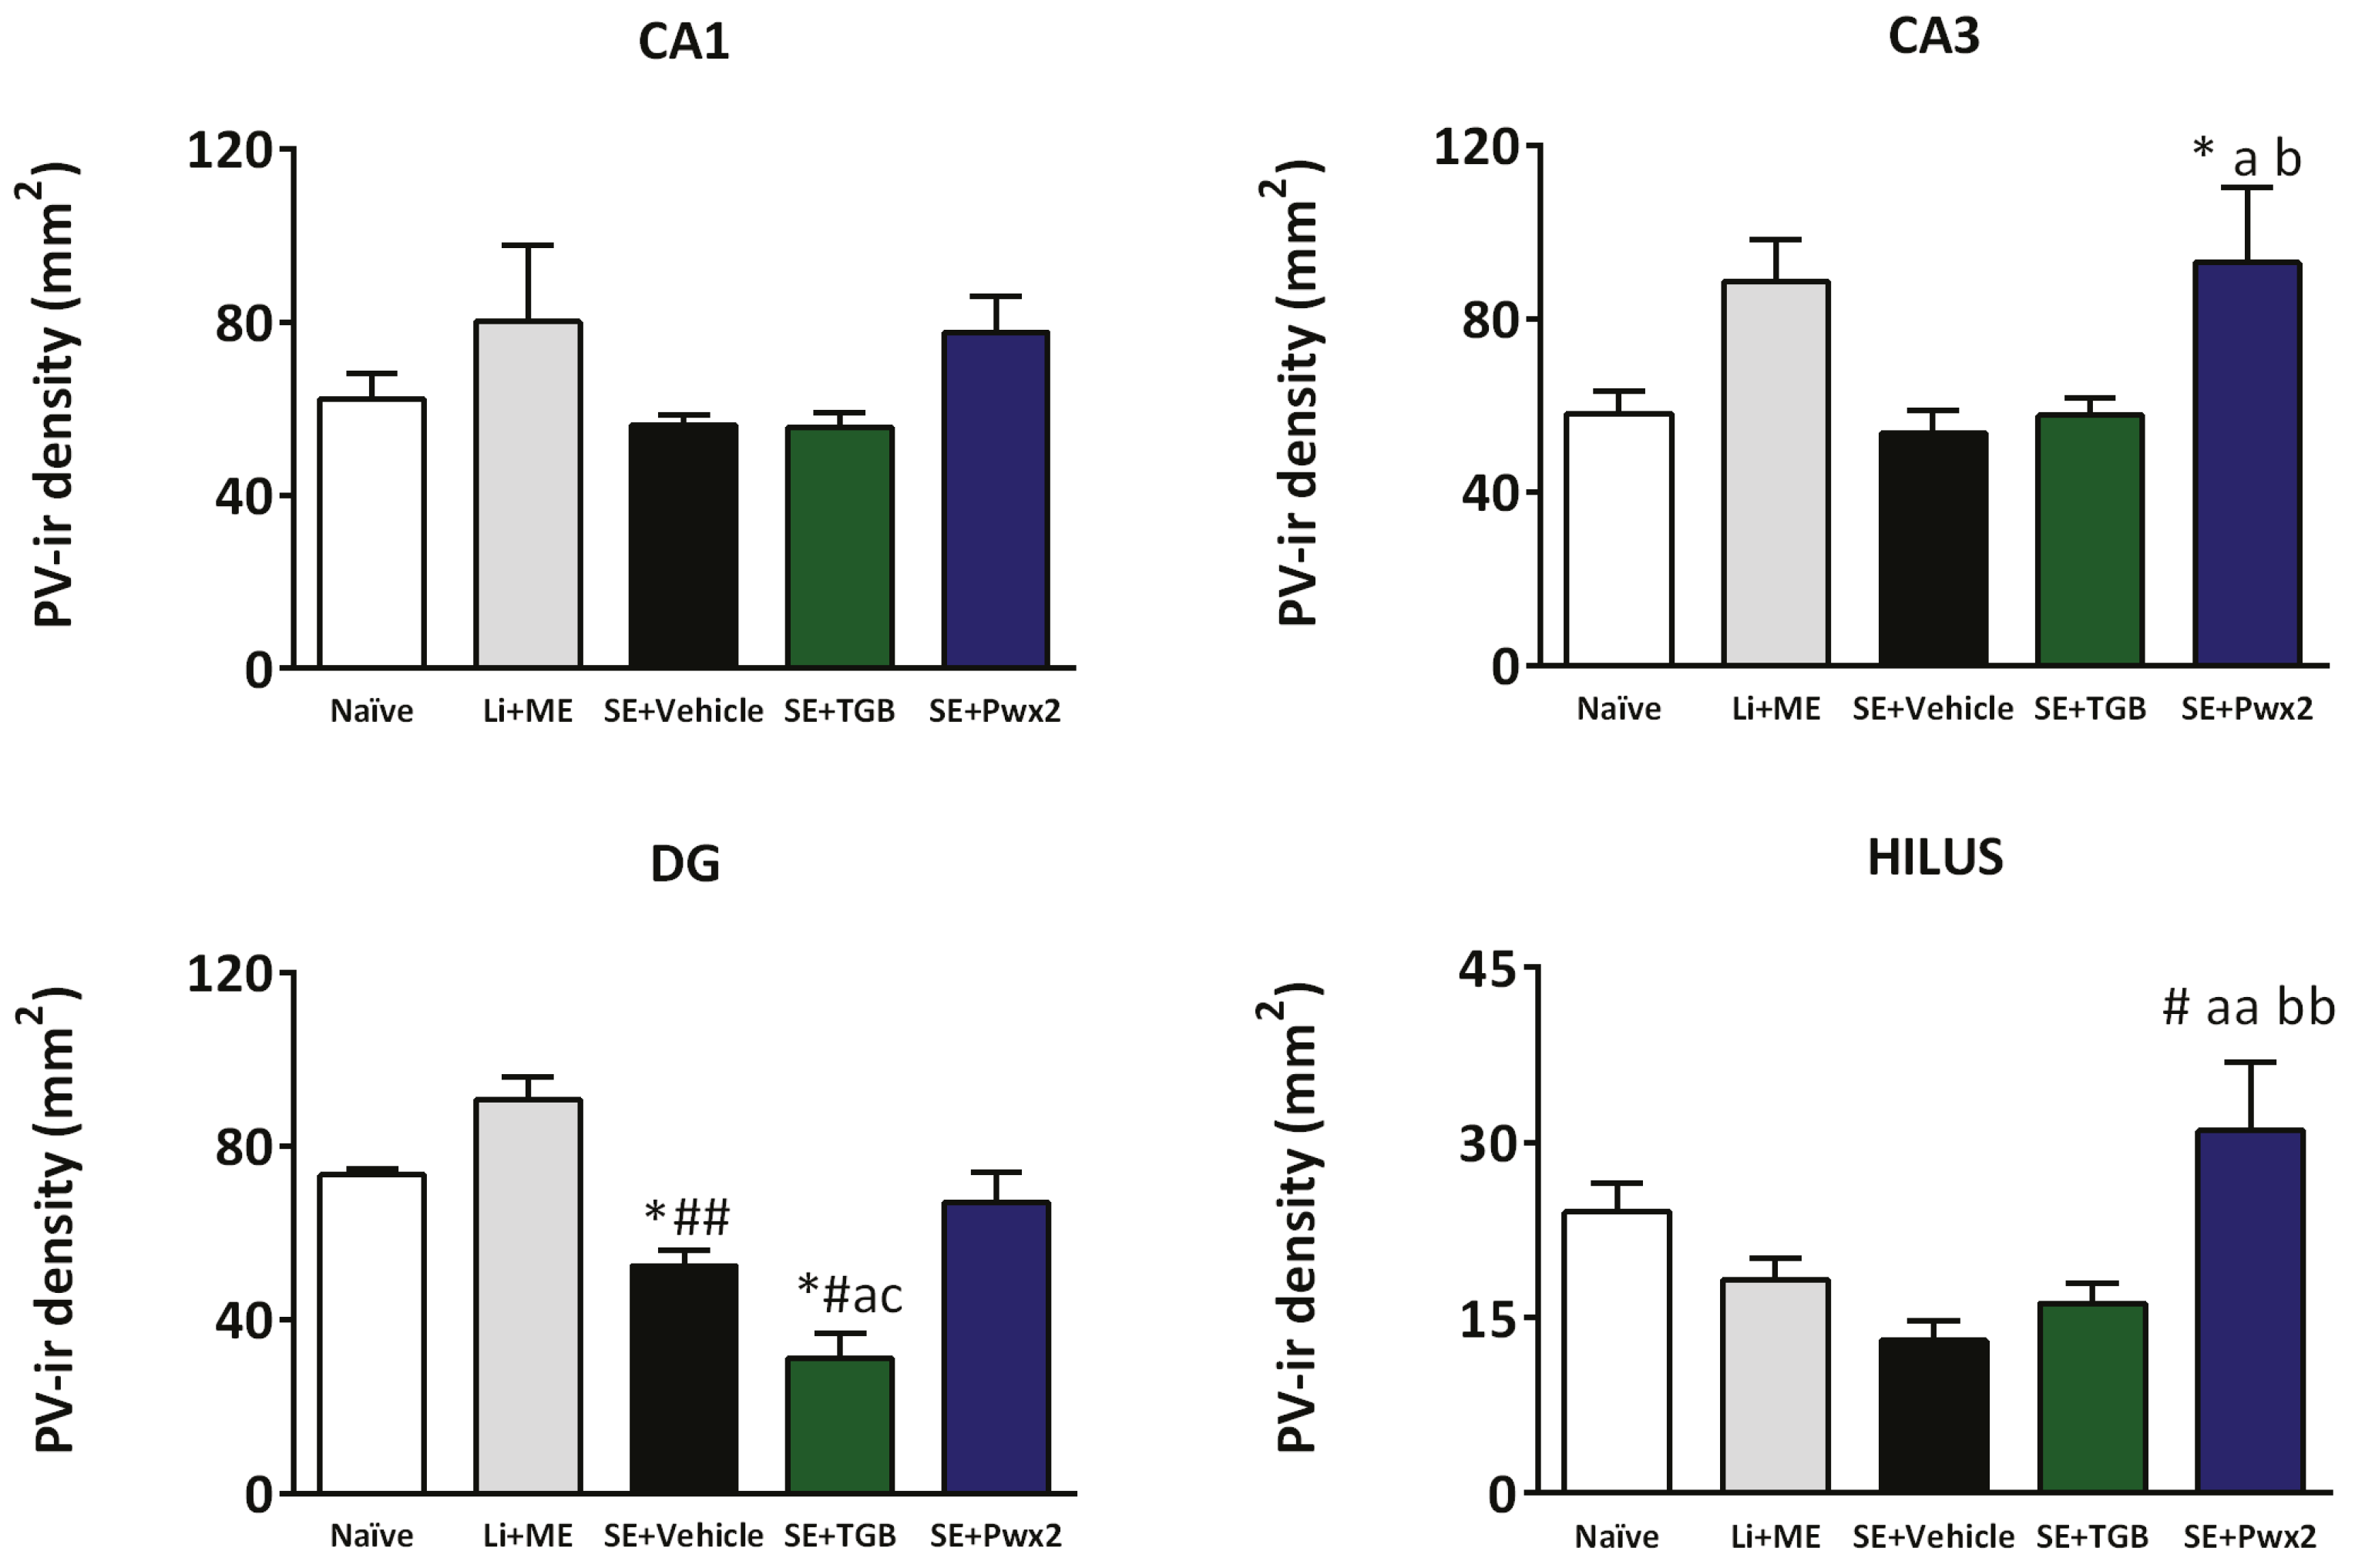
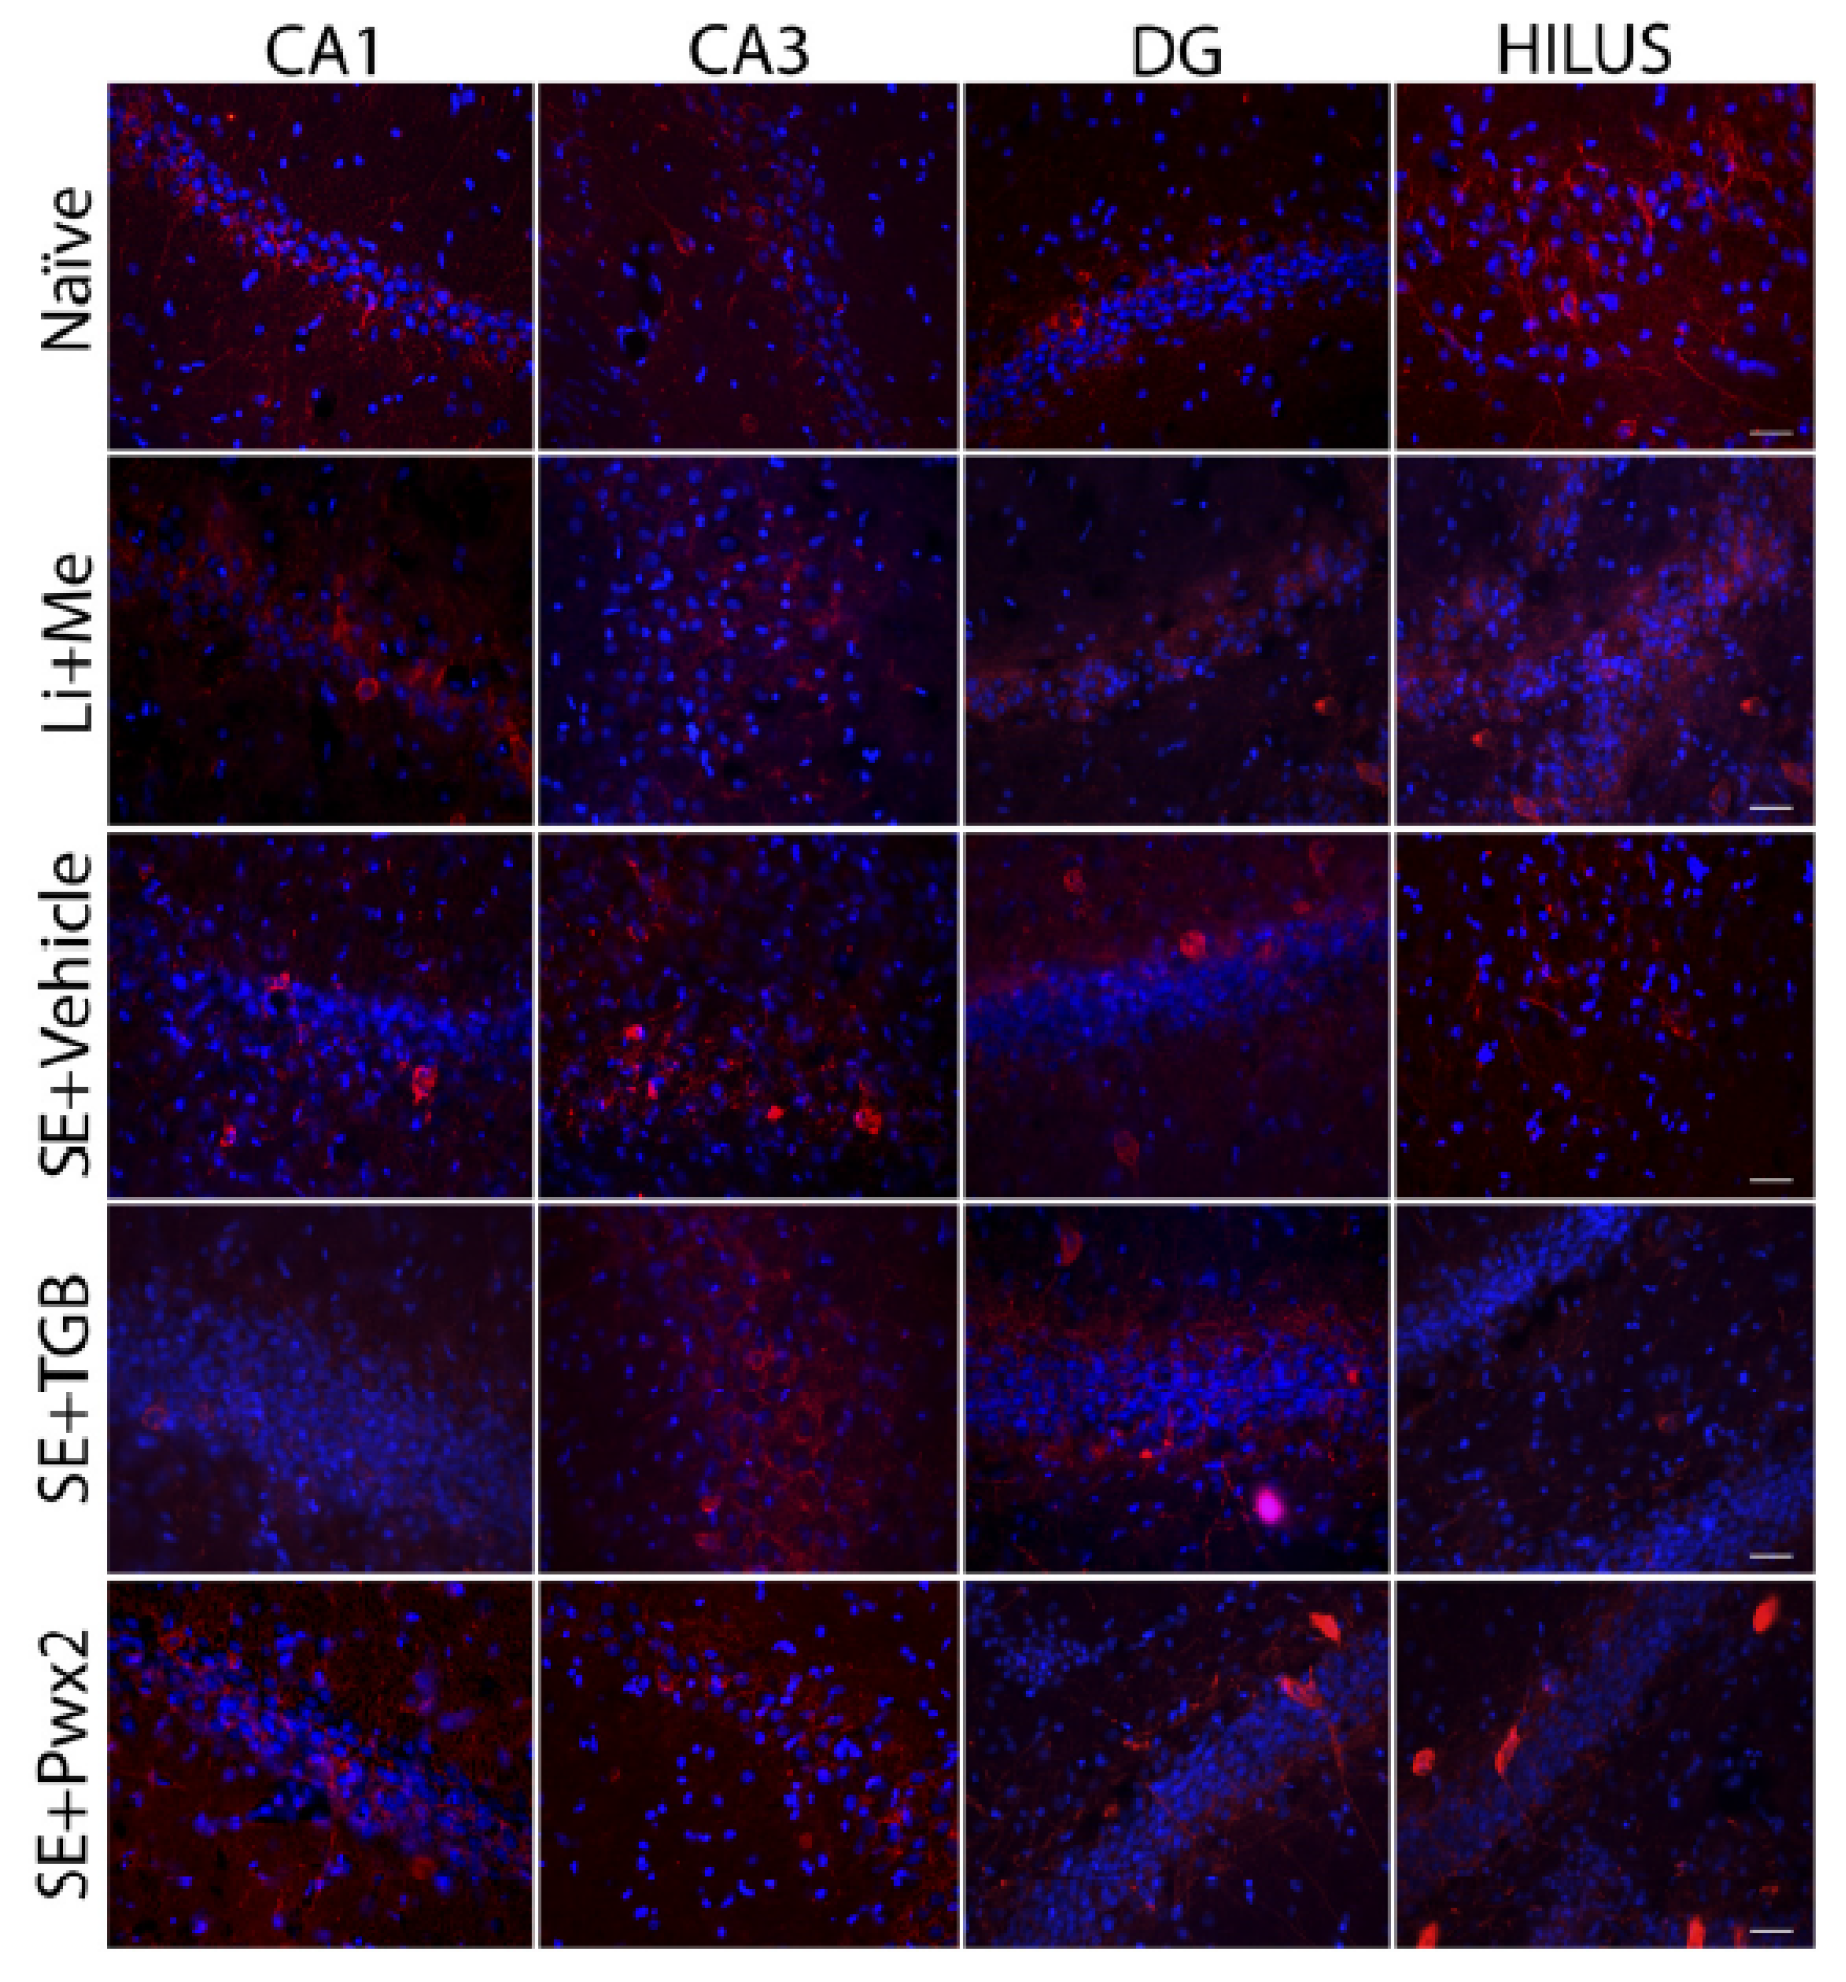
2.3.2. Parawixin2 Treatment Preserved Parvalbuminergic (PV) Cells
3. Discussion
3.1. Effects of Parawixin2 and Tiagabine Treatment on SRS
3.2. Neuroprotective Effects of Parawixin2 and Tiagabine
3.3. Parvalbuminergic Cell Loss in the Chronic Phase of Pilocarpine Model and Effects of Parawixin2 Treatment
4. Conclusions
5. Methods
5.1. Animals
5.2. High Perfomance Liquid Cromatography and Dereplication
5.3. Drugs
5.4. Status Epilepticus Induction
5.5. Spontaneous Recurrent Seizures Monitoring
5.6. Stereotactic Surgery
5.7. Intracerebroventricular Treatment
5.8. Tissue Preparation and Histology
5.9. Nissl Staining
5.10. Detection of Neuronal Degeneration with Fluoro-Jade C
5.11. Parvalbumin Immunostaining
5.12. Quantitative Analysis of Neuronal Damage
5.13. Qualitative Analysis of Neuronal Damage
5.14. Statistical Analysis
Supplementary Materials
Acknowledgments
Author Contributions
Conflicts of Interest
References
- Löscher, W. New visions in the pharmacology of anticonvulsion. Eur. J. Pharmacol. 1998, 342, 1–13. [Google Scholar] [CrossRef]
- Cifelli, P.; Palma, E.; Roseti, C.; Verlengia, G.; Simonato, M. Changes in the sensitivity of GABAA current rundown to drug treatments in a model of temporal lobe epilepsy. Front. Cell. Neurosci. 2013, 7, 108. [Google Scholar] [CrossRef] [PubMed]
- Asadi-Pooya, A.A.; Stewart, G.R.; Abrams, D.J.; Sharan, A. Prevalence and Incidence of Drug-Resistant Mesial Temporal Lobe Epilepsy in the United States. World Neurosurg. 2017, 99, 662–666. [Google Scholar] [CrossRef] [PubMed]
- Buckmaster, P.S.; Zhang, G.F.; Yamawaki, R. Axon sprouting in a model of temporal lobe epilepsy creates a predominantly excitatory feedback circuit. J. Neurosci. 2002, 22, 6650–6658. [Google Scholar] [PubMed]
- Ben-Ari, Y. Seizures beget seizures: The quest for GABA as a key player. Crit. Rev. Neurobiol. 2006, 18, 135–144. [Google Scholar] [CrossRef] [PubMed]
- Anderson, S.A.; Baraban, S.C. Cell Therapy Using GABAergic Neural Progenitors. In Jasper′s Basic Mechanisms of the Epilepsies, 4th ed.; Oxford University Press: Oxford, UK, 2012. [Google Scholar]
- Sloviter, R.S. Permanently altered hippocampal structure, excitability, and inhibition after experimental status epilepticus in the rat: The “dormant basket cell” hypothesis and its possible relevance to temporal lobe epilepsy. Hippocampus 1991, 1, 41–66. [Google Scholar] [CrossRef] [PubMed]
- Chakir, A.; Fabene, P.F.; Ouazzani, R.; Bentivoglio, M. Drug resistance and hippocampal damage after delayed treatment of pilocarpine-induced epilepsy in the rat. Brain Res. Bull. 2006, 71, 127–138. [Google Scholar] [CrossRef] [PubMed]
- DeFelipe, J. Chandelier cells and epilepsy. Brain 1999, 122 Pt 1, 1807–2182. [Google Scholar] [CrossRef] [PubMed]
- Bernard, C. Alterations in synaptic function in epilepsy. In Jasper’s Basic Mechanisms of the Epilepsies, 4th ed.; Noebels, J.L., Avoli, M., Rogawski, M.A., Olsen, R.W., Delgado-Escueta, A.V., Eds.; Oxford University Press: Oxford, UK, 2012; pp. 1–16. [Google Scholar]
- Cossart, R.; Bernard, C.; Ben-Ari, Y. Multiple facets of GABAergic neurons and synapses: Multiple fates of GABA signalling in epilepsies. Trends Neurosci. 2005, 28, 108–115. [Google Scholar] [CrossRef] [PubMed]
- Dalby, N.O.; Mody, I. The process of epileptogenesis: A pathophysiological approach. Curr. Opin. Neurol. 2001, 14, 187–192. [Google Scholar] [CrossRef] [PubMed]
- Meldrum, B.S. GABAergic mechanisms in the pathogenesis and treatment of epilepsy. Br. J. Clin. Pharmacol. 1989, 27 (Suppl. 1), 3S–11S. [Google Scholar] [CrossRef] [PubMed]
- Dalby, N.O. GABA-level increasing and anticonvulsant effects of three different GABA uptake inhibitors. Neuropharmacology 2000, 39, 2399–2407. [Google Scholar] [CrossRef]
- Löscher, W.; Klitgaard, H.; Twyman, R.E.; Schmidt, D. New avenues for anti-epileptic drug discovery and development. Nat. Rev. Drug Discov. 2013, 20, 757–776. [Google Scholar] [CrossRef] [PubMed]
- Bialer, M.; Johannessen, S.I.; Levy, R.H.; Perucca, E.; Tomson, T.; White, H.S. Progress report on new antiepileptic drugs: A summary of the Twelfth Eilat Conference (EILAT XII). Epilepsy Res. 2015, 111, 85–141. [Google Scholar] [CrossRef] [PubMed]
- Madsen, K.K.; White, H.S.; Schousboe, A. Neuronal and non-neuronal GABA transporters as targets for antiepileptic drugs. Pharmacol. Ther. 2010, 125, 394–401. [Google Scholar] [CrossRef] [PubMed]
- Fernandes, M.J.; Da, S. Neuroprotective agents and modulation of temporal lobe epilepsy. Front. Biosci. 2015, 7, 719. [Google Scholar] [CrossRef]
- Monge-Fuentes, V.; Gomes, F.M.M.; Campos, G.A.A.; de Castro Silva, J.; Biolchi, A.M.; dos Anjos, L.C. Neuroactive compounds obtained from arthropod venoms as new therapeutic platforms for the treatment of neurological disorders. J. Venom. Anim. Toxins Incl. Trop. Dis. 2015, 21, 31. [Google Scholar] [CrossRef] [PubMed]
- Beleboni, R.O.; Guizzo, R.; Fontana, A.C.K.; Pizzo, A.B.; Carolino, R.O.G.; Gobbo-Neto, L.; Lopes, N.P.; Coutinho-Netto, J.; Ferreira dos Santos, W. Neurochemical characterization of a neuroprotective compound from Parawixia bistriata spider venom that inhibits synaptosomal uptake of GABA and glycine. Mol. Pharmacol. 2006, 69, 1998–2006. [Google Scholar] [CrossRef] [PubMed]
- Cairrão, M.A.R.; Ribeiro, A.M.; Pizzo, A.B.; Fontana, A.C.K.; Beleboni, R.O.; Coutinho-Netto, J.; Miranda, A.; Santos, W.F. Anticonvulsant and GABA Uptake Inhibition Properties of Venom Fractions from the Spiders Parawixia bistriata and Scaptocosa raptoria. Pharm. Biol. 2002, 40, 472–477. [Google Scholar] [CrossRef]
- Liberato, J.L.; Cunha, A.O.S.; Mortari, M.R.; Gelfuso, E.A.; Beleboni, R.D.O.; Coutinho-Netto, J. Anticonvulsant and anxiolytic activity of FrPbAII, a novel GABA uptake inhibitor isolated from the venom of the social spider Parawixia bistriata (Araneidae: Araneae). Brain Res. 2006, 1124, 19–27. [Google Scholar] [CrossRef] [PubMed]
- Gelfuso, E.A.; Cunha, A.O.S.; Mortari, M.R.; Liberato, J.L.; Paraventi, K.H.; Beleboni, R.O.; Coutinho-Netto, J.; Lopes, N.P.; Dos Santos, W.F. Neuropharmacological profile of FrPbAII, purified from the venom of the social spider Parawixia bistriata (Araneae, Araneidae), in Wistar rats. Life Sci. 2007, 80, 566–572. [Google Scholar] [CrossRef] [PubMed]
- Gelfuso, E.A.; Liberato, J.L.; Cunha, A.O.S.; Mortari, M.R.; Beleboni, R.O.; Lopes, N.P.; Dos Santos, W.F. Parawixin2, a novel non-selective GABA uptake inhibitor from Parawixia bistriata spider venom, inhibits pentylenetetrazole-induced chemical kindling in rats. Neurosci. Lett. 2013, 543, 12–16. [Google Scholar] [CrossRef] [PubMed]
- Pitkänen, A.; Nissinen, J.; Nairismägi, J.; Lukasiuk, K.; Gröhn, O.H.J.; Miettinen, R. Progression of neuronal damage after status epilepticus and during spontaneous seizures in a rat model of temporal lobe epilepsy. Prog. Brain Res. 2002, 135, 67–83. [Google Scholar] [PubMed]
- Turski, W.A.; Cavalheiro, E.A.; Schwarz, M.; Czuczwar, S.J.; Kleinrok, Z.; Turski, L. Limbic seizures produced by pilocarpine in rats: Behavioural, electroencephalographic and neuropathological study. Behav. Brain Res. 1983, 9, 315–335. [Google Scholar] [CrossRef]
- Curia, G.; Longo, D.; Biagini, G.; Jones, R.S.G.; Avoli, M. The pilocarpine model of temporal lobe epilepsy. J. Neurosci. Methods 2008, 172, 143–157. [Google Scholar] [CrossRef] [PubMed]
- Stables, J.P.; Bertram, E.; Dudek, F.E.; Holmes, G.; Mathern, G.; Pitkanen, A.; White, H.S. Therapy discovery for pharmacoresistant epilepsy and for disease-modifying therapeutics: summary of the NIH/NINDS/AES models II workshop. Epilepsia 2003, 44, 1472–1478. [Google Scholar] [CrossRef] [PubMed]
- Arida, R.M.; Scorza, F.A.; Peres, C.A.; Cavalheiro, E.A. The course of untreated seizures in the pilocarpine model of epilepsy. Epilepsy Res. 1999, 34, 99–107. [Google Scholar] [CrossRef]
- Halonen, T.; Nissinen, J.; Jansen, J.A.; Pitkänen, A. Tiagabine prevents seizures, neuronal damage and memory impairment in experimental status epilepticus. Eur. J. Pharmacol. 1996, 299, 69–81. [Google Scholar] [CrossRef]
- Nielsen, E.B.; Suzdak, P.D.; Andersen, K.E.; Knutsen, L.J.; Sonnewald, U.; Braestrup, C. Characterization of tiagabine (NO-328), a new potent and selective GABA uptake inhibitor. Eur. J. Pharmacol. 1991, 196, 257–266. [Google Scholar] [CrossRef]
- Faingold, C.L.; Randall, M.E.; Anderson, C.A. Blockade of GABA uptake with tiagabine inhibits audiogenic seizures and reduces neuronal firing in the inferior colliculus of the genetically epilepsy-prone rat. Exp. Neurol. 1994, 126, 225–232. [Google Scholar] [CrossRef] [PubMed]
- Smith, S.E.; Parvez, N.S.; Chapman, A.G.; Meldrum, B.S. The gamma-aminobutyric acid uptake inhibitor, tiagabine, is anticonvulsant in two animal models of reflex epilepsy. Eur. J. Pharmacol. 1995, 273, 259–265. [Google Scholar] [CrossRef]
- Suzdak, P.D.; Jansen, J.A. A review of the preclinical pharmacology of tiagabine: a potent and selective anticonvulsant GABA uptake inhibitor. Epilepsia 1995, 36, 612–626. [Google Scholar] [CrossRef] [PubMed]
- Morimoto, K.; Sato, H.; Yamamoto, Y.; Watanabe, T.; Suwaki, H. Antiepileptic effects of tiagabine, a selective GABA uptake inhibitor, in the rat kindling model of temporal lobe epilepsy. Epilepsia 1997, 38, 966–974. [Google Scholar] [CrossRef] [PubMed]
- Coleman, M.H.; Yamaguchi, S.; Rogawski, M.A. Protection against dendrotoxin-induced clonic seizures in mice by anticonvulsant drugs. Brain Res. 1992, 575, 138–142. [Google Scholar] [CrossRef]
- Cope, D.W.; Hughes, S.W.; Crunelli, V. GABAA receptor-mediated tonic inhibition in thalamic neurons. J. Neurosci. 2005, 25, 11553–11563. [Google Scholar] [CrossRef] [PubMed]
- Löscher, W.; Potschka, H. Role of multidrug transporters in pharmacoresistance to antiepileptic drugs. J. Pharmacol. Exp. Ther. 2002, 301, 7–14. [Google Scholar] [CrossRef] [PubMed]
- Rekling, J.C. Neuroprotective effects of anticonvulsants in rat hippocampal slice cultures exposed to oxygen/glucose deprivation. Neurosci. Lett. 2003, 335, 167–170. [Google Scholar] [CrossRef]
- Iqbal, S.; Baziany, A.; Gordon, S.; Wright, S.; Hussain, M.; Miyashita, H.; Shuaib, A.; Hasan Rajput, A. Neuroprotective effect of tiagabine in transient forebrain global ischemia: An in vivo microdialysis, behavioral, and histological study. Brain Res. 2002, 946, 162–170. [Google Scholar] [CrossRef]
- Wang, C.X.; Yang, Y.; Li, Q.; Shuaib, A. Neuroprotective activity of tiagabine in a focal embolic model of cerebral ischemia. Brain Res. 2000, 874, 75–77. [Google Scholar]
- Masuda, N.; Peng, Q.; Li, Q.; Jiang, M.; Liang, Y.; Wang, X.; Zhao, M.; Wang, W.; Ross, C.A.; Duan, W. Tiagabine is neuroprotective in the N171–82Q and R6/2 mouse models of Huntington’s disease. Neurobiol. Dis. 2008, 30, 293–302. [Google Scholar] [CrossRef] [PubMed]
- Long, L.; Xiao, B.; Feng, L.; Yi, F.; Li, G.; Li, S.; Mutasem, M.A.; Chen, S.; Bi, F.; Li, Y. Selective loss and axonal sprouting of GABAergic interneurons in the sclerotic hippocampus induced by LiCl-pilocarpine. Int. J. Neurosci. 2011, 121, 69–85. [Google Scholar] [CrossRef] [PubMed]
- Wang, L.; Liu, Y.-H.; Huang, Y.-G.; Chen, L.-W. Time-course of neuronal death in the mouse pilocarpine model of chronic epilepsy using Fluoro-Jade C staining. Brain Res. 2008, 1241, 157–167. [Google Scholar] [CrossRef] [PubMed]
- Wittner, L.; Maglóczky, Z.; Borhegyi, Z.; Halász, P.; Tóth, S.; Eross, L.; Szabó, Z.; Freund, T.F. Preservation of perisomatic inhibitory input of granule cells in the epileptic human dentate gyrus. Neuroscience 2001, 108, 587–600. [Google Scholar] [CrossRef]
- De Guzman, P.; Inaba, Y.; Baldelli, E.; de Curtis, M.; Biagini, G.; Avoli, M. Network hyperexcitability within the deep layers of the pilocarpine-treated rat entorhinal cortex. J. Physiol. 2008, 586, 1867–1883. [Google Scholar] [CrossRef] [PubMed]
- Krook-Magnuson, E.; Armstrong, C.; Oijala, M.; Soltesz, I. On-demand optogenetic control of spontaneous seizures in temporal lobe epilepsy. Nat. Commun. 2013, 4, 1376. [Google Scholar] [CrossRef] [PubMed]
- Mathern, G.W.; Babb, T.L.; Pretorius, J.K.; Melendez, M.; Lévesque, M.F. The pathophysiologic relationships between lesion pathology, intracranial ictal EEG onsets, and hippocampal neuron losses in temporal lobe epilepsy. Epilepsy Res. 1995, 21, 133–147. [Google Scholar] [CrossRef]
- Arellano, J.I.; Muñoz, A.; Ballesteros-Yáñez, I.; Sola, R.G.; DeFelipe, J. Histopathology and reorganization of chandelier cells in the human epileptic sclerotic hippocampus. Brain 2004, 127 Pt 1, 45–64. [Google Scholar] [CrossRef] [PubMed]
- André, V.; Marescaux, C.; Nehlig, A.; Fritschy, J.M. Alterations of hippocampal GAbaergic system contribute to development of spontaneous recurrent seizures in the rat lithium-pilocarpine model of temporal lobe epilepsy. Hippocampus 2001, 11, 452–468. [Google Scholar] [CrossRef] [PubMed]
- Thind, K.K.; Yamawaki, R.; Phanwar, I.; Zhang, G.; Wen, X.; Buckmaster, P.S. Initial loss but later excess of GABAergic synapses with dentate granule cells in a rat model of temporal lobe epilepsy. J. Comp. Neurol. 2010, 518, 647–667. [Google Scholar] [CrossRef] [PubMed]
- Racine, R.J. Modification of seizure activity by electrical stimulation. II. Motor seizure. Electroencephalogr. Clin. Neurophysiol. 1972, 32, 281–294. [Google Scholar] [CrossRef]
- Rigoulot, M.; Koning, E.; Ferrandon, A.; Nehlig, A. Neuroprotective Properties of Topiramate in the Lithium- Pilocarpine Model of Epilepsy. Pharmacology 2004, 308, 787–795. [Google Scholar] [CrossRef] [PubMed]
- Borden, L.A.; Murali Dhar, T.G.; Smith, K.E.; Weinshank, R.L.; Branchek, T.A.; Gluchowski, C. Tiagabine, SK&F 89976-A, CI-966, and NNC-711 are selective for the cloned GABA transporter GAT-1. Eur. J. Pharmacol. 1994, 269, 219–224. [Google Scholar] [PubMed]
- Paxinos, G.; Watson, C. The Rat Brain in Stereotaxic Coordinates, 4th ed.; Paxinos, G., Watson, C., Eds.; Academic Press: San Diego, CA, USA, 1998; p. 456. [Google Scholar]
- Castro, O.W.; Furtado, M.A.; Tilelli, C.Q.; Fernandes, A.; Pajolla, G.P.; Garcia-Cairasco, N. Comparative neuroanatomical and temporal characterization of FluoroJade-positive neurodegeneration after status epilepticus induced by systemic and intrahippocampal pilocarpine in Wistar rats. Brain Res. 2011, 1374, 43–55. [Google Scholar] [CrossRef] [PubMed]
- Kwak, S.-E.; Kim, J.-E.; Kim, D.-S.; Jung, J.-Y.; Won, M.H.; Kwon, O.-S.; Choi, S.-Y.; Kang, T.-C. Effects of GABAergic transmissions on the immunoreactivities of calcium binding proteins in the gerbil hippocampus. J. Comp. Neurol. 2005, 485, 153–164. [Google Scholar] [CrossRef] [PubMed]


© 2017 by the authors. Licensee MDPI, Basel, Switzerland. This article is an open access article distributed under the terms and conditions of the Creative Commons Attribution (CC BY) license (http://creativecommons.org/licenses/by/4.0/).
Share and Cite
Godoy, L.D.; Liberato, J.L.; Celani, M.V.B.; Gobbo-Neto, L.; Lopes, N.P.; Dos Santos, W.F. Disease Modifying Effects of the Spider Toxin Parawixin2 in the Experimental Epilepsy Model. Toxins 2017, 9, 262. https://doi.org/10.3390/toxins9090262
Godoy LD, Liberato JL, Celani MVB, Gobbo-Neto L, Lopes NP, Dos Santos WF. Disease Modifying Effects of the Spider Toxin Parawixin2 in the Experimental Epilepsy Model. Toxins. 2017; 9(9):262. https://doi.org/10.3390/toxins9090262
Chicago/Turabian StyleGodoy, Lívea Dornela, José Luiz Liberato, Marcus Vinícius Batista Celani, Leonardo Gobbo-Neto, Norberto Peporine Lopes, and Wagner Ferreira Dos Santos. 2017. "Disease Modifying Effects of the Spider Toxin Parawixin2 in the Experimental Epilepsy Model" Toxins 9, no. 9: 262. https://doi.org/10.3390/toxins9090262
APA StyleGodoy, L. D., Liberato, J. L., Celani, M. V. B., Gobbo-Neto, L., Lopes, N. P., & Dos Santos, W. F. (2017). Disease Modifying Effects of the Spider Toxin Parawixin2 in the Experimental Epilepsy Model. Toxins, 9(9), 262. https://doi.org/10.3390/toxins9090262