
Microbial Detoxification of Deoxynivalenol (DON), Assessed via a Lemna minor L. Bioassay, through Biotransformation to 3-epi-DON and 3-epi-DOM-1


 ,
,  ,
,  ,
, 
Abstract
:1. Introduction
2. Results
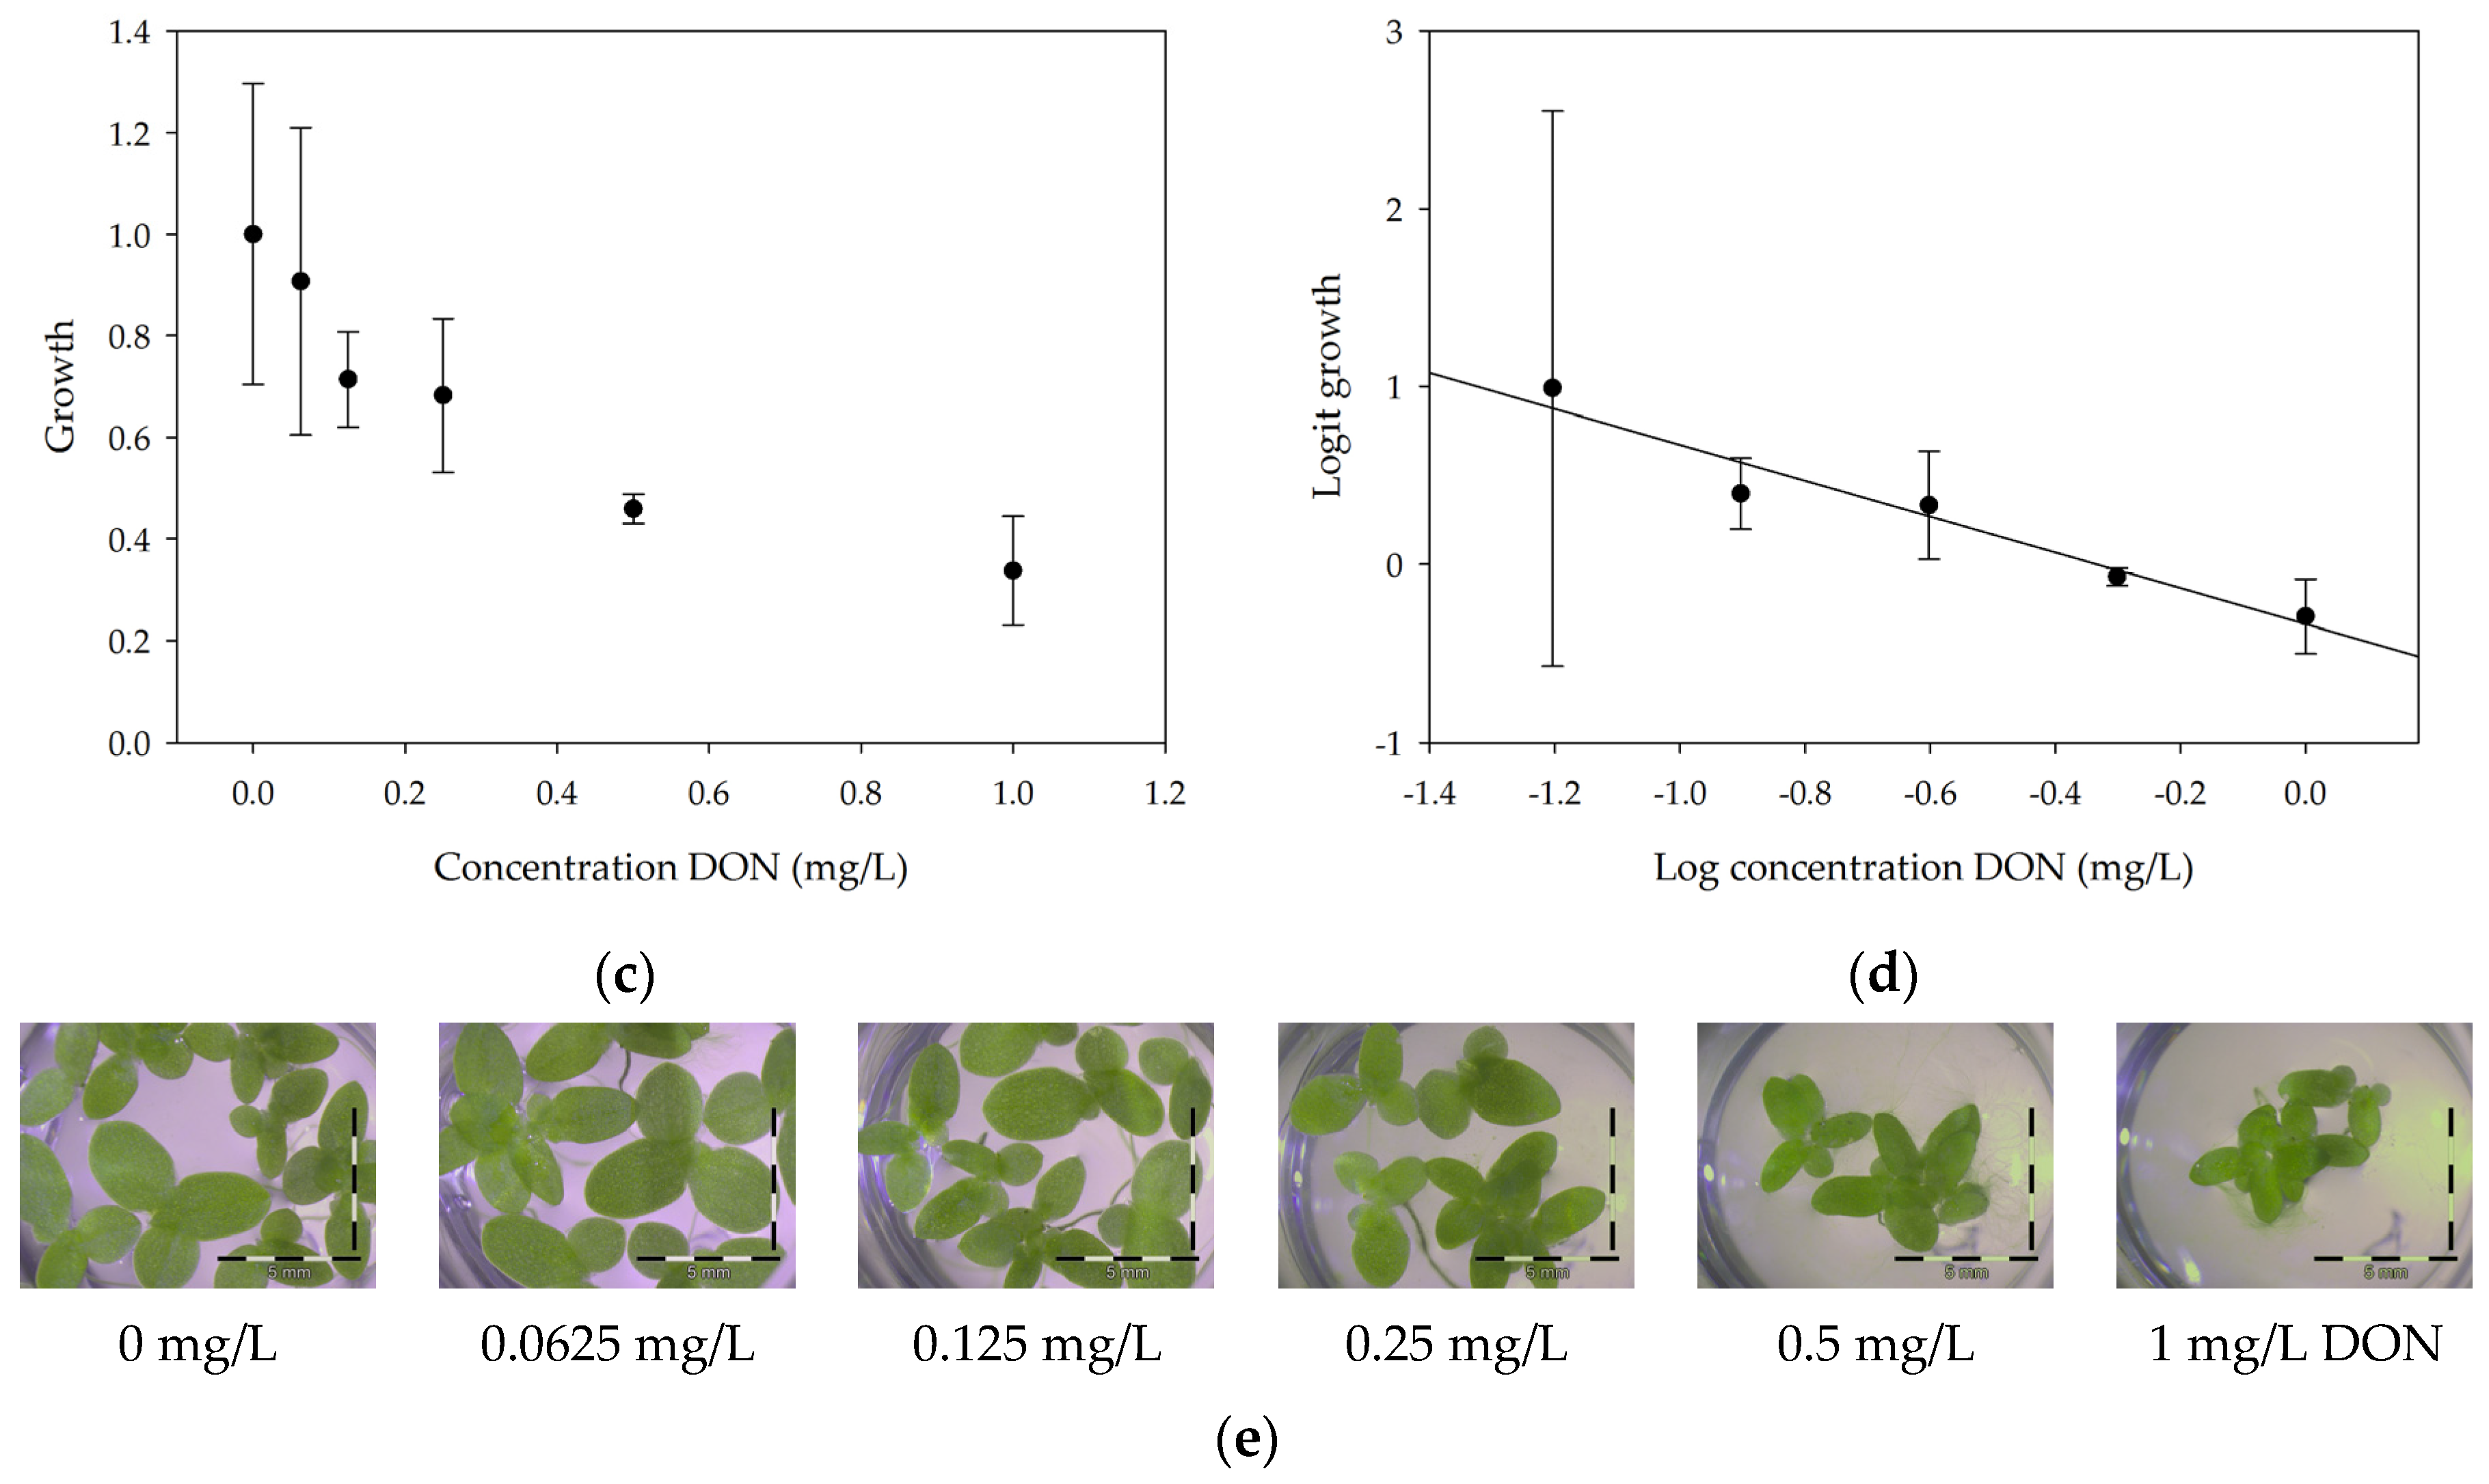
2.1. Developing the Bioassay Using Lemna Minor
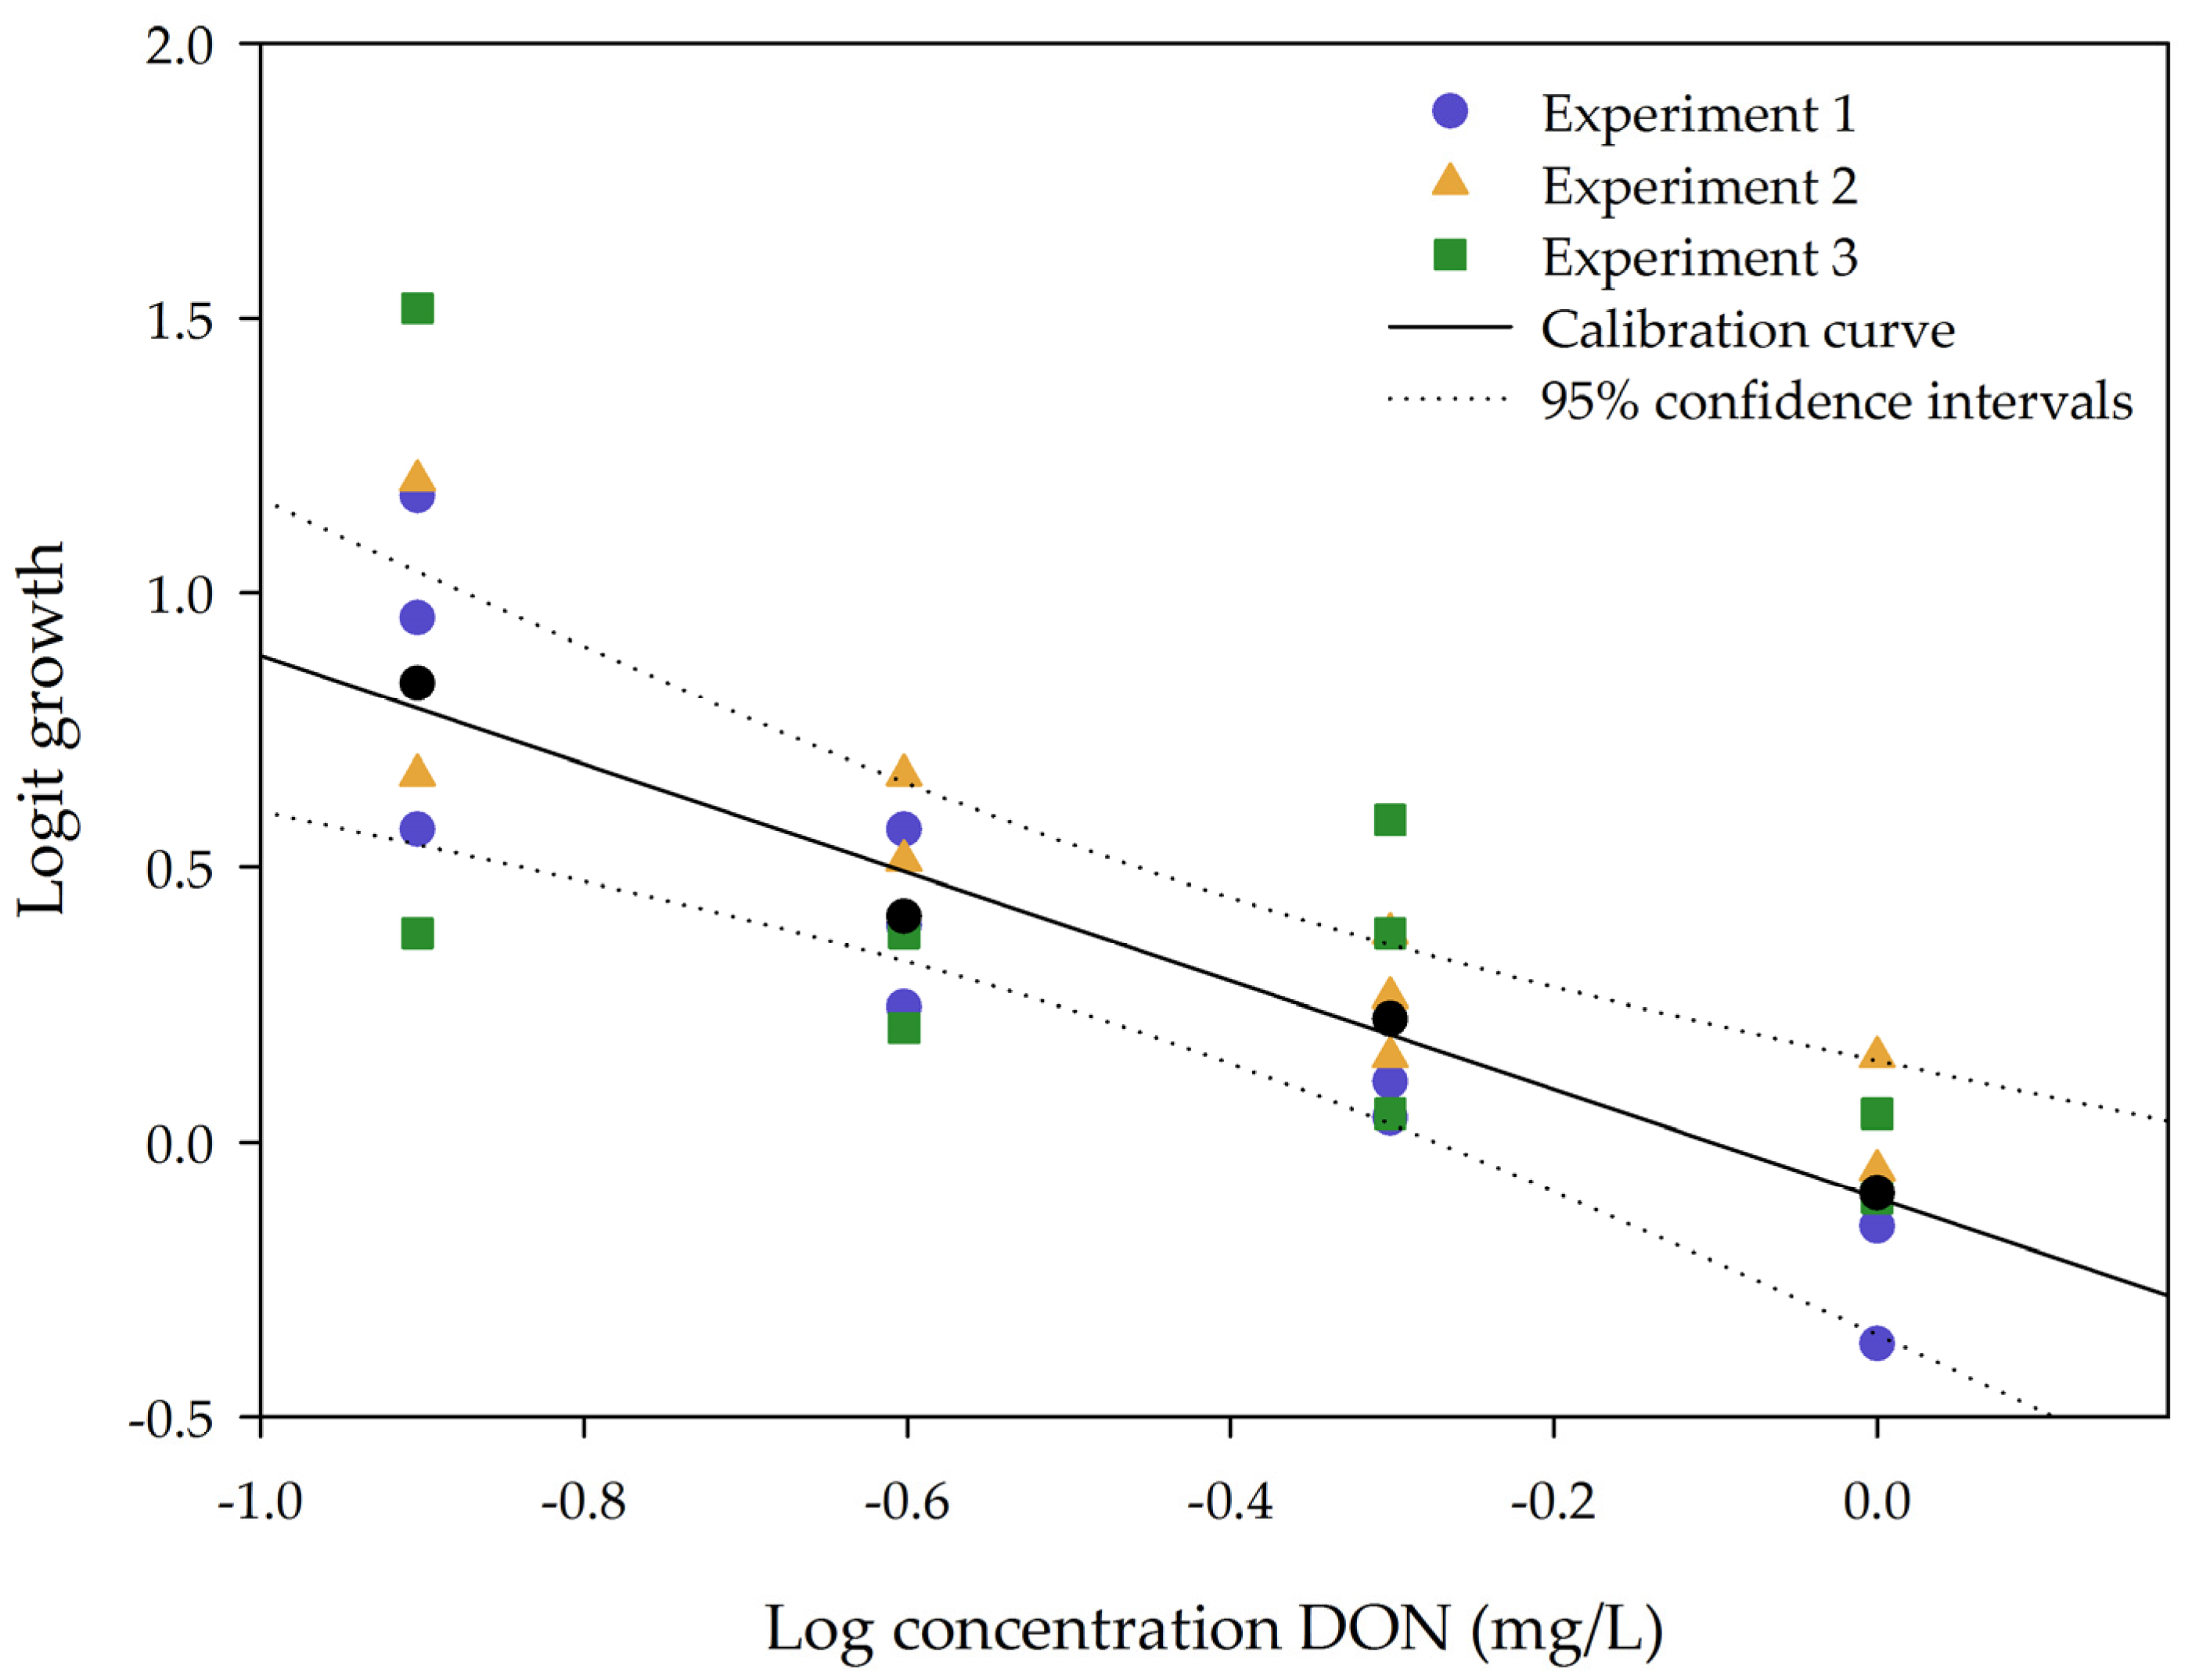
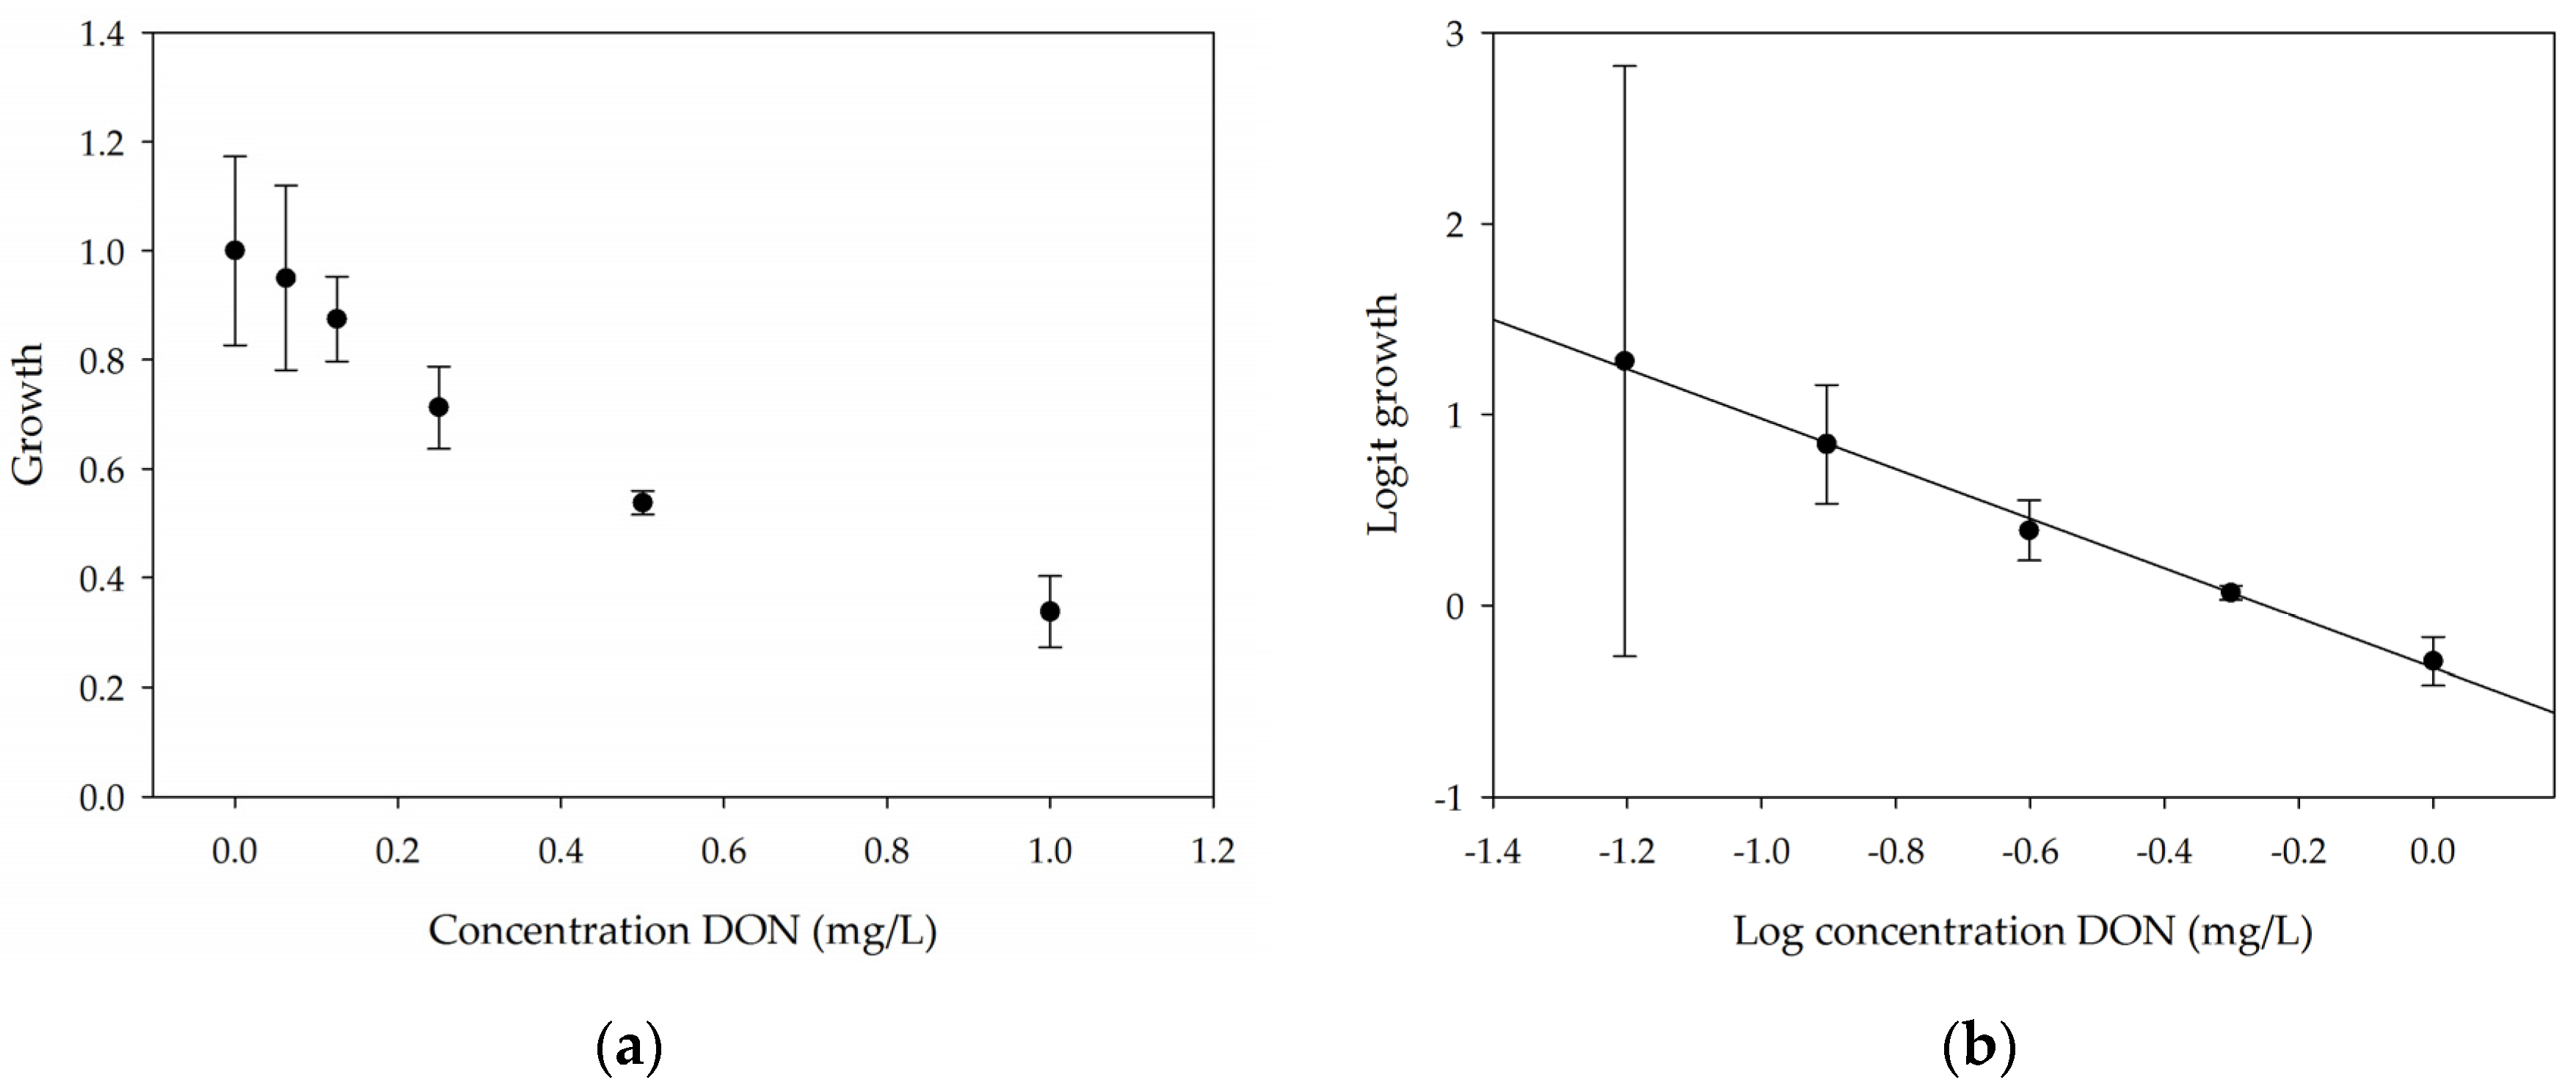
2.1.1. Linearity
2.1.2. Repeatability and Sensitivity
2.1.3. Sensitivity of Lemna Minor towards Other Fusarium Mycotoxins
2.2. Implementing the Bioassay to Screen for DON Detoxification by the Enrichment Cultures
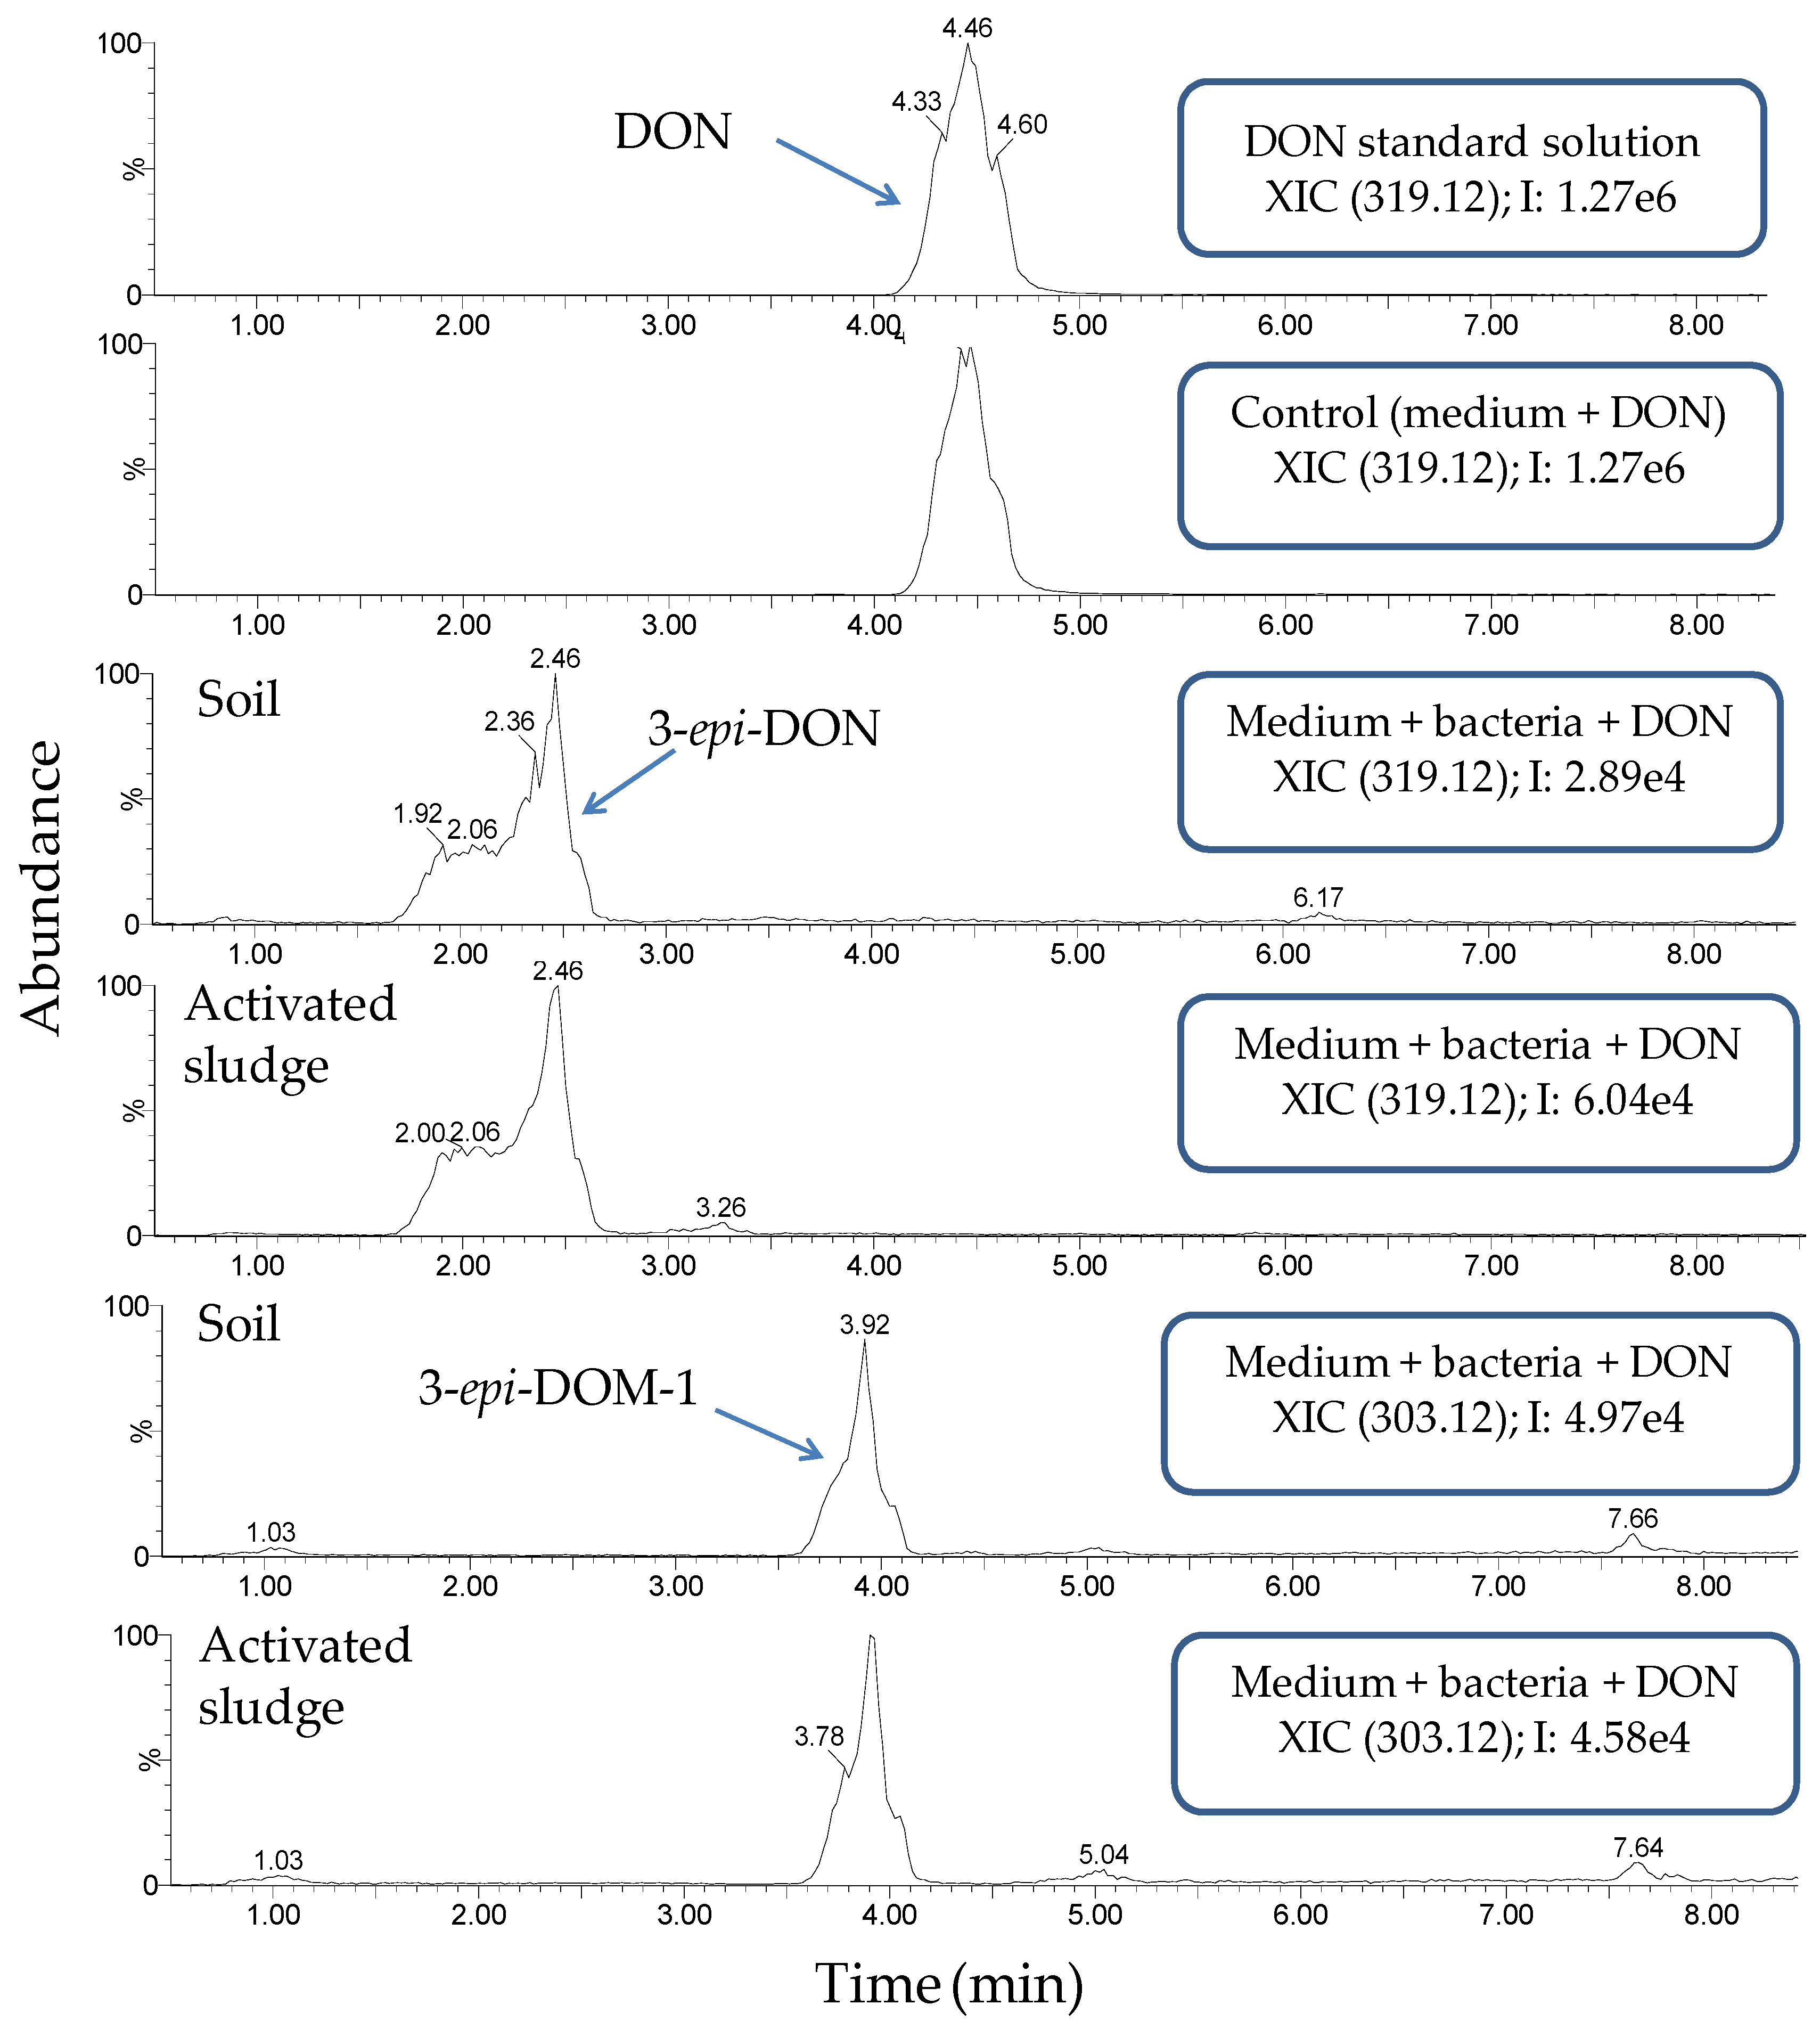
2.3. Monitoring Detoxification (Bioassay) and Biotransformation (LC-MS/MS) by the Enrichment Cultures Soil and Activated Sludge through Time
3. Discussion
4. Materials and Methods
4.1. Sources
4.2. Source Material Preparation
4.3. Standards
4.4. Enrichment for DON-Degrading Microorganisms
4.5. Biotransformation Experiment
4.6. Bioassay Protocol
4.7. Detection of DON and Its Possible Metabolites by LC-MS/MS
4.7.1. Sample Preparation
4.7.2. LC-MS/MS Analysis
4.7.3. LC-HRMS Analysis
4.8. Data Processing
Supplementary Materials
Acknowledgments
Author Contributions
Conflicts of Interest
References
- Jouany, J.P. Methods for preventing, decontaminating and minimizing the toxicity of mycotoxins in feeds. Anim. Feed Sci. Technol. 2007, 137, 342–362. [Google Scholar] [CrossRef]
- Wambacq, E.; Vanhoutte, I.; Audenaert, K.; De Gelder, L.; Haesaert, G. Occurrence, prevention and remediation of toxigenic fungi and mycotoxins in silage: A review. J. Sci. Food Agric. 2016, 96, 2284–2302. [Google Scholar] [CrossRef] [PubMed]
- Grenier, B.; Loureiro-Bracarense, A.-P.; Leslie, J.F.; Oswald, I.P. Physical and chemical methods for mycotoxin decontamination in maize. In Mycotoxin Reduction in Grain Chains; Leslie, J.F., Logrieco, A., Eds.; John Wiley & Sons, Inc.: Hoboken, NJ, USA, 2014. [Google Scholar]
- Goossens, J.; Vandenbroucke, V.; Pasmans, F.; De Baere, S.; Devreese, M.; Osselaere, A.; Verbrugghe, E.; Haesebrouck, F.; De Saeger, S.; Eeckhout, M.; et al. Influence of mycotoxins and a mycotoxin adsorbing agent on the oral bioavailability of commonly used antibiotics in pigs. Toxins 2012, 4, 281–295. [Google Scholar] [CrossRef] [PubMed]
- Schatzmayr, G.; Zehner, F.; Taubel, M.; Schatzmayr, D.; Klimitsch, A.; Loibner, A.P.; Binder, E.M. Microbiologicals for deactivating mycotoxins. Mol. Nutr. Food Res. 2006, 50, 543–551. [Google Scholar] [CrossRef] [PubMed]
- Hope, R.; Aldred, D.; Magan, N. Comparison of environmental profiles for growth and deoxynivalenol production by fusarium culmorum and f-graminearum on wheat grain. Lett. Appl. Microbiol. 2005, 40, 295–300. [Google Scholar] [CrossRef] [PubMed]
- Magan, N.; Hope, R.; Colleate, A.; Baxter, E.S. Relationship between growth and mycotoxin production by fusarium species, biocides and environment. Eur. J. Plant Pathol. 2002, 108, 685–690. [Google Scholar] [CrossRef]
- Ehrlich, K.C.; Daigle, K.W. Protein-synthesis inhibition by 8-oxo-12,13-epoxytrichothecenes. Biochim. Biophys. Acta 1987, 923, 206–213. [Google Scholar] [CrossRef]
- Sobrova, P.; Adam, V.; Vasatkova, A.; Beklova, M.; Zeman, L.; Kizek, R. Deoxynivalenol and its toxicity. Interdiscip. Toxicol. 2010, 3, 94–99. [Google Scholar] [CrossRef] [PubMed]
- Pestka, J.J. Deoxynivalenol: Toxicity, mechanisms and animal health risks. Anim. Feed Sci. Technol. 2007, 137, 283–298. [Google Scholar] [CrossRef]
- Pestka, J.J. Deoxynivalenol: Mechanisms of action, human exposure, and toxicological relevance. Arch. Toxicol. 2010, 84, 663–679. [Google Scholar] [CrossRef] [PubMed]
- European Commission. Commission recommendation of 17 august 2006 on the presence of deoxynivalenol, zearalenone, ochratoxin a, t-2 and ht-2 and fumonisins in products intended for animal feeding. Off. J. Eur. Union 2006, L 229, 7–9. [Google Scholar]
- European Commission. Commission regulation no 1881/2006 of 19 december 2006 setting maximum levels for certain contaminants in foodstuffs. Off. J. Eur. Union 2006, L 364, 5–24. [Google Scholar]
- Lauren, D.R.; Smith, W.A. Stability of the fusarium mycotoxins nivalenol, deoxynivalenol and zearalenone in ground maize under typical cooking environments. Food Addit. Contam. 2001, 18, 1011–1016. [Google Scholar] [CrossRef] [PubMed]
- De Mil, T. Safety of Mycotoxin Binders Regarding Their Use with Veterinary Medicinal Products in Poultry and pigs: An In Vitro and Pharmacokinetic Approach. Ph.D. Thesis, Ghent University, Ghent, Belgium, 2016. [Google Scholar]
- Vanhoutte, I.; Audenaert, K.; De Gelder, L. Biodegradation of mycotoxins: Tales from known and unexplored worlds. Front. Microbiol. 2016, 7. [Google Scholar] [CrossRef] [PubMed]
- Binder, E.M.; Binder, J. Strain of Eubacterium That Detoxyfies Trichothenes. U.S. Patent No. 6,794,175, 21 September 2004. [Google Scholar]
- King, R.R.; Mcqueen, R.E.; Levesque, D.; Greenhalgh, R. Transformation of deoxynivalenol (vomitoxin) by rumen microorganisms. J. Agric. Food Chem. 1984, 32, 1181–1183. [Google Scholar] [CrossRef]
- Kollarczik, B.; Gareis, M.; Hanelt, M. In vitro transformation of the fusarium mycotoxins deoxynivalenol and zearalenone by the normal gut microflora of pigs. Nat. Toxins 1994, 2, 105–110. [Google Scholar] [CrossRef] [PubMed]
- Yu, H.; Zhou, T.; Gong, J.H.; Young, C.; Su, X.J.; Li, X.Z.; Zhu, H.H.; Tsao, R.; Yang, R. Isolation of deoxynivalenol-transforming bacteria from the chicken intestines using the approach of PCR-DGGE guided microbial selection. BMC Microbiol. 2010, 10, 182. [Google Scholar] [CrossRef] [PubMed]
- Guan, S.; He, J.W.; Young, J.C.; Zhu, H.H.; Li, X.Z.; Ji, C.; Zhou, T. Transformation of trichothecene mycotoxins by microorganisms from fish digesta. Aquaculture 2009, 290, 290–295. [Google Scholar] [CrossRef]
- Young, J.C.; Zhou, T.; Yu, H.; Zhu, H.H.; Gong, J.H. Degradation of trichothecene mycotoxins by chicken intestinal microbes. Food Chem. Toxicol. 2007, 45, 136–143. [Google Scholar] [CrossRef] [PubMed]
- Zhou, T.; Gong, J.; Young, J.C.; Yu, H.; Li, X.Z.; Zhu, H.; Hill, A.; Yang, R.; de Lange, C.F.M.; Du, W.; et al. Microorganisms isolated from chicken gut can effectively detoxify don and other trichothecene mycotoxins. Available online: http://www.centraliaswineresearch.ca/proceedings/2007/csru2007zhou.pdf (accessed on 8 February 2017).
- He, J.W.; Hassan, Y.I.; Perilla, N.; Li, X.Z.; Boland, G.J.; Zhou, T. Bacterial epimerization as a route for deoxynivalenol detoxification: The influence of growth and environmental conditions. Front. Microbiol. 2016, 7. [Google Scholar] [CrossRef] [PubMed]
- Ikunaga, Y.; Sato, I.; Grond, S.; Numaziri, N.; Yoshida, S.; Yamaya, H.; Hiradate, S.; Hasegawa, M.; Toshima, H.; Koitabashi, M.; et al. Nocardioides sp. Strain wsn05-2, isolated from a wheat field, degrades deoxynivalenol, producing the novel intermediate 3-epi-deoxynivalenol. Appl. Microbiol. Biot. 2011, 89, 419–427. [Google Scholar] [CrossRef] [PubMed]
- Islam, R. Isolation, Characterization and Genome Sequencing of a Soil-Borne Citrobacter Freundii Strain Capable of Detoxifying Trichothecene Mycotoxins. Ph.D. Thesis, University of Guelph, Guelph, ON, Canada, 2012. [Google Scholar]
- Islam, R.; Zhou, T.; Young, J.C.; Goodwin, P.H.; Pauls, K.P. Aerobic and anaerobic de-epoxydation of mycotoxin deoxynivalenol by bacteria originating from agricultural soil. World J. Microb. Biot. 2012, 28, 7–13. [Google Scholar] [CrossRef] [PubMed]
- Sato, I.; Ito, M.; Ishizaka, M.; Ikunaga, Y.; Sato, Y.; Yoshida, S.; Koitabashi, M.; Tsushima, S. Thirteen novel deoxynivalenol-degrading bacteria are classified within two genera with distinct degradation mechanisms. FEMS Microbiol. Lett. 2012, 327, 110–117. [Google Scholar] [CrossRef] [PubMed]
- Shima, J.; Takase, S.; Takahashi, Y.; Iwai, Y.; Fujimoto, H.; Yamazaki, M.; Ochi, K. Novel detoxification of the trichothecene mycotoxin deoxynivalenol by a soil bacterium isolated by enrichment culture. Appl. Environ. Microb. 1997, 63, 3825–3830. [Google Scholar]
- Volkl, A.; Vogler, B.; Schollenberger, M.; Karlovsky, P. Microbial detoxification of mycotoxin deoxynivalenol. J. Basic Microb. 2004, 44, 147–156. [Google Scholar] [CrossRef] [PubMed]
- Sinclair, C.J.; Boxall, A.B.A. Ecotoxicity of transformation products. In Transformation Products of Synthetic Chemicals in the Environment; Boxall, A.B.A., Ed.; Springer: Heidelberg, Germany, 2009; Volume 2. [Google Scholar]
- Thompson, W.L.; Wannemacher, R.W. Structure-function-relationships of 12,13-epoxytrichothecene mycotoxins in cell-culture—Comparison to whole animal lethality. Toxicon 1986, 24, 985–994. [Google Scholar] [CrossRef]
- Eriksen, G.S.; Pettersson, H.; Lundh, T. Comparative cytotoxicity of deoxynivalenol, nivalenol, their acetylated derivatives and de-epoxy metabolites. Food Chem. Toxicol. 2004, 42, 619–624. [Google Scholar] [CrossRef] [PubMed]
- He, J.W.; Bondy, G.S.; Zhou, T.; Caldwell, D.; Boland, G.J.; Scott, P.M. Toxicology of 3-epi-deoxynivalenol, a deoxynivalenol-transformation product by devosia mutans 17-2-e-8. Food Chem Toxicol. 2015, 84, 250–259. [Google Scholar] [CrossRef] [PubMed]
- Pierron, A.; Mimoun, S.; Murate, L.S.; Loiseau, N.; Lippi, Y.; Bracarense, A.P.F.L.; Schatzmayr, G.; He, J.W.; Zhou, T.; Moll, W.D.; et al. Microbial biotransformation of don: Molecular basis for reduced toxicity. Sci. Rep.-UK 2016, 6. [Google Scholar] [CrossRef] [PubMed]
- Hanelt, M.; Gareis, M.; Kollarczik, B. Cytotoxicity of mycotoxins evaluated by the mtt-cell culture assay. Mycopathologia 1994, 128, 167–174. [Google Scholar] [CrossRef] [PubMed]
- Kouadio, J.H.; Mobio, T.A.; Baudrimont, I.; Moukha, S.; Dano, S.D.; Creppy, E.E. Comparative study of cytotoxicity and oxidative stress induced by deoxynivalenol, zearalenone or fumonisin b1 in human intestinal cell line caco-2. Toxicology 2005, 213, 56–65. [Google Scholar] [CrossRef] [PubMed]
- Rocha, O.; Ansari, K.; Doohan, F.M. Effects of trichothecene mycotoxins on eukaryotic cells: A review. Food Addit. Contam. A 2005, 22, 369–378. [Google Scholar] [CrossRef] [PubMed]
- Panigrahi, S. Bioassay of mycotoxins using terrestrial and aquatic, animal and plant-species. Food Chem. Toxicol. 1993, 31, 767–790. [Google Scholar] [CrossRef]
- Abbas, H.K.; Yoshizawa, T.; Shier, W.T. Cytotoxicity and phytotoxicity of trichothecene mycotoxins produced by fusarium spp. Toxicon 2013, 74, 68–75. [Google Scholar] [CrossRef] [PubMed]
- Abolmaali, S.; Mitterbauer, R.; Spadiut, O.; Peruci, M.; Weindorfer, H.; Lucyshyn, D.; Ellersdorfer, G.; LemmenS, M.; Moll, W.D.; Adarn, G. Engineered bakers yeast as a sensitive bioassay indicator organism for the trichothecene toxin deoxynivalenol. J. Microbiol. Meth. 2008, 72, 306–312. [Google Scholar] [CrossRef] [PubMed]
- Alexander, N.J.; McCormick, S.P.; Ziegenhorn, S.L. Phytotoxicity of selected trichothecenes using chlamydomonas reinhardtii as a model system. Nat. Toxins 1999, 7, 265–269. [Google Scholar] [CrossRef]
- Bijl, J.P.; Rousseau, D.M.; Dive, D.G.; Vanpeteghem, C.H. Potentials of a synchronized culture of tetrahymena-pyriformis for toxicity studies of mycotoxins. J. Assoc. Off. Anal. Chem. 1988, 71, 282–285. [Google Scholar]
- Binder, J.; Horvath, E.M.; Heidegger, J.; Ellend, N.; Danner, H.; Krska, R.; Braun, R. A bioassay for comparison of the toxicity of trichothecenes and their microbial metabolites. Cereal Res. Commun. 1997, 25, 489–491. [Google Scholar]
- Desjardins, A.E.; McCormick, S.P.; Appell, M. Structure-activity relationships of trichothecene toxins in an arabidopsis thaliana leaf assay. J. Agric. Food Chem. 2007, 55, 6487–6492. [Google Scholar] [CrossRef] [PubMed]
- Masuda, D.; Ishida, M.; Yamaguchi, K.; Yamaguchi, I.; Kimura, M.; Nishiuchi, T. Phytotoxic effects of trichothecenes on the growth and morphology of arabidopsis thaliana. J. Exp. Bot. 2007, 58, 1617–1626. [Google Scholar] [CrossRef] [PubMed]
- Scott, P.M.; Harwig, J.; Blanchfield, B.J. Screening fusarium strains isolated from overwintered canadian grains for trichothecenes. Mycopathologia 1980, 72, 175–180. [Google Scholar] [CrossRef] [PubMed]
- Hulsen, K.; Minne, V.; Lootens, P.; Vandecasteele, P.; Hofte, M. A chlorophyll a fluorescence-based lemna minor bioassay to monitor microbial degradation of nanomolar to micromolar concentrations of linuron. Environ. Microbiol. 2002, 4, 327–337. [Google Scholar] [CrossRef] [PubMed]
- Burgess, K.M.; Renaud, J.B.; McDowell, T.; Sumarah, M.W. Mechanistic insight into the biosynthesis and detoxification of fumonisin mycotoxins. ACS Chem. Biol. 2016, 9, 2618–2625. [Google Scholar] [CrossRef] [PubMed]
- Tanaka, T.; Abbas, H.K.; Duke, S.O. Structure-dependent phytotoxicity of fumonisins and related-compounds in a duckweed bioassay. Phytochemistry 1993, 33, 779–785. [Google Scholar] [CrossRef]
- Vesonder, R.F.; Wu, W.; Weisleder, D.; Gordon, S.H.; Krick, T.; Xie, W.; Abbas, H.K.; McAlpin, C.E. Toxigenic strains of fusarium moniliforme and fusarium proliferatum isolated from dairy cattle feed produce fumonisins, moniliformin and a new c21h38n2o6 metabolite phytotoxic to lemna minor l. J. Nat. Toxins 2000, 9, 103–112. [Google Scholar] [PubMed]
- Wang, W.C. Toxicity tests of aquatic pollutants by using common duckweed. Environ. Pollut. B 1986, 11, 1–14. [Google Scholar] [CrossRef]
- Diana Di Mavungu, J.; Malysheva, S.V.; Sanders, M.; Larionova, D.; Robbens, J.; Dubruel, P.; Van Peteghem, C.; De Saeger, S. Development and validation of a new LC-MS/MS method for the simultaneous determination of six major ergot alkaloids and their corresponding epimers. Application to some food and feed commodities. Food Chem. 2012, 135, 292–303. [Google Scholar] [CrossRef]
- Hassan, Y.I.; Zhu, H.; Zhu, Y.; Zhou, T. Beyond ribosomal binding: The increased polarity and aberrant molecular interactions of 3-epi-deoxynivalenol. Toxins (Basel) 2016. [Google Scholar] [CrossRef] [PubMed]
- He, J.W.; Yang, R.; Zhou, T.; Boland, G.J.; Scott, P.M.; Bondy, G.S. An epimer of deoxynivalenol: Purification and structure identification of 3-epi-deoxynivalenol. Food Addit. Contam. Part A Chem. Anal. Control Expo. Risk Assess. 2015, 32, 1523–1530. [Google Scholar] [CrossRef] [PubMed]
- Harwig, J.; Scott, P.M. Brine shrimp (artemia salina L.) larvae as a screening system for fungal toxins. Appl. Microbiol. 1971, 21, 1011–1016. [Google Scholar] [PubMed]
- IARC. Iarc Monographs on the Evaluation of Carcinogenic Risks to Humans: Aflatoxins; IARC Press: Lyon, France, 2002; Volume 82. [Google Scholar]
- Shier, W.T.; Shier, A.C.; Xie, W.; Mirocha, C.J. Structure-activity relationships for human estrogenic activity in zearalenone mycotoxins. Toxicon 2001, 39, 1435–1438. [Google Scholar] [CrossRef]
- He, J.W. Detoxification of Deoxynivalenol by a Soil Bacterium Devosia Mutans 17-2-e-8. Ph.D. Thesis, The University of Guelph, Guelph, ON, Canada, 2015. [Google Scholar]
- Spanjer, M.C.; Rensen, P.M.; Scholten, J.M. Lc-ms/ms multi-method for mycotoxins after single extraction, with validation data for peanut, pistachio, wheat, maize, cornflakes, raisins and figs. Food Addit. Contam. A 2008, 25, 472–489. [Google Scholar] [CrossRef] [PubMed]
- Stanier, R.Y.; Palleroni, N.J.; Doudoroff, M. The aerobic pseudomonads: A taxonomic study. J. Gen. Microbiol. 1966, 43, 159–271. [Google Scholar] [CrossRef] [PubMed]
- Megateli, S.; Dosnon-Olette, R.; Trotel-Aziz, P.; Geffard, A.; Semsari, S.; Couderchet, M. Simultaneous effects of two fungicides (copper and dimethomorph) on their phytoremediation using lemna minor. Ecotoxicology 2013, 22, 683–692. [Google Scholar] [CrossRef] [PubMed]
- European Commission. Commission decision 2002/657/ec implementing council directive 96/23/ec concerning the performance of analytical methods and the interpretation of results. Off. J. Eur. Communities 2002, L 221, 8–36. [Google Scholar]


| Mycotoxin | % Growth at 1 mg/L Mycotoxin |
|---|---|
| DAS | 26 ± 4 b |
| DON | 34 ± 6 b |
| FUS-X | 44 ± 12 b |
| T-2 toxin | 52 ± 12 b |
| HT-2 toxin | 54 ± 15 b |
| ZEN | 90 ± 42 a |
| NIV | 92 ± 11 a |
| Control | 100 ± 7 a |
| Concentration DON (mg/L) | Rumen fluid | Soil | Digestate | Activated sludge | |
|---|---|---|---|---|---|
| 0 mg/L DON |  101 ± 9% a |  93 ± 6% a |  96 ± 4% a |  104 ± 10% a | |
| 5 mg/L DON 1 |  |  28 ± 0% b |  83 ± 6% a |  34 ± 5% b |  99 ± 13% a |
| 50 mg/L DON 1 |  |  36 ± 2% b |  87 ± 10% a |  43 ± 4% b |  83 ± 4% a |
| Matrix | Growth of Lemna minor (%) after exposure to culture supernatant from the DON detoxification experiment after x weeks assessed by the bioassay | ||
|---|---|---|---|
| After 1 week of detoxification | After 2 weeks of detoxification | After 3 weeks of detoxification | |
| 0 mg/L DON | |||
| Sterile control |  100 ± 4 a | ||
| 5 mg/L DON | |||
| Sterile control 1 |  30 ± 2 b |  32 ± 1 b |  30 ± 2 b |
| Soil |  32 ± 6 b |  93 ± 3 a |  86 ± 21 a |
| Activated sludge |  33 2 |  53 ± 4 b |  69 ± 4 b |
| 50 mg/L DON | |||
| Sterile control 1 |  35 ± 5 b |  31 ± 4 b |  32 ± 3 b |
| Soil |  47 ± 1 b |  88 ± 4 a |  90 ± 3 a |
| Activated sludge | 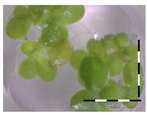 99 ± 1 a |  78 ± 15 a | 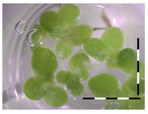 83 ± 3 a |
| Matrix | DON Biotransformation (%) in the Culture Supernatant from the DON Biotransformation Experiment after x Weeks Assessed by LC-MS/MS Analysis | ||
|---|---|---|---|
| After 1 Week of Biotransformation | After 2 Weeks of Biotransformation | After 3 Weeks of Biotransformation | |
| 5 mg/L DON | |||
| Sterile control | 0 ± 27 b | 0 ± 63 1,b | 0 ± 20 b |
| Soil | 56 ± 15 b | 100 ± 0 a | 100 ± 0 a |
| Activated sludge | 72 ± 2 a | 100 ± 0 a | 100 ± 0 a |
| 50 mg/L DON | |||
| Sterile control | 0 ± 22 b | 0 ± 32 b | 0 ± 14 b |
| Soil | 28 ± 6 b | 100 ± 0 a | 100 ± 0 a |
| Activated sludge | 68 ± 14 a | 100 ± 0 a | 100 ± 0 a |
| Organism [Reference] | Application | Characteristics | ||
|---|---|---|---|---|
| Sensitivity | Time | Workload | ||
| Brine shrimp larvae Artemia salina L. [47,56] | General screening for trichothecenes in grains | 600–1200 ng/disc (~30–60 mg/L) DON → 50% of mortality | 30 h of preparation, 30 h of incubation | Preparation of larvae (including separation eggs) * Disc screening method: addition of 20 µL/disc toxin in a well with addition of 2 drops (±100 µL) of a suspension of larvae * Measuring mortality (counting immobile larvae under microscope, killing larvae, counting total number) |
| Unicellular algae Chlamydomonas reinhardtii [42] | * Testing cloned genes (resistance to trichothecenes) * Comparing trichothecenes with C3-OH group with their acetylated derivatives | 25 mg/L DON → clear toxic effect | 8 days | Preparation of preculture Measuring growth (haemocytometer), cell viability (plating), calculating number of culture doublings |
| Yeast Klyveromyces marxianus [44] | Screening DON-degrading organisms | 23 mg/L DON → 50% growth inhibition 300 mg/L DOM-1 → no growth inhibition | Overnight preparation, 22 h of incubation | Preparation of preculture Incubation of sterile supernatants Measuring optical density at 650 nm |
| Engineered baker’s yeast [41] | * Use as a bioassay indicator organism * Screening for DON-detoxifying bacteria | 5 mg/L DON → 50% growth inhibition | 16 h | Preparation yeast culture * Agar diffusion test * Measuring optical density at 620 nm |
| Arabidopsis thaliana [45,46] | Studying the phytotoxic action of trichothecenes | * 10 µM (~3 mg/L) DON → no inhibition of seed germination, inhibition of root growth * 23.0 ± 6.8 µM (~6,8 ± 2 mg/L) DON → mortality of 50% of leaves | * 3 days of preparation, 3 days of incubation * 3 weeks of preparation, 7 days of incubation | * Preparation of seeds Investigation of growth and morphology * Preparation of 3-week-old plants Leave protocol: investigation of shriveling, chlorosis, death |
| Wheat plants [46] | Studying the phytotoxic action of trichothecenes | >15 µM (~4.5 mg/L) DON → inhibition of root elongation of wheat plants | 3 days of preparation, 3 days of incubation | Preparation of seeds Investigation of growth and morphology |
| Lemna pausicostata [40] | Screening trichothecenes for bioherbicides | 10 µM (~3 mg/L DON) → 56.0% ± 5.7% growth | 72 h | No need for preparation Measuring electrolyte release (conductivity), growth inhibition, chlorophyll reduction |
| Ciliated protozoa Tetrahymena pyriformis [43] | * Testing toxicity of mycotoxins * Screening of cereals | 0.6 mg/L DON → minimum active dose | Preparation of heat shocks, 150 min incubation | Preparation heat shocks for good division synchrony, requires good heating and cooling devices Measuring delay between start of division in control and toxin-treated culture, counting number of cells |
| Lemna minor L. | * Screening for phytotoxicity of DON and other trichothecenes * Screening for DON-degrading organisms | 1 mg/L DON → 34% ± 6% growth 0.250 mg/L → minimum active dose (significantly different) | * 7 days * 12 h with chlorophyll fluorescence | No need for preparation Measuring number of fronds, frond area, chlorophyll fluorescence |
| Analyte | Precursor Ion (m/z) | Molecular Ion | ConeVoltage (V) | Product Ions (m/z) | Collision Energy (eV) |
|---|---|---|---|---|---|
| NIV | 313.1 | [M + H]+ | 26 | 125.0 * | 13 |
| 205.0 | 12 | ||||
| DON | 297.1 | [M + H]+ | 26 | 231.2 * | 15 |
| 249.2 | 10 | ||||
| DOM-1 | 281.0 | [M + H]+ | 26 | 109.1 * | 19 |
| 137.0 | 15 | ||||
| 3-ADON | 339.0 | [M + H]+ | 28 | 203.2 * | 12 |
| 231.2 | 13 | ||||
| 15-ADON | 339.0 | [M + H]+ | 26 | 261.0 * | 10 |
| 321.2 | 10 | ||||
| DON-3G | 476.1 | [M + NH4]+ | 15 | 248.6 * | 18 |
| 296.9 | 12 | ||||
| ZAN (IS) | 321.0 | [M + H]+ | 26 | 189.2 * | 19 |
| 303.3 | 13 |
© 2017 by the authors. Licensee MDPI, Basel, Switzerland. This article is an open access article distributed under the terms and conditions of the Creative Commons Attribution (CC BY) license ( http://creativecommons.org/licenses/by/4.0/).
Share and Cite
Vanhoutte, I.; De Mets, L.; De Boevre, M.; Uka, V.; Di Mavungu, J.D.; De Saeger, S.; De Gelder, L.; Audenaert, K. Microbial Detoxification of Deoxynivalenol (DON), Assessed via a Lemna minor L. Bioassay, through Biotransformation to 3-epi-DON and 3-epi-DOM-1. Toxins 2017, 9, 63. https://doi.org/10.3390/toxins9020063
Vanhoutte I, De Mets L, De Boevre M, Uka V, Di Mavungu JD, De Saeger S, De Gelder L, Audenaert K. Microbial Detoxification of Deoxynivalenol (DON), Assessed via a Lemna minor L. Bioassay, through Biotransformation to 3-epi-DON and 3-epi-DOM-1. Toxins. 2017; 9(2):63. https://doi.org/10.3390/toxins9020063
Chicago/Turabian StyleVanhoutte, Ilse, Laura De Mets, Marthe De Boevre, Valdet Uka, José Diana Di Mavungu, Sarah De Saeger, Leen De Gelder, and Kris Audenaert. 2017. "Microbial Detoxification of Deoxynivalenol (DON), Assessed via a Lemna minor L. Bioassay, through Biotransformation to 3-epi-DON and 3-epi-DOM-1" Toxins 9, no. 2: 63. https://doi.org/10.3390/toxins9020063
APA StyleVanhoutte, I., De Mets, L., De Boevre, M., Uka, V., Di Mavungu, J. D., De Saeger, S., De Gelder, L., & Audenaert, K. (2017). Microbial Detoxification of Deoxynivalenol (DON), Assessed via a Lemna minor L. Bioassay, through Biotransformation to 3-epi-DON and 3-epi-DOM-1. Toxins, 9(2), 63. https://doi.org/10.3390/toxins9020063