2.1. Growth Kinetics and Modeling
The relative attenuation of irradiance in the T-Flask cultures over time was calculated as detailed in the Materials and Methods section. In general, the mutual shading increased with the age of the culture and the cell concentration (data not shown). The highest light attenuation values were observed in the stationary phase, reaching a maximum of around 10% in the experiment carried out at 25 °C and 40 µE·m
−2·s
−1. In the exponential phase, mutual shading in all the cultures was substantially below 10%. Consequently, our cultures can be considered optically thin,
i.e., it is unlikely that self-shading affected the experimental results reported. This issue is critical in the modeling of the
P-
I curves (growth or photosynthesis rate versus irradiance). These curves derived from laboratory studies are commonly used to predict biomass productivity in photobioreactors or natural habitats (e.g., microalgal blooms), where the cell density is high, and hence also the effect of light attenuation. If the estimated kinetic parameters are markedly affected by mutual shading or acclimation phenomena, the predictions could be wrong, and the denser the culture systems, the greater the error. Novel aspects related with the modeling of
P-I curves in microalgae have comprehensively been addressed in a recent study [
14].
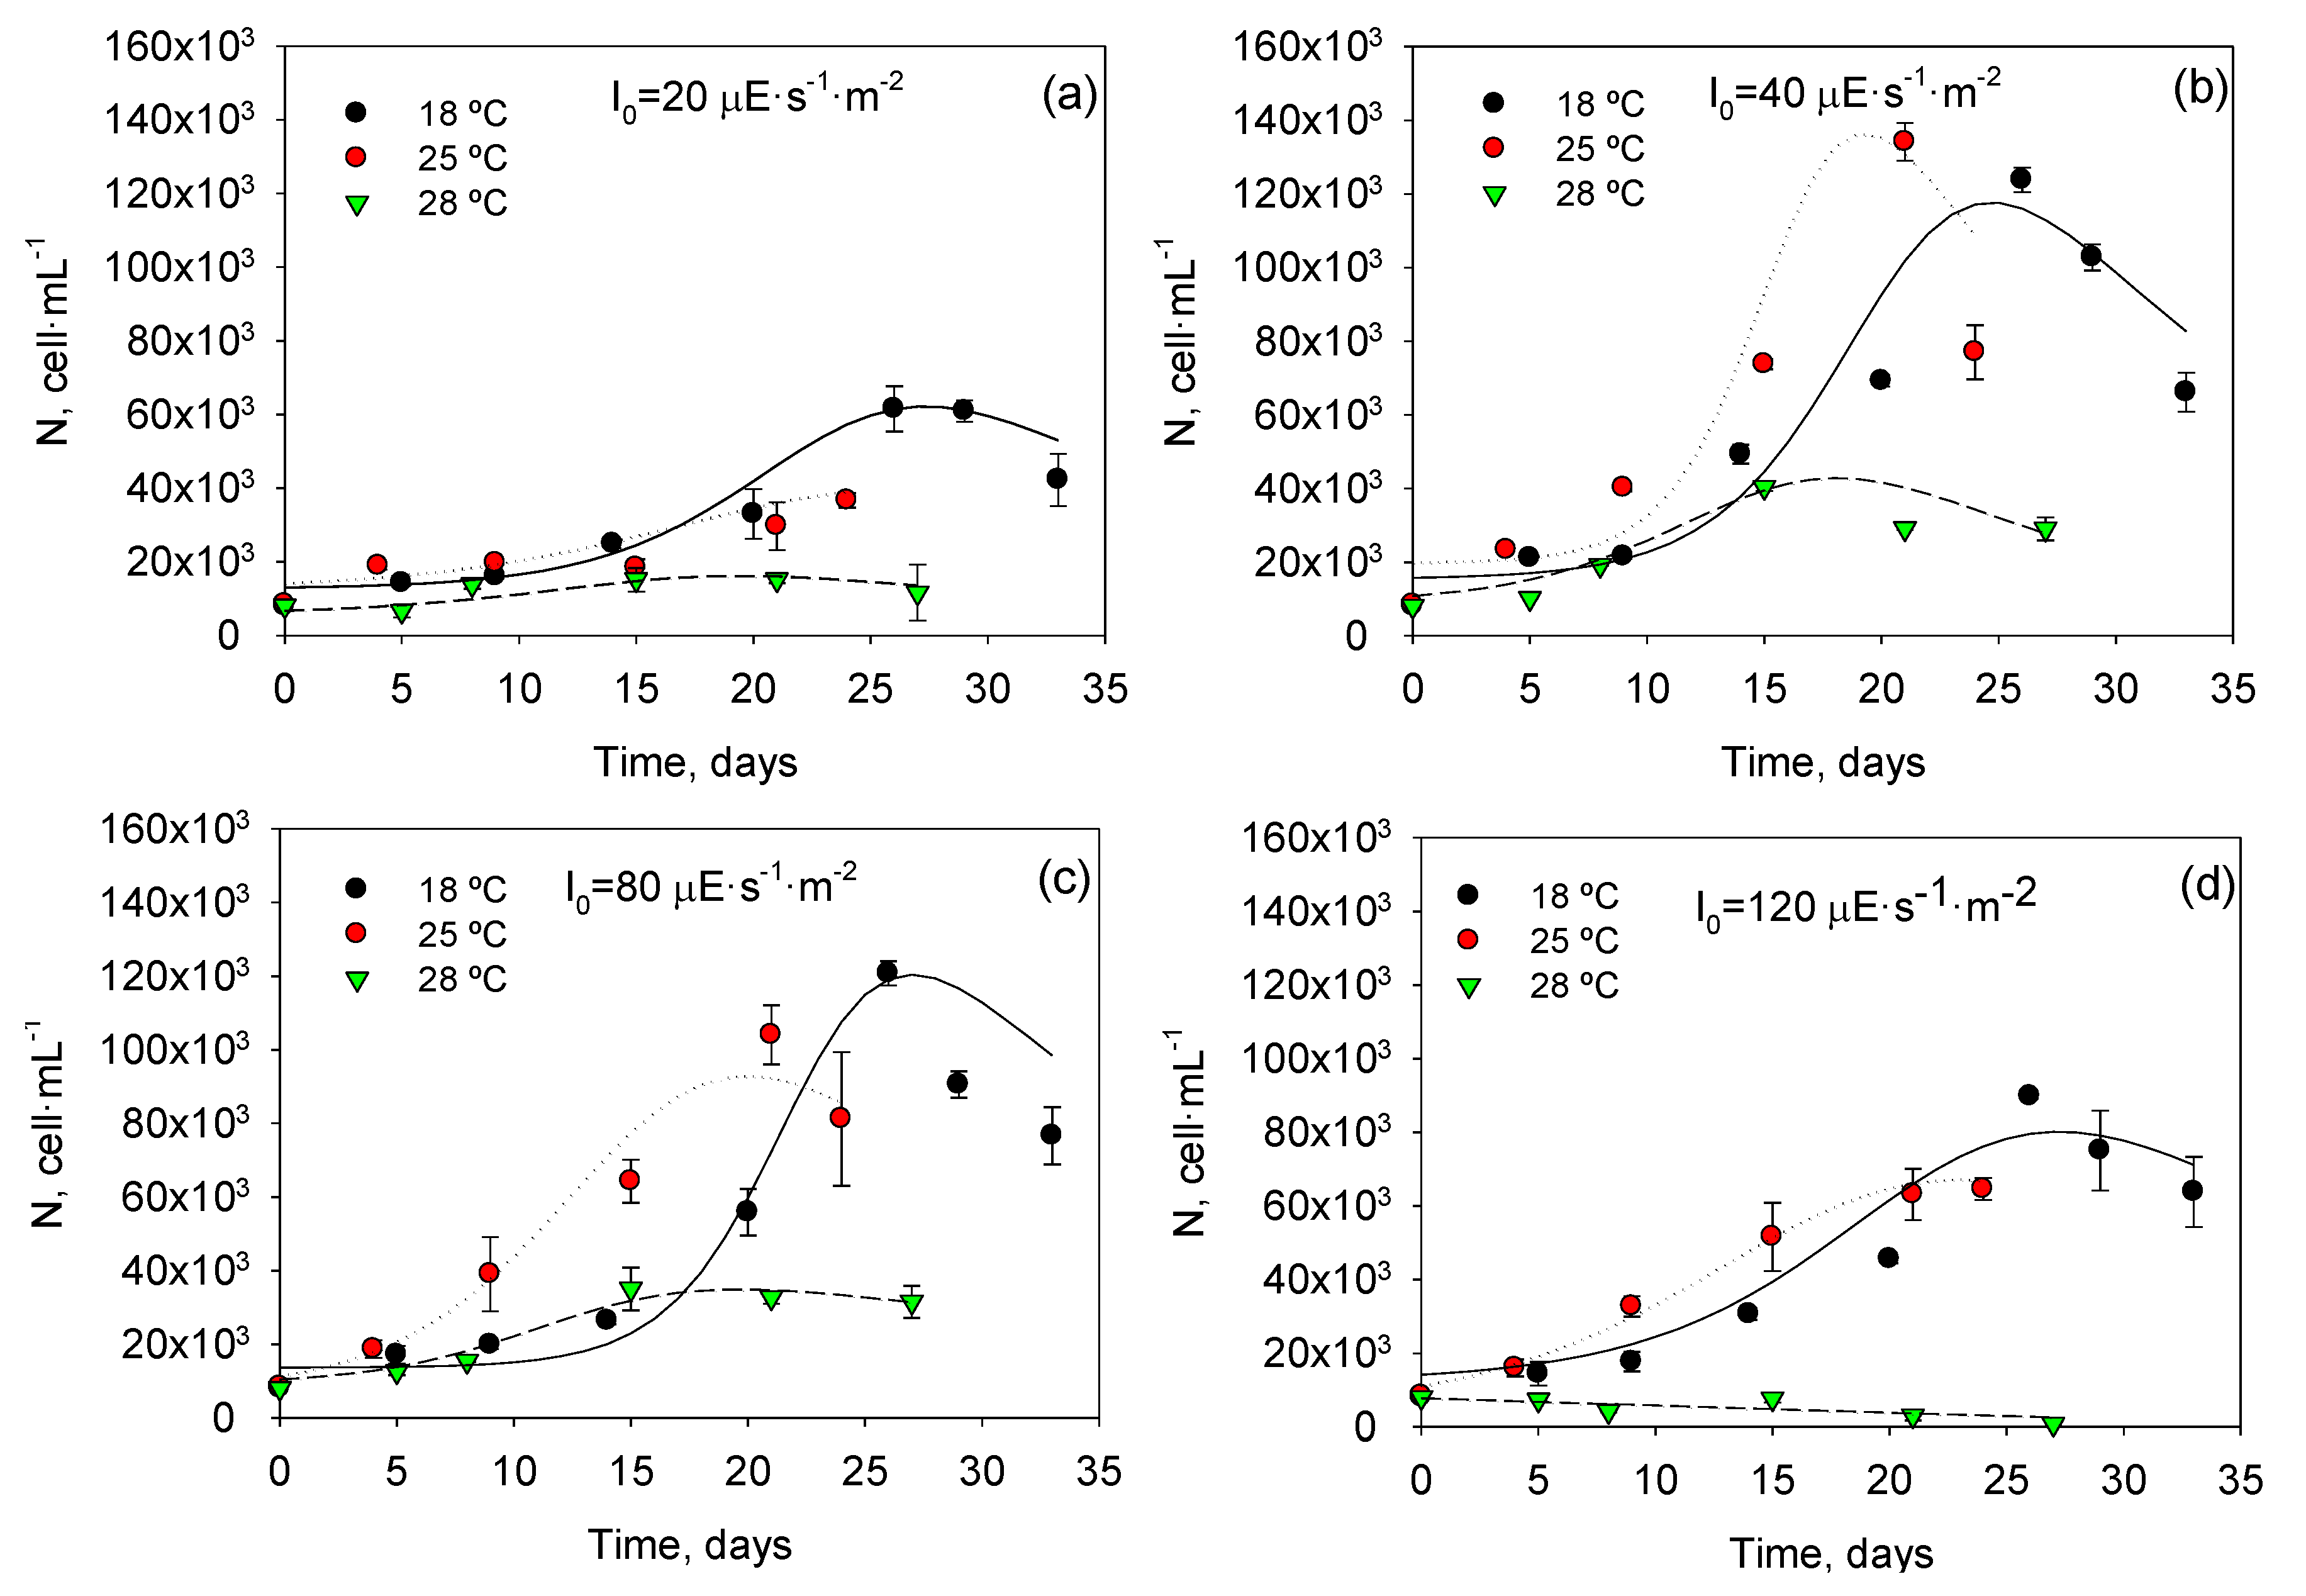
Figure 1 shows profiles of cell density with time for all experiments and
T and
I0 combinations. A maximum cell concentration of 134 × 10
3 cells∙mL
−1 was attained at 25 °C and 40 μEs
−1m
−2. It can also be observed that the selected asymmetric logistic equations (ALEs; see Experimental
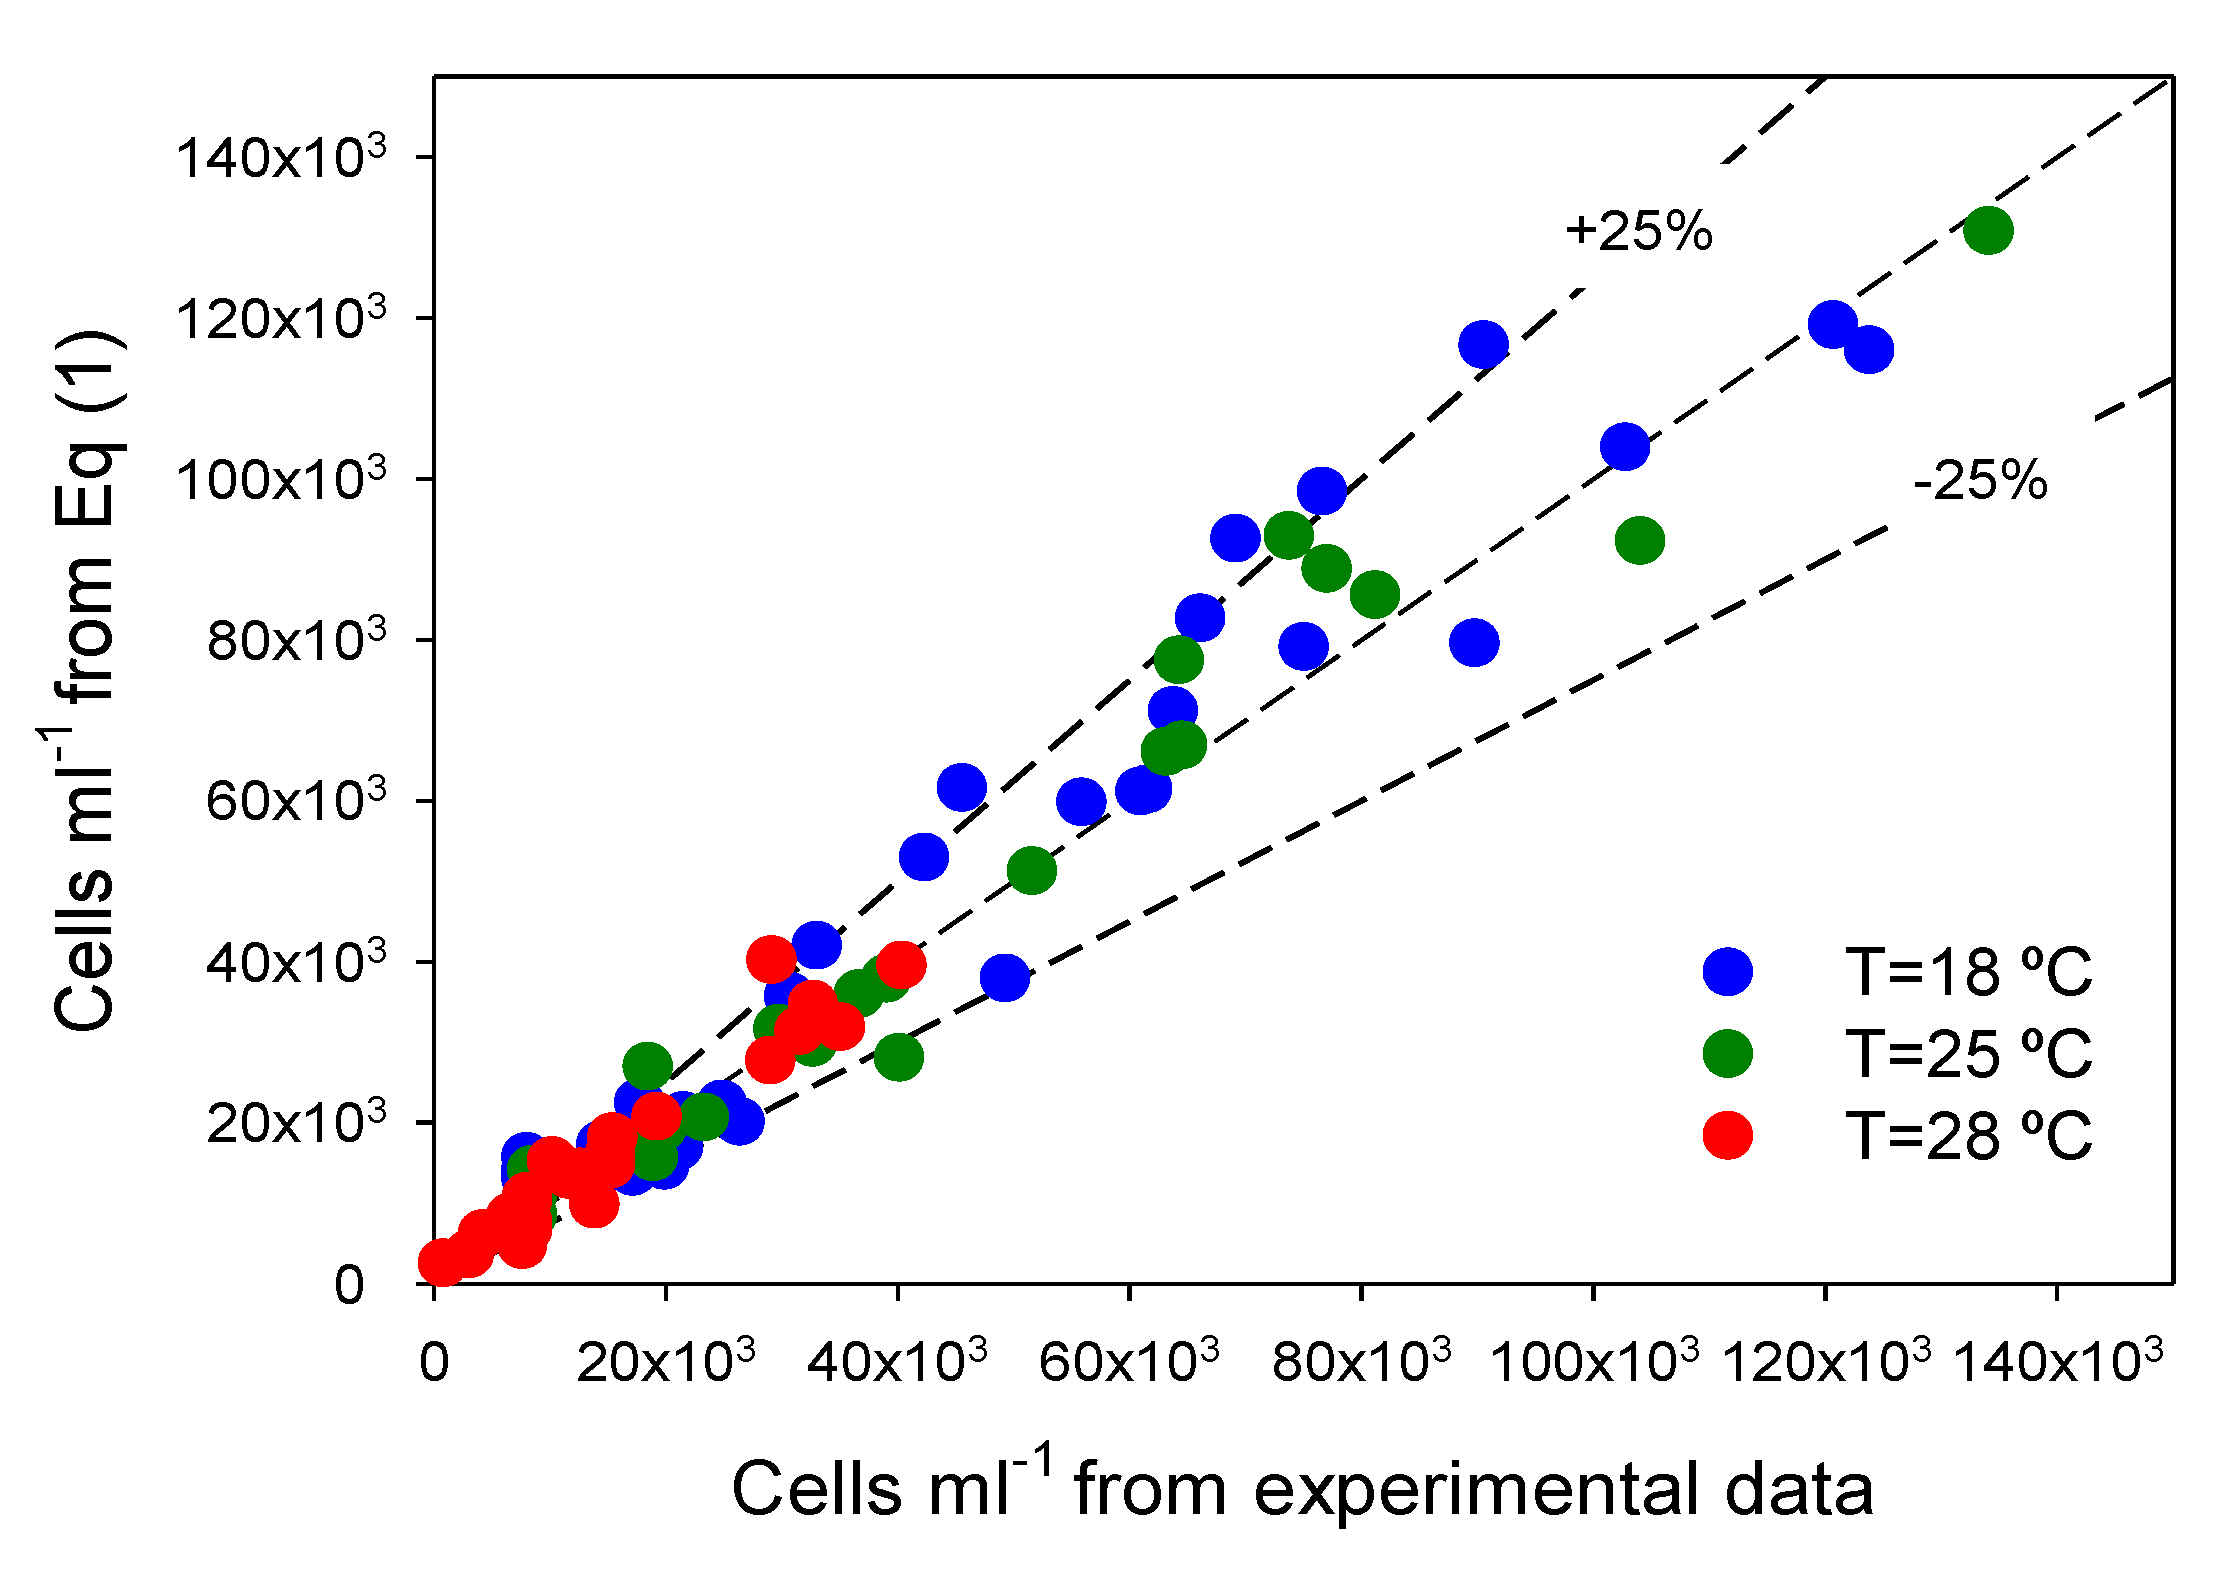
Section 3) were able to fit the different experimental asymmetric growth curves. As shown in
Figure 2, there is a good agreement (within ±25%) between measured data and values predicted from ALEs for all datasets. Clearly, Equation (2) fits experimental data obtained under different
T and
I0 quite well, supporting its use for estimating the typical physiological response in all phases of
P. belizeanum batch cultures.
Maximum specific growth rates over time were calculated with Equation (3) by analytical differentiation of the ALE (Equation (2) of Experimental
Section 3). The
µm values of every T-Flask culture were used to evaluate the effect of
T and
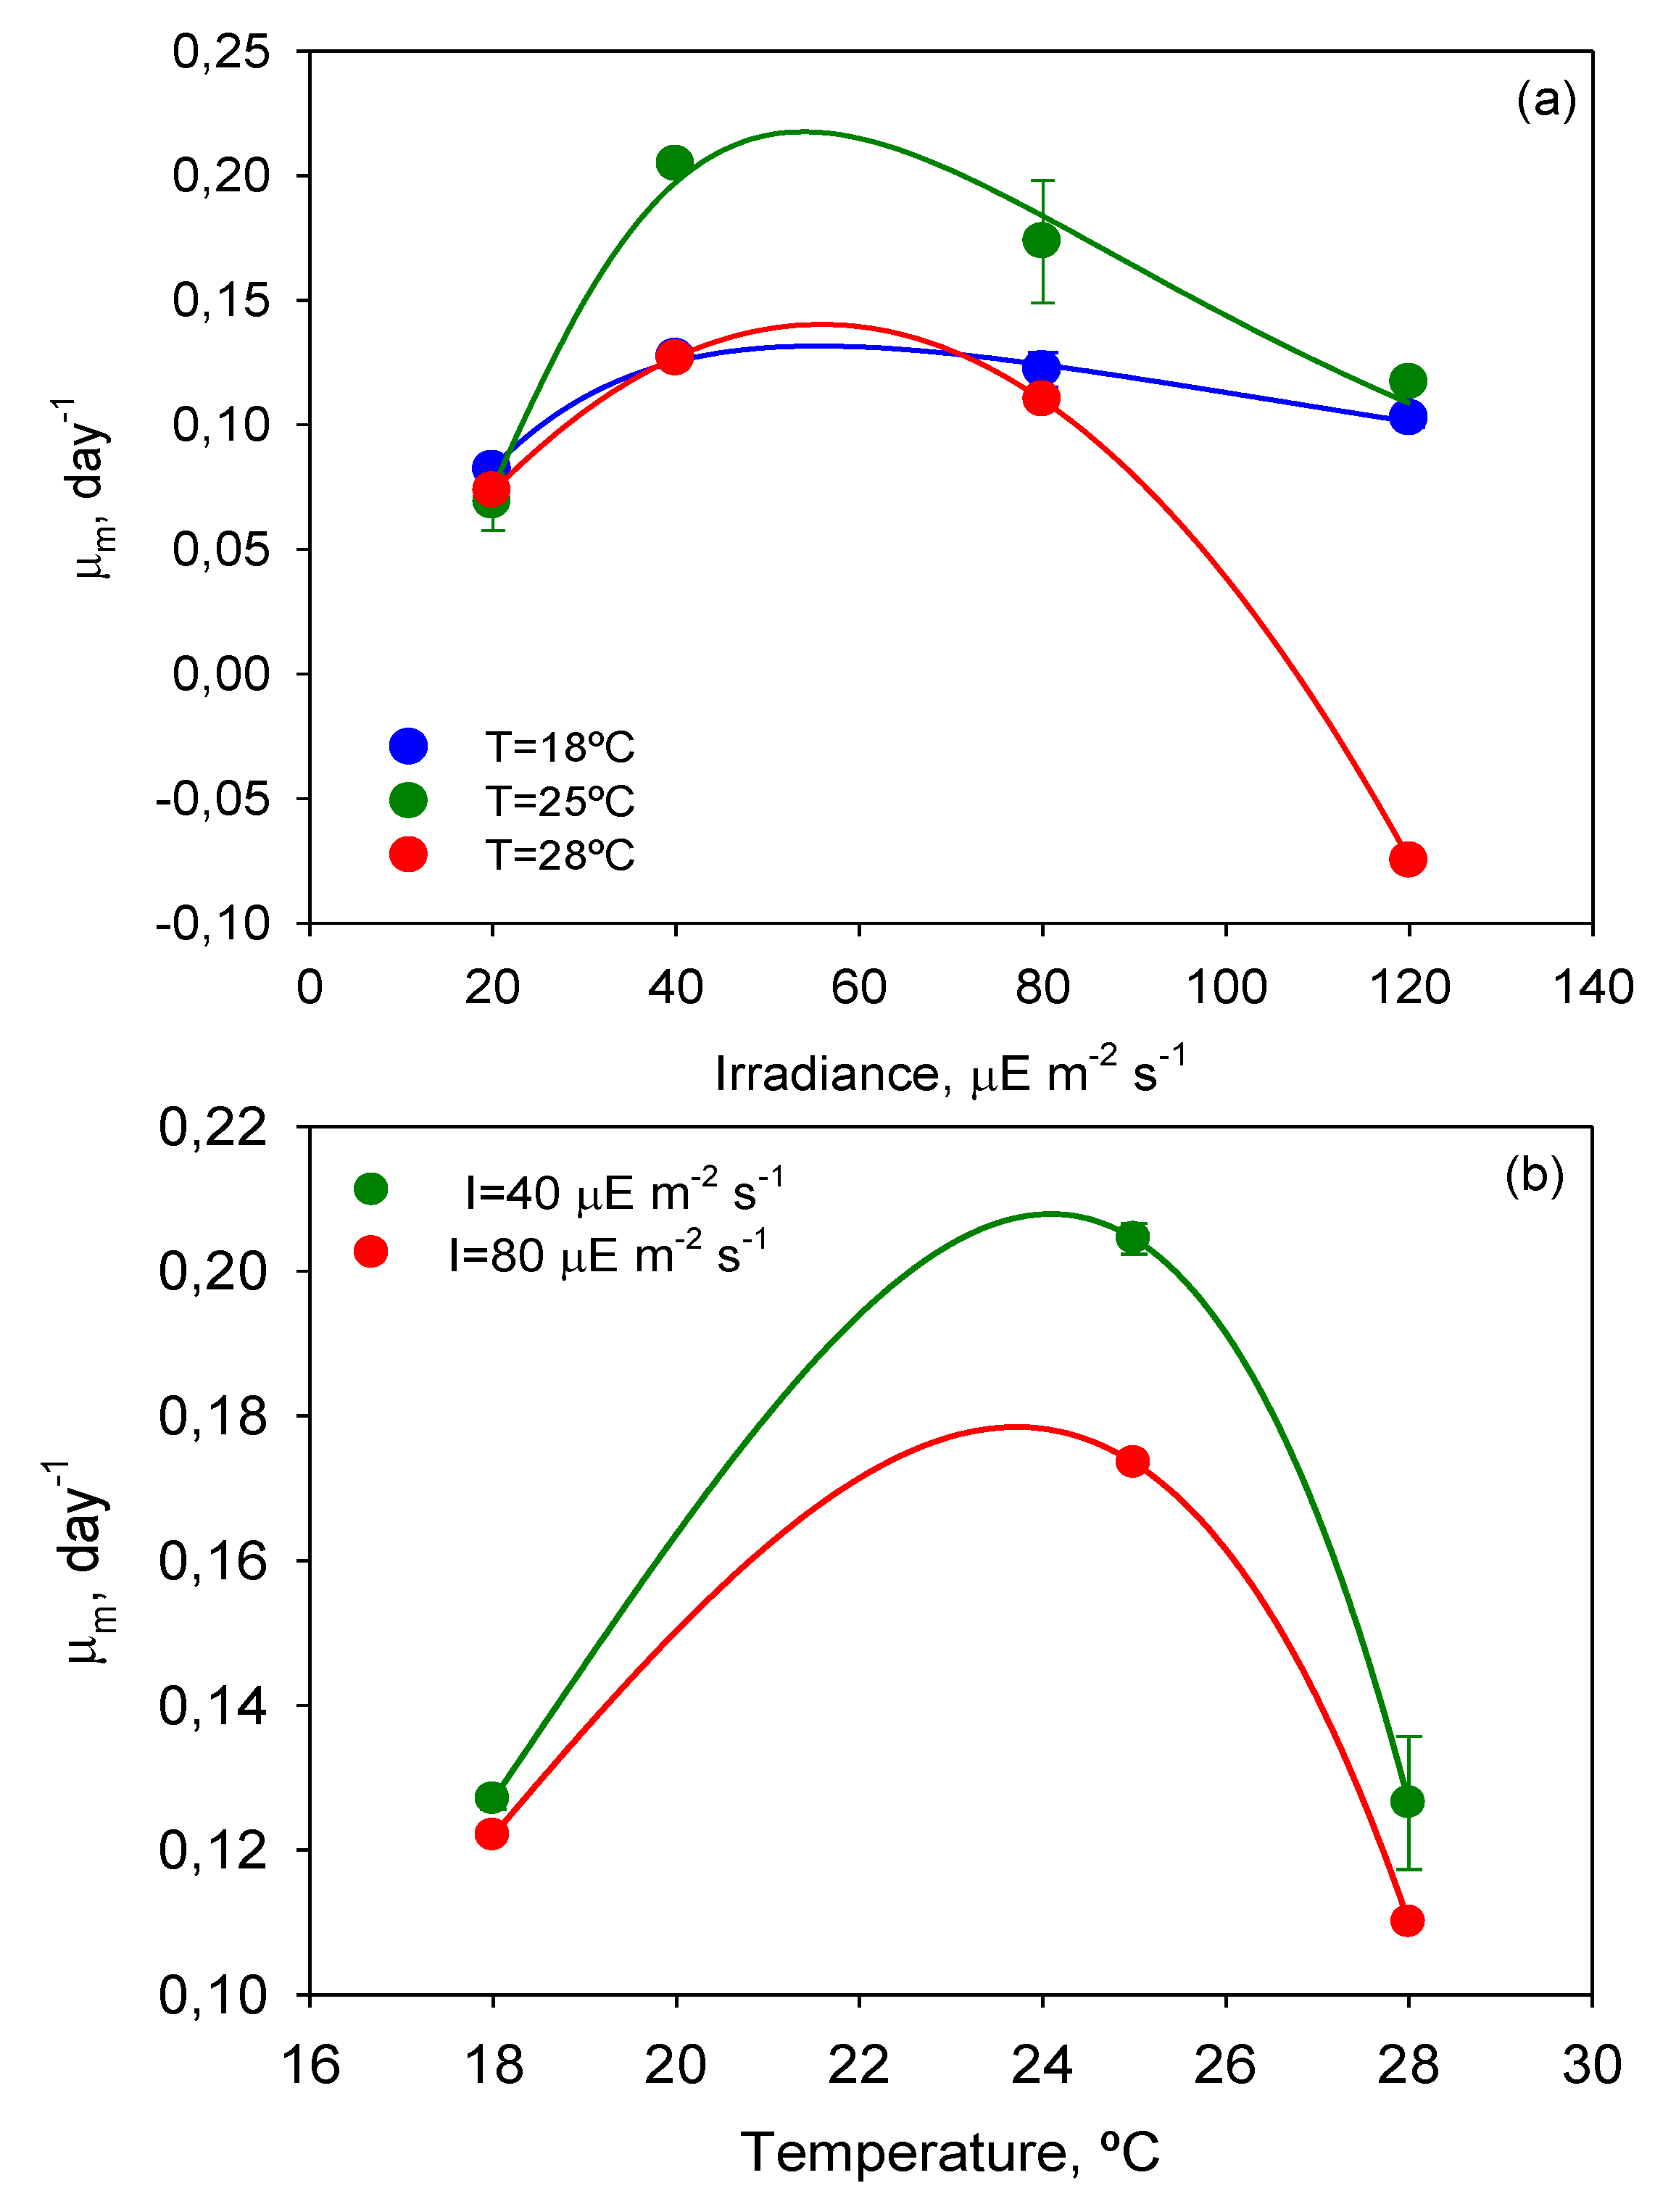
I0 on cell growth. Inspection of
Figure 3, where the dependence of
µm on
I0 and
T is illustrated, reveals that the temperature of 25 °C also provided the highest
µm value (0.204 day
−1). Although no temperature effects on growth of
P. belizeanum have been reported in the literature, optimal growth temperatures for other species of the genus
Prorocentrum ranging from 10 to 29 °C are well-documented [
15,
16,
17,
18]. The optimal irradiance,
Iopt, seemed to be around 50 µE·m
−2·s
−1 at 25 °C. While this value is very close to the irradiance levels used in many studies to grow the genus
Prorocentrum for different purposes [
19,
20,
21,
22,
23], it is far lower than those reported as optimum for other species of the same genus. For example,
Iopt for
Prorocentrum lima [
24,
25] was found to vary from 150 to 180 µE·m
−2·s
−1.
The curves
µm-
I0 in
Figure 3a are similar to the typical
P-I curves of microalgae where three main areas can be distinguished: (i) a light-limited region (≤40 μEm
−2s
−1) in which the light-absorption step controls the rate of the subsequent cell metabolic processes; (ii) zone of higher illumination (around 50 μEm
−2s
−1) in which sufficient energy is available for the cell metabolic processes to become saturated and the rate of photosynthesis is no longer a strong function of the irradiance (
i.e., metabolic assimilation of energy becomes the rate-controlling step); and (iii) a photo-inhibition region (>40 μEm
−2s
−1), in which irradiance becomes detrimental, decreasing the growth rate and even leading to culture death as in the experiment carried out at
I = 120 µE·m
−2·s
−1 and
T = 28 °C.
P. belizeanum cultures at
I0 ≥ 80 µE·m
−2·s
−1 were photoinhibited irrespective of the temperature assayed. The extension and shape of the aforementioned
µm-
I0 curve zones depended on the culture temperature (see
Figure 3a). Microalgae can acclimatize their photosynthetic system in response to shifts in temperature, modifying their irradiance requirements for optimal growth. As a result, microalgae can tolerate higher irradiances at temperatures closer to their optimum [
26],
i.e., saturation intensity increases with temperature. As stated above, and as
Figure 3 illustrates,
P. belizeanum presented an optimal growth temperature of around 25 °C, which corresponded to the highest
µm values.
Figure 1.
Temporal variation of the cell concentration of Prorocentrum belizeanum grown in T-flask batch cultures at the different irradiances and temperatures assayed: (a) 20 µE·m−2·s−1; (b) 40 µE·m−2·s−1; (c) 80 µE·m−2·s−1; (d) 120 µE·m−2·s−1. Solid lines are the fits obtained from Equation (2). Experimental data are given as the average of duplicate cultures ± SD.
Figure 2.
Illustration of the ability of the asymmetric logistic equation (Equation (2) of Experimental
Section 3) to fit experimental data. Experimental data for all experiments are compared with Equation (2) predictions. Every temperature gathers all the results for the four irradiance levels assayed. Diagonal represents an exact agreement.
Figure 3.
Maximum specific growth rate of Prorocentrum belizeanum as a function of irradiance level and temperature. Lines represent the estimated values from the fit of Equation (4) (a) and Equation (5) (b) to the experimental data. Experimental data are given as the average of duplicate cultures ± SD.
Lines in
Figure 3 show the fit of the present models (Equations (4) and (5) of Experimental
Section 3) to the experimental data of
µm. The best-fit values of the kinetic parameters are displayed in
Table 1 and
Table 2. The values of the parameters of the
µm-
I model (see
Table 1) were consistent with other simulations reported elsewhere [
27]. For instance, the values of
α reasonably correspond to the boundary irradiance value (
I0 =
α) that separates the light-limitation region from the light-saturated photosynthesis zone (see
Figure 3a). Thus, when
I0 <
α, the photosynthesis or growth rate depends strongly on irradiance. When
I0 >
α, cultures are light-saturated, and if
I0 is sufficiently increased above
α, cells may become photoinhibited. As expected, values of the cell maintenance rate (
m) were clearly lower than the maximum specific growth rate (
µmax). Values of
µmax were similar. There is a degree of debate regarding the ideal value of exponent
n, reaction order of the photoinhibition rate, which is 0.5 or 1 according to different authors [
27]. The
n values obtained were close to 1, the main deviation corresponding to 28 °C.
Table 1.
Parameter estimation from fitting the µm-I model (Equation (4) of Experimental
Section 3) to data gathered by temperature (see
Figure 3a) using non-linear regression.
Table 1.
Parameter estimation from fitting the µm-I model (Equation (4) of Experimental Section 3) to data gathered by temperature (see Figure 3a) using non-linear regression.
| Parameter | Temperature |
|---|
| 18 °C | 25 °C | 28 °C |
|---|
| α (µE m−2 s−1) | 78.21 | 54.72 | 82.97 |
| κ (-) | 0.8545 | 0.0804 | 0.0000 |
| δ (µE−n m2n sn) | 4.6 × 10⁻³ | 1.3 × 10⁻³ | 3.7 × 10⁻⁵ |
| n (-) | 1.175 | 1.457 | 2.5 |
| m (day−1) | 0.046 | 0.152 | 0.143 |
| µmax (day−1) | 0.741 | 0.712 | 0.801 |
| *
R2 (-) | 0.999 | 0.999 | 0.939 |
Table 2.
Parameter estimation from fitting the
µm-
T model (Equation (5) of Experimental
Section 3) to data gathered by irradiance (see Figure 3b) using non-linear regression.
Table 2.
Parameter estimation from fitting the µm-T model (Equation (5) of Experimental Section 3) to data gathered by irradiance (see Figure 3b) using non-linear regression.
| Parameter | Irradiance |
|---|
| 40 µE·m−2·s−1 | 80 µE·m−2·s−1 |
|---|
| Tmin (°C) | 0.00 | 0.00 |
| Tmax (°C) | 29.89 | 30.15 |
| β (-) | 6 × 10⁻⁷ | 1.3 × 10⁻⁶ |
| γ (-) | 4.16 | 3.68 |
| µmax (day−1) | 0.108 | 0.189 |
| *
R2 (-) | 0.999 | 0.999 |
The values of the parameters for the
µm-
T model in
Table 2 were consistent with those reported by Huang
et al. (2011) for microorganisms [
28]. Other models based on the Arrhenius equation [
29] could also have been suitable for fitting the data with similar accuracy within the experimental range (data not shown). However, the
Tmin values estimated by the Huang’s model (Equation (5) of Experimental
Section 3) are closer to the biological minimum of both psychrotrophs and mesophyles as discussed elsewhere [
28]. Even so, all the commonly used
µm-
T models are formulated in such a way that
µm has to be zero out of the interval [
Tmin,
Tmax]. It is an important hurdle because negative net growth rates cannot be predicted. In fact, experimental
µm-
T data at 28 °C could not be fitted to Equation (5), since the
µm value at 120 µE·m
−2·s
−1 was negative (see
Figure 3a). Therefore, negative specific growth rates due to cell mortality should be taken into consideration for
T >
Tmax. This is critical in the control of outdoor microalgal production processes, in which biomass destruction after a high temperature episode (
T >
Tmax) should be taken into account for an accurate prediction of the total biomass evolution [
30].
Modeling of the simultaneous effect of
T and
I0 on
µm was not presented here, although it was relatively straightforward from Equations (4) and (5) by coupling the effects of
I0 and
T. From a realistic point of view, uncoupled models can be seen as a functional artefact to replace coupled models that better represent the interdependent impact of
T and
I0 on photosynthesis, but are more difficult to obtain. This
T-I0 interplay should be expressed by variation of the kinetic parameters of any
P-
I model with the temperature. Variation of the parameters in
Table 1 with
T are evidence of this, as are other cases reported in the literature, e.g., variation of saturation irradiance with
T in cultures of harmful dinoflagellates of the genus
Ceratium [
31]. However, coupled models have a large number of parameters, and therefore a high number of experiments are needed in order to fit without risk of overfitting [
32]. Future work should focus on this direction.
2.2. Maximum Photochemical Yield (Fv/Fm)
Fv/
Fm, which is the ratio of variable fluorescence to maximal fluorescence (see Experimental
Section 3), provides an estimate of the PSII maximum efficiency within dark-adapted material. Measurements of
Fv/
Fm with the time of culture were recorded for all the experiments. To analyze the effect of the factors involved (
T,
I0, and time) and their interactions on the variability of
Fv/
Fm, a multifactor ANOVA was carried out, and the results are shown in
Table 3. All factors and interactions, except for
I0-t, had a statistically significant effect on
Fv/
Fm at the 95.0% confidence level (
p < 0.05). However, the contributions of the time of culture (4.44%) and of the sum of all interactions (14.87%) to the global variation of
Fv/
Fm were substantially lower than those of temperature (26.59%) and irradiance (54.09%).
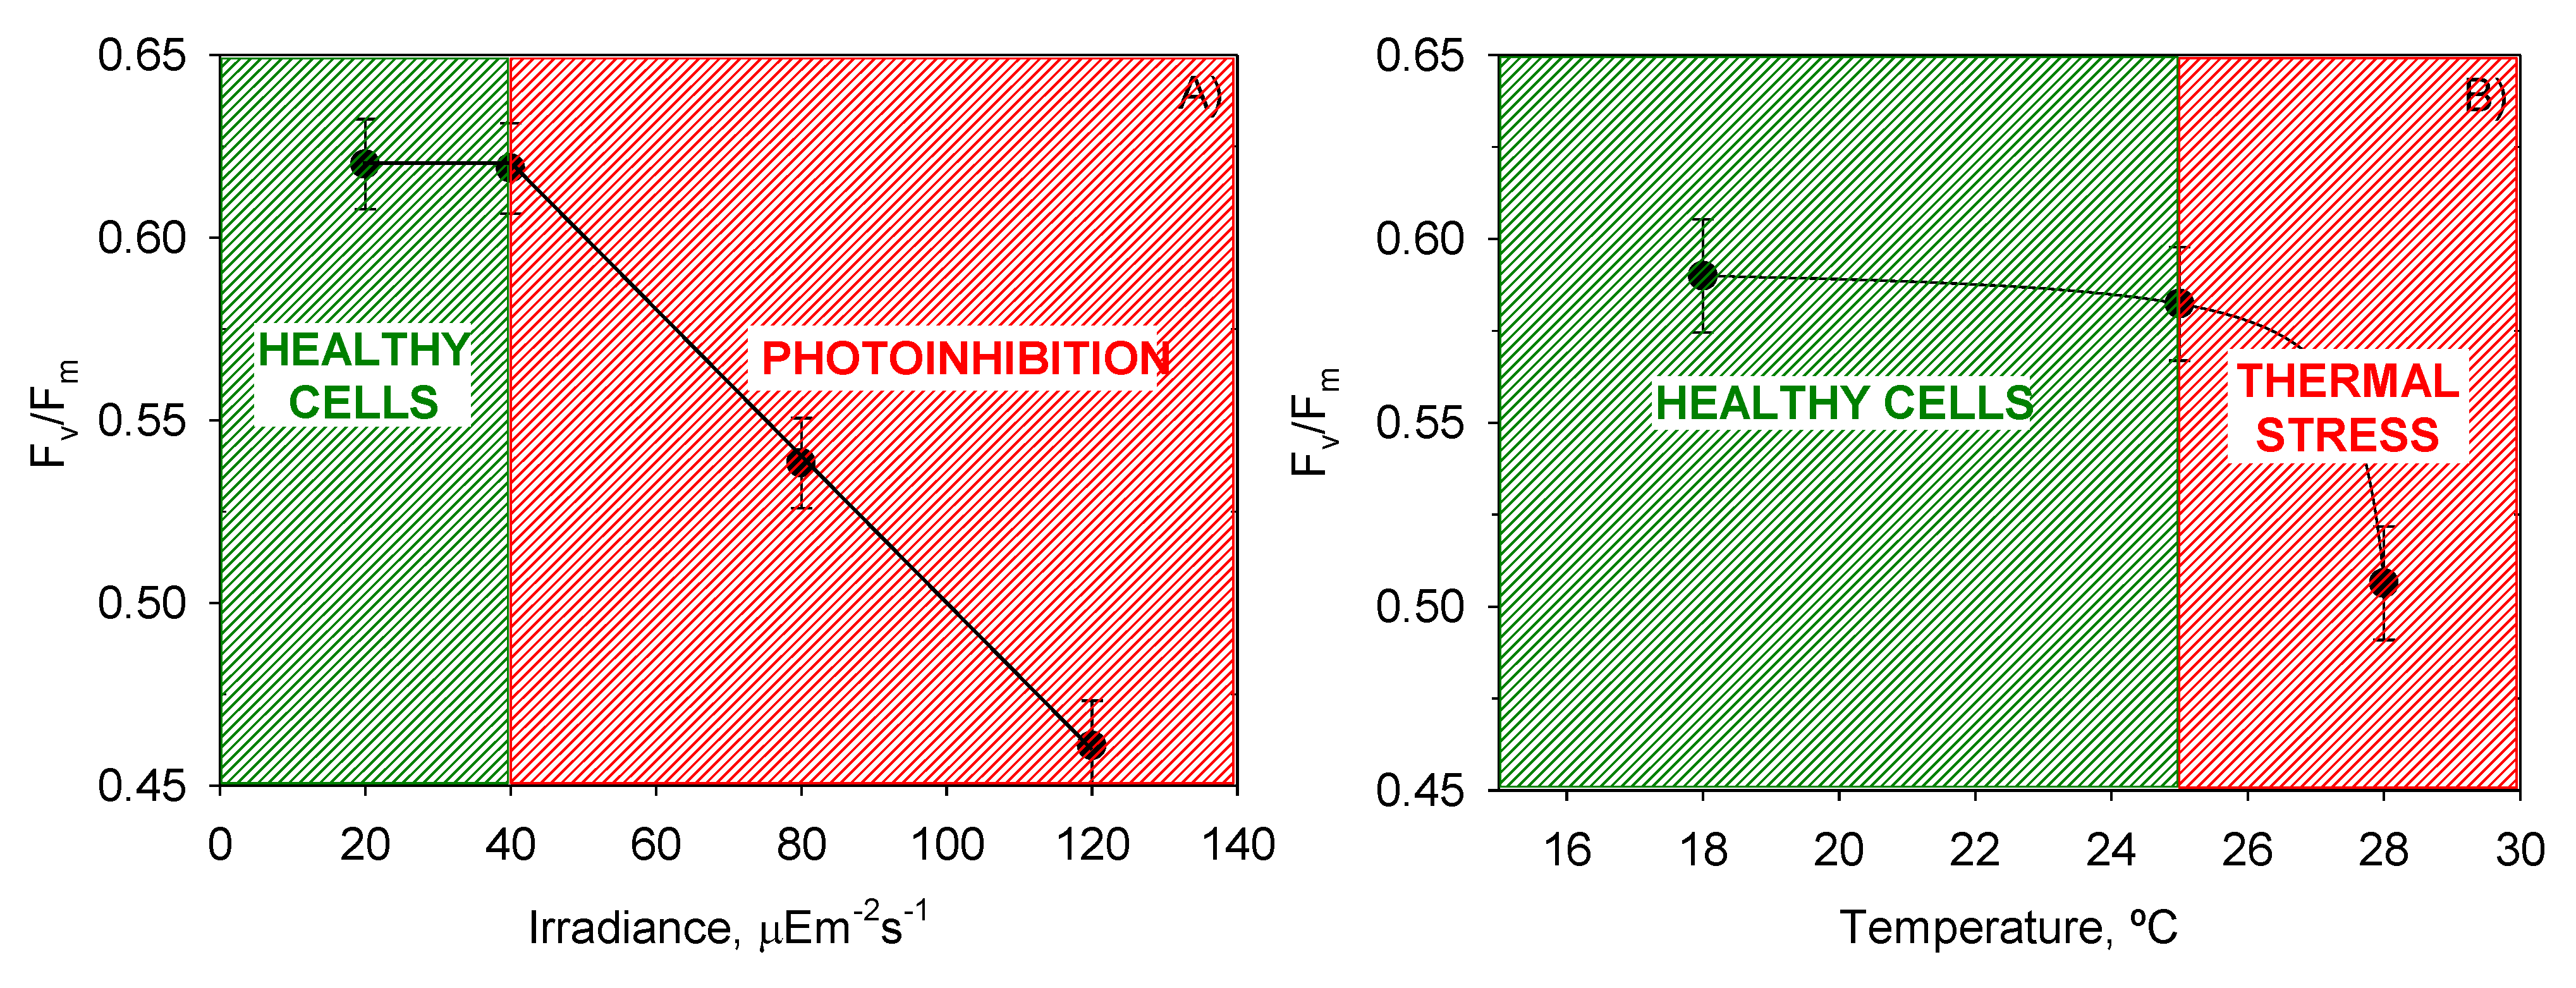
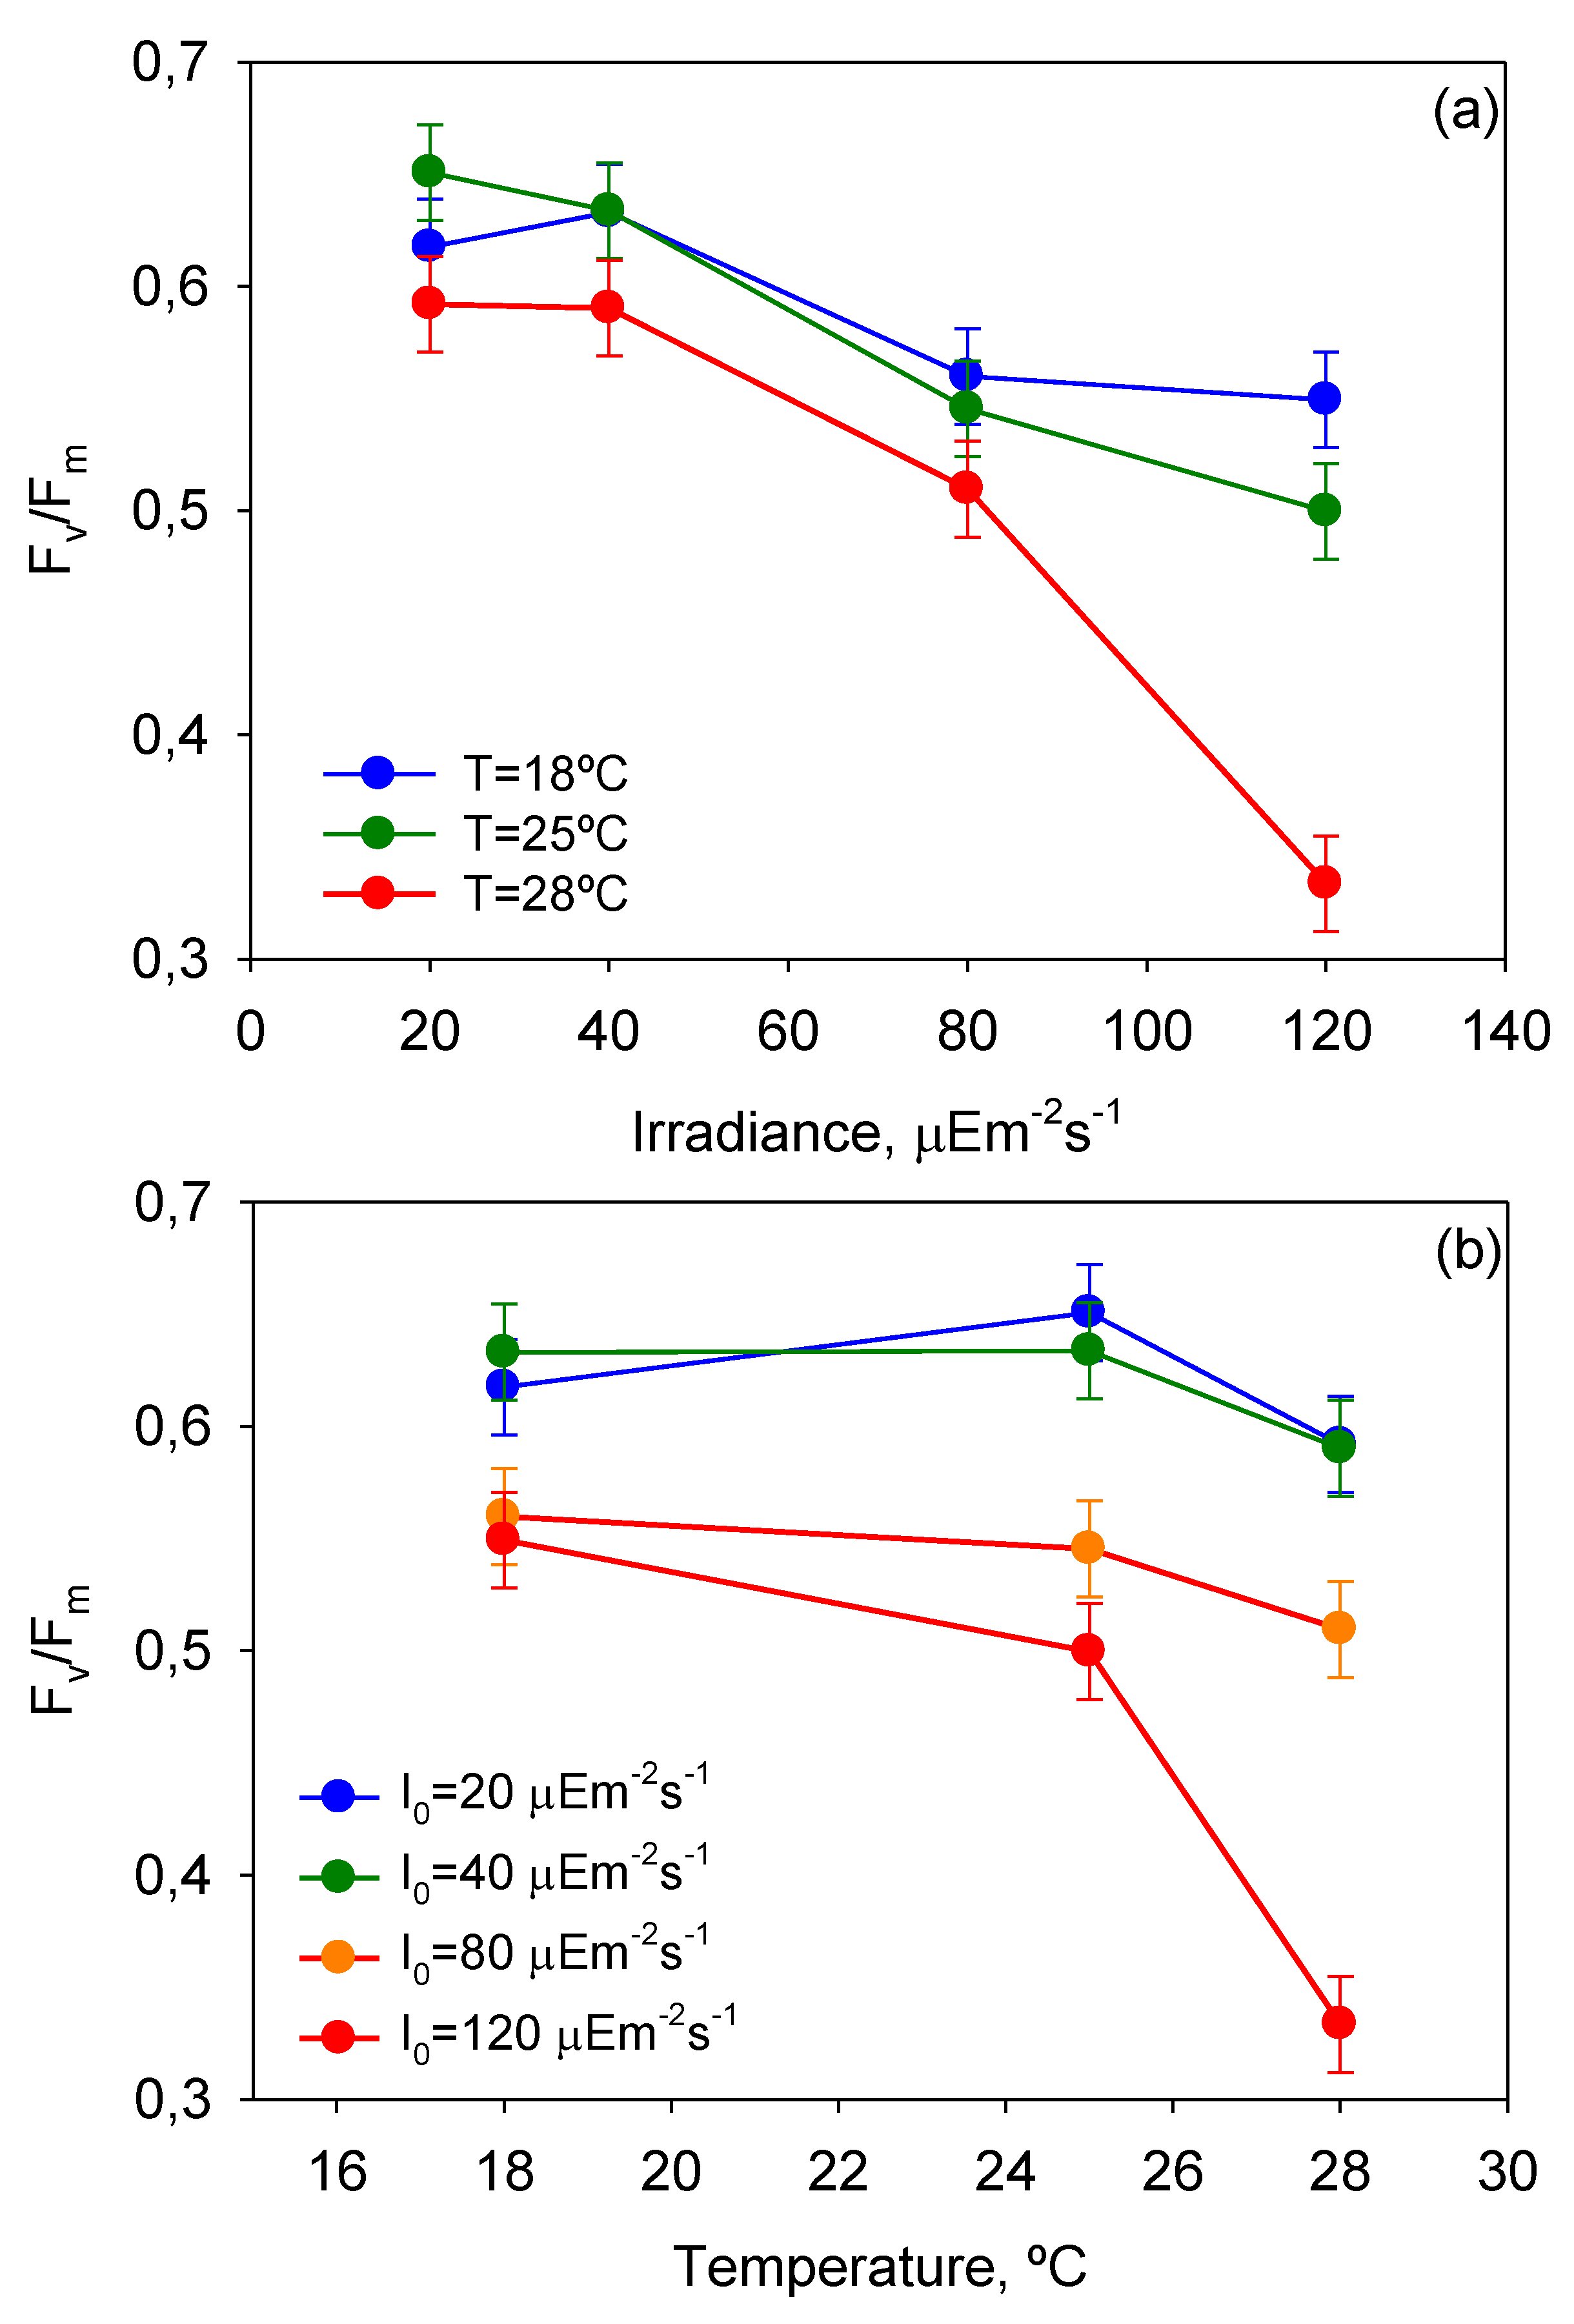
Figure 3 shows the mean
µm values reached for each
T and
I0 and the intervals around each mean value. Fisher’s least significant difference (LSD) procedure was used for establishing discrimination among the means. Thus, for irradiances and temperatures above 40 µE·m
−2·s
−1 and 25 °C, respectively, there were statistically significant differences between factor levels. These values of
I0 and
T divided the plots in
Figure 4 into two zones that allowed the separation of photoinhibited or thermally stressed cells from healthy cells in function of the recorded
Fv/
Fm. Photoinhibition of photosynthesis was clearly identified in
Figure 4a by a light-induced depression in
Fv/
Fm. Photoinhibition at sub-optimal temperature (18 °C) was not observed in
Figure 4b.
Figure 5 displays the impact of
T-
I0 interactions on
Fv/
Fm. Notice that the effect of photoinhibition and thermal stress is strengthened at high temperatures (>25 °C) and irradiances (>40 µE·m
−2·s
−1), respectively. These results are therefore in line with the aforementioned observations derived from the analysis of
µm-
I0 and
µm-
T curves.
Table 3.
Multifactor ANOVA testing the effect of temperature (T), irradiance (I0) and time of culture (t) on different cellular responses: maximum quantum yield (Fv/Fm), cell content of pigments (Chlorophyll a, Chl a; Chlorophyll c2, Chl c; Peridinin, Pe; Diadinoxanthin, Dd; Dinoxanthin, Dn) and production of okadaic acid (OA). Overall variability is divided into several components: a component attributable to the main effect of each factor and another one attributable to the interaction between different factors. Percentage of variation of the response (Variation, %), explained by the contribution of each factor and interaction, as the percentage of the F-ratio of each factor relative to the sum of all F-ratios.
| Response | Statistics | Main Effects | Interactions |
|---|
| T | I0 | t | T-I0 | T-t | I0-t |
|---|
| Fv/Fm | Variation (%) | 26.59 | 54.09 | 4.44 | 5.15 | 6.62 | 3.10 |
| p-value | <0.05 | <0.05 | <0.05 | <0.05 | <0.05 | >0.05 |
| Cha (pg cell−1) | Variation (%) | 61.52 | 27.08 | 6.86 | 2.35 | (-) | 2.18 |
| p-value | <0.05 | <0.05 | <0.05 | >0.05 | (-) | >0.05 |
| Chc (pg cell−1) | Variation (%) | 64.33 | 24.68 | 6.34 | 0.84 | (-) | 0.67 |
| p-value | <0.05 | <0.05 | >0.05 | >0.05 | (-) | >0.05 |
| Pe (pg cell−1) | Variation (%) | 68.09 | 15.01 | 6.77 | 5.65 | (-) | 4.46 |
| p-value | <0.05 | <0.05 | >0.05 | >0.05 | (-) | >0.05 |
| Dd (pg cell−1) | Variation (%) | 65.36 | 18.06 | 11.09 | 4.67 | (-) | 0.79 |
| p-value | <0.05 | <0.05 | <0.05 | >0.05 | (-) | >0.05 |
| Dn (pg cell−1) | Variation (%) | 17.64 | 52.24 | 4.27 | 16.85 | (-) | 8.97 |
| p-value | <0.05 | <0.05 | <0.05 | <0.05 | (-) | <0.05 |
| OA (pg·cell−1) | Variation (%) | 79.02 | 16.94 | (-) | 4.04 | (-) | (-) |
| p-value | <0.05 | <0.05 | (-) | <0.05 | (-) | (-) |
| OA (ng·mL−1) | Variation (%) | 98.92 | 1.084 | (-) | 0.48 | (-) | (-) |
| p-value | <0.05 | <0.05 | (-) | <0.05 | (-) | (-) |
Figure 4.
Evaluation from the ANOVA of the effect of (A) I0 and (B) T on the mean maximum photochemical yield of the PSII (Fv/Fm) of P. belizeanum. Every irradiance and temperature gathers all the results obtained for the three T and four I0 levels, respectively. Bars around points represent 95.0% confidence intervals based on Fisher’s least significant difference procedure. Overlapping bars indicate no significant difference.
Figure 5.
Plots of ANOVA interactions (a) T-I0 and (b) I0-T in the response of mean maximum photochemical yield of the PSII (Fv/Fm) of P. belizeanum (if the factors do not interact, the lines on the plot should be approximately parallel. If they are not, then the effect of one factor depends upon the level of the other). Every irradiance and temperature gathers all the results obtained for the three T and four I0 levels, respectively. Bars around points represent 95.0% confidence intervals based on Fisher’s least significant difference (LSD) procedure. Overlapping bars indicate no significant difference.
Microalgal cultures with
Fv/
Fm values ranging from 0.6 for cyanobacteria to 0.8 for green algae are generally considered healthy by algologists. Although to date there is no established consensus about dinoflagellates,
Fv/
Fm values of around 0.6 also seem to be indicative of healthy cells (see
Figure 4). Depending on the growth conditions,
Fv/
Fm can vary significantly during cultivation. Hence a decline in
Fv/
Fm from optimal values represents a reliable warning indicator for preventing or treating stressed microalgal culture as reported elsewhere [
33]. Dinoflagellates can also experience sharp declines in
Fv/
Fm under prolonged exposure to thermal and/or light stress [
34,
35,
36].
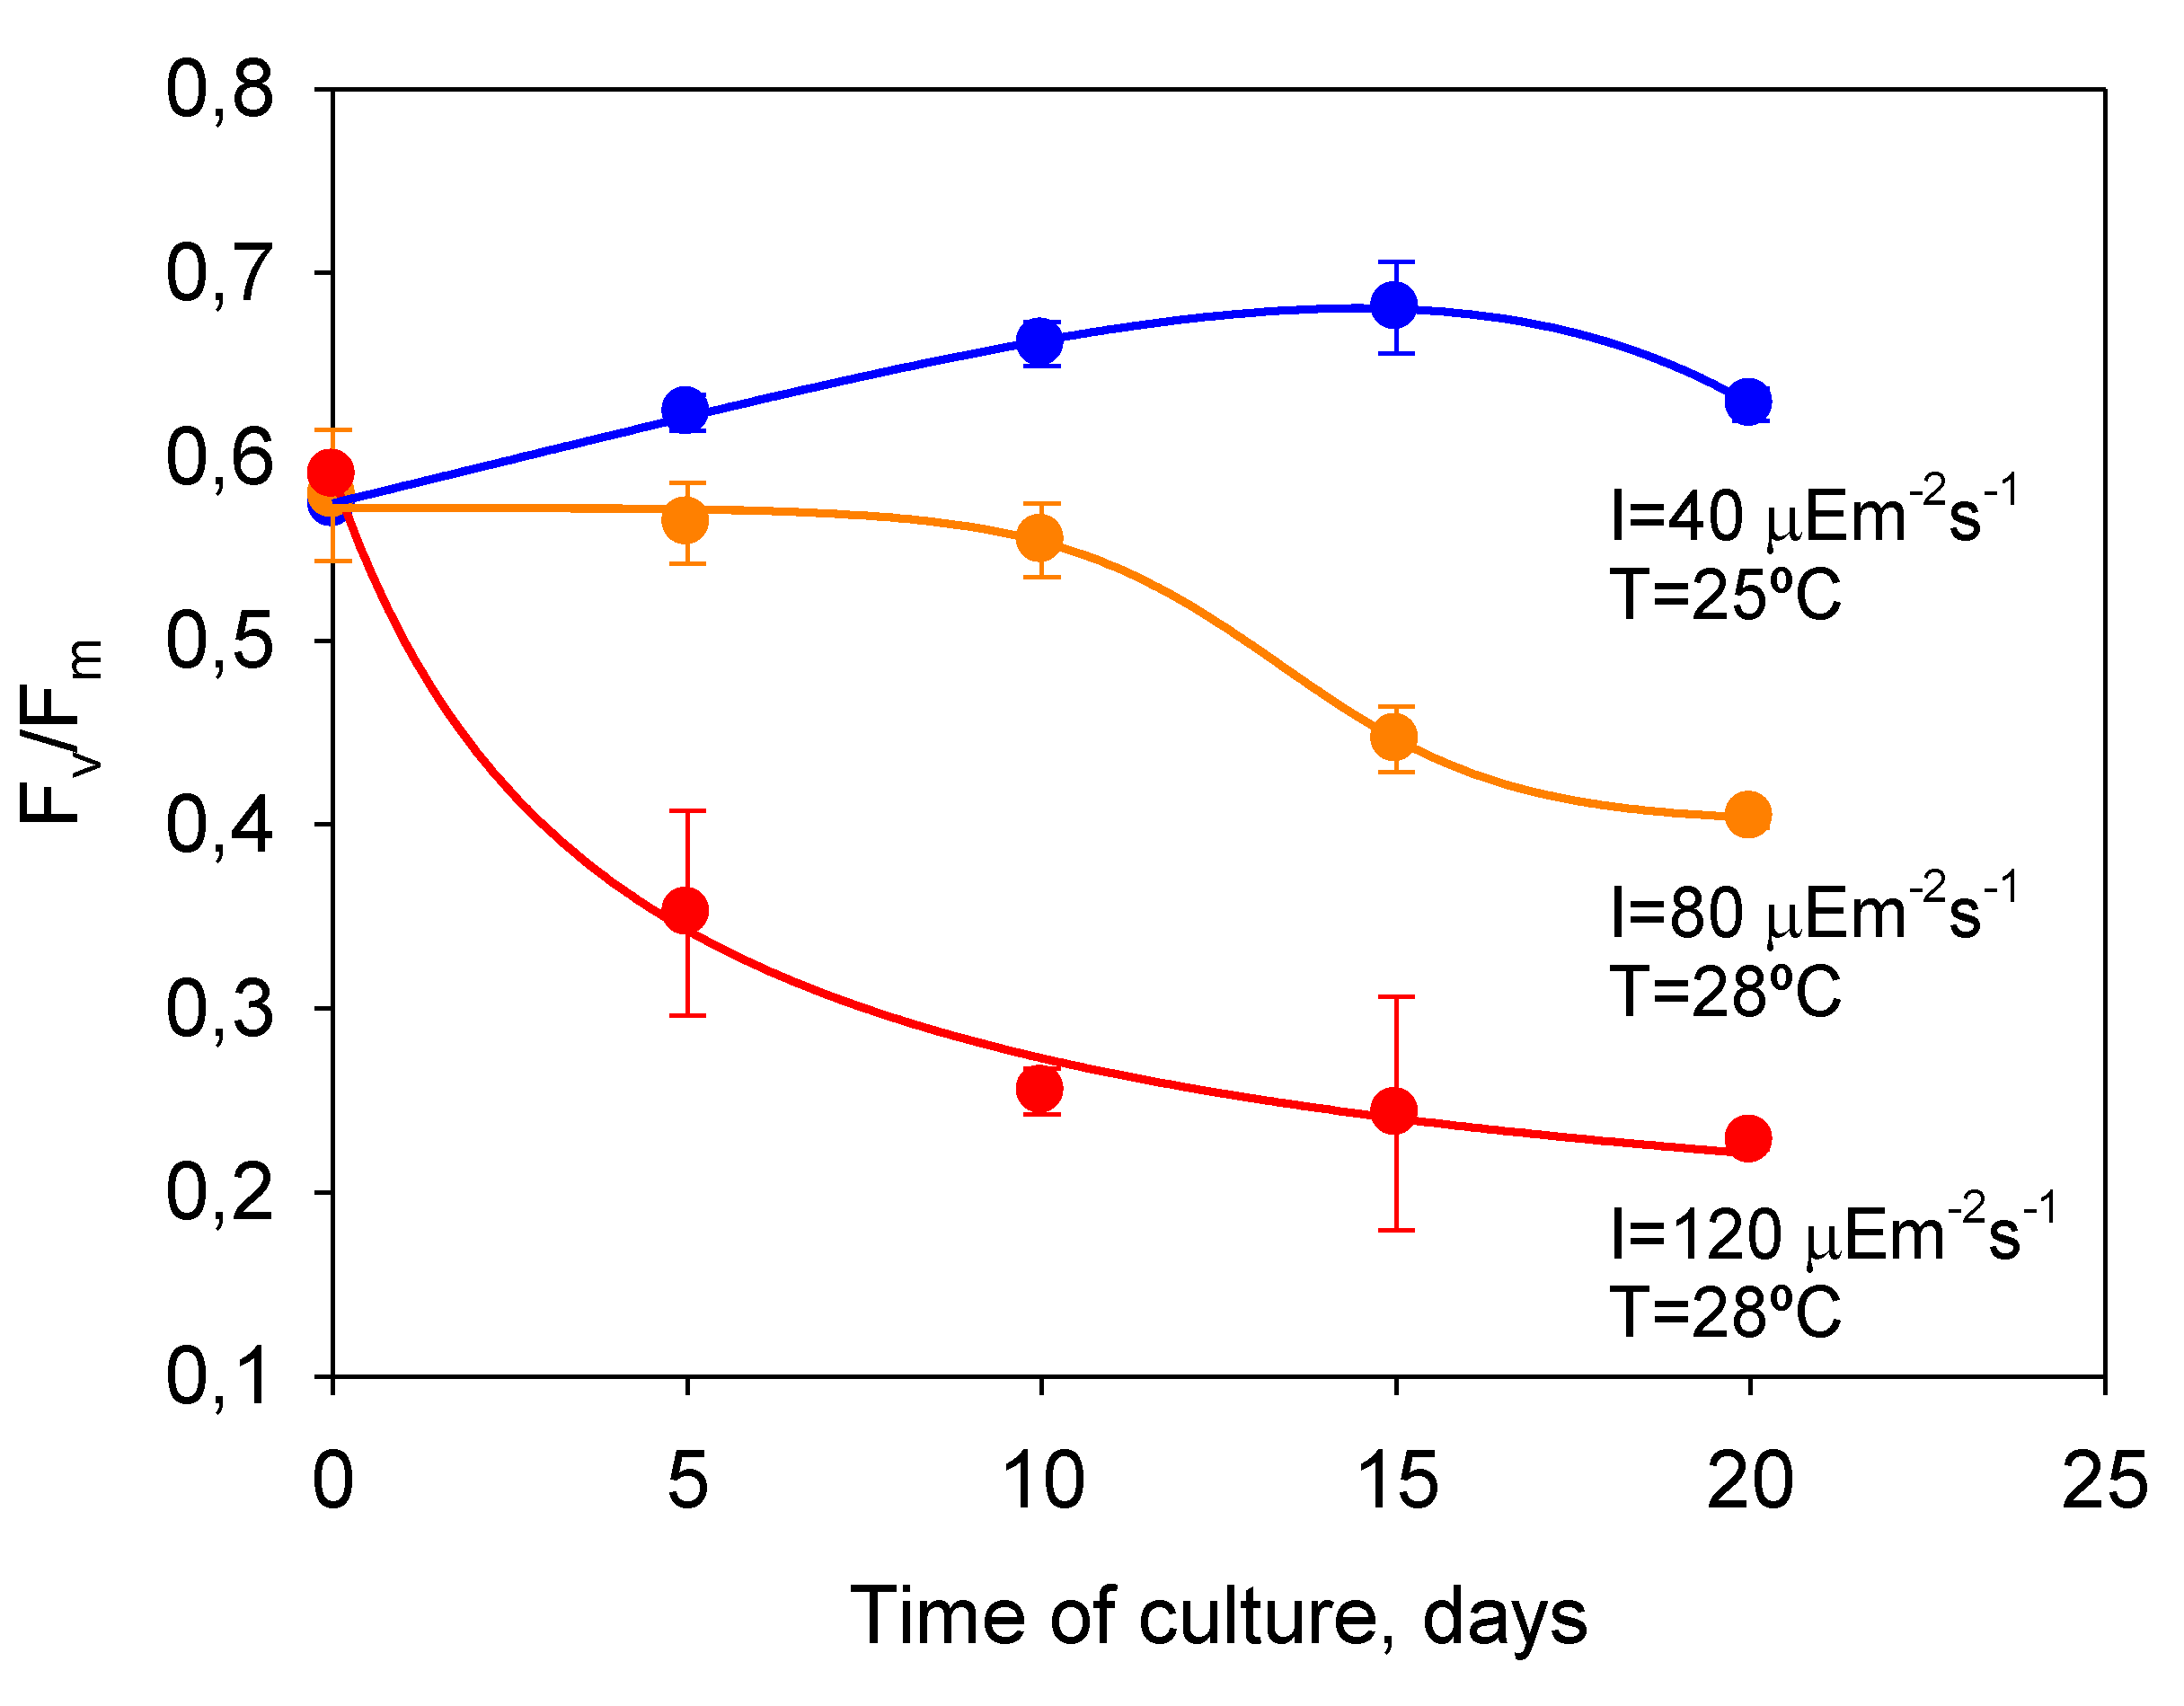
P. belizeanum showed a similar behavior, as
Figure 6 shows. In the severely photoinhibited and thermally stressed culture (28 °C and 120 µE·m
−2·s
−1),
Fv/
Fm markedly decreased from 0.65 for unstressed conditions at the beginning of the culture, to below 0.3 after 10 days of culture, indicating a strong photoinactivation of the PSII.
Fv/
Fm in the culture under optimal
T and
I0 (25 °C and 40 µE·m
−2·s
−1) showed consistent values from 0.6 to 0.7 by contrast. In the culture moderately photoinhibited (
T = 28 °C and 80 µE·m
−2·s
−1),
Fv/
Fm only began to significantly decline from day 10.
The analysis of the results presented in this section showed that the Fv/Fm measurements are an appropriate indicator of the PSII photochemical yield and can be used to monitor the physiological state of adherent cell cultures of the benthic dinoflagellate P. belizeanum.
Figure 6.
Temporal variation of dark-adapted FV/Fm in cultures of P. belizeanum exposed to experimental conditions with different stress levels. Data points are averages, and vertical bars are standard errors of the means.
Figure 6.
Temporal variation of dark-adapted FV/Fm in cultures of P. belizeanum exposed to experimental conditions with different stress levels. Data points are averages, and vertical bars are standard errors of the means.
2.3. Synthesis of Pigments
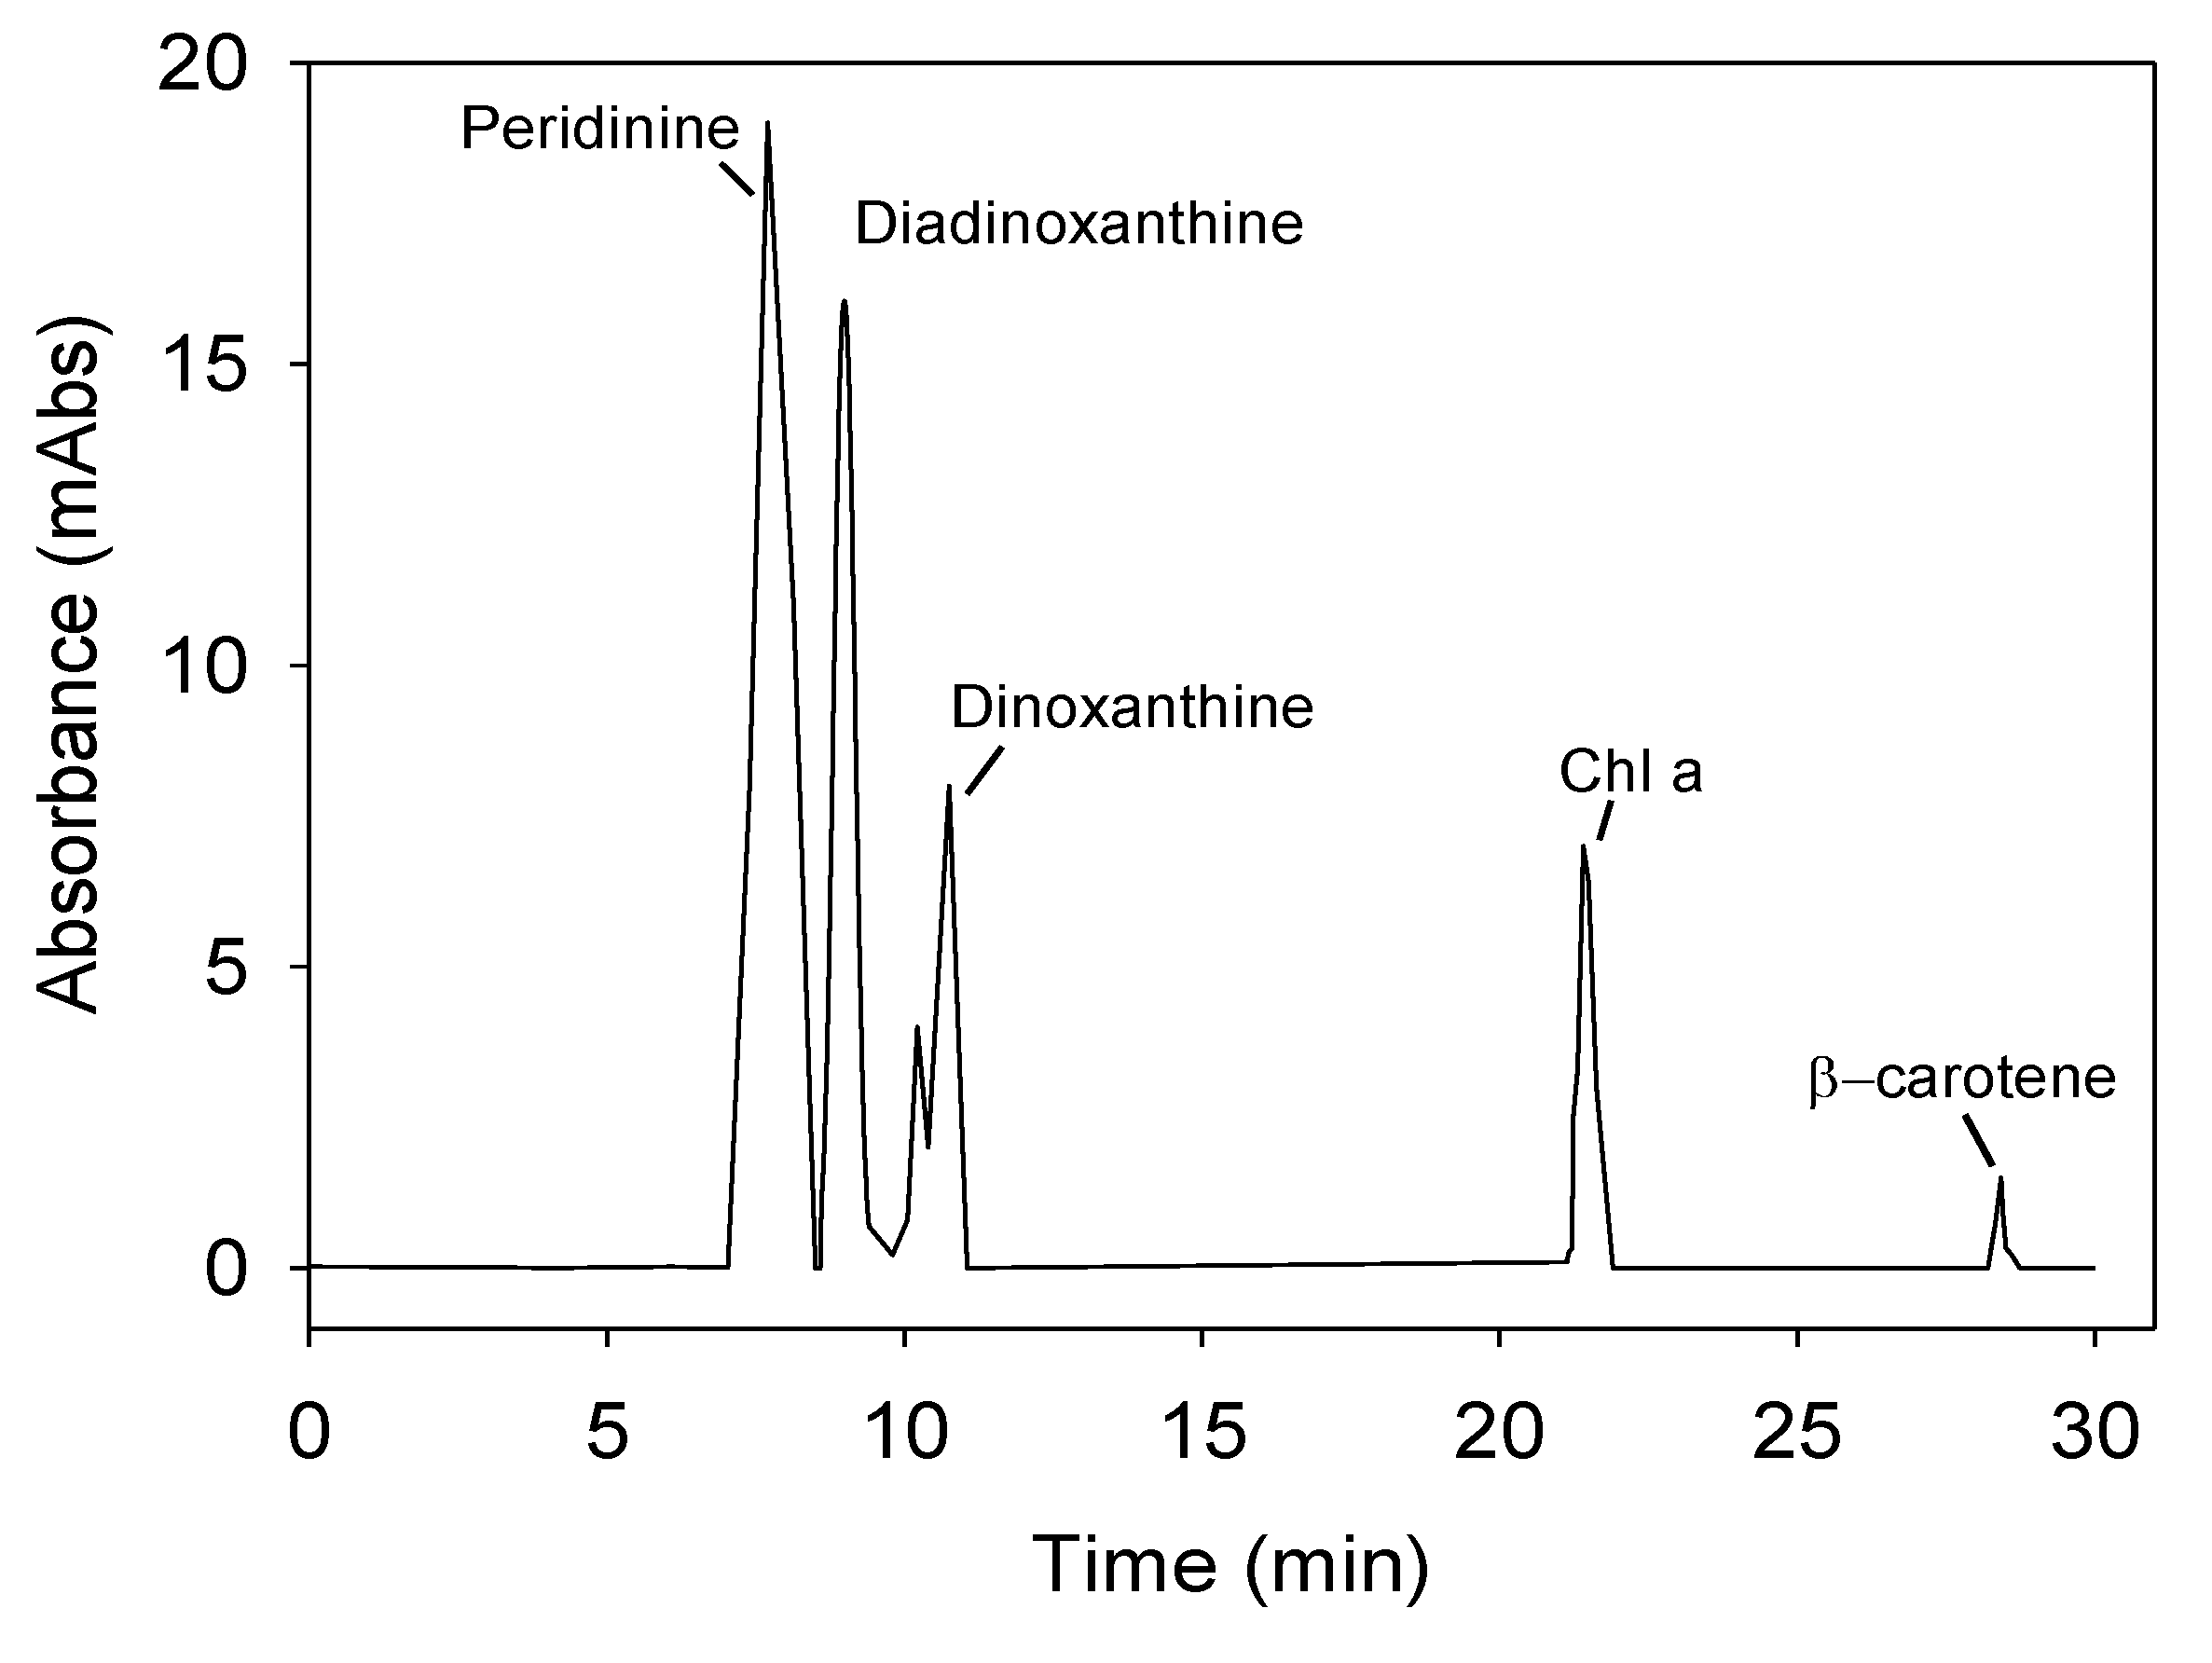
Figure 7 shows a representative chromatogram of the pigment profile of
P. belizeanum measured by high performance liquid chromatography (HPLC) in the culture used as inoculum. The following pigments were identified in
P. belizeanum cells: chlorophyll
a (Chl
a) chlorophyll
c (Chl
c), β-carotene, diadinoxanthin (
Dd), peridinin (
Pe) and dinoxanthin (
Dn). As the β-carotene concentration in the cells was always very low and was not detected in most of the chromatograms, it was excluded from the next analysis.
The abundance of carotenoid pigments (
Dn,
Dd and
Pe) for different species of the genus
Prorocentrum, expressed as molar ratios with respect to Chl
a, are compared in
Table 4. In general, intervals of variation of these ratios obtained in this study for
P. belizeanum were consistent with the values reported for other species of the same genus, though some of the maximum and minimum values for
P. belizeanum were slightly higher and lower, respectively. This was likely due to the different aforementioned stressful
T-
I0 combinations that could give rise to marked changes in pigment cellular content, as will be discussed below.
Figure 7.
Representative chromatogram of the pigment profile of
P. belizeanum, obtained from a methanol extract by means of a diode-array HPLC system. Chlorophyll
c was determined spectrophotometrically as indicated in Experimental
Section 3. The cells used came from an inoculum culture.
Figure 7.
Representative chromatogram of the pigment profile of
P. belizeanum, obtained from a methanol extract by means of a diode-array HPLC system. Chlorophyll
c was determined spectrophotometrically as indicated in Experimental
Section 3. The cells used came from an inoculum culture.
Table 4.
Intervals of variation of molar pigment ratios to Chl
a in the genus
Prorocentrum extracted from [
37] for comparison with those observed in our study for
P. belizeanum.
Table 4.
Intervals of variation of molar pigment ratios to Chl a in the genus Prorocentrum extracted from [37] for comparison with those observed in our study for P. belizeanum.
| Ratios | Level | From [37] | Our study |
|---|
| Strain | Content | Strain | Content |
|---|
| Perid/chl
c | Max | P. levis | 38.92 | P. belizeanum | 43.80 |
| Min | P. nux | 3.51 | 1.18 |
| Perid/chl
a | Max | P. rostratum | 1.69 | 2.08 |
| Min | P. arenarium | 0.95 | 0.06 |
| Chl
c/chl a | Max | P .nux | 0.43 | 0.19 |
| Min | P. levis | 0.03 | 0.14 |
| Diadino/chl
a | Max | P. lima | 1.09 | 1.36 |
| Min | P. minimum | 0.43 | 0.07 |
| Dino/chl
a | Max | P. lima | 0.3 | 3.70 |
| Min | P. minimum | 0.07 | 0.06 |
Table 3 presents results of a multifactor ANOVA carried out with all the pigment data measured during culture. Temperature was responsible for most of the variation observed in the pigment profile of
P. belizeanum, while the influence of
I0 was smaller. The interaction
T-
I0 only had a statistically significant effect (
p < 0.05) on
Dn, but its contribution to the overall variation of intracellular pigments was considerably inferior to the sum of
T and
I0 single factors. The remaining interactions were not significant.
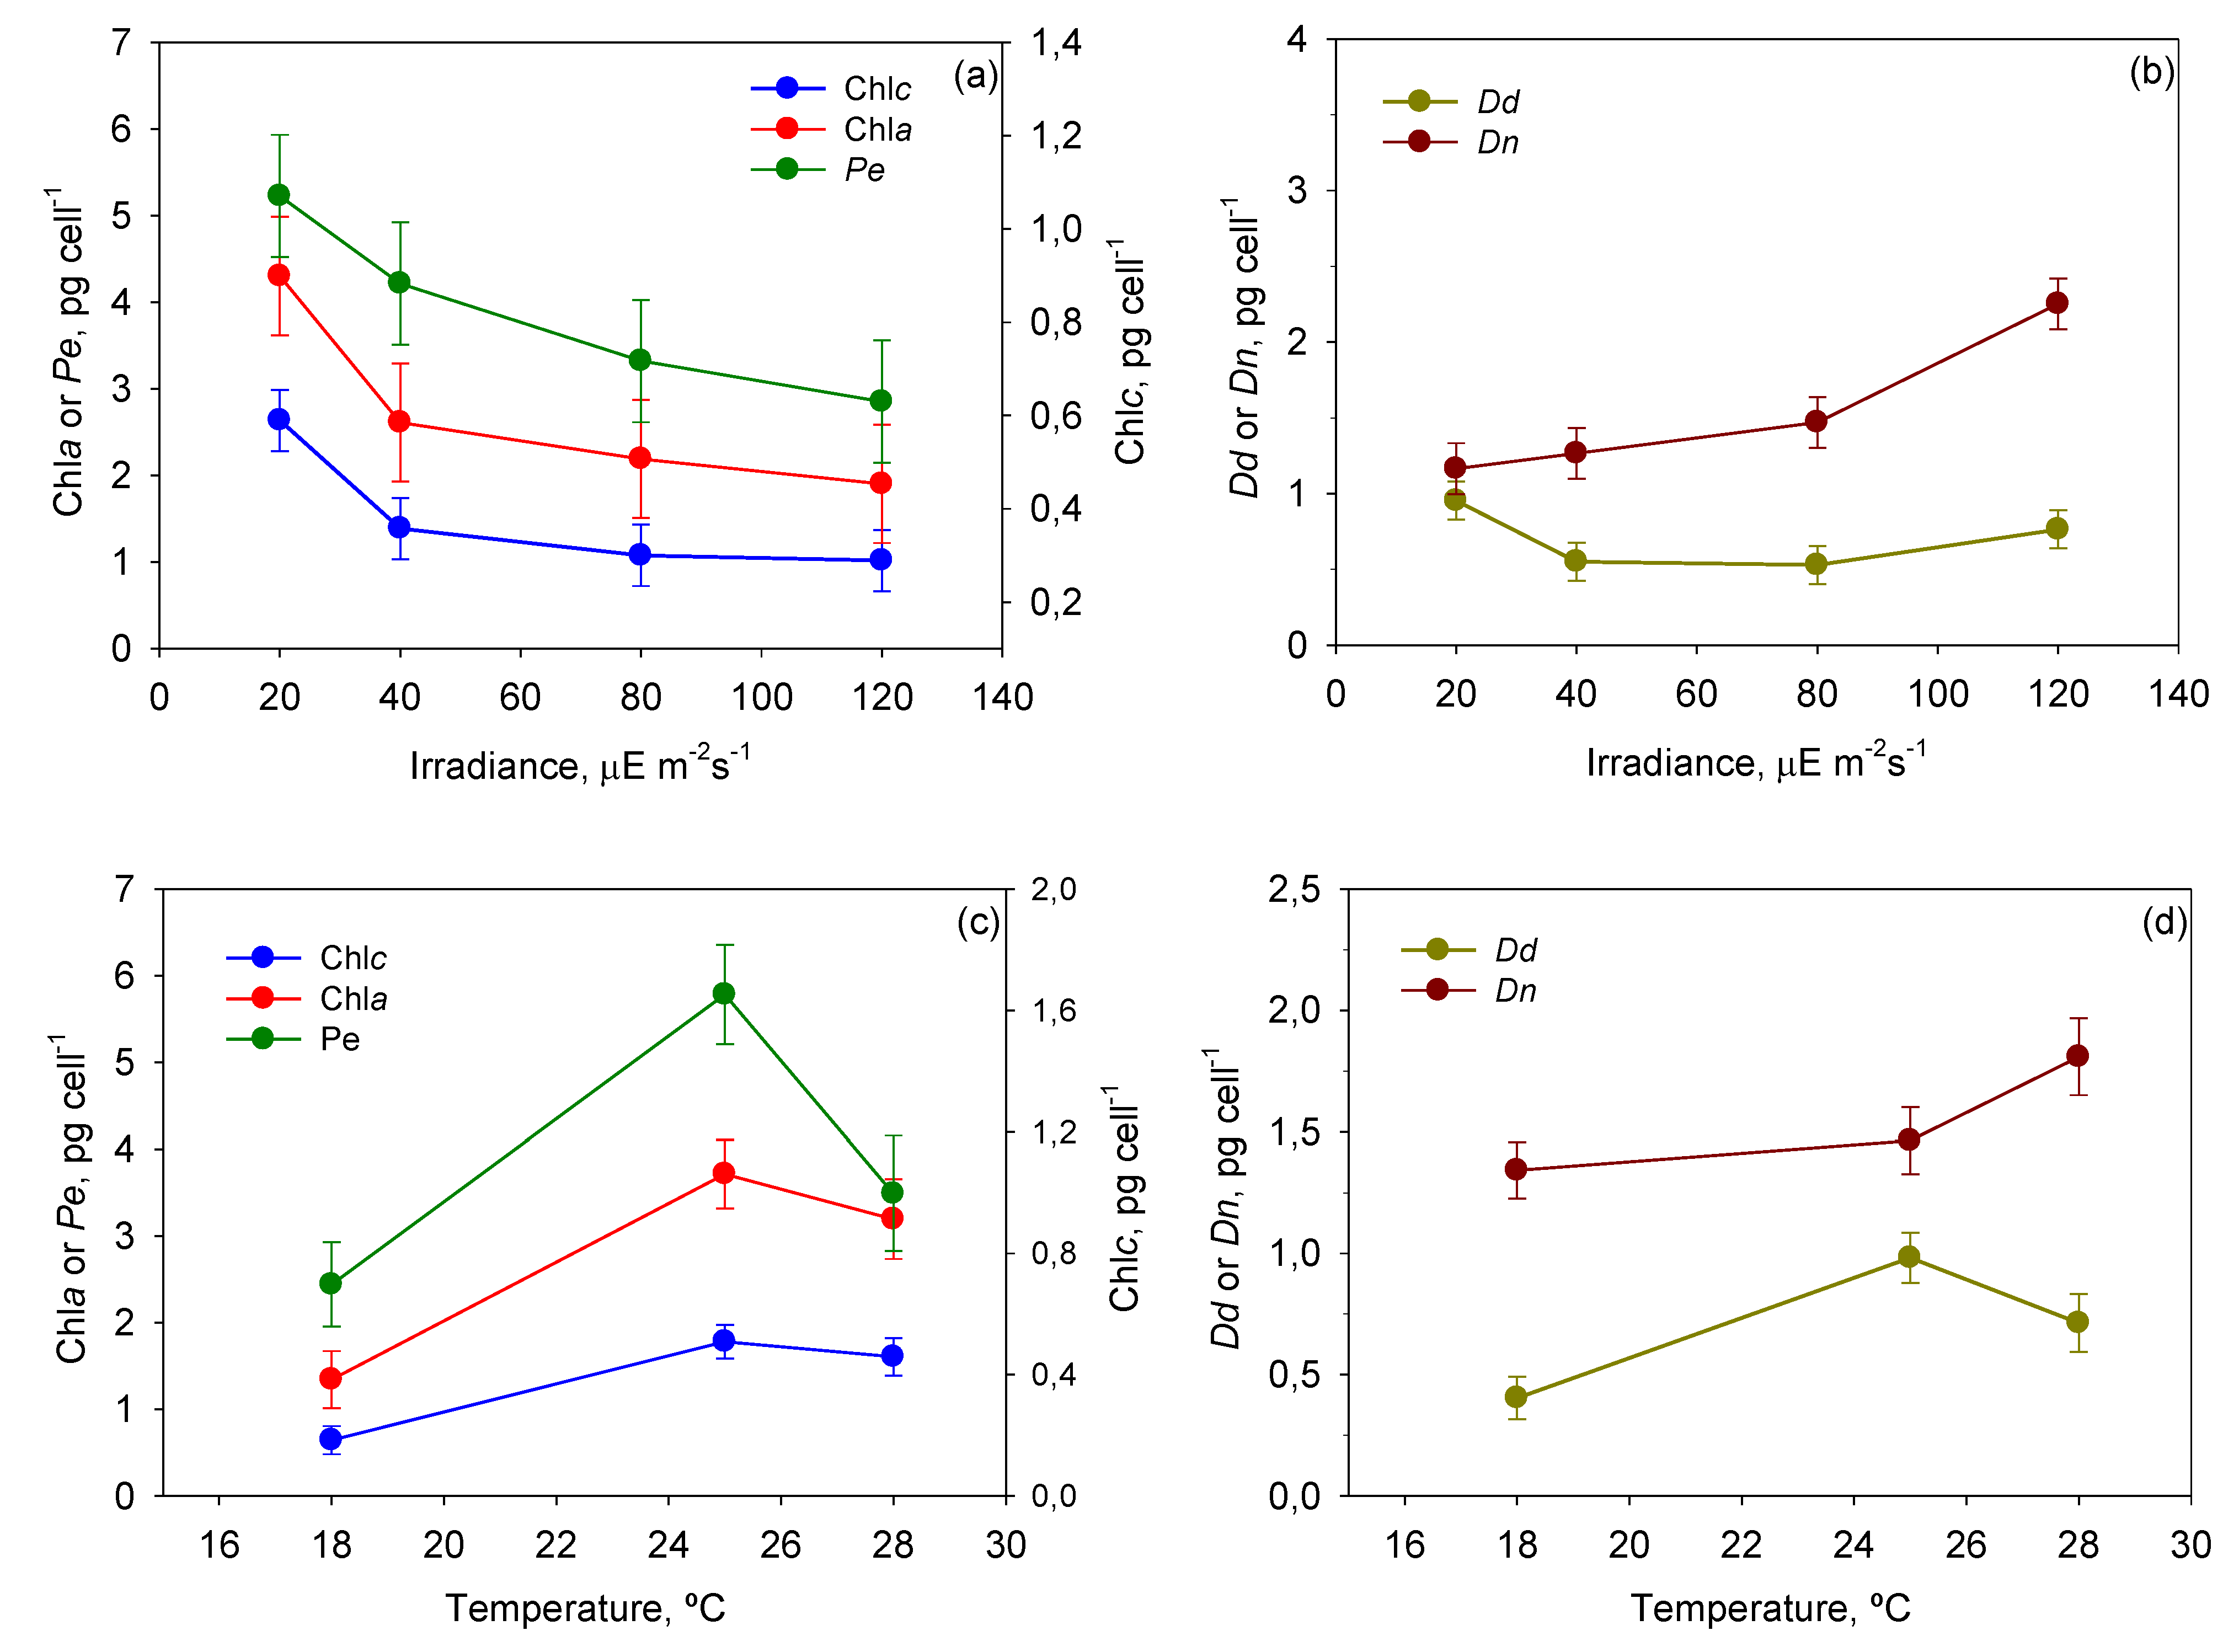
Figure 8 shows the mean cellular content of each pigment, provided by the ANOVA, as a function of
T and
I0. Photolimited cells (<40 µE·m
−2·s
−1) strongly increased the content of light-harvesting pigments such as chlorophylls and peridinin (
p < 0.05) in relation to photoinhibited cells (120 µE·m
−2·s
−1). The most visible change was the darkening of cells, which is observed in all photosynthetic microalgae grown under dim light [
38]. The same pigments decreased under high irradiance, resulting in cells being rather transparent. The opposite was observed with the photoprotective pigments of the xanthophyll cycle (
i.e., diadinoxanthin and dinoxanthin). Although
I0 had no statistically significant influence on
Dd, the pool of
Dn +
Dd did increase when cells were exposed to high irradiance levels. This augmentation was concomitant with the drop in
Fv/
Fm at irradiances above 40 µE·m
−2·s
−1 (see
Figure 4). This pattern is part of a vital mechanism of coping with excess irradiance by phototrophs that have been extensively described in microalgae over recent decades and is consistent with our results. Xanthophyll-cycle pigments are accumulated by the cells to increase thermal energy dissipation as photon harvesting rates exceed those required in photochemistry.
Figure 8.
Evaluation from the ANOVA of the effect of I0-T on the pigment profile of P. belizeanum. Every irradiance and temperature gathers all the results obtained for the three T and four I0 levels, respectively. Bars around points represent 95.0% confidence intervals based on Fisher’s least significant difference (LSD) procedure. Overlapping bars indicate no significant difference. (a) Effect of I0 on Chl a and Peridinin; (b) Effect of I0 on Dinoxanthin and Diadinoxanthin; (c) Effect of T on Chl a and Peridinin; (d) Effect of T on Dinoxanthin and Diadinoxanthin.
There are numerous studies, particularly with dinoflagellates, concerning the effect of temperature on the synthesis of pigments in microalgal cells [
39,
40,
41,
42,
43,
44]. In our study,
P. belizeanum increased its content of chlorophylls and carotenoids with temperatures up to 25 °C (
Figure 8c,d).
Dn quota continued to grow up to 28 °C (
p < 0.05), but peridinin and diadinoxanthin were exceptions under thermal stress at 28 °C. Their content decreased significantly (
p < 0.05), though always maintaining a value above that registered at the lowest temperature assayed (18 °C). The tendency of chlorophylls is in accordance with results previously reported for several microalgal species [
39,
40,
41,
42,
43], suggesting a common pattern of decrease in maximum rate of energy consumption with increasing temperature, as indicated by Carvalho
et al., [
45]. The tendency of the carotenoids may be partially explained by reactive oxygen species (ROS)-mediated stimulation of carotenogenesis as reported with
Haematococcus spp [
42]. However, the decrease in
Dd at the highest temperature (28 °C) is a particular phenomenon, which is only observable, as far as we know, in a few species of symbiotic dinoflagellates [
44]. The fundamentals lies on that an excessive ROS production due to elevated temperature, with or without high irradiance, may trigger the selective destruction of photosynthetic pigments by photo/thermal oxidative processes in symbiotic dinoflagellates [
46,
47]. Thus, the dinoflagellate
Symbiodinium is able to interconvert the pigments
Dd and diatoxanthin (
Dt) as part of a photoprotection process, which is vital to the prevention of ROS overproduction [
48]. More recently, it was observed in several symbiotic algae that elevated temperature/irradiance caused increased levels of
Dt in relation to the
Dd +
Dt pool due to the preferential destruction of
Dd, without a significant impact on chlorophyll
a [
44]. In our results, the role of dinoxanthin (
Dn) in
P. belizeanum at 28 °C (see
Figure 8c,d) seems to match that of the diatoxanthin in other dinoflagellates [
44]. Further research is, nevertheless, required in order to clarify this issue fully in non-symbiotic dinoflagellates.
2.4. Okadaic Acid Production
OA and analogues are secondary metabolites and therefore their synthesis is completely uncoupled from cell growth. They are mainly accumulated under long-term starvation. For this reason, determination of OA in cells was carried out in the stationary phase of growth. Cellular content of OA and its concentration in the broth were accordingly calculated and a multifactor ANOVA was performed (see
Table 3). Temperature had a statistically significant effect on both OA cell content and concentration (
p < 0.05), whereas the effect of irradiance on these responses was much less, proving irrelevant for OA concentration.
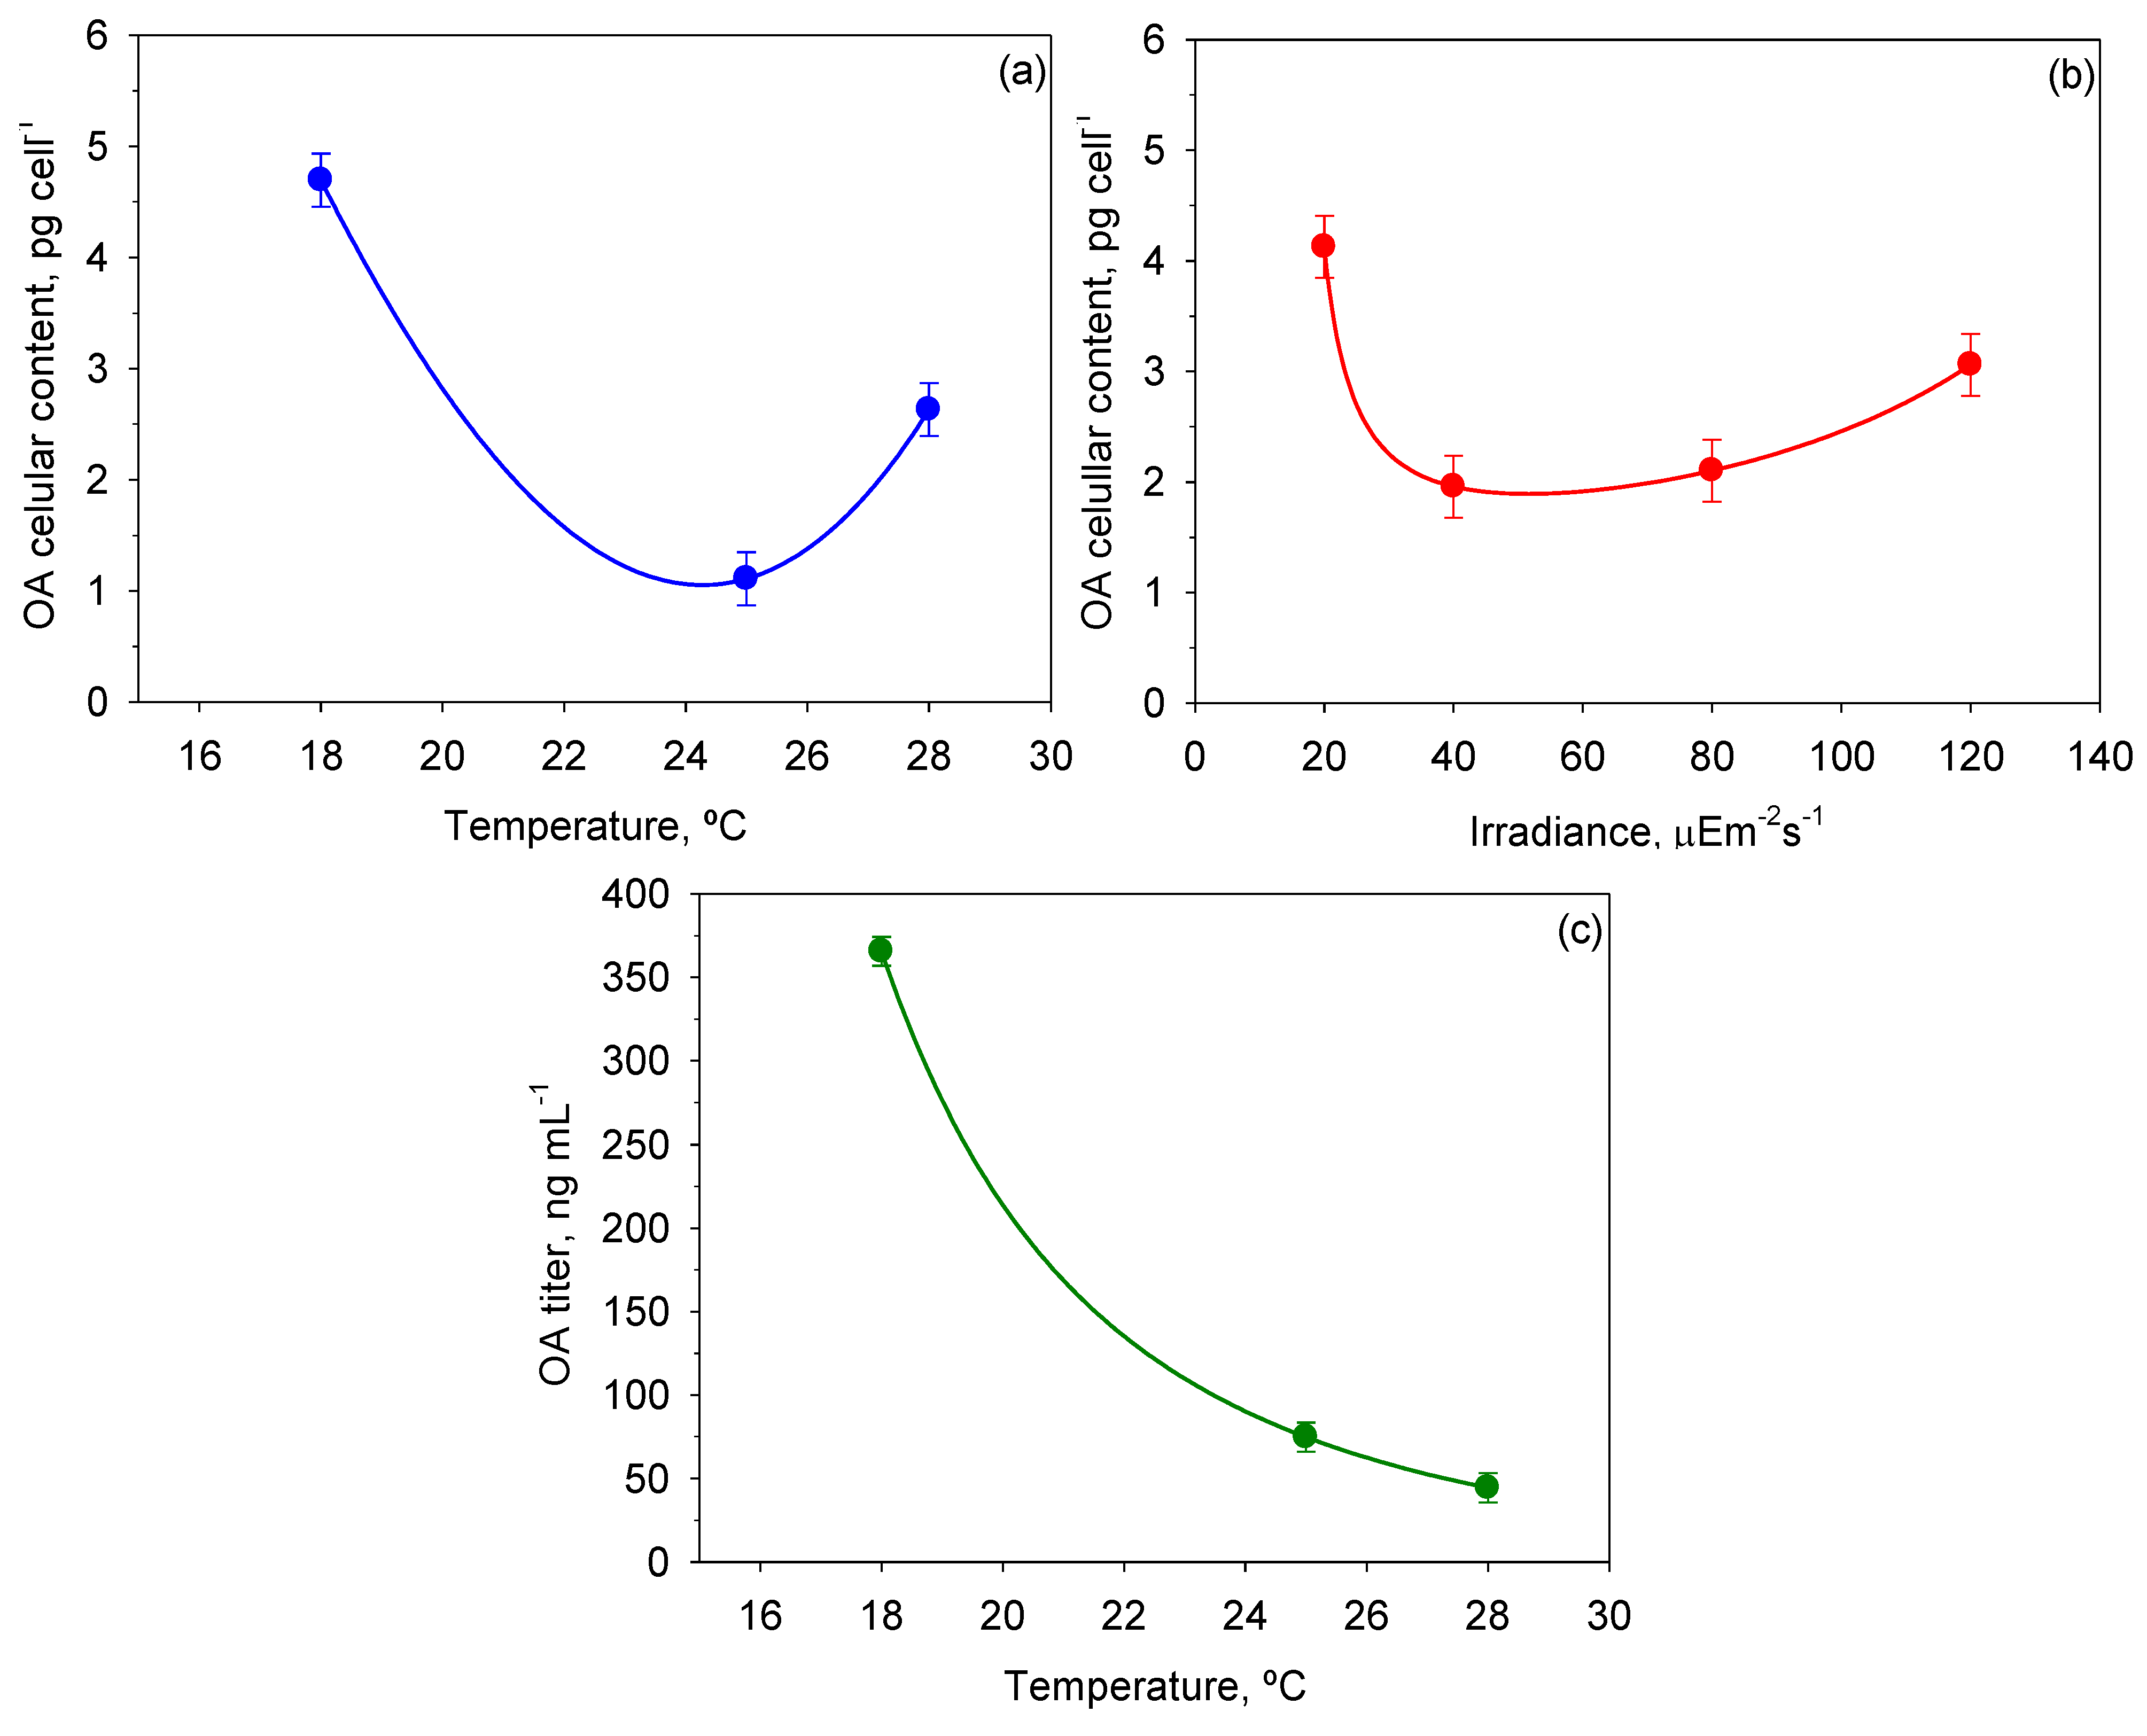
Figure 9 shows the mean OA cellular content and OA titer values reached for each
T and
I0 and the intervals around each mean value. Inspection of
Figure 9a indicates minimal accumulation of OA in cells at the optimal growth temperature, and maximum accumulation at the lowest temperature. According to
Figure 9b, only the lowest
I0 had a statistically significant influence on OA content in cells. On the other hand, the OA titer in the broth dropped abruptly with the temperature (see
Figure 9c). Thus, the maximum values of 6.85 ± 0.61 ng cell
−1 and 419.0 ± 12.2 ng mL
−1 for OA content per cell and OA titer, respectively, were obtained at 18 °C and 20 µE·m
−2·s
−1 (data not shown). OA production in
P. belizeanum seems to be a response to stressful environmental conditions, as the OA content increased in two different circumstances: (i) with both low
T and low
I0, when growth is limited; and (ii) with high
T, when growth is strongly inhibited. Presumably, synthesis of OA and other toxins in dinoflagellates may be an innate defence mechanism to suppress the growth of potential competitors [
49], which is accentuated when growth is acutely stressed.
Figure 9.
Effect of I0 and T on OA cellular content and okadaic acid (OA) titer in cultures of P. belizeanum. Every irradiance and temperature gathers all the results obtained for the three T and four I0 levels, respectively. Bars around points represent 95.0% confidence intervals based on Fisher’s least significant difference (LSD) procedure. Overlapping bars indicate no significant difference. (a) Effect of T on OA cellular content; (b) Effect of I0 on OA cellular content; (c) Effect of T on OA titer.
The above-described pattern partially resembles the observations reported for other species of the genus
Prorocentrum [
50]. Apparently,
P. belizeanum produced less OA than others of the same genus. OA cellular contents have been reported to range from 0.5 pg cell
−1 to 192 pg cell
−1, though large variability due to environmental factors is reported [
50]. However, the importance of this strain does not lie solely in the production of OA; OA analogues (lipophilic dinophysistoxins (DTX1–3) and the water-soluble derivatives (DTX4 and DTX5a–c)) and linear polycyclic compounds and macrolides (e.g., corozalic acid, belizeanolide, belizeanic acid) are also of great interest [
7,
8,
9,
10,
11,
12]. Unfortunately, the monitoring of the synthesis of these metabolites in culture is not possible, since the corresponding reference standards are not commercially available, and/or a routine laboratory-scale methodology for determining them has not been reported. Meanwhile, the determination of OA can serve as a reference for the other analogues and polyketides. The rationale for this lies in recent evidence, comprehensively reported by Hu (2010), on the biosynthetic origin and bioactivity of OA analogues [
13]. Although different
Prorocentrum species can produce a great variety of different OA derivatives with different substituents or conformational change on their skeleton [
13], these toxins seem to be biosynthesized via a polyketide pathway shared with OA. Therefore, the more than forty compounds identified to date from a reduced number of species of the genus
Prorocentrum [
13] may be indirectly monitored in culture through the determination of OA. This approach would have a clear benefit, since it would allow the planning of inexpensive experiments aimed to optimize culture conditions for enhancing the production of the toxins. Large-scale cultures could then be designed to obtain sufficient amounts of compound to carry out all the necessary studies. Nonetheless, a possible metabolic inter-conversion between toxins due to the effect of culture conditions should be taken into account in subsequent studies, because it can induce different ratios of OA and other analogues. This was the case of
Prorocentrum lima with OA and methyl-okadaic acid [
50].
2.5. Implications in Massive Culture
Dinoflagellates and their toxins are generally hazardous if inhaled or ingested. Safety issues merit special attention when producing dinoflagellates and toxins thereof, even more so as the scale of operation increases. A comprehensive safety management plan is necessary for any commercial facility producing or processing biotoxins [
1]. If producer species are photosynthetic, the costs of implementation of that plan can be greatly reduced because they may be grown in closed photobioreactors under outdoor conditions. However, excessive irradiance can be detrimental for cells.
At irradiances beyond the maximum regions represented in
Figure 3a and
Figure 4a, PSII can be strongly photoinhibited, so bioproductivity will decrease rapidly as
I0 is further raised. Therefore the previous determination of the photoinhibition threshold of any photosynthetic microalgal species is crucial to the reliable design of an outdoor culture system. The tolerance to light flux of
P. belizeanum was extremely low (around 50 µE·m
−2·s
−1), indicating that it is a light-sensitive species. Other microalgal species successfully grown in outdoor conditions could stand the local irradiance levels that occur in moderately sunny areas of the planet (e.g., up to 3000 µE·m
−2·s
−1 in Southeast Spain). Consequently, photobioreactors for growing them must be modified accordingly to prevent photoinhibition and to optimize the photosynthetic efficiency of the cells. Among the diverse strategies that may be devised to address this issue, the following may be mentioned aimed at attenuating the incident radiation on the surface of the photobioreactor: (i) covering the photobioreactor with meshes of different density depending on the degree of required illumination reduction; (ii) using dyed material for the construction of the photobioreactor (dyes should be carefully selected to avoid distortions in the spectrum of the photosynthetically active radiation (PAR)); or (iii) increasing the height of the column of water that circulates over the surface where the cells are attached. Not all dinoflagellates are equally sensitive to light; intra- and inter-specific differences exist [
5,
51]. Therefore, if a product can be sourced from multiple species, the selection of a more resistant species to outdoor culture conditions may have important advantages for large-scale production. Enhancements in the concentration of a target compound may also be made by improving the producer strain through genetic modification. Unfortunately, the molecular genetics of the biosynthesis of dinoflagellate toxins is poorly understood, though progress is being made and discussed [
3].
According to the results presented here, synthesis of OA (and probably derivates thereof) in
P. belizeanum seems to be stimulated under stressful temperature and/or illumination conditions. In a hypothetical outdoor culture, cells would be exposed to daily changes in irradiance and temperature. By properly controlling these two factors over time, we may culture
P. belizeanum in a two-step process to increase the OA yield (
i.e., cyclically alternating a period of optimal culture conditions with one of stressful conditions in which a part of the biomass is harvested to recover OA and the other is left in the photobiorreactor to begin a new cycle).
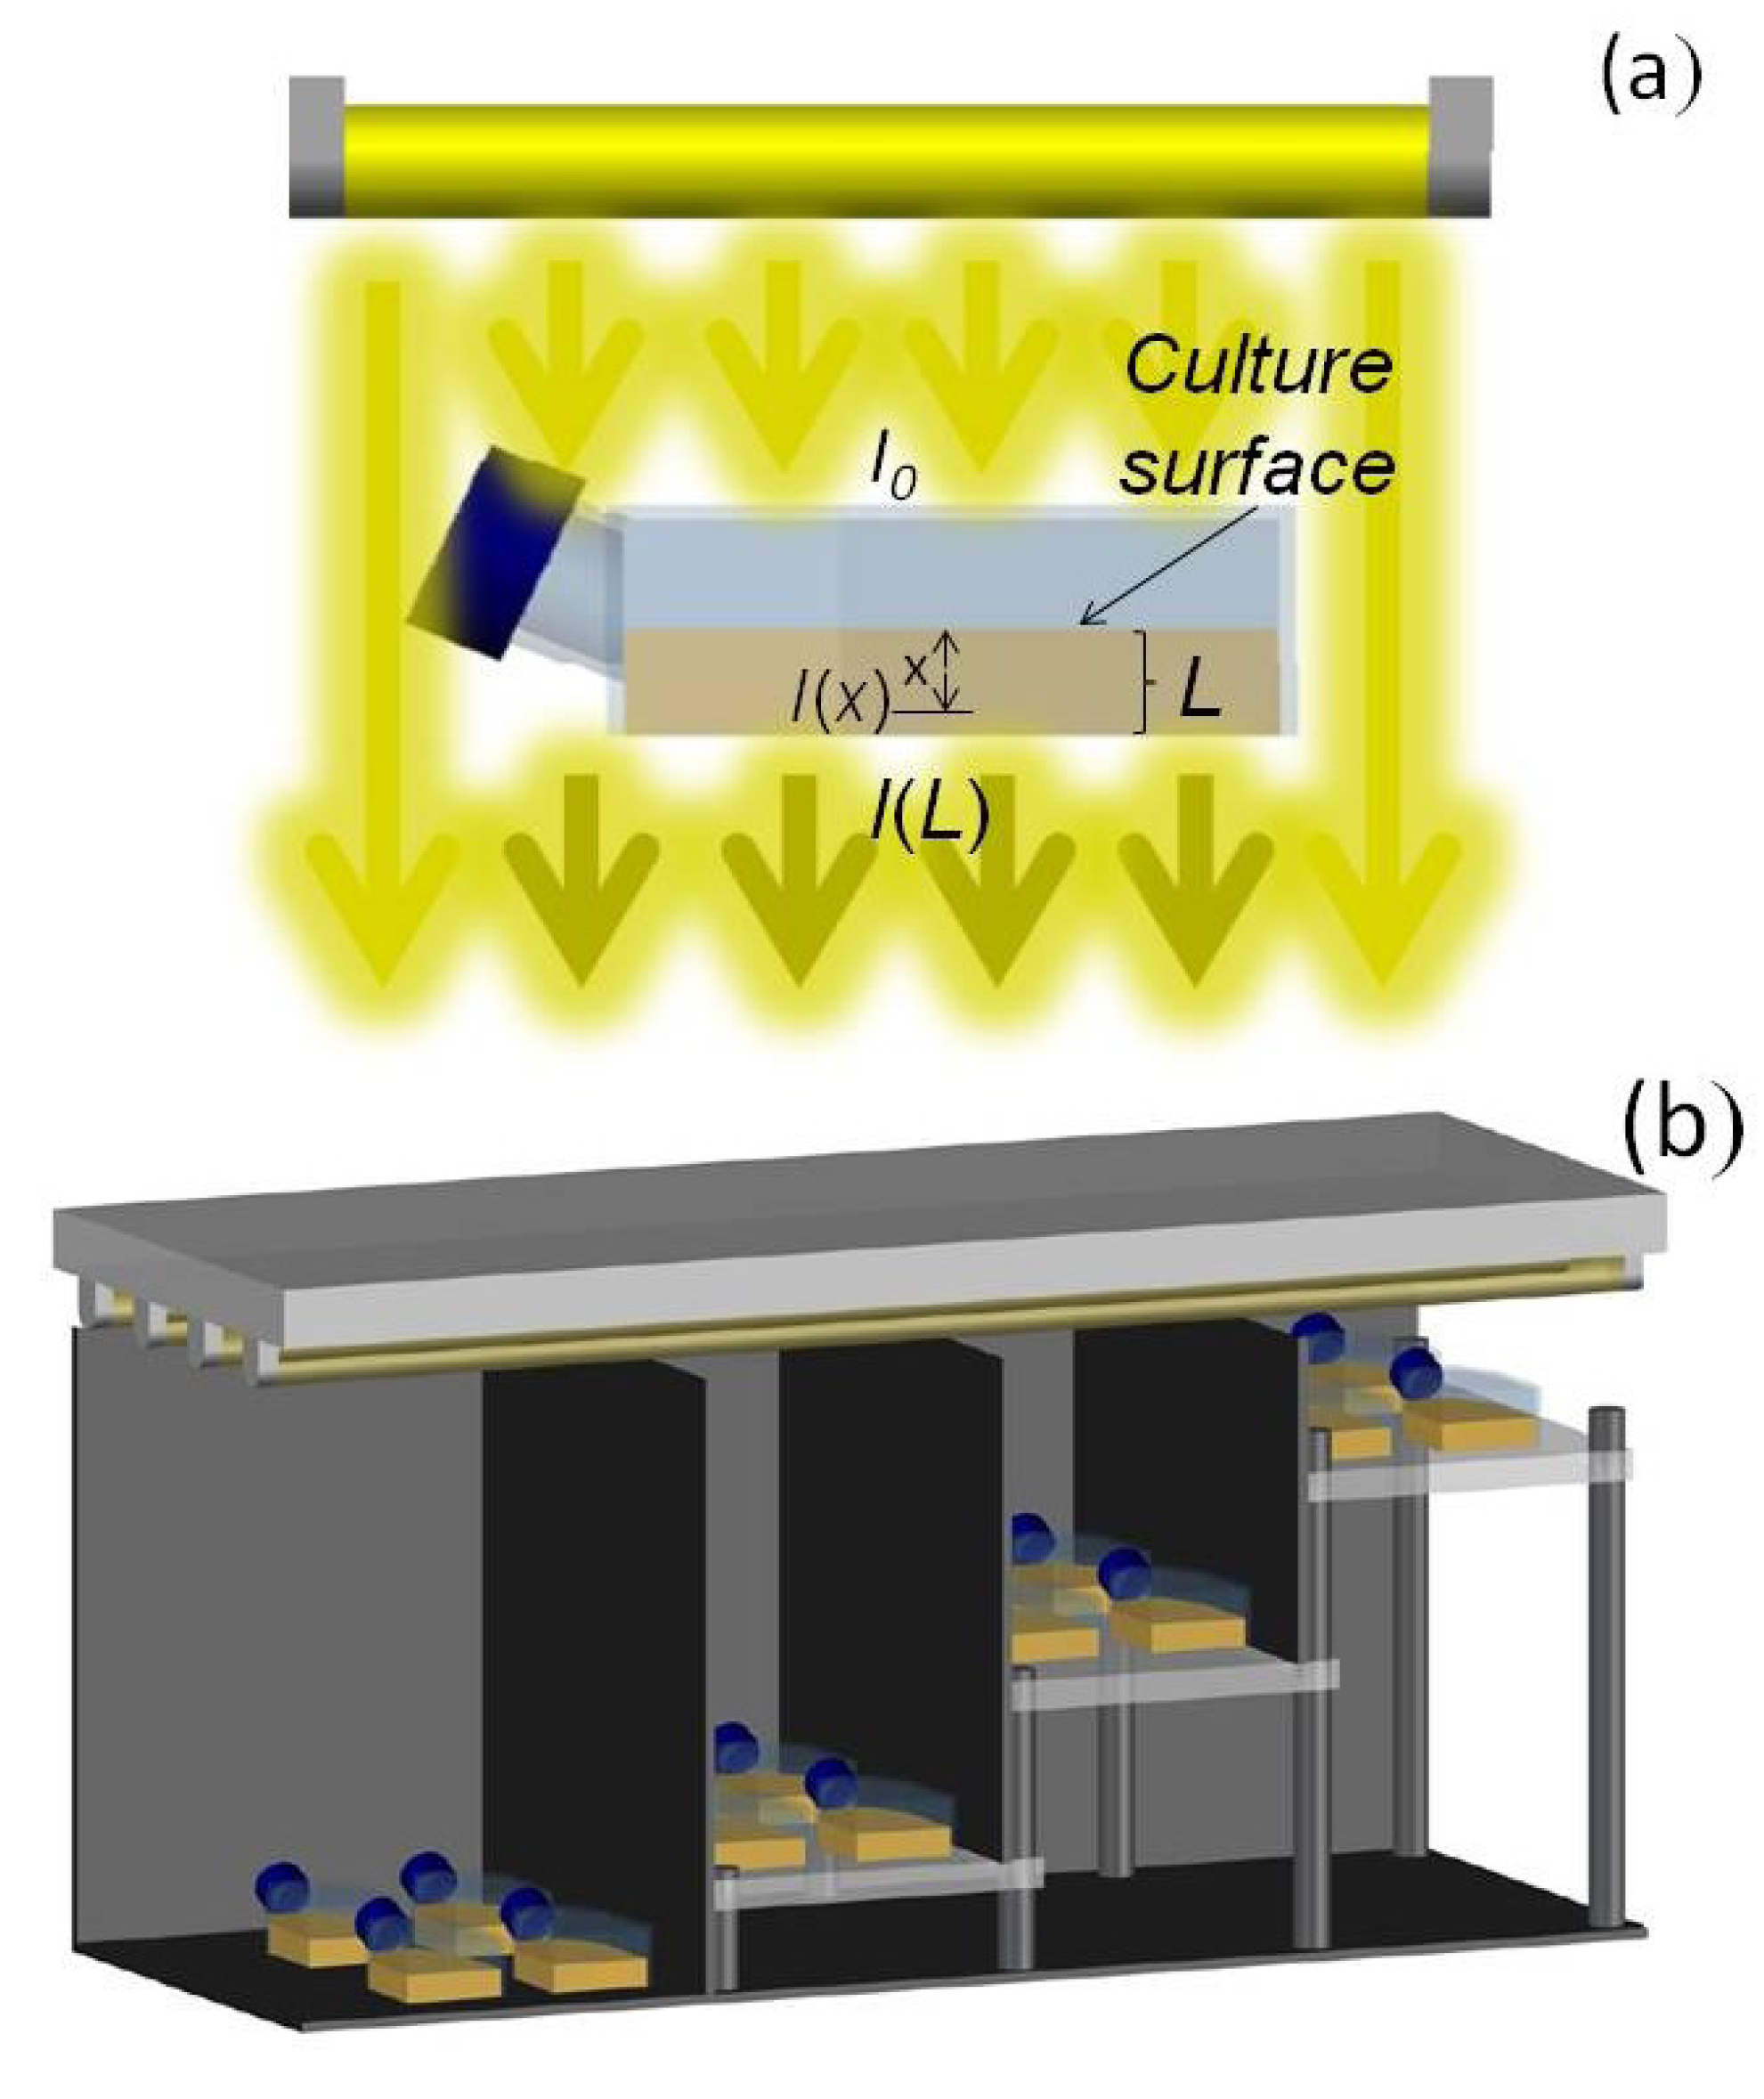
Figure 10 shows photographs of a rudimentary bench-scale outdoor culture with
P. belizeanum operated in batch mode. The culture system consisted of plastic bags covered by a mesh during the midday to reduce the irradiance at the surface of the culture to below 80 µE·m
−2·s
−1. Temperature was controlled around 18 °C. Outdoor culture reached 25,000 cells·mL
−1 after 10 days. The results were consistent with the experiments performed in T-flask at the same temperature and similar irradiance (see
Figure 1d). From that day, the culture was partially uncovered, reaching irradiance levels of up to 320 µE·m
−2·s
−1 on the bag surface. The cells were strongly photoinhibited and in the course of the next 10 days over 50% of the cells died.
Figure 10.
Photographs of an unsophisticated bench-scale outdoor culture for testing photoinhibition of P. belizeanum under solar illumination.
Figure 10.
Photographs of an unsophisticated bench-scale outdoor culture for testing photoinhibition of P. belizeanum under solar illumination.


