Figure 1.
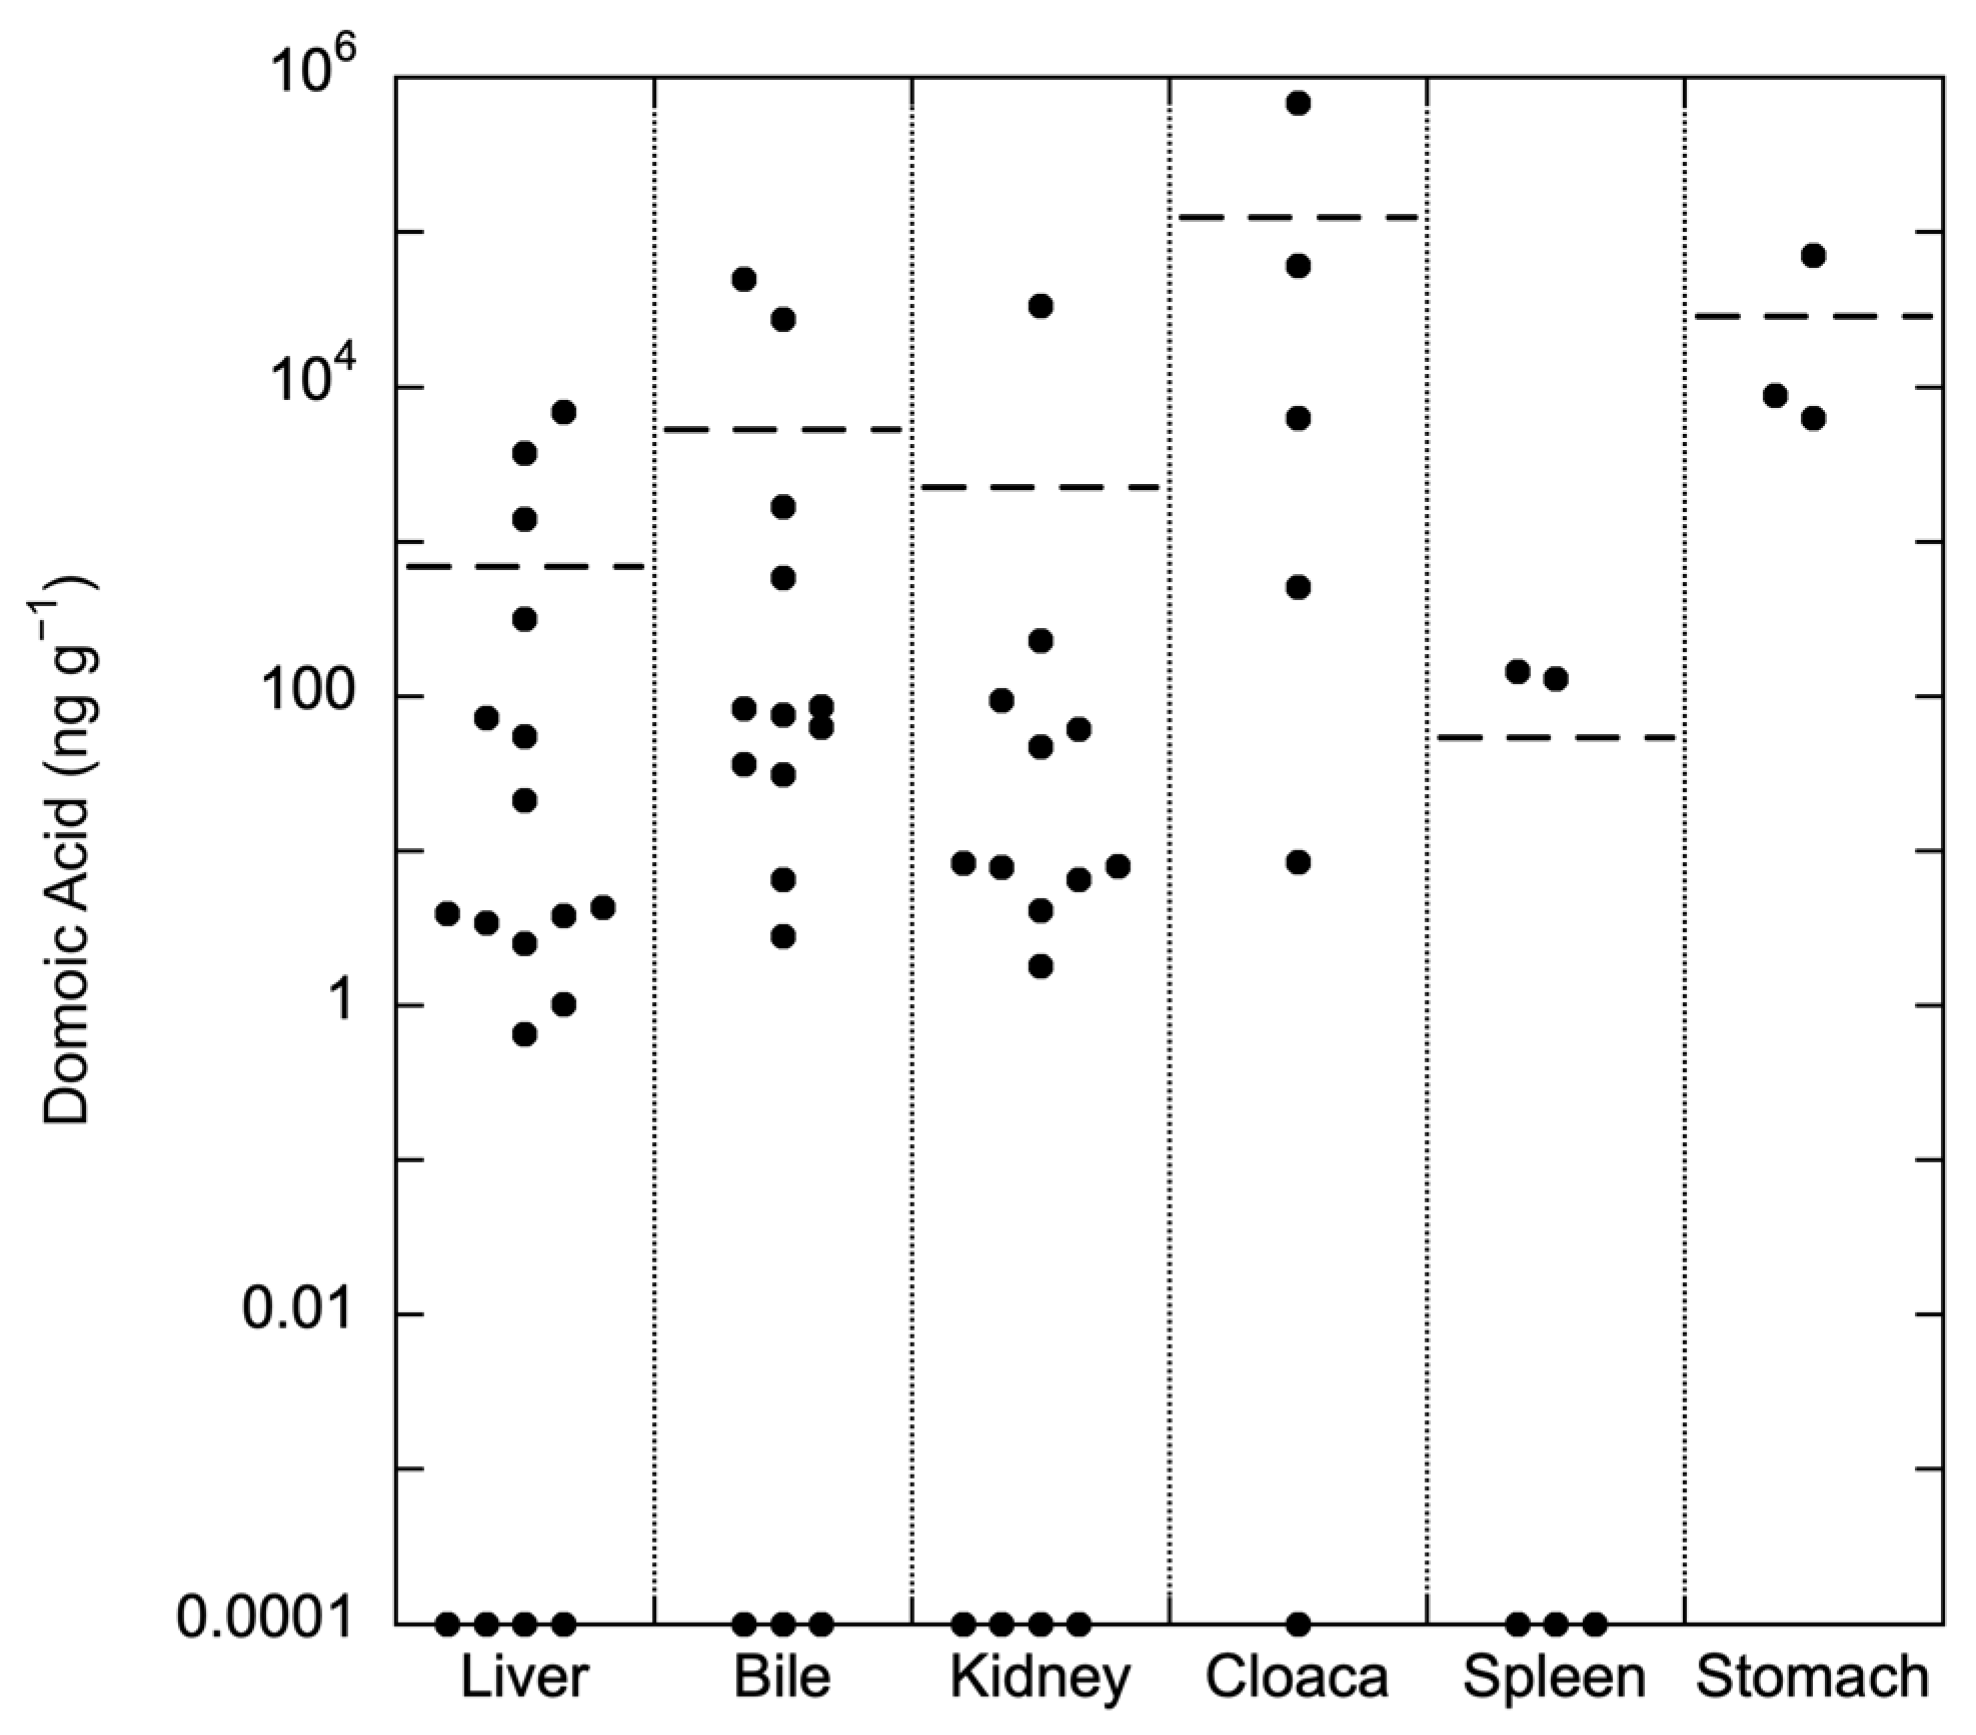
DA in organ samples of loons impacted by the 2017 mortality event. Mean values are represented by horizontal dashed lines and include zero values. DA (ng g−1) is plotted on a log scale.
Figure 1.
DA in organ samples of loons impacted by the 2017 mortality event. Mean values are represented by horizontal dashed lines and include zero values. DA (ng g−1) is plotted on a log scale.
Figure 2.
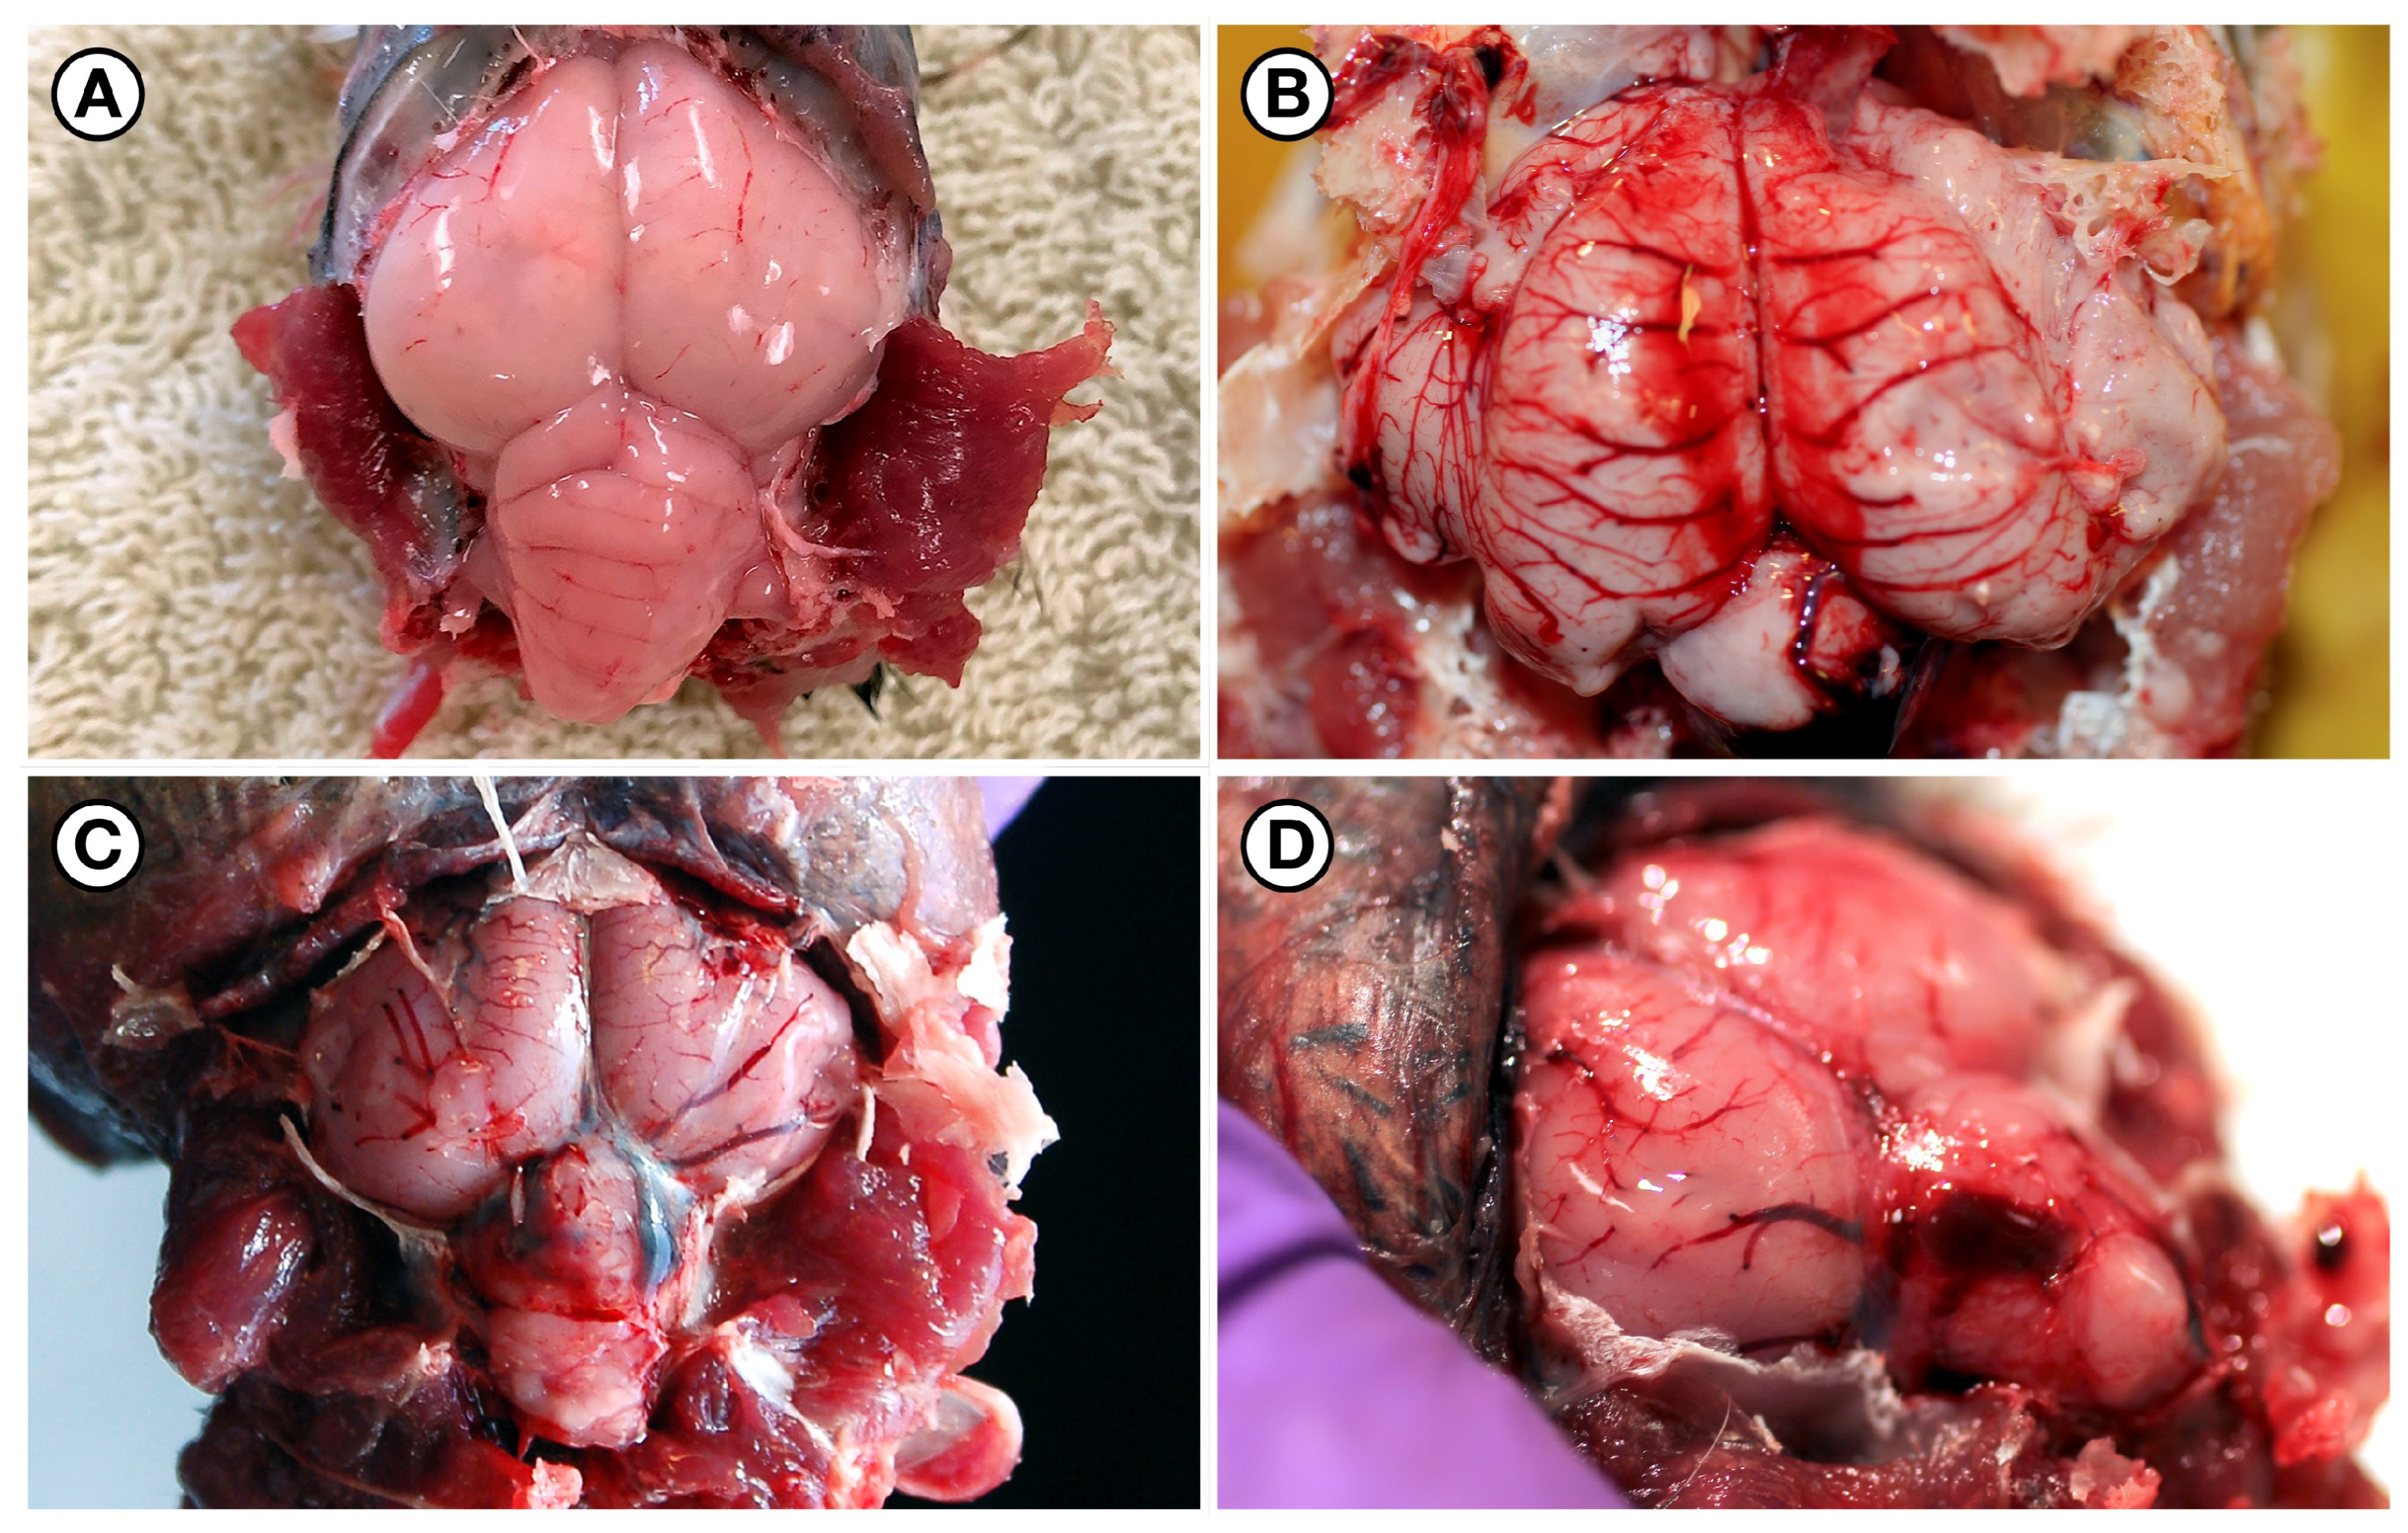
Diffuse moderate to marked vascular congestion and venous engorgement was common in birds with acute fatal DA toxicosis. (A) Normal brain from a negative control COLO (IBR 23-1238; shown for reference). (B) Brain from a BRPE (15-0100; Pelecanus occidentalis) that died due to acute fatal DA toxicosis (positive control). Severe diffuse brain and meningeal congestion and possible bilaterally symmetrical meningeal hemorrhage were visible along the dorsomedial aspect of both cerebral hemispheres, along with focal venous engorgement of the dorsal cerebellum. (C) Brain from a PALO (17-0086) that died due to acute fatal DA toxicosis. Severe diffuse brain and meningeal congestion were accompanied by cerebellar venous engorgement. (D) Severe diffuse brain and meningeal congestion and focal venous engorgement in another RTLO (17-0085) with acute, fatal DA toxicosis.
Figure 2.
Diffuse moderate to marked vascular congestion and venous engorgement was common in birds with acute fatal DA toxicosis. (A) Normal brain from a negative control COLO (IBR 23-1238; shown for reference). (B) Brain from a BRPE (15-0100; Pelecanus occidentalis) that died due to acute fatal DA toxicosis (positive control). Severe diffuse brain and meningeal congestion and possible bilaterally symmetrical meningeal hemorrhage were visible along the dorsomedial aspect of both cerebral hemispheres, along with focal venous engorgement of the dorsal cerebellum. (C) Brain from a PALO (17-0086) that died due to acute fatal DA toxicosis. Severe diffuse brain and meningeal congestion were accompanied by cerebellar venous engorgement. (D) Severe diffuse brain and meningeal congestion and focal venous engorgement in another RTLO (17-0085) with acute, fatal DA toxicosis.
Figure 3.
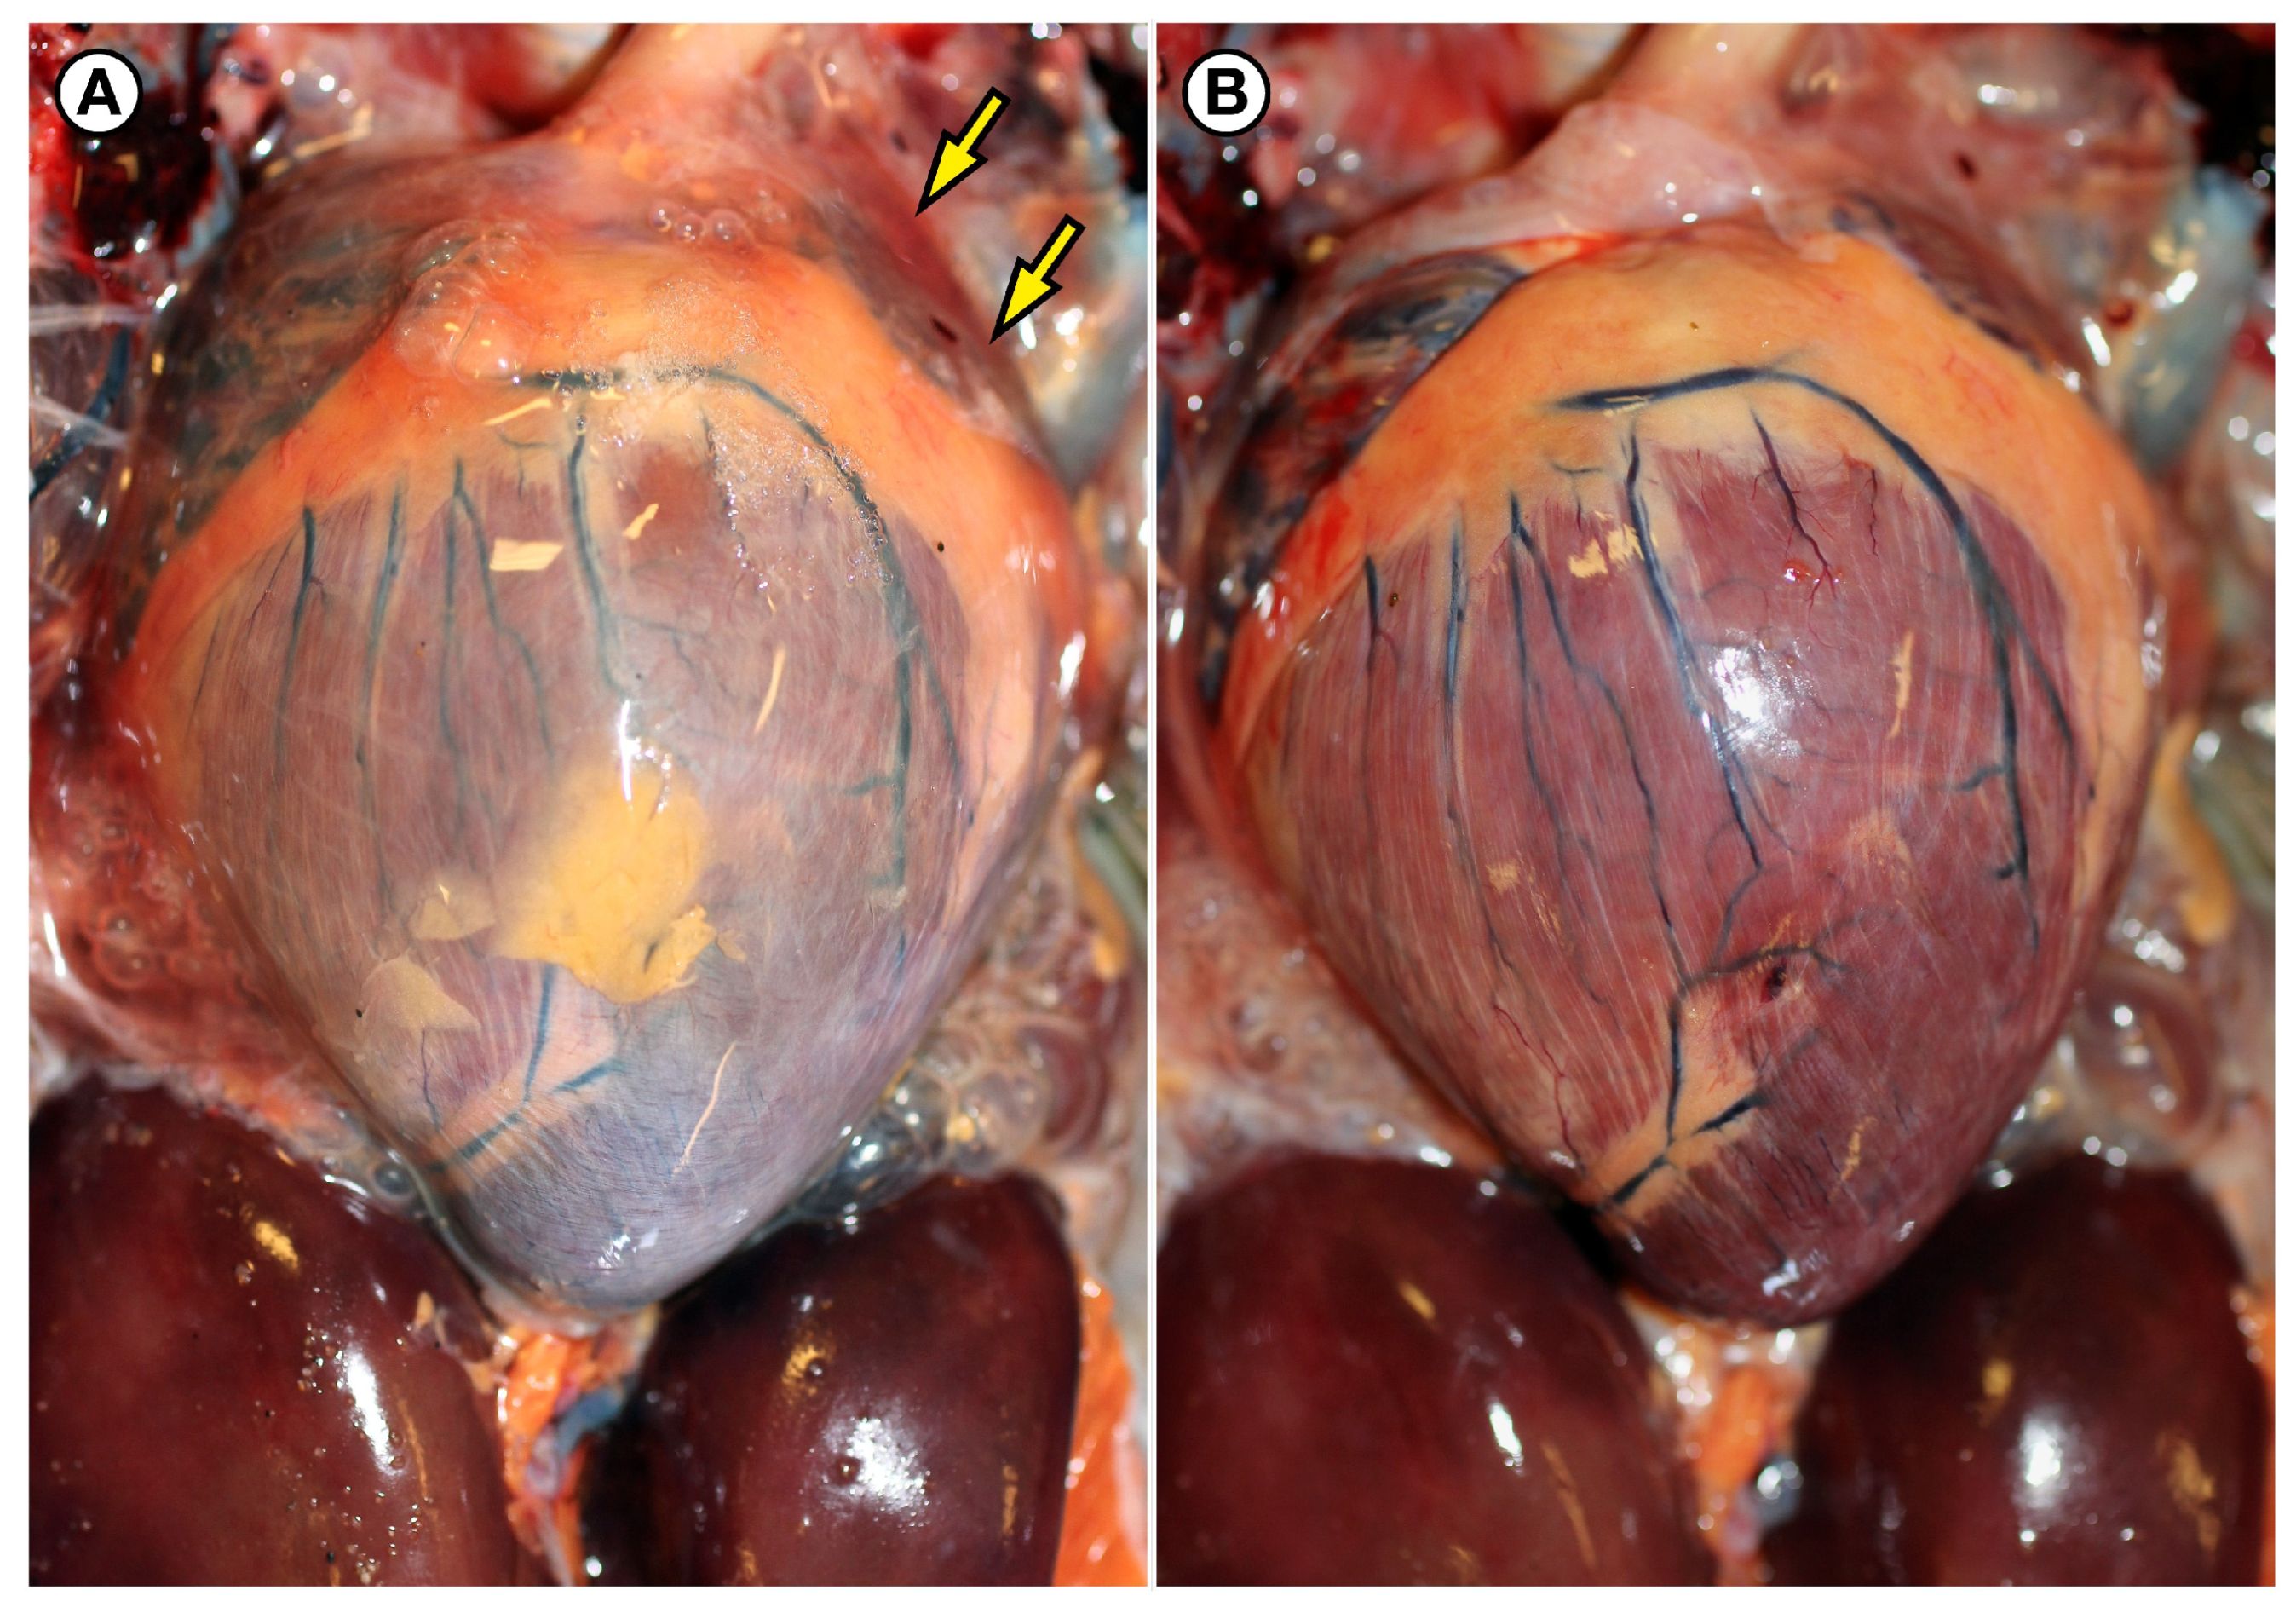
Similarly to DA-exposed marine mammals, birds dying from acute, fatal DA toxicosis presented with subtle cardiovascular pathology. (A) Heart from a BRPE (15-0100) that was found dead with serous pericardial effusion, characterized by mild distension of the pericardial sac with red-tinged, serous fluid (arrows) that contained 11,000 ng g−1 DA. (B) Heart from the same BRPE (15-0100) after the pericardial sac was removed. The ventricular myocardium was slightly pale and congested, and the heart was mildly distended with blood.
Figure 3.
Similarly to DA-exposed marine mammals, birds dying from acute, fatal DA toxicosis presented with subtle cardiovascular pathology. (A) Heart from a BRPE (15-0100) that was found dead with serous pericardial effusion, characterized by mild distension of the pericardial sac with red-tinged, serous fluid (arrows) that contained 11,000 ng g−1 DA. (B) Heart from the same BRPE (15-0100) after the pericardial sac was removed. The ventricular myocardium was slightly pale and congested, and the heart was mildly distended with blood.
Figure 4.
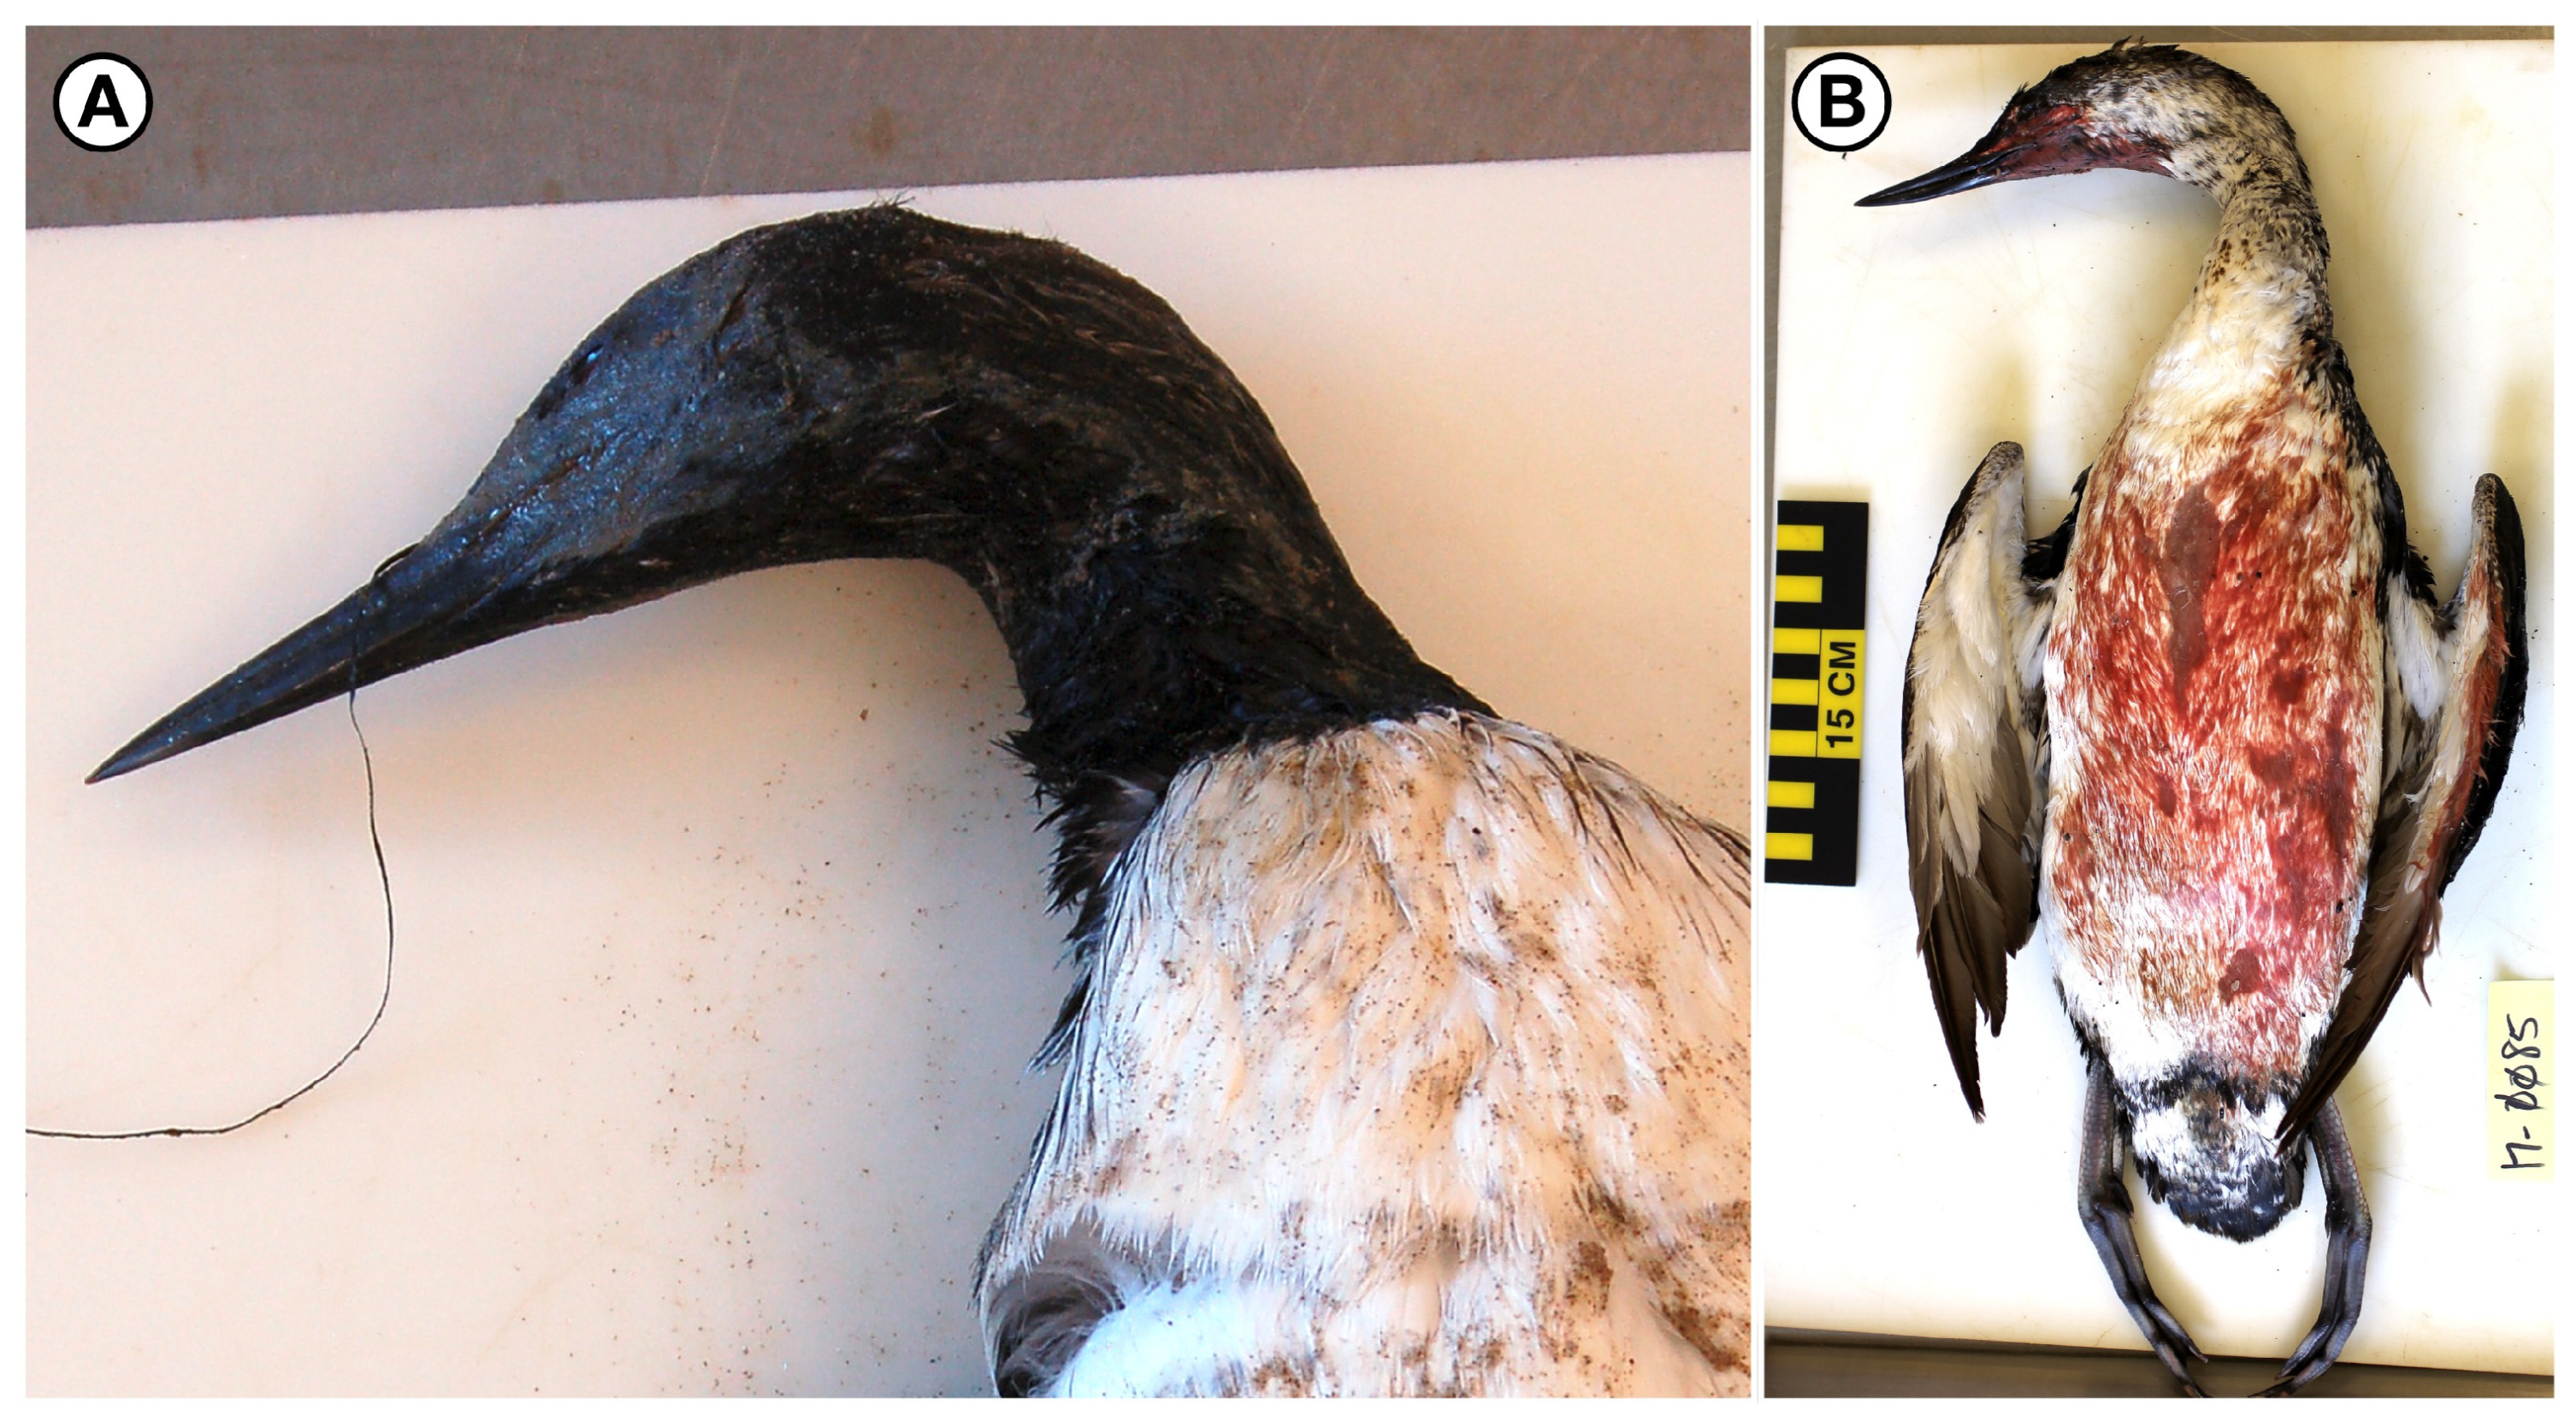
Regurgitation, hypersalivation, or potential enhanced respiratory secretions were common in birds with acute fatal DA toxicosis. (A) PALO (17-0086) found dead during a mass-mortality event with very high concentrations of DA in the GI content, tissues and body fluids. Dried digesta coated feathers around the mouth and down the neck. (B) RTLO (17-0085) found dead during a mass-mortality event with very high concentrations of DA in the GI content, tissues and body fluids. Bloody fluid coated feathers around the mouth, neck, and ventrum.
Figure 4.
Regurgitation, hypersalivation, or potential enhanced respiratory secretions were common in birds with acute fatal DA toxicosis. (A) PALO (17-0086) found dead during a mass-mortality event with very high concentrations of DA in the GI content, tissues and body fluids. Dried digesta coated feathers around the mouth and down the neck. (B) RTLO (17-0085) found dead during a mass-mortality event with very high concentrations of DA in the GI content, tissues and body fluids. Bloody fluid coated feathers around the mouth, neck, and ventrum.
Figure 5.
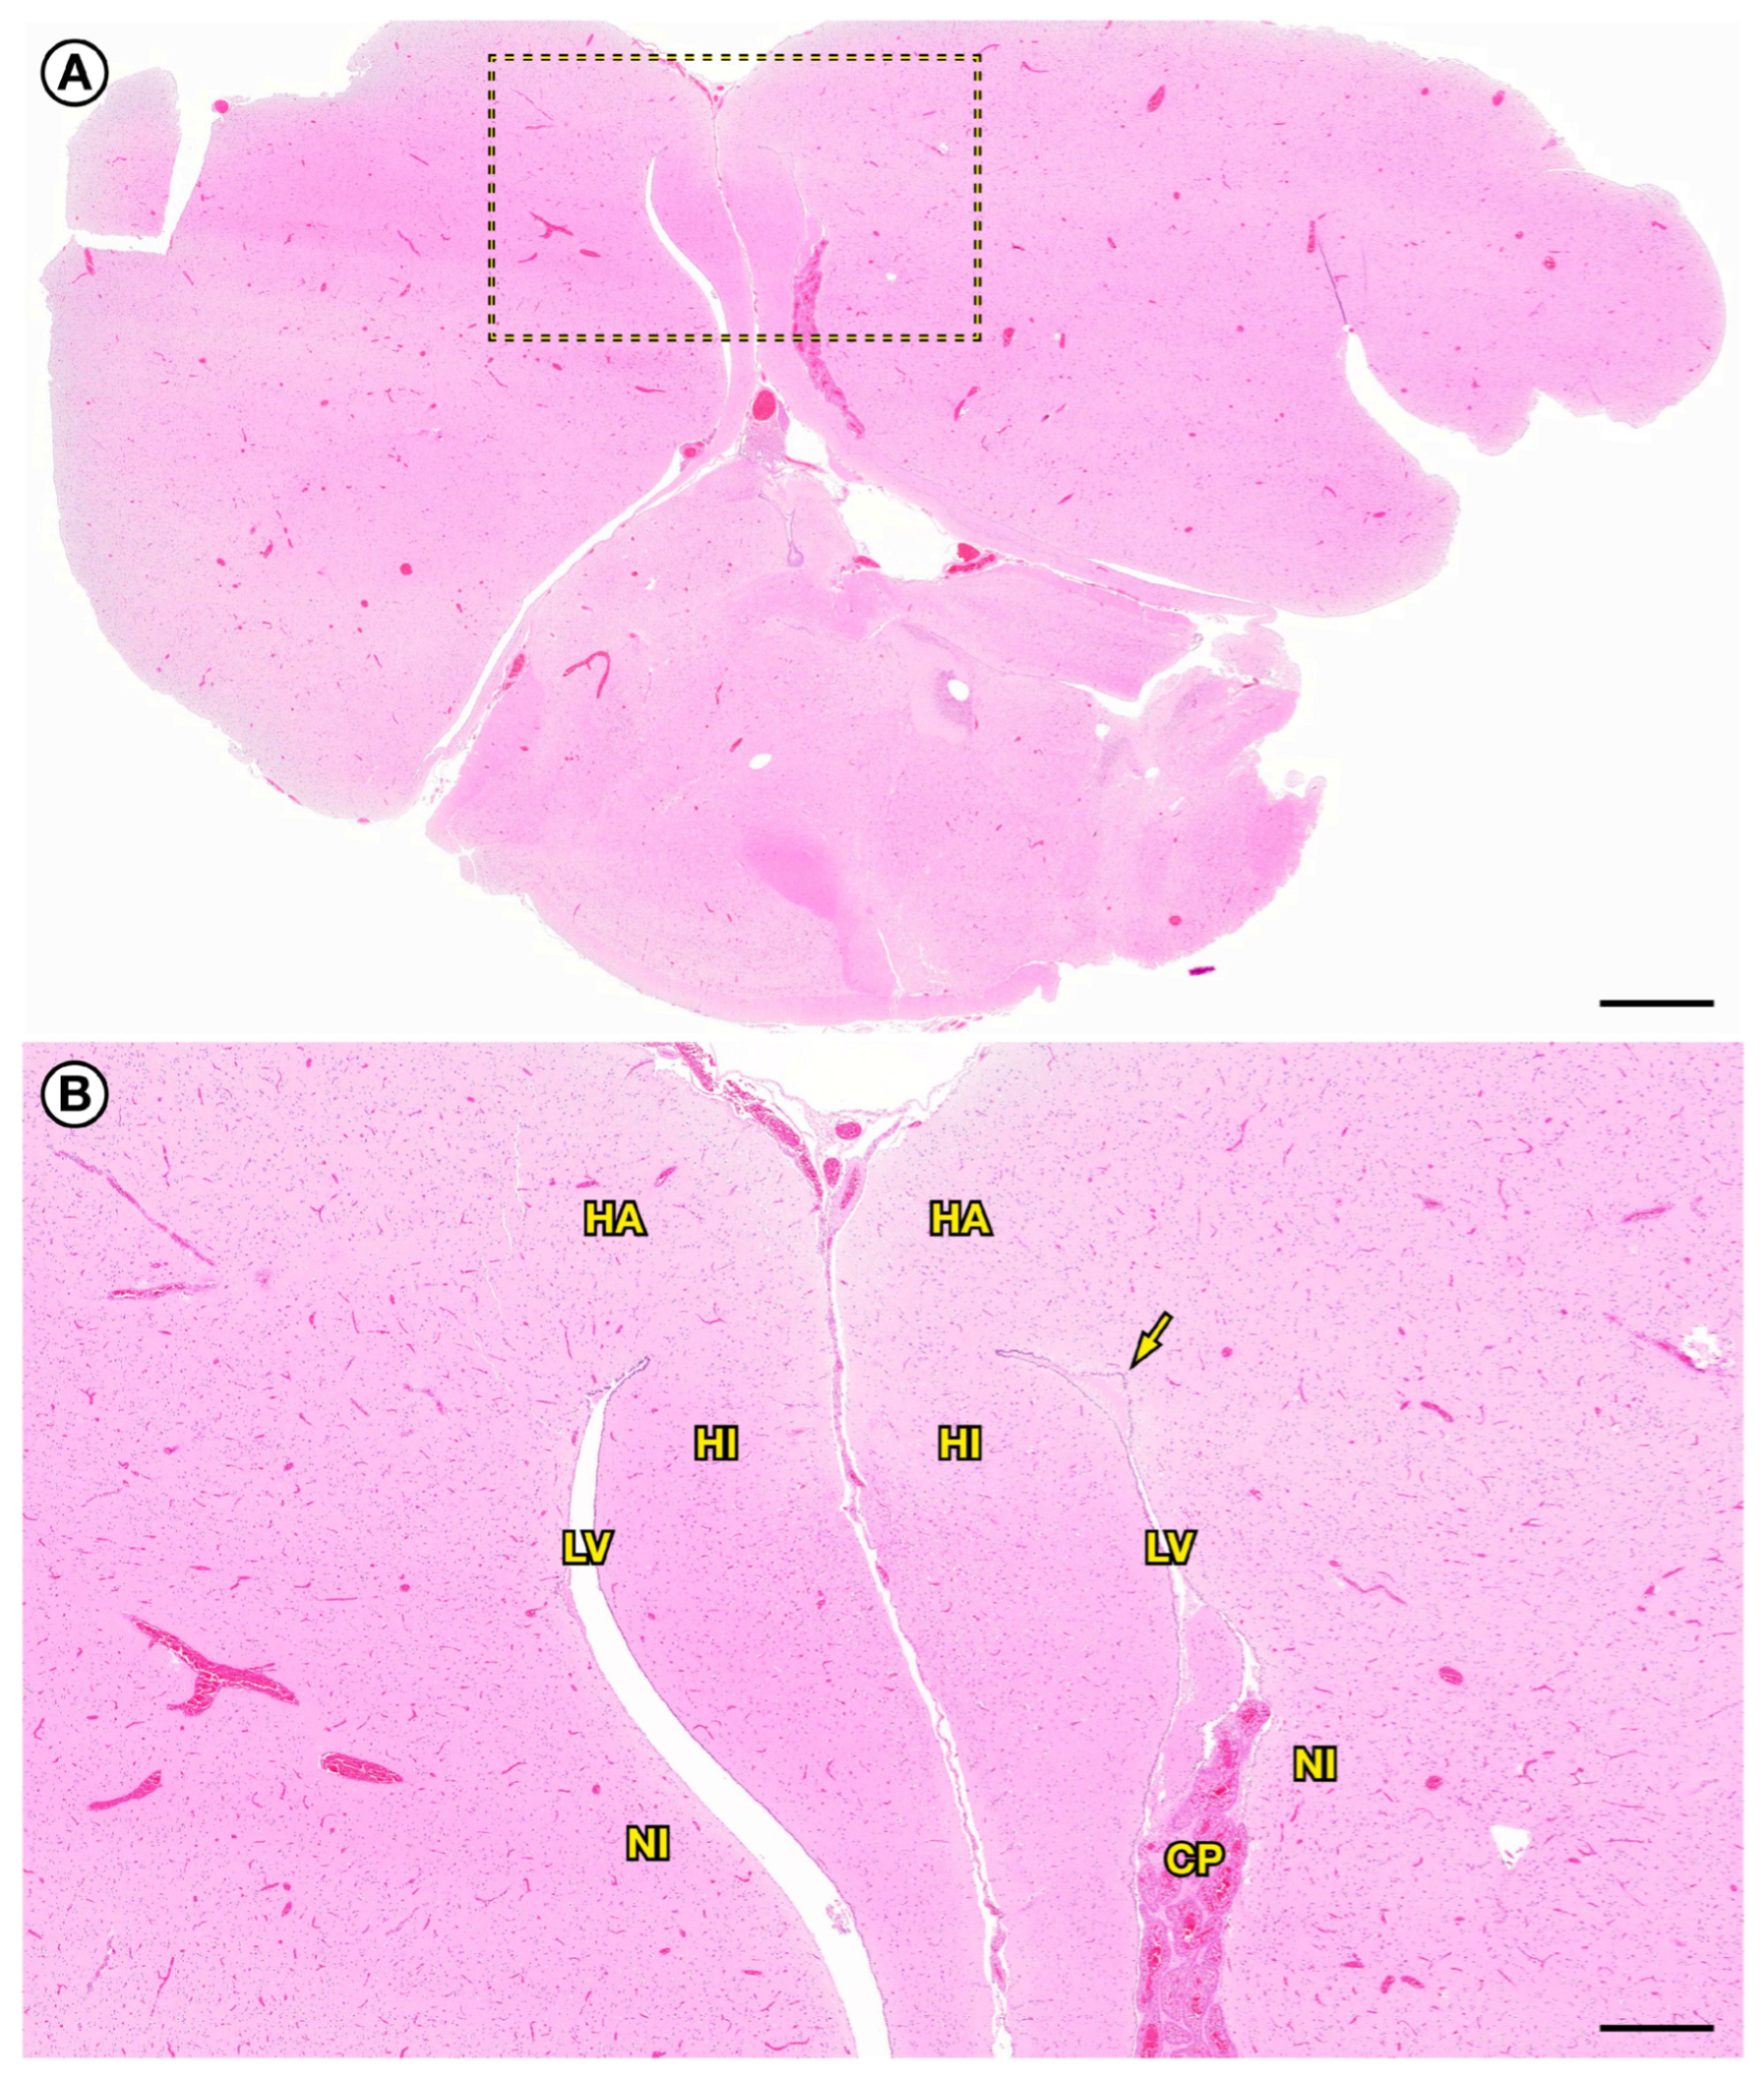
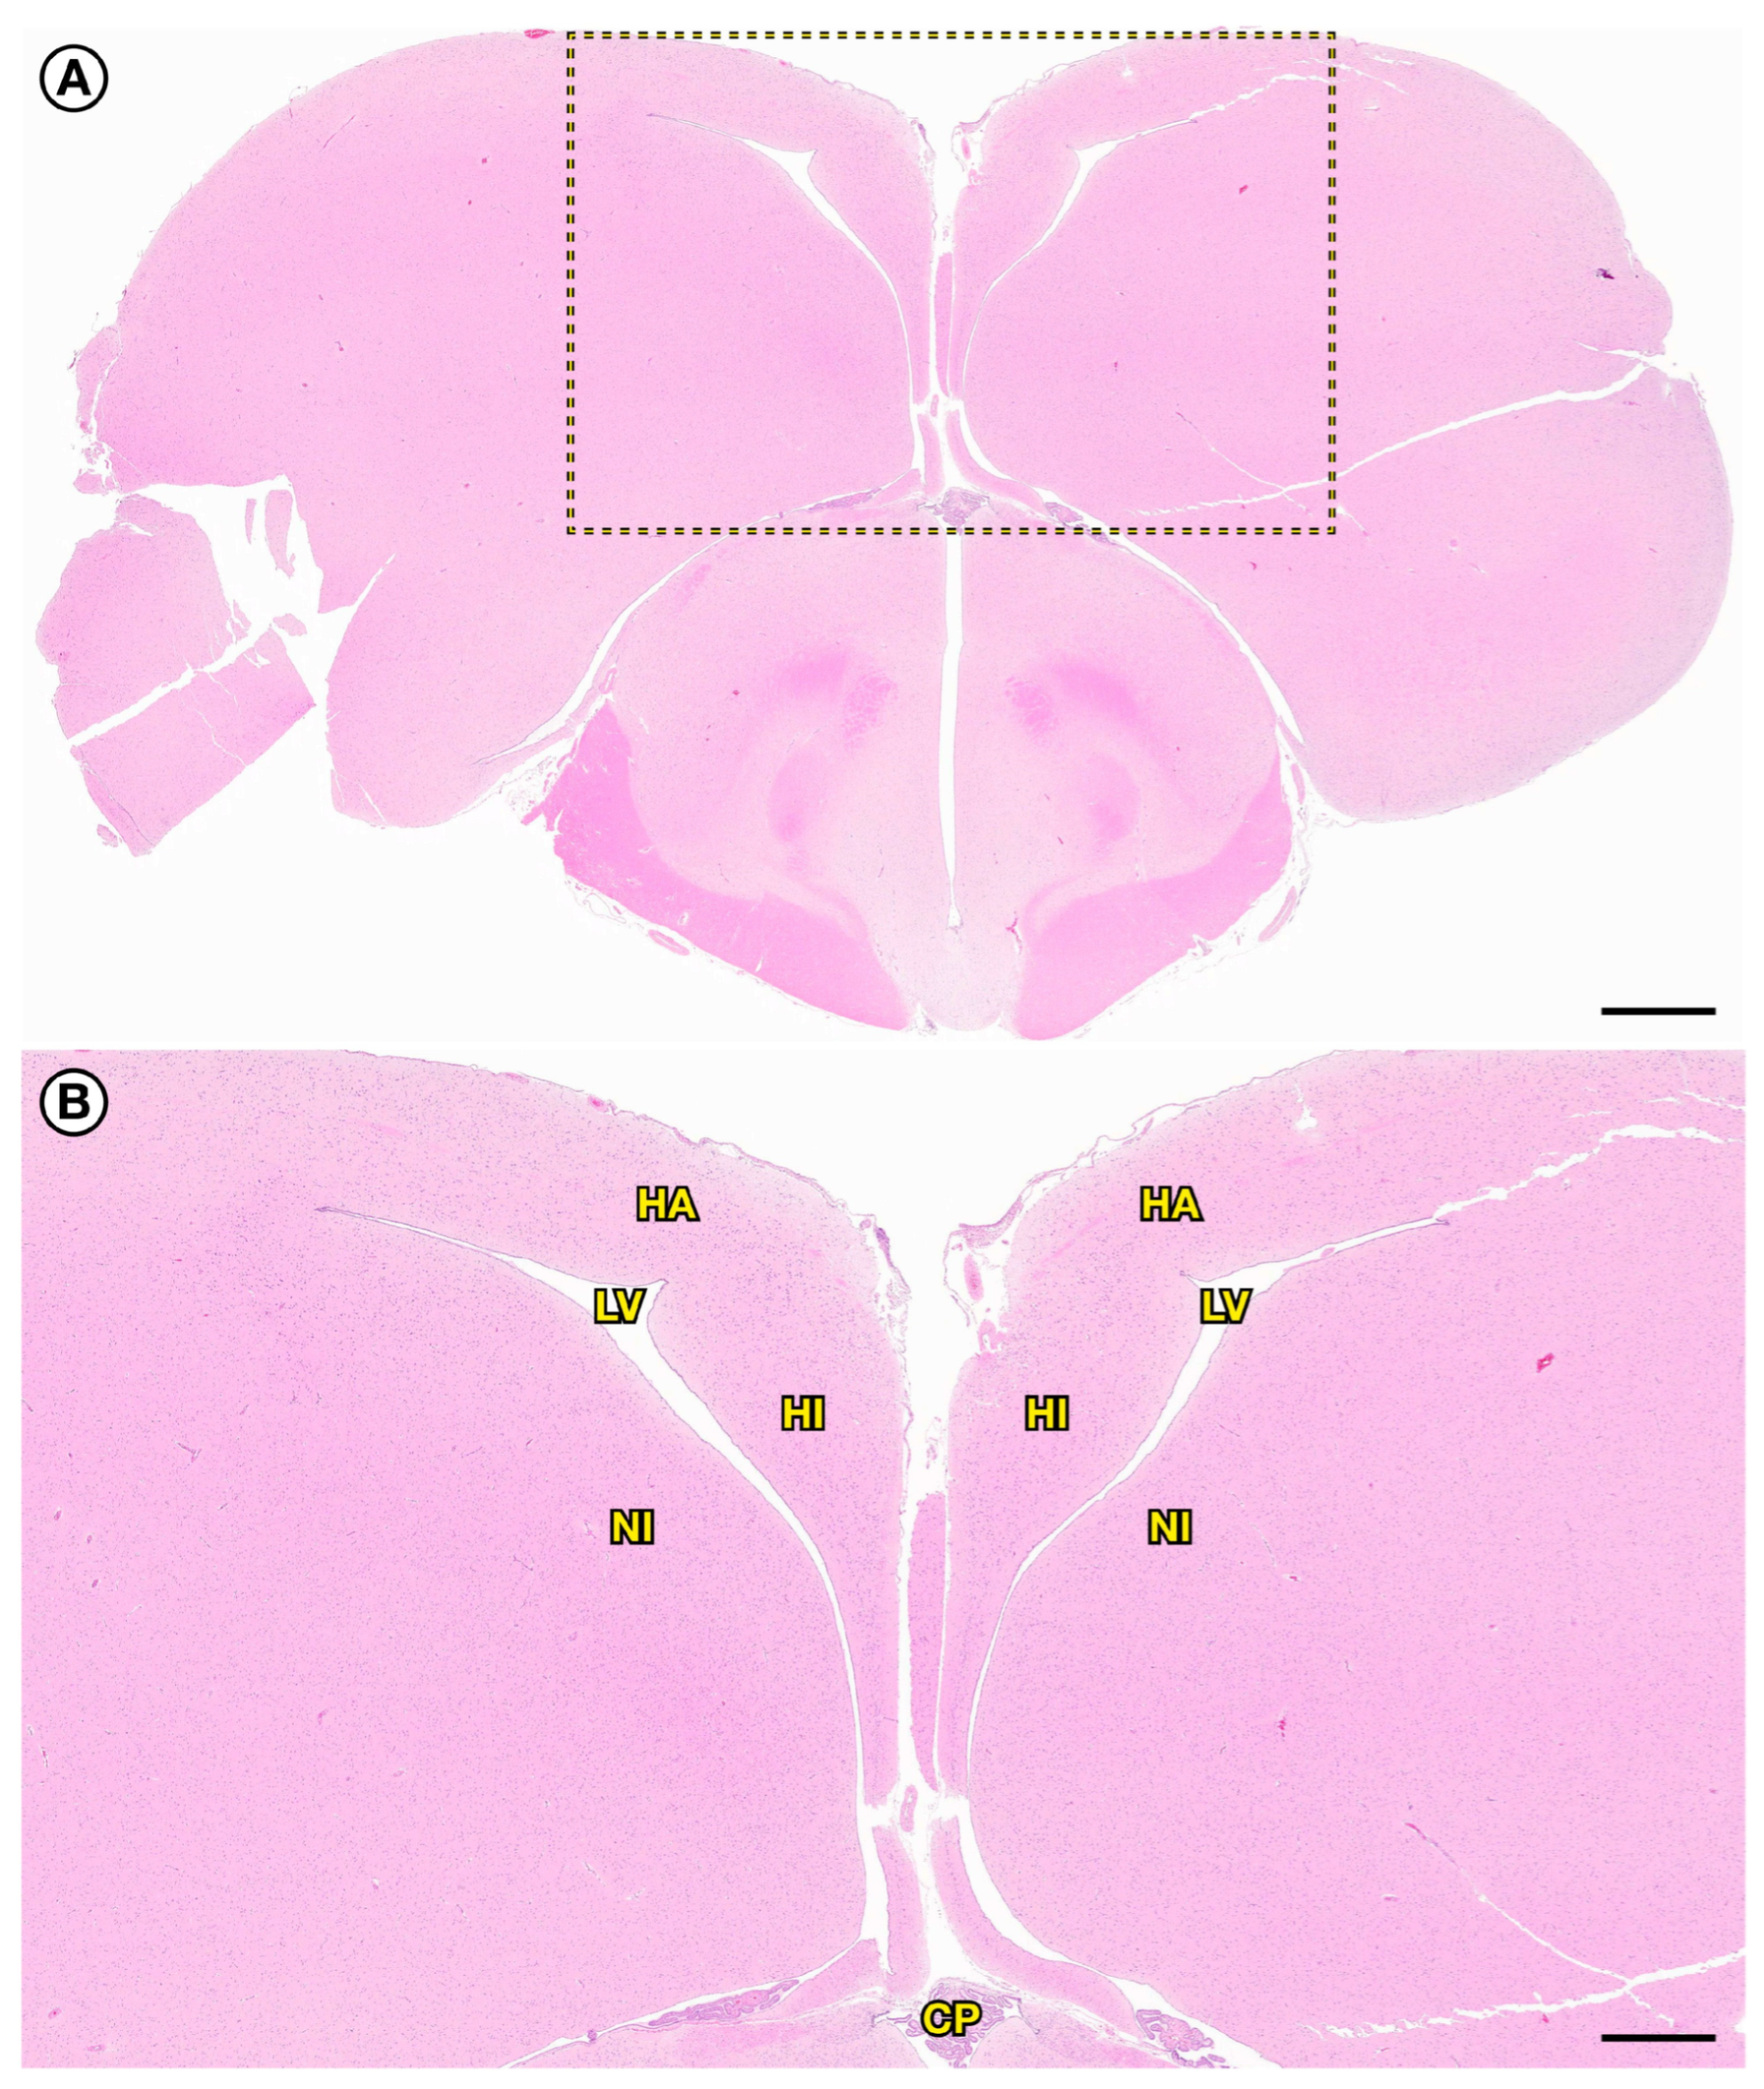
Transverse sections through the caudal cerebrum of a normal (negative control) loon. (A) Low-magnification view of a transverse section of normal COLO (IBR 23-1238) brain at the level of the caudal cerebrum. The cerebrum was diffusely pink and homogenous, the lateral ventricles were small and narrow, and the brain, meninges, and choroid plexus were not significantly congested. (B) (IBR 23-1238) Higher-magnification view of the caudodorsal cerebral midline delineated by a box in (A) above. Locations of the hippocampus (HI), hyperpallium apicale (HA), dorsal nidopallium (NI), lateral ventricles (LV), and choroid plexus (CP) are shown. All slides were stained with hematoxylin and eosin, with images obtained using a digital scanning microscope. Bars = 1750 and 900 µm, respectively.
Figure 5.
Transverse sections through the caudal cerebrum of a normal (negative control) loon. (A) Low-magnification view of a transverse section of normal COLO (IBR 23-1238) brain at the level of the caudal cerebrum. The cerebrum was diffusely pink and homogenous, the lateral ventricles were small and narrow, and the brain, meninges, and choroid plexus were not significantly congested. (B) (IBR 23-1238) Higher-magnification view of the caudodorsal cerebral midline delineated by a box in (A) above. Locations of the hippocampus (HI), hyperpallium apicale (HA), dorsal nidopallium (NI), lateral ventricles (LV), and choroid plexus (CP) are shown. All slides were stained with hematoxylin and eosin, with images obtained using a digital scanning microscope. Bars = 1750 and 900 µm, respectively.
Figure 6.
Transverse section through the caudal cerebrum of a loon that died due to acute, fatal DA toxicosis. (
A) Low-magnification view of caudal cerebrum from a PALO (17-0086) where the cerebrum and meninges were diffusely congested. (
B) (17-0086) Higher-magnification view of the caudodorsal cerebral midline shown within the box in (
A) above, including the hippocampus (HI), hyperpallium apicale (HA), and dorsal nidopallium (NI). In contrast with the negative control brain shown in
Figure 5A,B, the meninges, brain tissue, and choroid plexus (CP) were diffusely and markedly congested. Although the lateral ventricles (LV) were not significantly enlarged, accumulation of scant proteinacious fluid was visible (arrow at upper right). All slides were stained with hematoxylin and eosin, with images obtained using a digital scanning microscope. Bars = 1500 and 500 µm, respectively.
Figure 6.
Transverse section through the caudal cerebrum of a loon that died due to acute, fatal DA toxicosis. (
A) Low-magnification view of caudal cerebrum from a PALO (17-0086) where the cerebrum and meninges were diffusely congested. (
B) (17-0086) Higher-magnification view of the caudodorsal cerebral midline shown within the box in (
A) above, including the hippocampus (HI), hyperpallium apicale (HA), and dorsal nidopallium (NI). In contrast with the negative control brain shown in
Figure 5A,B, the meninges, brain tissue, and choroid plexus (CP) were diffusely and markedly congested. Although the lateral ventricles (LV) were not significantly enlarged, accumulation of scant proteinacious fluid was visible (arrow at upper right). All slides were stained with hematoxylin and eosin, with images obtained using a digital scanning microscope. Bars = 1500 and 500 µm, respectively.
Figure 7.
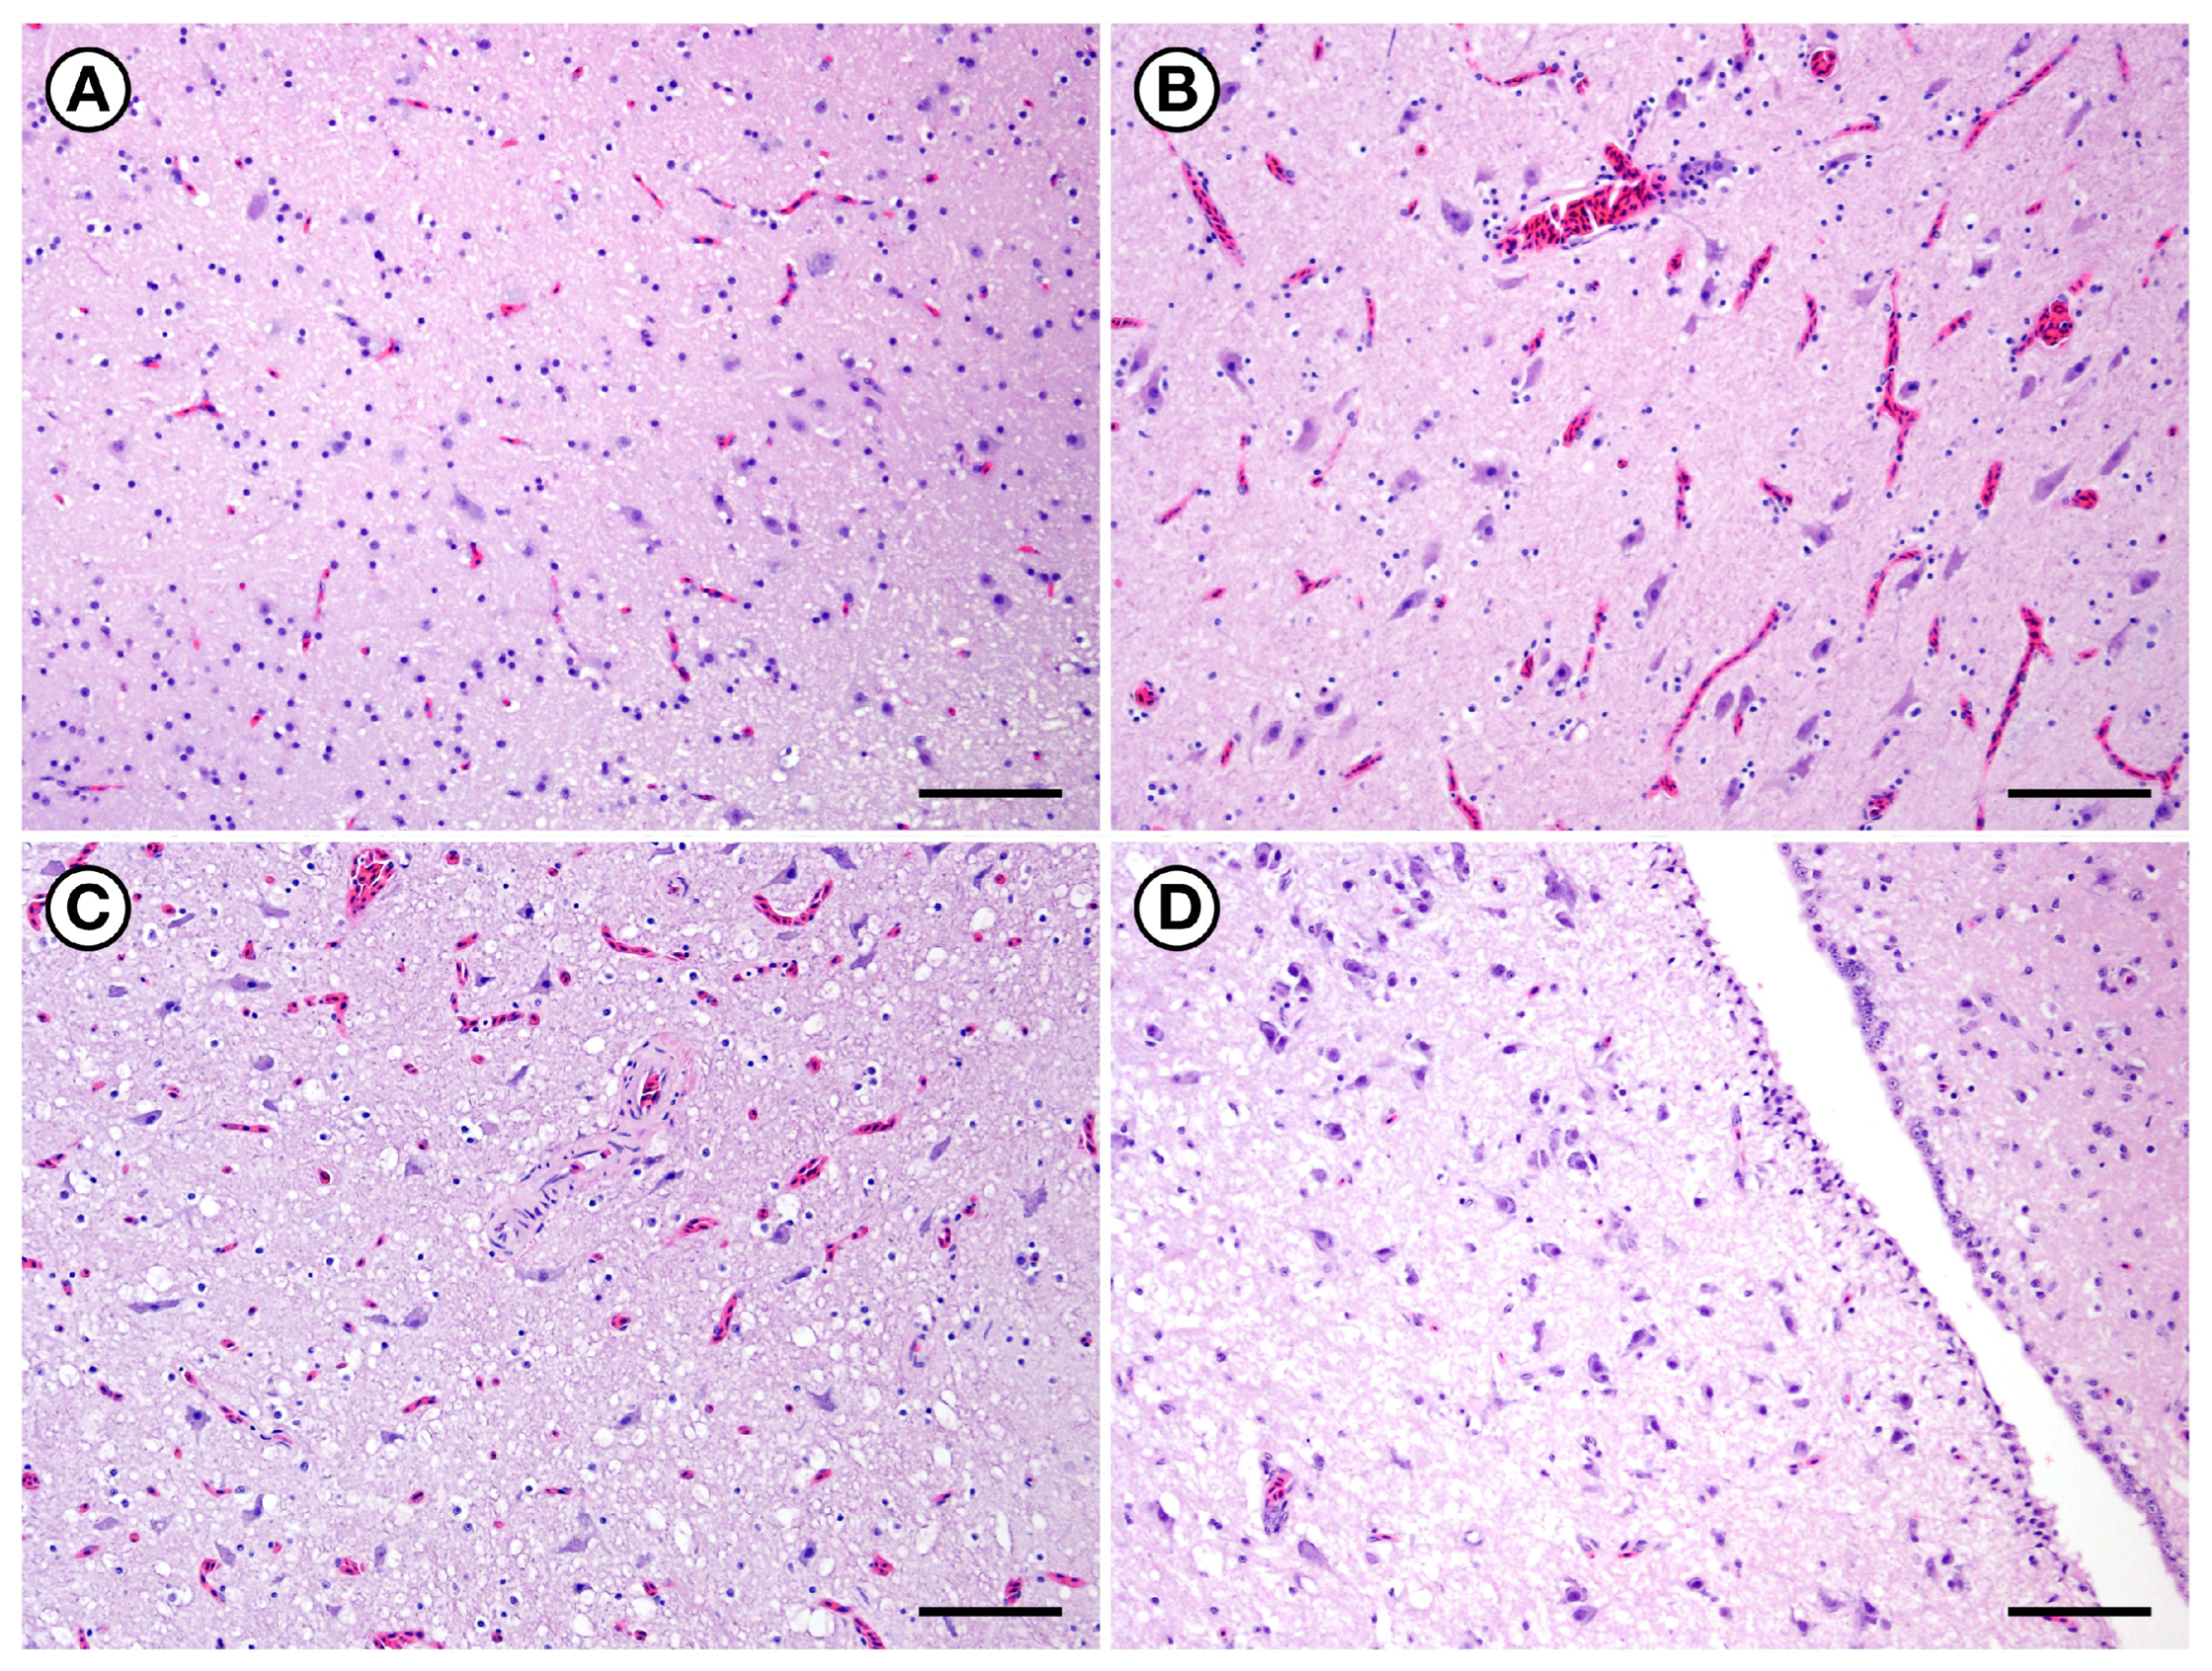
Severe vascular congestion and spongiosis were common in the brains of seabirds with DA toxicosis: (A) Reference image of negative control PALO (06-0219) brain tissue for comparison. (B) Brain from positive control BRPE (15-0100); postmortem tissues and GI content from this bird had DA concentrations as high as 75,300 PPB. There was severe diffuse vascular congestion and mild spongiosis. (C) Brain from PALO (17-0086) with acute, fatal DA toxicosis; postmortem tissues and GI content had DA concentrations as high as 681,190 PPB. There was moderate to marked diffuse vascular congestion and spongiosis. (D) Brain from PALO (IBR 17-0406) that was euthanized after 17 days of captive care due to chronic behavioral abnormalities; postmortem cloacal content was strongly DA-positive (504 PPB). Brain histopathology was characterized by patchy spongiosis without the diffuse marked congestion that was characteristic of birds that died acutely during the DA event. All slides were stained with hematoxylin and eosin. Bars = 75, 38, 75, and 75 µm, respectively.
Figure 7.
Severe vascular congestion and spongiosis were common in the brains of seabirds with DA toxicosis: (A) Reference image of negative control PALO (06-0219) brain tissue for comparison. (B) Brain from positive control BRPE (15-0100); postmortem tissues and GI content from this bird had DA concentrations as high as 75,300 PPB. There was severe diffuse vascular congestion and mild spongiosis. (C) Brain from PALO (17-0086) with acute, fatal DA toxicosis; postmortem tissues and GI content had DA concentrations as high as 681,190 PPB. There was moderate to marked diffuse vascular congestion and spongiosis. (D) Brain from PALO (IBR 17-0406) that was euthanized after 17 days of captive care due to chronic behavioral abnormalities; postmortem cloacal content was strongly DA-positive (504 PPB). Brain histopathology was characterized by patchy spongiosis without the diffuse marked congestion that was characteristic of birds that died acutely during the DA event. All slides were stained with hematoxylin and eosin. Bars = 75, 38, 75, and 75 µm, respectively.

Figure 8.
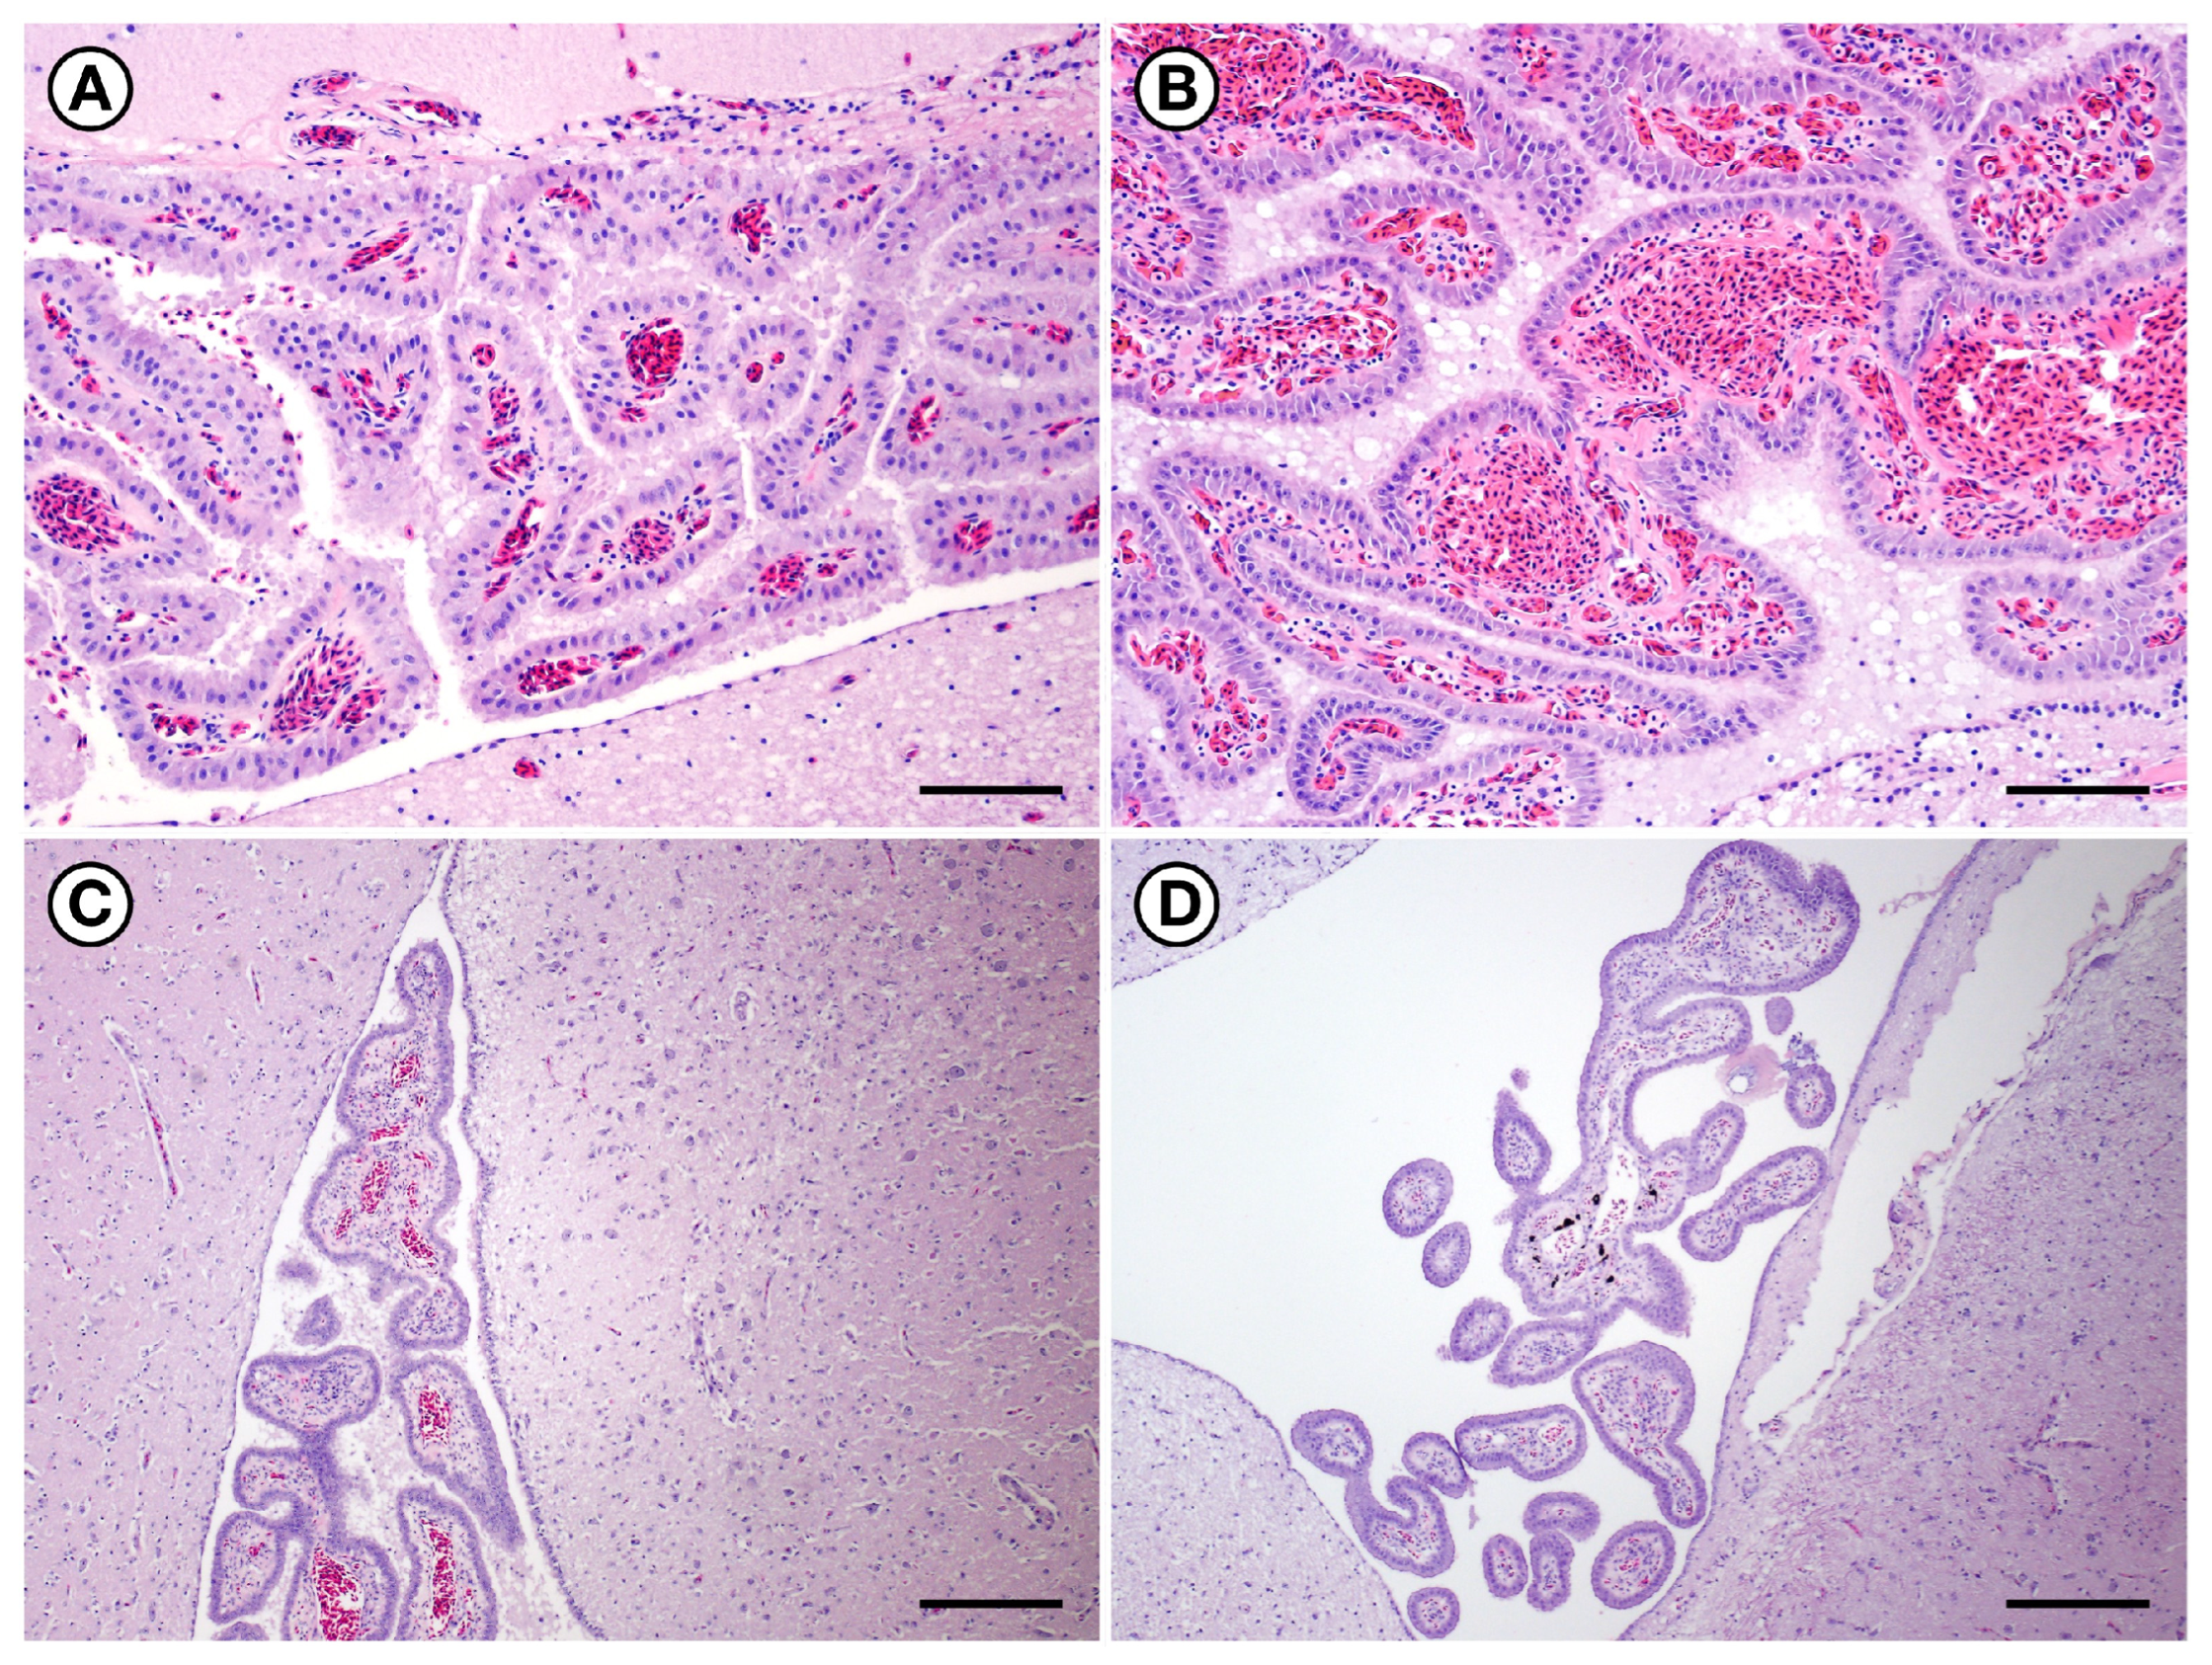
Choroid plexus pathology and ventricle dilation were common in brains of birds with acute and sublethal DA toxicosis. (A) Moderate diffuse stromal congestion of the choroid plexus, and mild ventricular microhemorrhage in an acute positive control BRPE (15-0100). (B) Markedly congested choroid plexus stroma from a PALO (17-0086) with acute, fatal DA toxicosis. (C) Choroid plexus and lateral ventricle from a PALO (IBR 17-0597) that stranded during the DA-associated mass-mortality event and was euthanized after four days of captive care. Choroidal congestion was within normal limits. Although not visible at this magnification, there was mild to moderate periventricular neuronal necrosis. (D) Choroid plexus and lateral ventricle from a PALO (17-0406) that stranded during the mass-mortality HAB event and was euthanized after 17 days of captive care. The choroid plexus appeared to be atrophic and hypoperfused, and the lateral ventricles were moderately dilated. All slides were stained with hematoxylin and eosin. Bars = 30, 30, 160, and 320 µm, respectively.
Figure 8.
Choroid plexus pathology and ventricle dilation were common in brains of birds with acute and sublethal DA toxicosis. (A) Moderate diffuse stromal congestion of the choroid plexus, and mild ventricular microhemorrhage in an acute positive control BRPE (15-0100). (B) Markedly congested choroid plexus stroma from a PALO (17-0086) with acute, fatal DA toxicosis. (C) Choroid plexus and lateral ventricle from a PALO (IBR 17-0597) that stranded during the DA-associated mass-mortality event and was euthanized after four days of captive care. Choroidal congestion was within normal limits. Although not visible at this magnification, there was mild to moderate periventricular neuronal necrosis. (D) Choroid plexus and lateral ventricle from a PALO (17-0406) that stranded during the mass-mortality HAB event and was euthanized after 17 days of captive care. The choroid plexus appeared to be atrophic and hypoperfused, and the lateral ventricles were moderately dilated. All slides were stained with hematoxylin and eosin. Bars = 30, 30, 160, and 320 µm, respectively.

Figure 9.
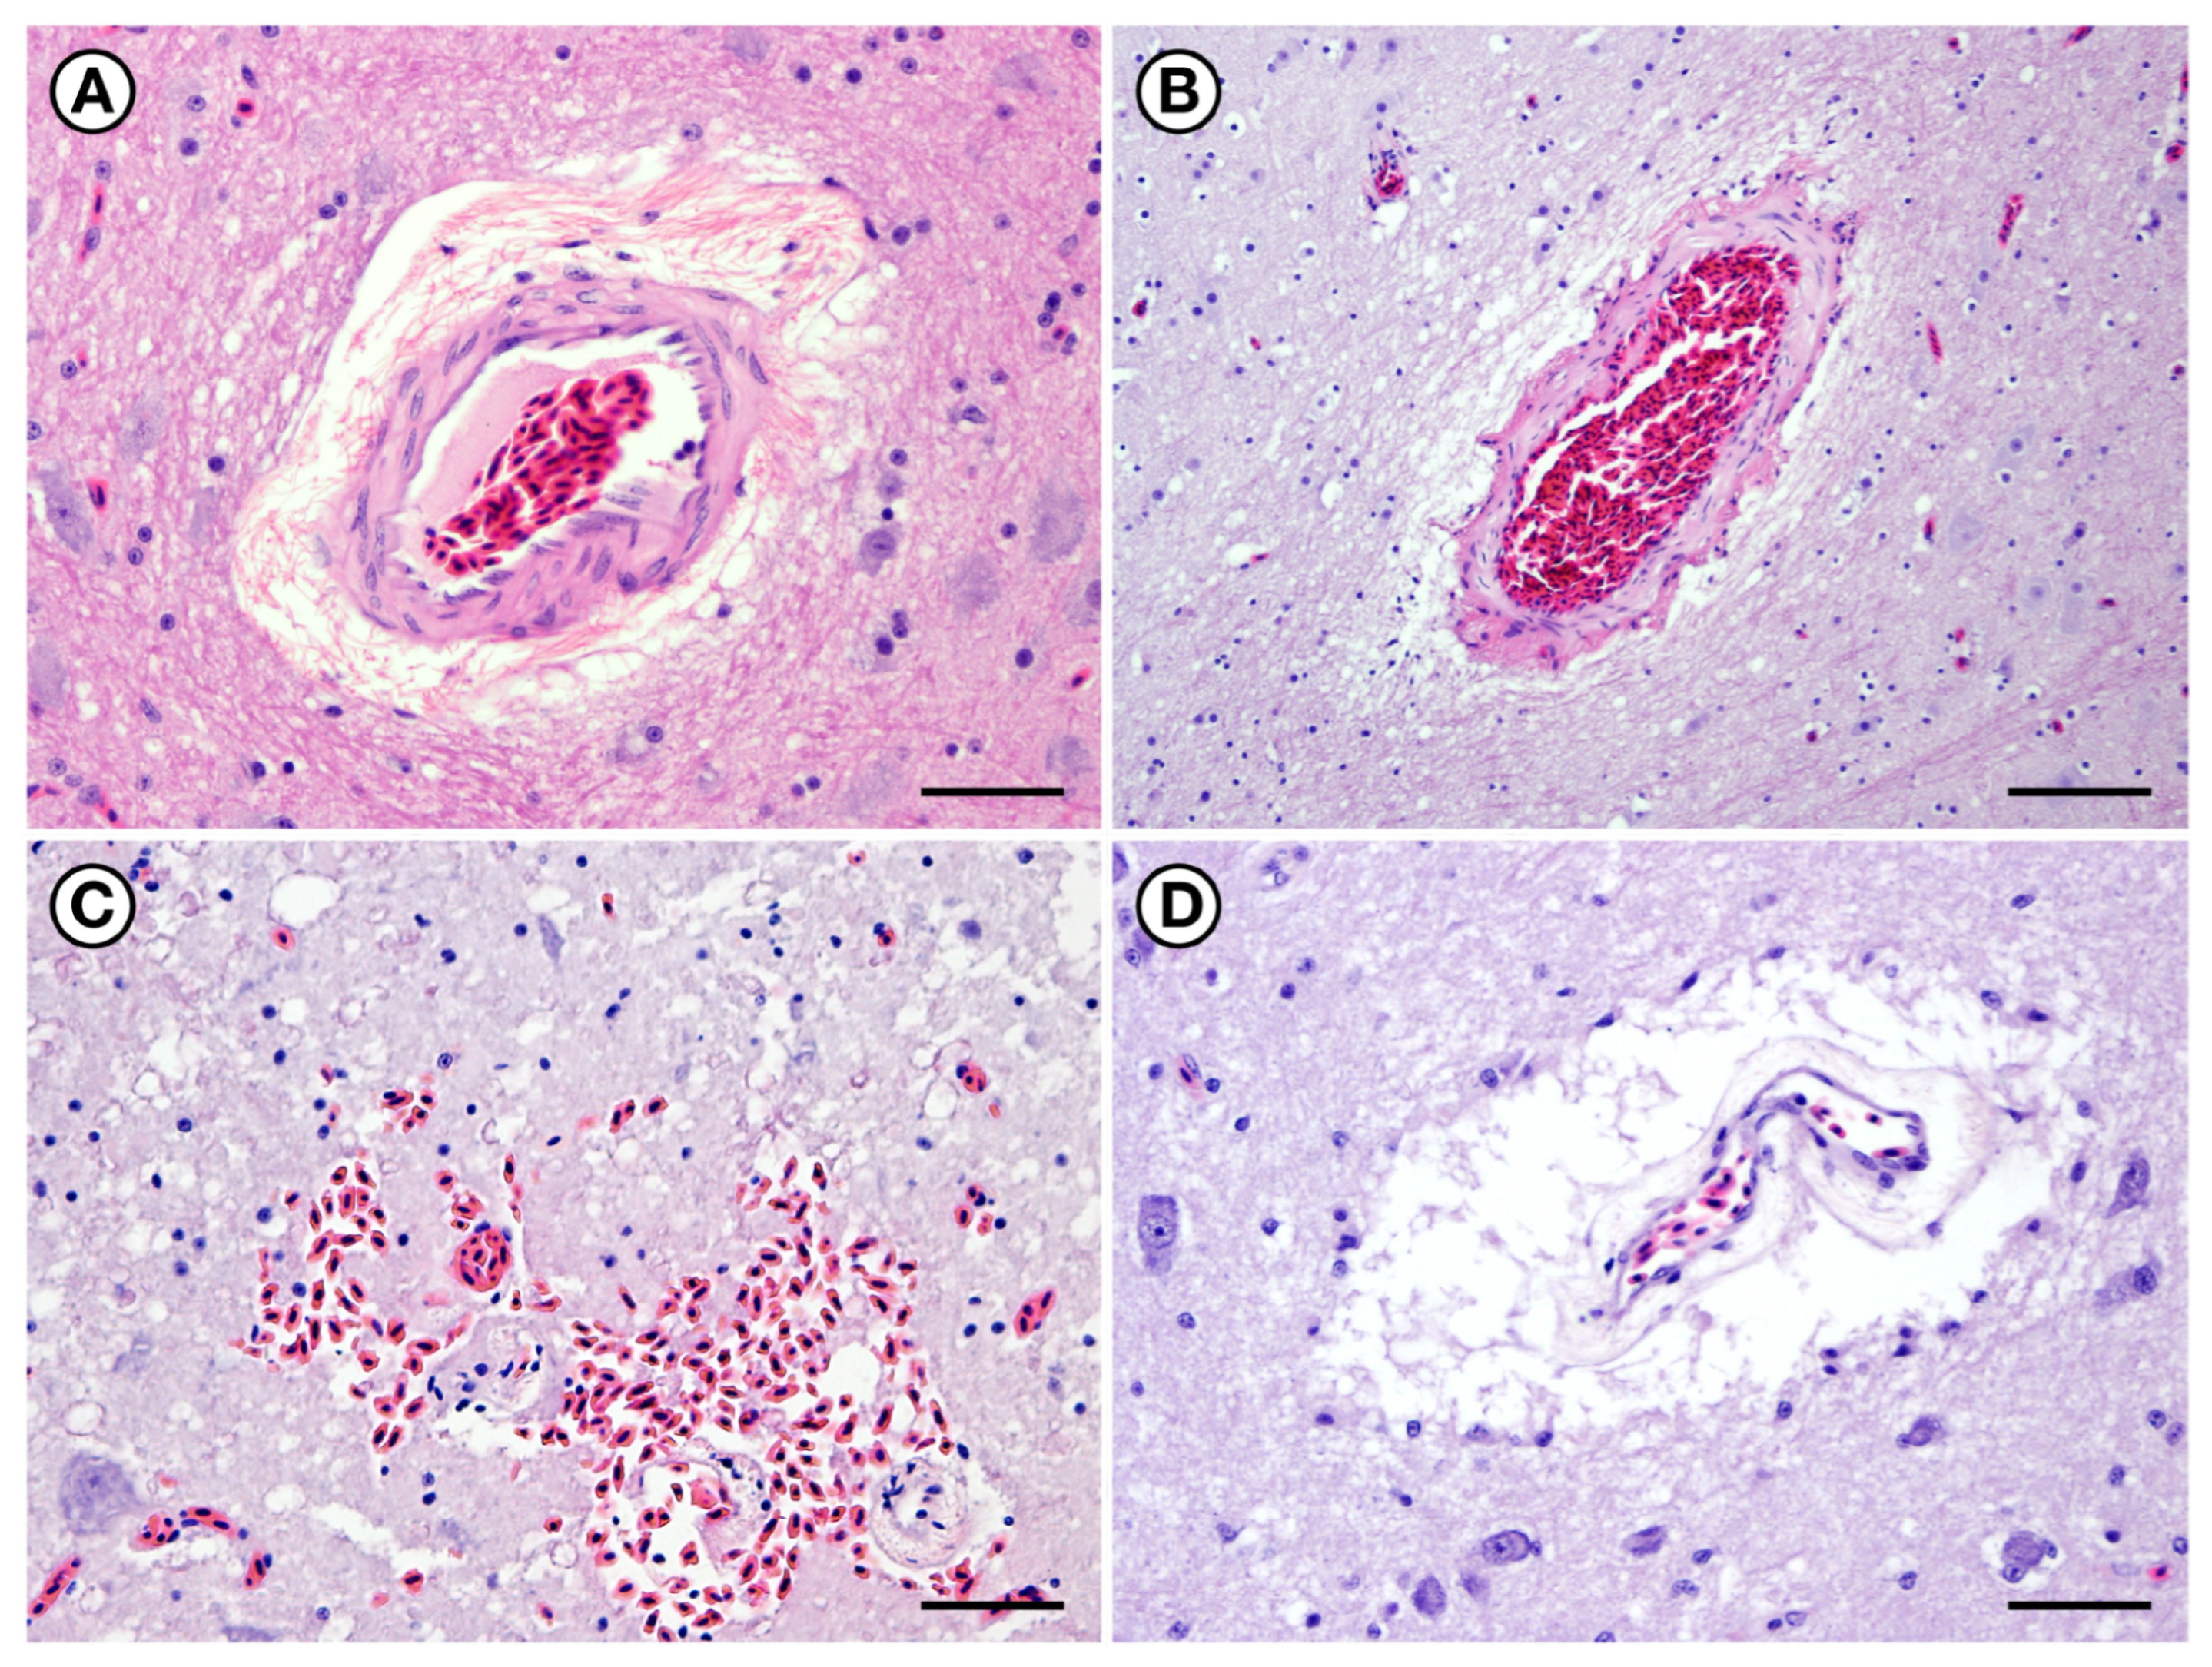
Vascular mural and perivascular pathology were common in brains of birds with lethal and sublethal DA toxicosis. (A) Normal cerebral arteriole from a negative control PALO (18-0503). (B) Mild perivascular spongiosis surrounding a cerebral arteriole from a positive control BRPE (15-0100). (C) Multiple small cerebral arteriolar profiles from a PALO (17-0086) with acute, fatal DA toxicosis. Decreased cytological detail of the arteriolar walls was associated with multifocal acute perivascular microhemorrhage and spongiosis. (D) Cerebral arteriole from a PALO (IBR 17-0406) that was euthanized after 17 days of care due to chronic neurological disease. Decreased cellularity and cytological detail in arteriolar walls was accompanied by enlargement of perivascular Virchow–Robin spaces (or the avian equivalent) and mild perivascular spongiosis. All slides were stained with hematoxylin and eosin. Bars = 60, 65, 30, and 30 µm, respectively.
Figure 9.
Vascular mural and perivascular pathology were common in brains of birds with lethal and sublethal DA toxicosis. (A) Normal cerebral arteriole from a negative control PALO (18-0503). (B) Mild perivascular spongiosis surrounding a cerebral arteriole from a positive control BRPE (15-0100). (C) Multiple small cerebral arteriolar profiles from a PALO (17-0086) with acute, fatal DA toxicosis. Decreased cytological detail of the arteriolar walls was associated with multifocal acute perivascular microhemorrhage and spongiosis. (D) Cerebral arteriole from a PALO (IBR 17-0406) that was euthanized after 17 days of care due to chronic neurological disease. Decreased cellularity and cytological detail in arteriolar walls was accompanied by enlargement of perivascular Virchow–Robin spaces (or the avian equivalent) and mild perivascular spongiosis. All slides were stained with hematoxylin and eosin. Bars = 60, 65, 30, and 30 µm, respectively.
Figure 10.
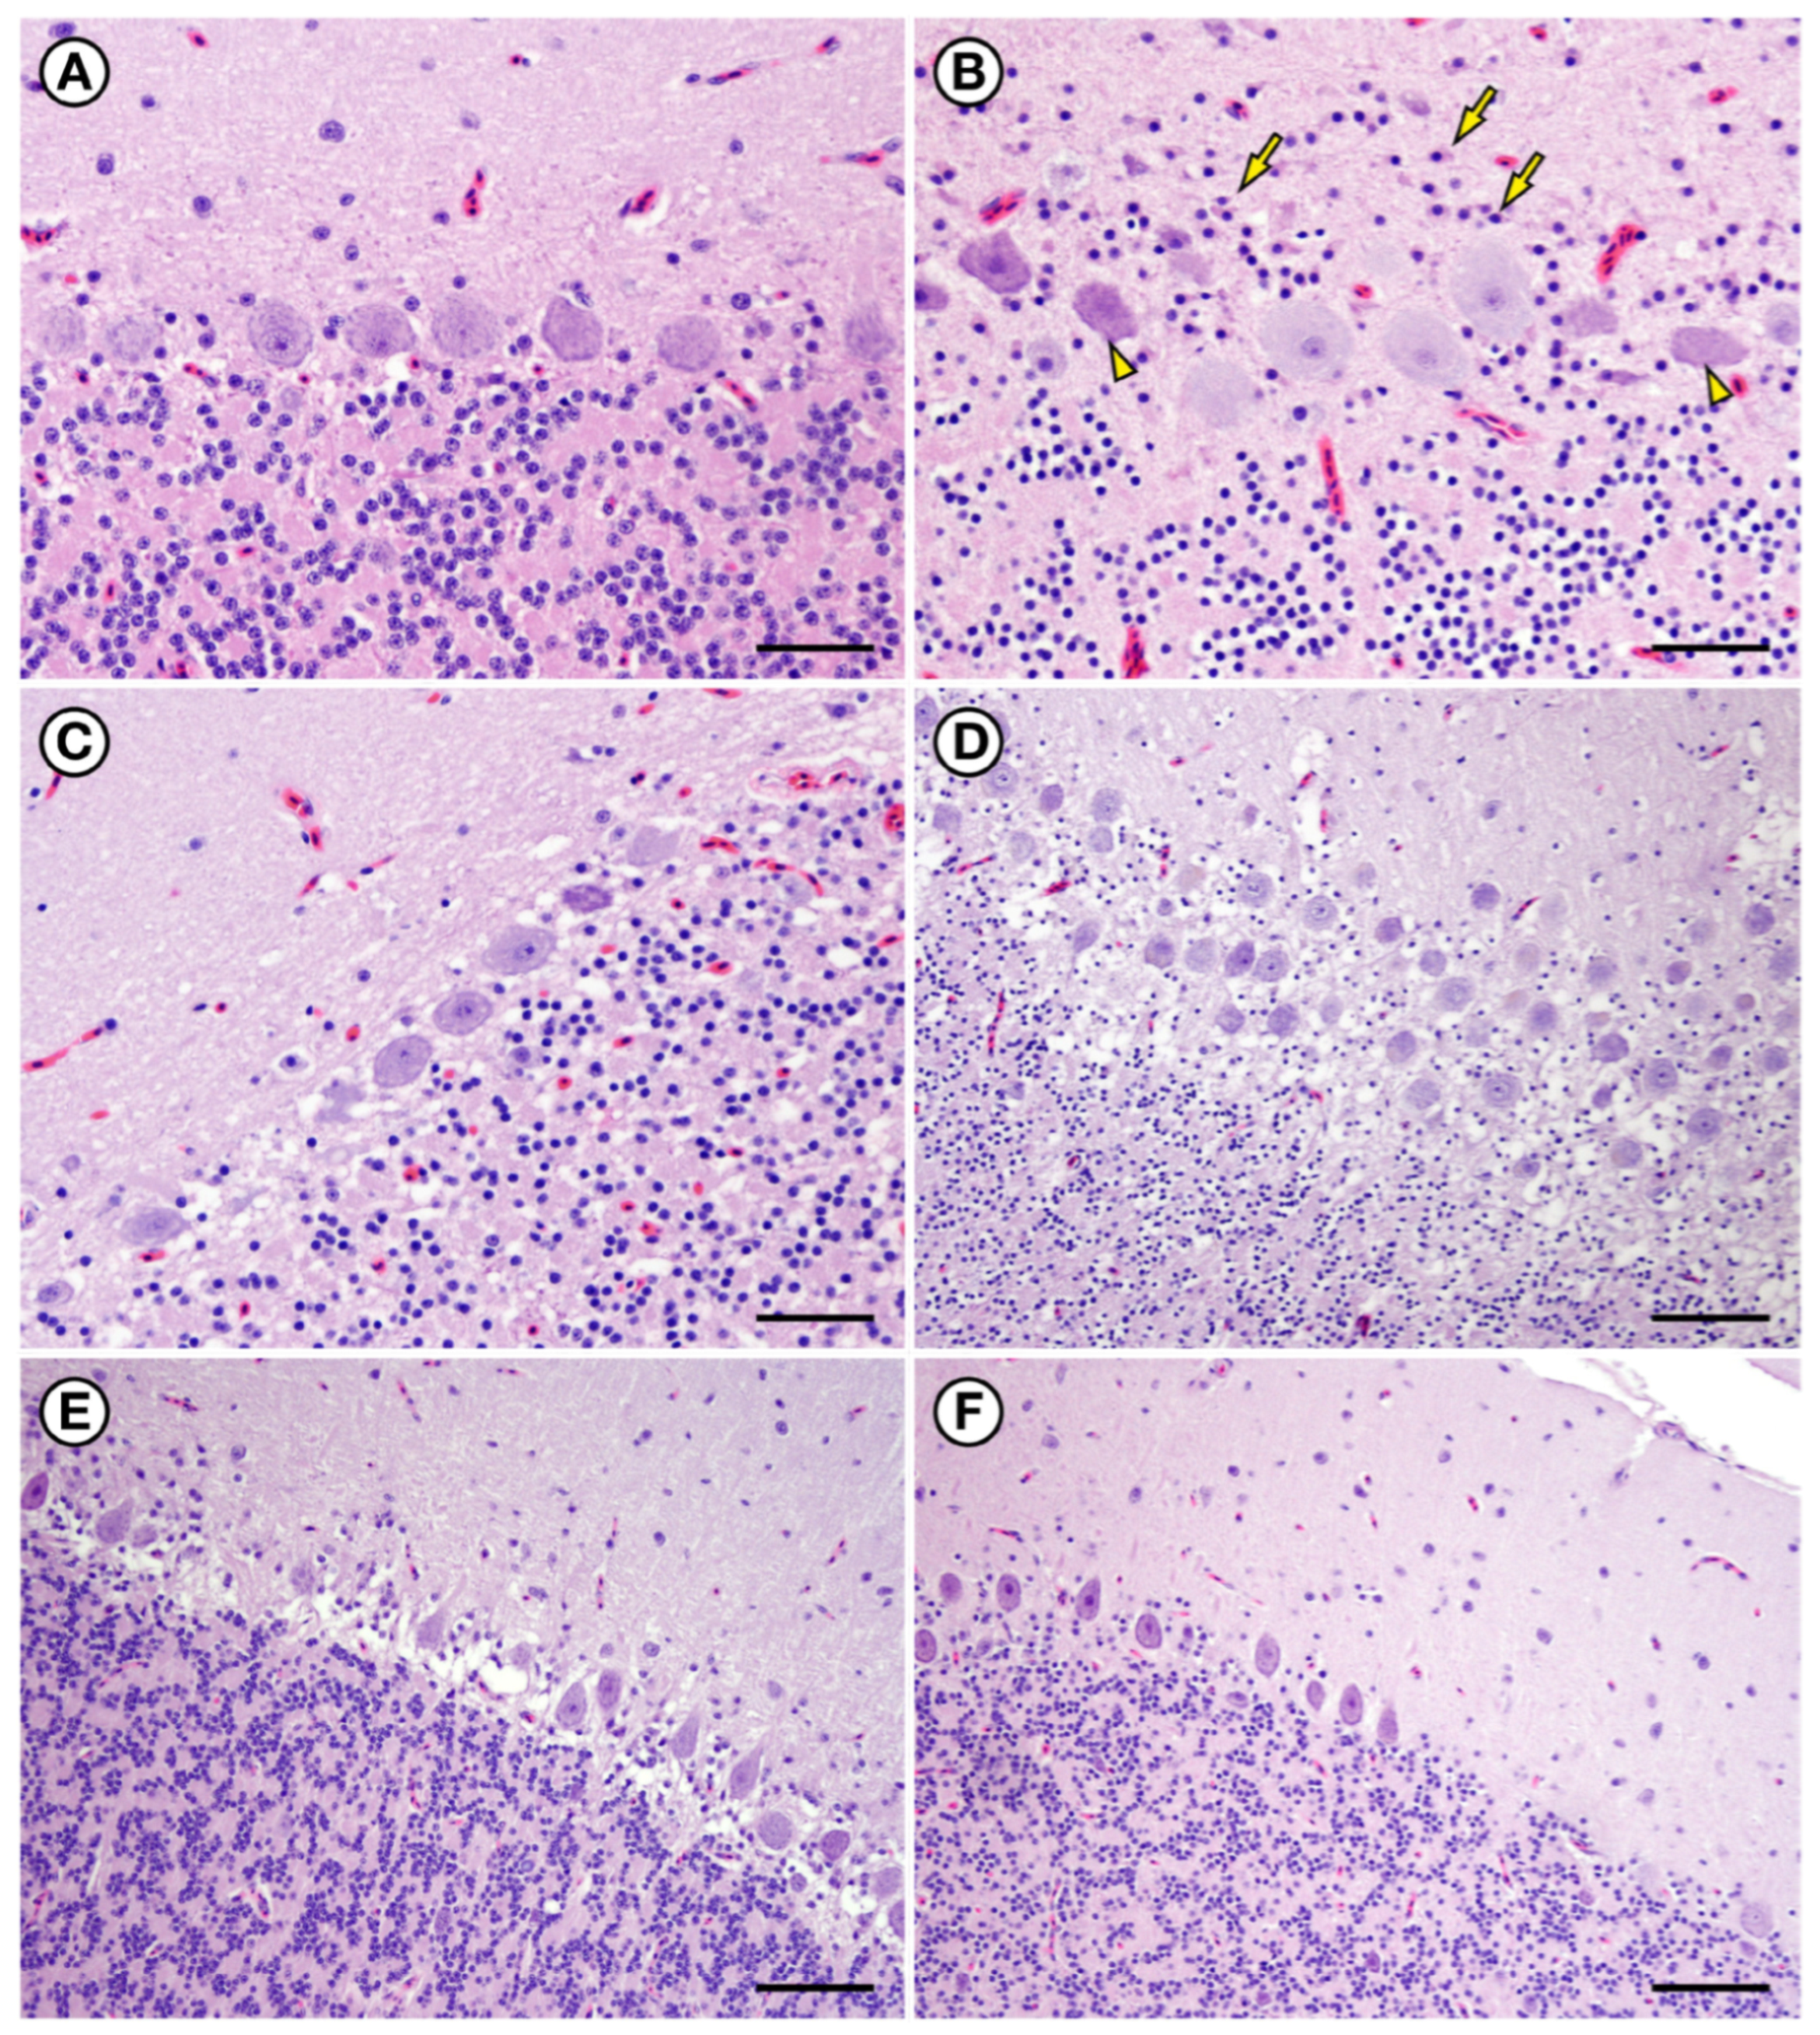
Pathology of the Purkinje cell layer was common in cerebellum of birds with acute fatal and sublethal DA toxicosis. (A) Normal cerebellar Purkinje cell layer from a negative control PALO (18-0503). Note the even distribution and appearance of the large Purkinje cell neurons and the absence of perineuronal spongiosis. (B) Cerebellar Purkinje cell layer from a positive control BRPE (15-0100). Some glial cells surrounding the Purkinje cell neurons (presumptive astroglia; arrows) exhibited homogenous eosinophilic to amphophilic cytoplasm suggestive of cell necrosis. Some Purkinje cells also appeared smaller than normal, with dense hyperchromic cytoplasm and possible nuclear karyolysis (arrowheads). (C) Cerebellar Purkinje cell layer from a PALO (17-0086) with acute, fatal DA toxicosis. Mild spongiosis was visible in tissue surrounding each Purkinje cell and some Purkinje cell neurons appeared smaller than normal, with dense hyperchromic cytoplasm and possible nuclear karyolysis. (D) Cerebellar Purkinje cell layer from a PALO (IBR 17-0597) that was euthanized four days post-stranding. Spongiosis surrounding each Purkinje cell neuron was very prominent and appeared to be due to cytoplasmic pallor and swelling of perineuronal glial swells. This section is tangential, resulting in mild artifactual lesion enhancement. (E,F) Cerebellar Purkinje cell layer from a PALO (IBR 17-0406) that was euthanized 17 days post-stranding. The cytoplasmic pallor and swelling surrounding each Purkinje cell were less prominent, but the arrangement of Purkinje cell neurons was irregular and uneven. All slides were stained with hematoxylin and eosin. Bars = 65, 65, 65, 160, 160, and 160 µm, respectively.
Figure 10.
Pathology of the Purkinje cell layer was common in cerebellum of birds with acute fatal and sublethal DA toxicosis. (A) Normal cerebellar Purkinje cell layer from a negative control PALO (18-0503). Note the even distribution and appearance of the large Purkinje cell neurons and the absence of perineuronal spongiosis. (B) Cerebellar Purkinje cell layer from a positive control BRPE (15-0100). Some glial cells surrounding the Purkinje cell neurons (presumptive astroglia; arrows) exhibited homogenous eosinophilic to amphophilic cytoplasm suggestive of cell necrosis. Some Purkinje cells also appeared smaller than normal, with dense hyperchromic cytoplasm and possible nuclear karyolysis (arrowheads). (C) Cerebellar Purkinje cell layer from a PALO (17-0086) with acute, fatal DA toxicosis. Mild spongiosis was visible in tissue surrounding each Purkinje cell and some Purkinje cell neurons appeared smaller than normal, with dense hyperchromic cytoplasm and possible nuclear karyolysis. (D) Cerebellar Purkinje cell layer from a PALO (IBR 17-0597) that was euthanized four days post-stranding. Spongiosis surrounding each Purkinje cell neuron was very prominent and appeared to be due to cytoplasmic pallor and swelling of perineuronal glial swells. This section is tangential, resulting in mild artifactual lesion enhancement. (E,F) Cerebellar Purkinje cell layer from a PALO (IBR 17-0406) that was euthanized 17 days post-stranding. The cytoplasmic pallor and swelling surrounding each Purkinje cell were less prominent, but the arrangement of Purkinje cell neurons was irregular and uneven. All slides were stained with hematoxylin and eosin. Bars = 65, 65, 65, 160, 160, and 160 µm, respectively.

Figure 11.
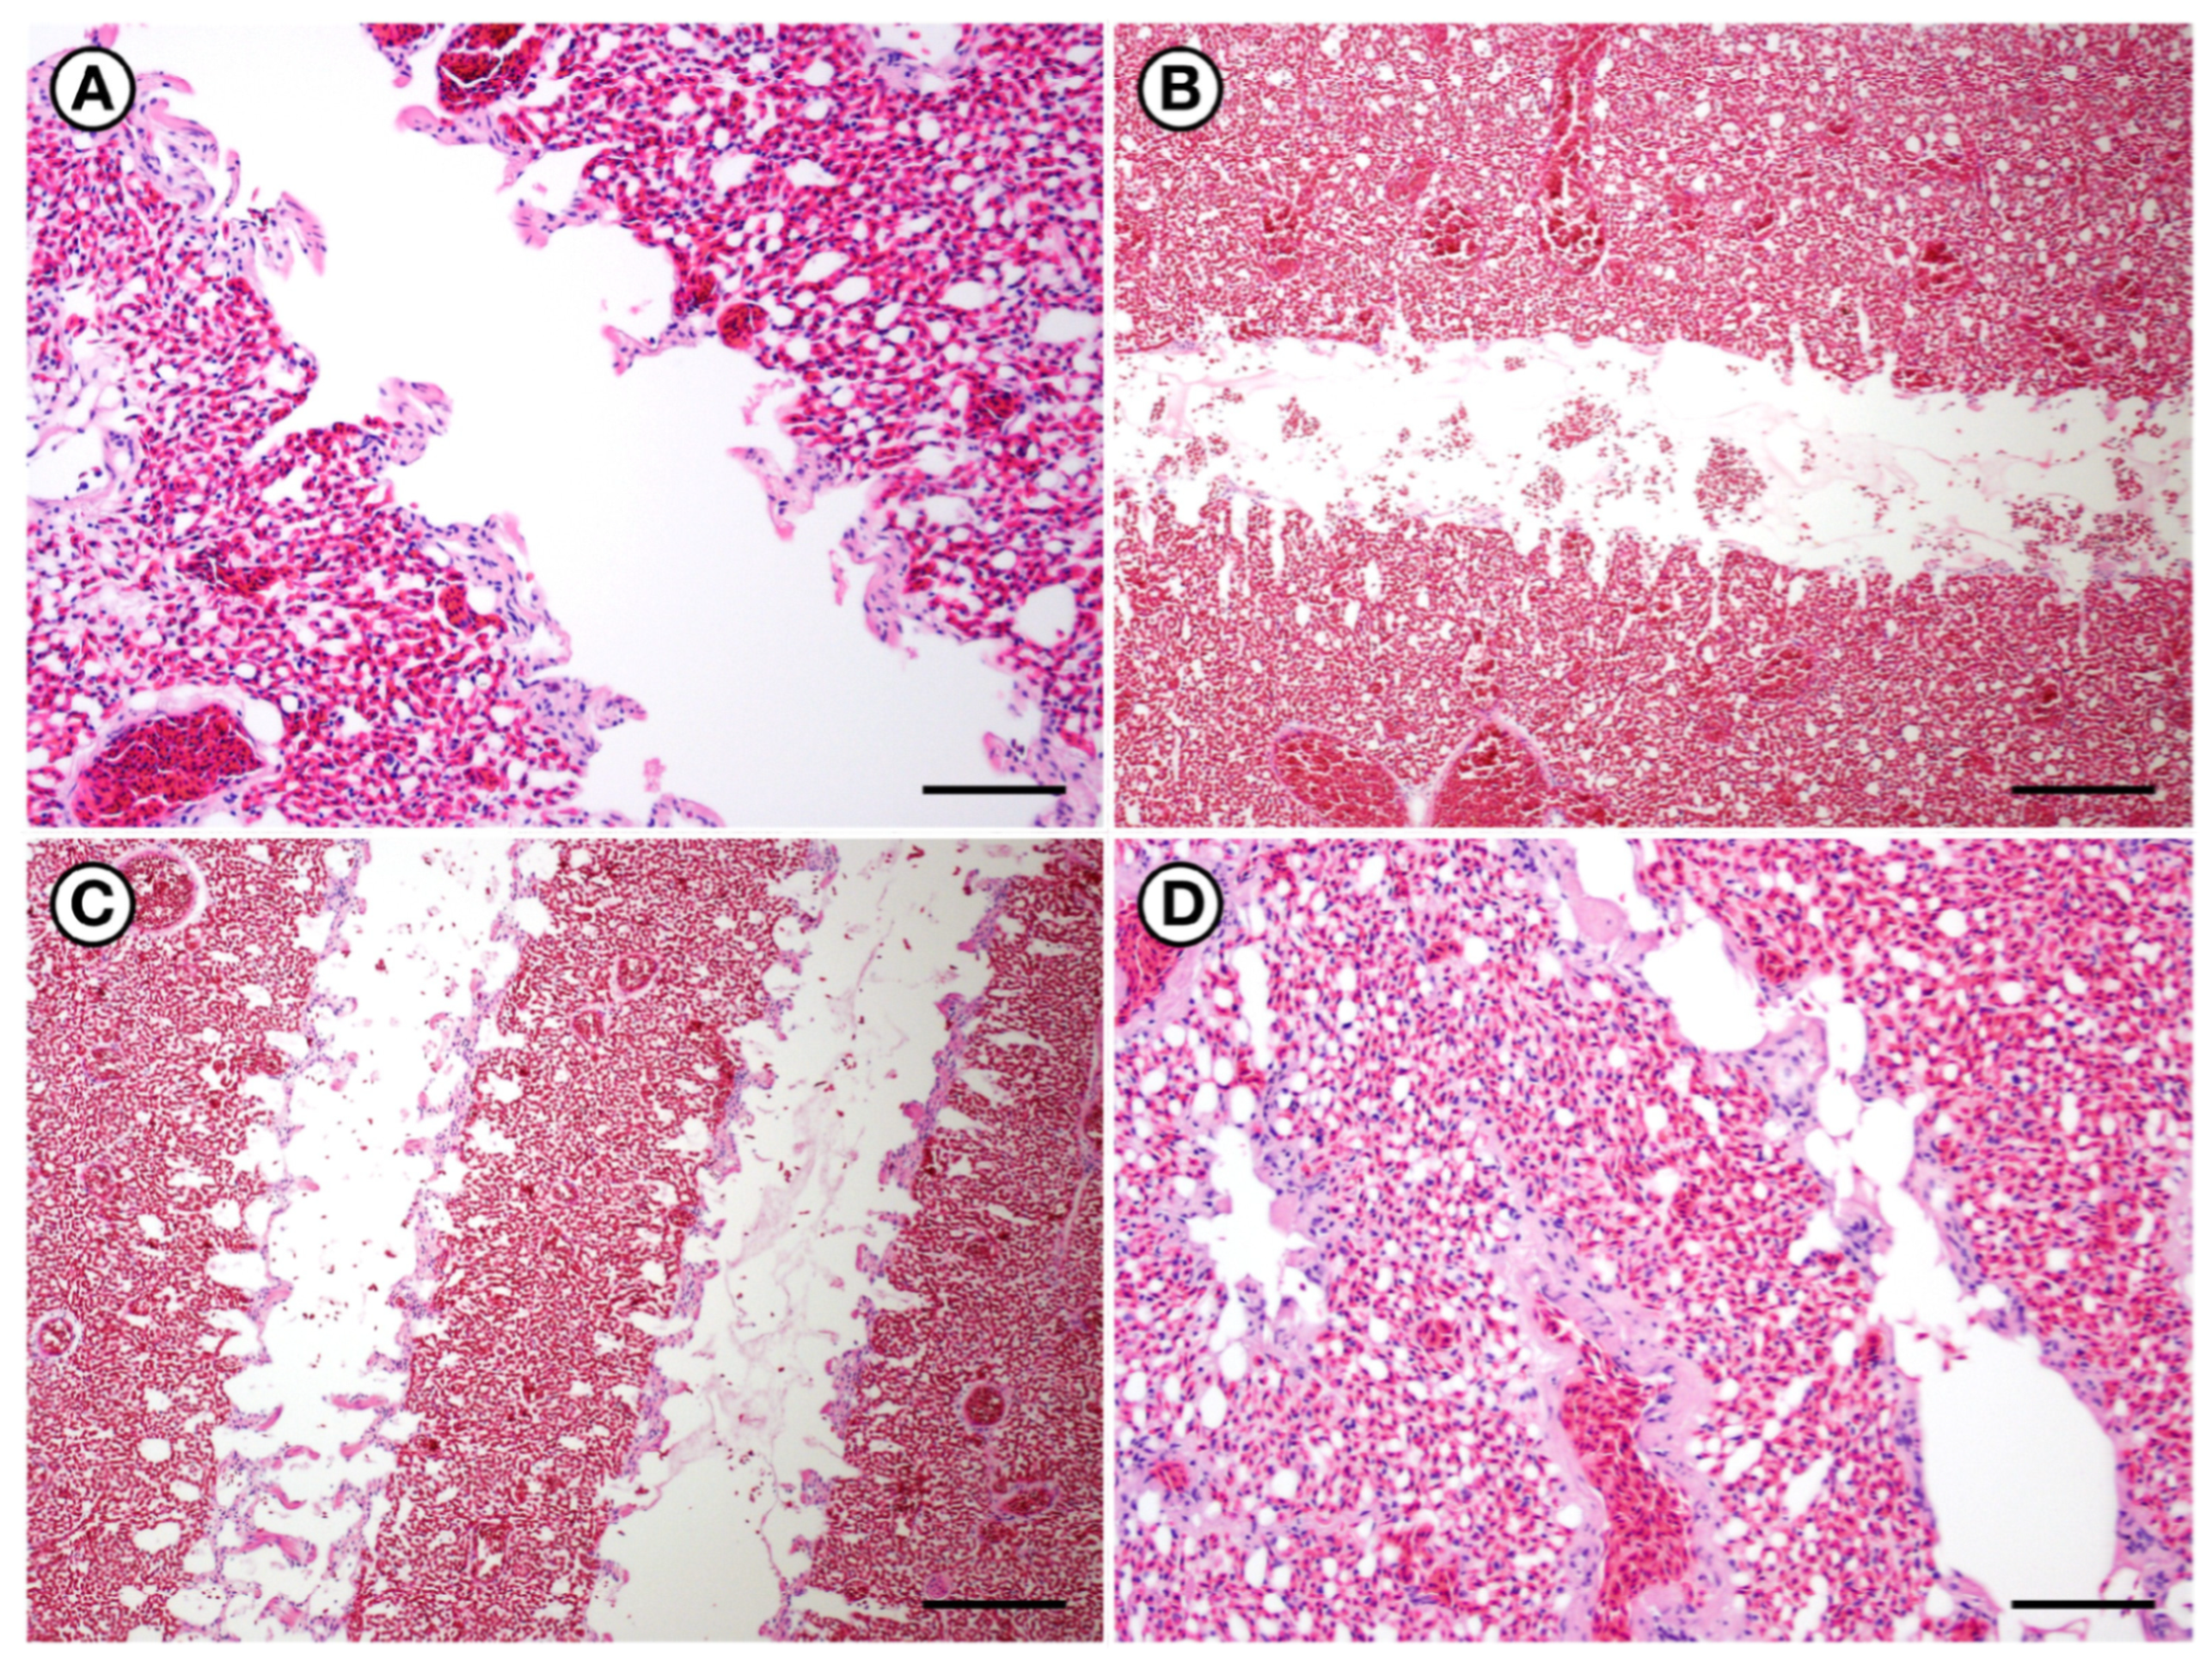
Mild to moderate, transient pulmonary pathology was common in birds with acute fatal DA toxicosis. (A) Normal lung and parabronchus from a negative control PALO (06-0219) for reference. (B) Lung and parabronchus from a positive control loon (07-0410); there was diffuse, severe vascular congestion, and the parabronchus was filled with proteinacious fluid and extravasated red blood cells. (C) Lung and parabronchus from a PALO (17-0086) with acute, fatal DA toxicosis; there was diffuse, severe vascular congestion, and the parabronchus was filled with proteinacious fluid and extravasated red blood cells. (D) Lung and parabronchus from a PALO (IBR 17-0406) that was euthanized 17 days post-stranding due to chronic neurological abnormalities. The pulmonary congestion, edema, and hemorrhage that were characteristic of birds that died acutely with high DA concentrations in GI content, tissues, and body fluids were no longer visible. All slides were stained with hematoxylin and eosin. Bars = 65, 160, 160, and 65 µm, respectively.
Figure 11.
Mild to moderate, transient pulmonary pathology was common in birds with acute fatal DA toxicosis. (A) Normal lung and parabronchus from a negative control PALO (06-0219) for reference. (B) Lung and parabronchus from a positive control loon (07-0410); there was diffuse, severe vascular congestion, and the parabronchus was filled with proteinacious fluid and extravasated red blood cells. (C) Lung and parabronchus from a PALO (17-0086) with acute, fatal DA toxicosis; there was diffuse, severe vascular congestion, and the parabronchus was filled with proteinacious fluid and extravasated red blood cells. (D) Lung and parabronchus from a PALO (IBR 17-0406) that was euthanized 17 days post-stranding due to chronic neurological abnormalities. The pulmonary congestion, edema, and hemorrhage that were characteristic of birds that died acutely with high DA concentrations in GI content, tissues, and body fluids were no longer visible. All slides were stained with hematoxylin and eosin. Bars = 65, 160, 160, and 65 µm, respectively.

Figure 12.
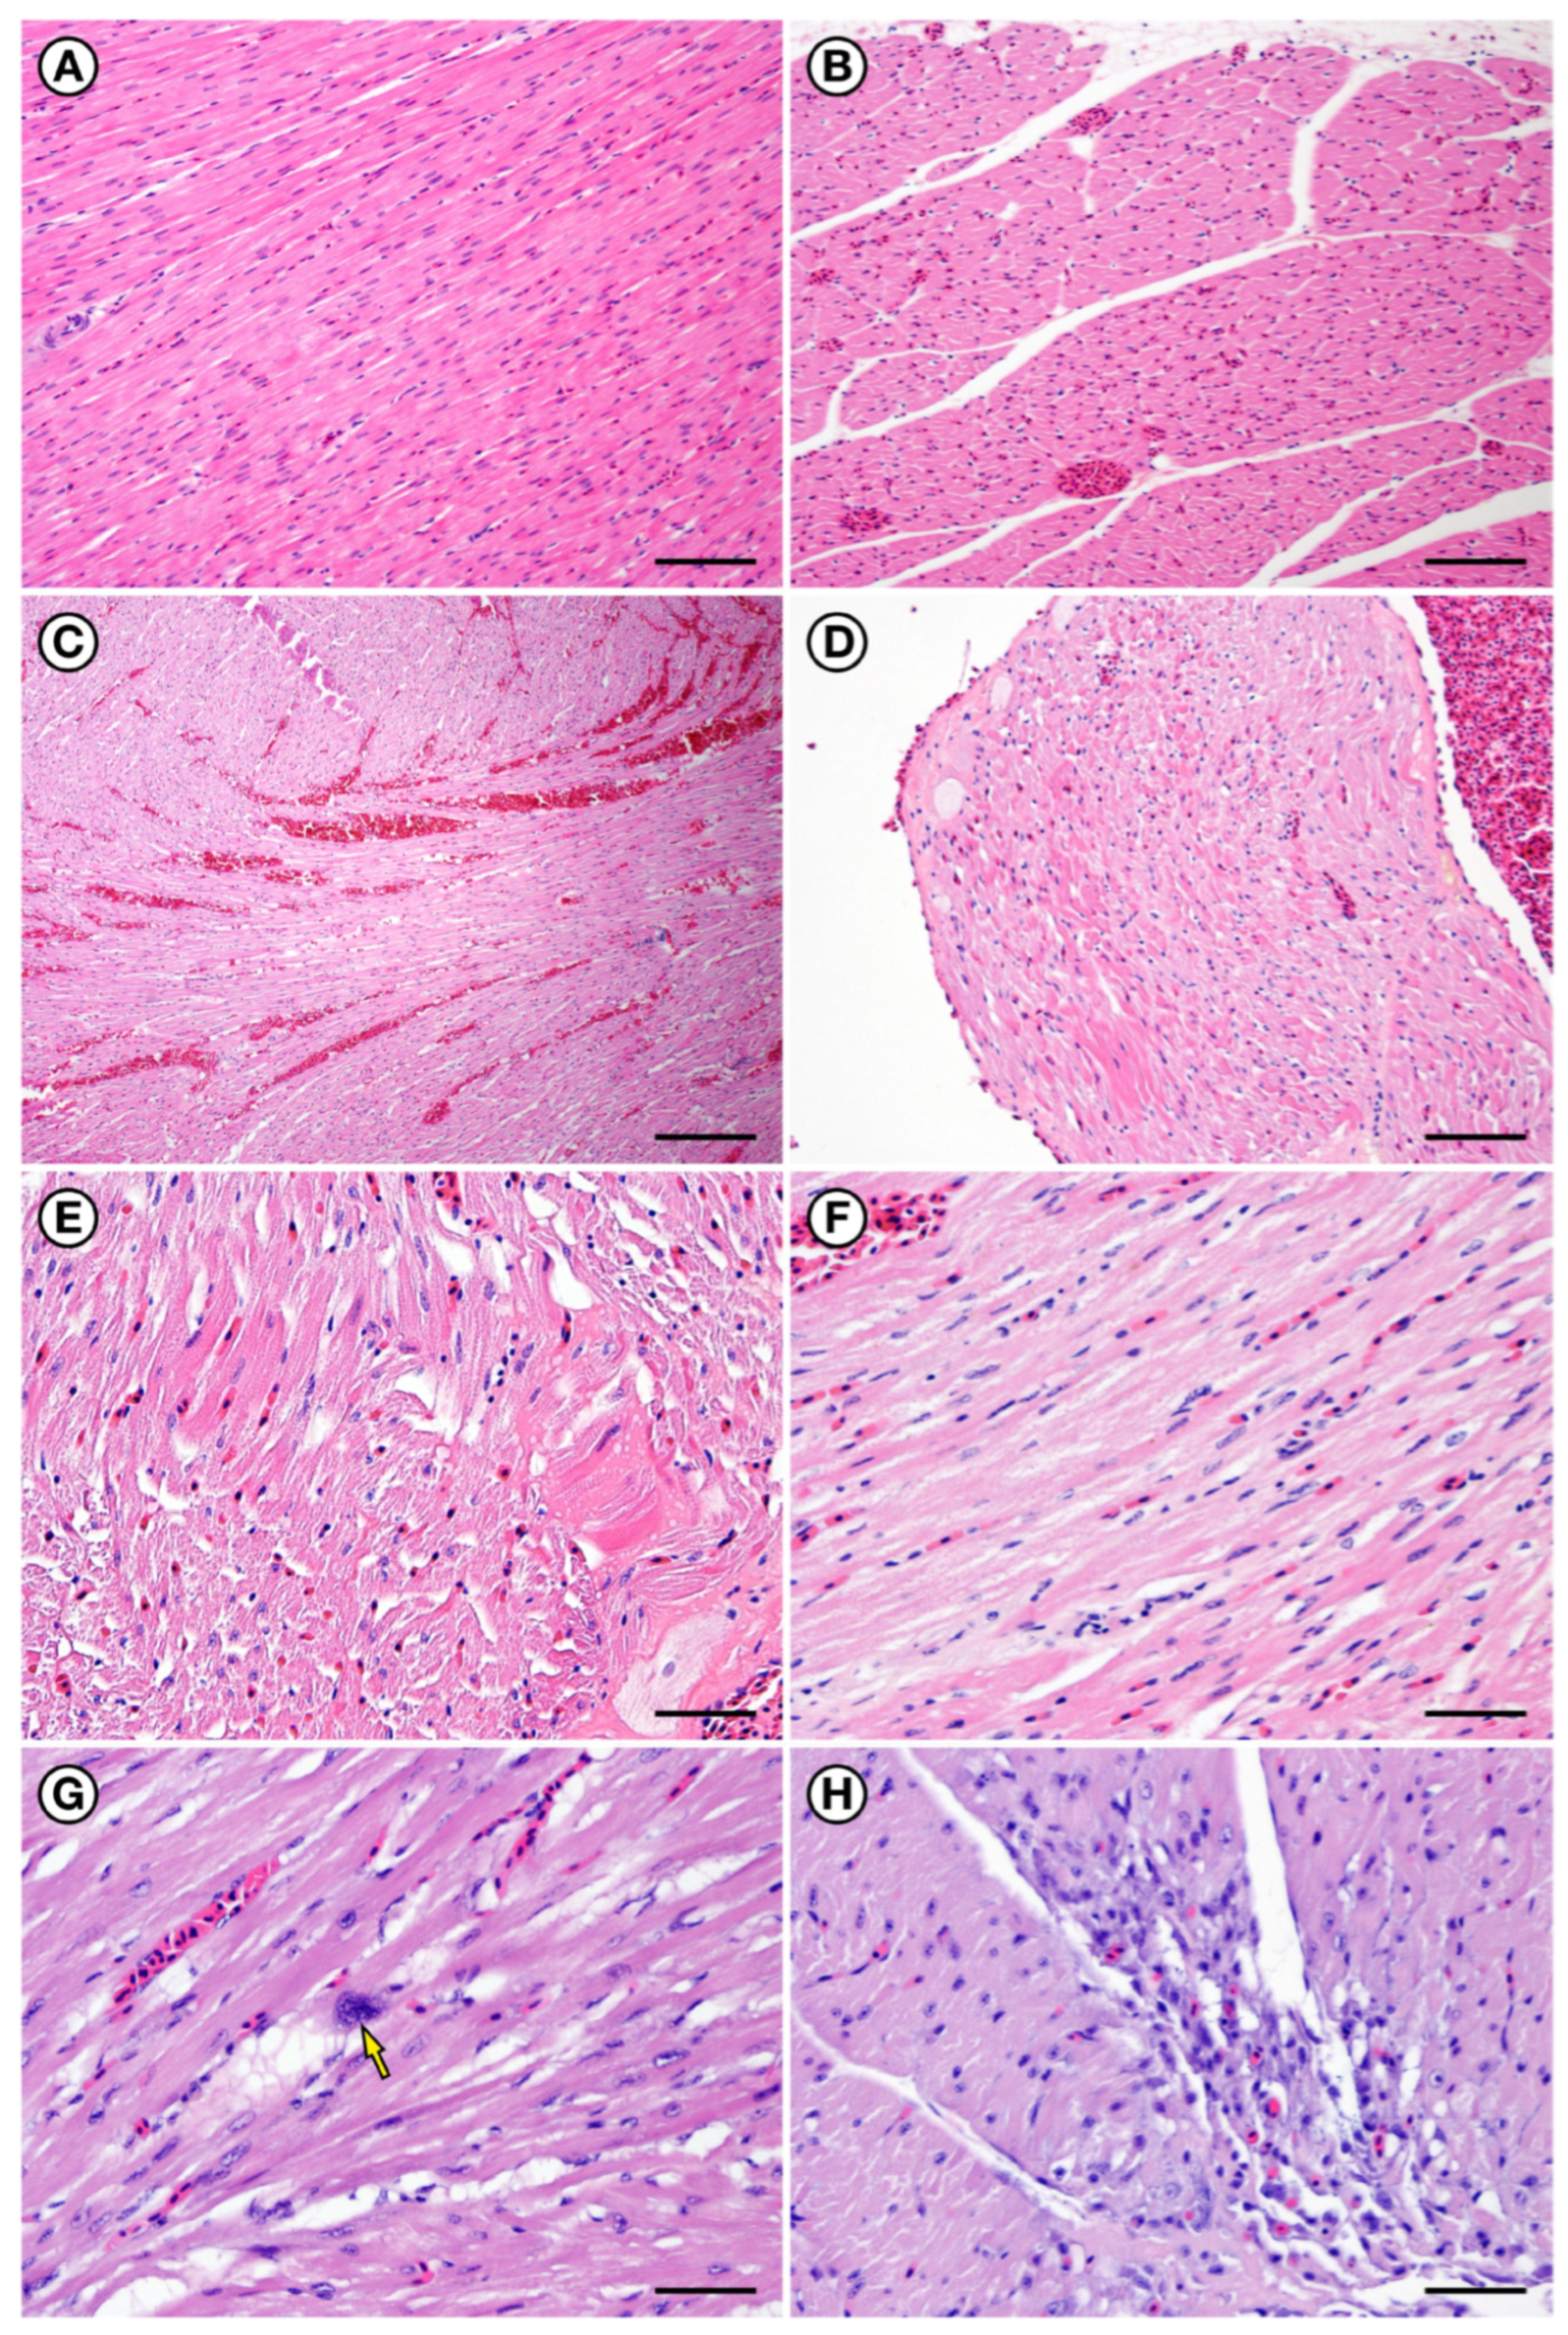
Cardiovascular pathology was common in birds with acute to chronic DA toxicosis. (A) Normal myocardium from a negative control PALO (18-0503). (B) Myocardium from a positive control BRPE (15-0100); there was moderate diffuse vascular congestion and possible mild interstitial edema. (C) Myocardium from a PALO (17-0086) with acute DA toxicosis; there was moderate diffuse vascular congestion and multifocal areas of blood pooling or microhemorrhage. (D) Myocardium from a PALO (17-0086) with acute DA toxicosis; although the vascular congestion was less severe, there was moderate variation in myofiber cytoplasmic staining. Some myofibers had pale, finely granular cytoplasm, while others exhibited homogenous, brightly eosinophilic cytoplasm suggestive of cell injury or necrosis. (E) Myocardium from a PALO (17-0086) with acute DA toxicosis; there was moderate variation in myofiber cytoplasmic staining and scattered bands of contracted, hypereosinophilic myofibers. (F) Myocardium from a PALO (IBR 17-0597) that was euthanized four days post-stranding; the variation in myofiber staining, with interspersed pale and hypereosinophilic myofibers, was especially prominent in this case. (G) Myocardium from a RTLO (IBR 17-0353) that was euthanized 18 days post-stranding; although the variation in myofiber staining was less prominent, the arrangement of myofibers was more haphazard, with intervening areas of pale, vacuolated adipocytes (presumptive fatty degeneration), and occasional enlarged, mis-shaped myofiber nuclei suggestive of abortive myofiber regeneration (arrow). (H) Focal area of myofiber loss, stromal collapse, and fatty degeneration in the myocardium of a RTLO (IBR 17-0353) that was euthanized 18 days post-stranding. All slides were stained with hematoxylin and eosin. Bars = 65, 65, 160, 65, 65, 65, 65, and 65 µm, respectively.
Figure 12.
Cardiovascular pathology was common in birds with acute to chronic DA toxicosis. (A) Normal myocardium from a negative control PALO (18-0503). (B) Myocardium from a positive control BRPE (15-0100); there was moderate diffuse vascular congestion and possible mild interstitial edema. (C) Myocardium from a PALO (17-0086) with acute DA toxicosis; there was moderate diffuse vascular congestion and multifocal areas of blood pooling or microhemorrhage. (D) Myocardium from a PALO (17-0086) with acute DA toxicosis; although the vascular congestion was less severe, there was moderate variation in myofiber cytoplasmic staining. Some myofibers had pale, finely granular cytoplasm, while others exhibited homogenous, brightly eosinophilic cytoplasm suggestive of cell injury or necrosis. (E) Myocardium from a PALO (17-0086) with acute DA toxicosis; there was moderate variation in myofiber cytoplasmic staining and scattered bands of contracted, hypereosinophilic myofibers. (F) Myocardium from a PALO (IBR 17-0597) that was euthanized four days post-stranding; the variation in myofiber staining, with interspersed pale and hypereosinophilic myofibers, was especially prominent in this case. (G) Myocardium from a RTLO (IBR 17-0353) that was euthanized 18 days post-stranding; although the variation in myofiber staining was less prominent, the arrangement of myofibers was more haphazard, with intervening areas of pale, vacuolated adipocytes (presumptive fatty degeneration), and occasional enlarged, mis-shaped myofiber nuclei suggestive of abortive myofiber regeneration (arrow). (H) Focal area of myofiber loss, stromal collapse, and fatty degeneration in the myocardium of a RTLO (IBR 17-0353) that was euthanized 18 days post-stranding. All slides were stained with hematoxylin and eosin. Bars = 65, 65, 160, 65, 65, 65, 65, and 65 µm, respectively.

Figure 13.
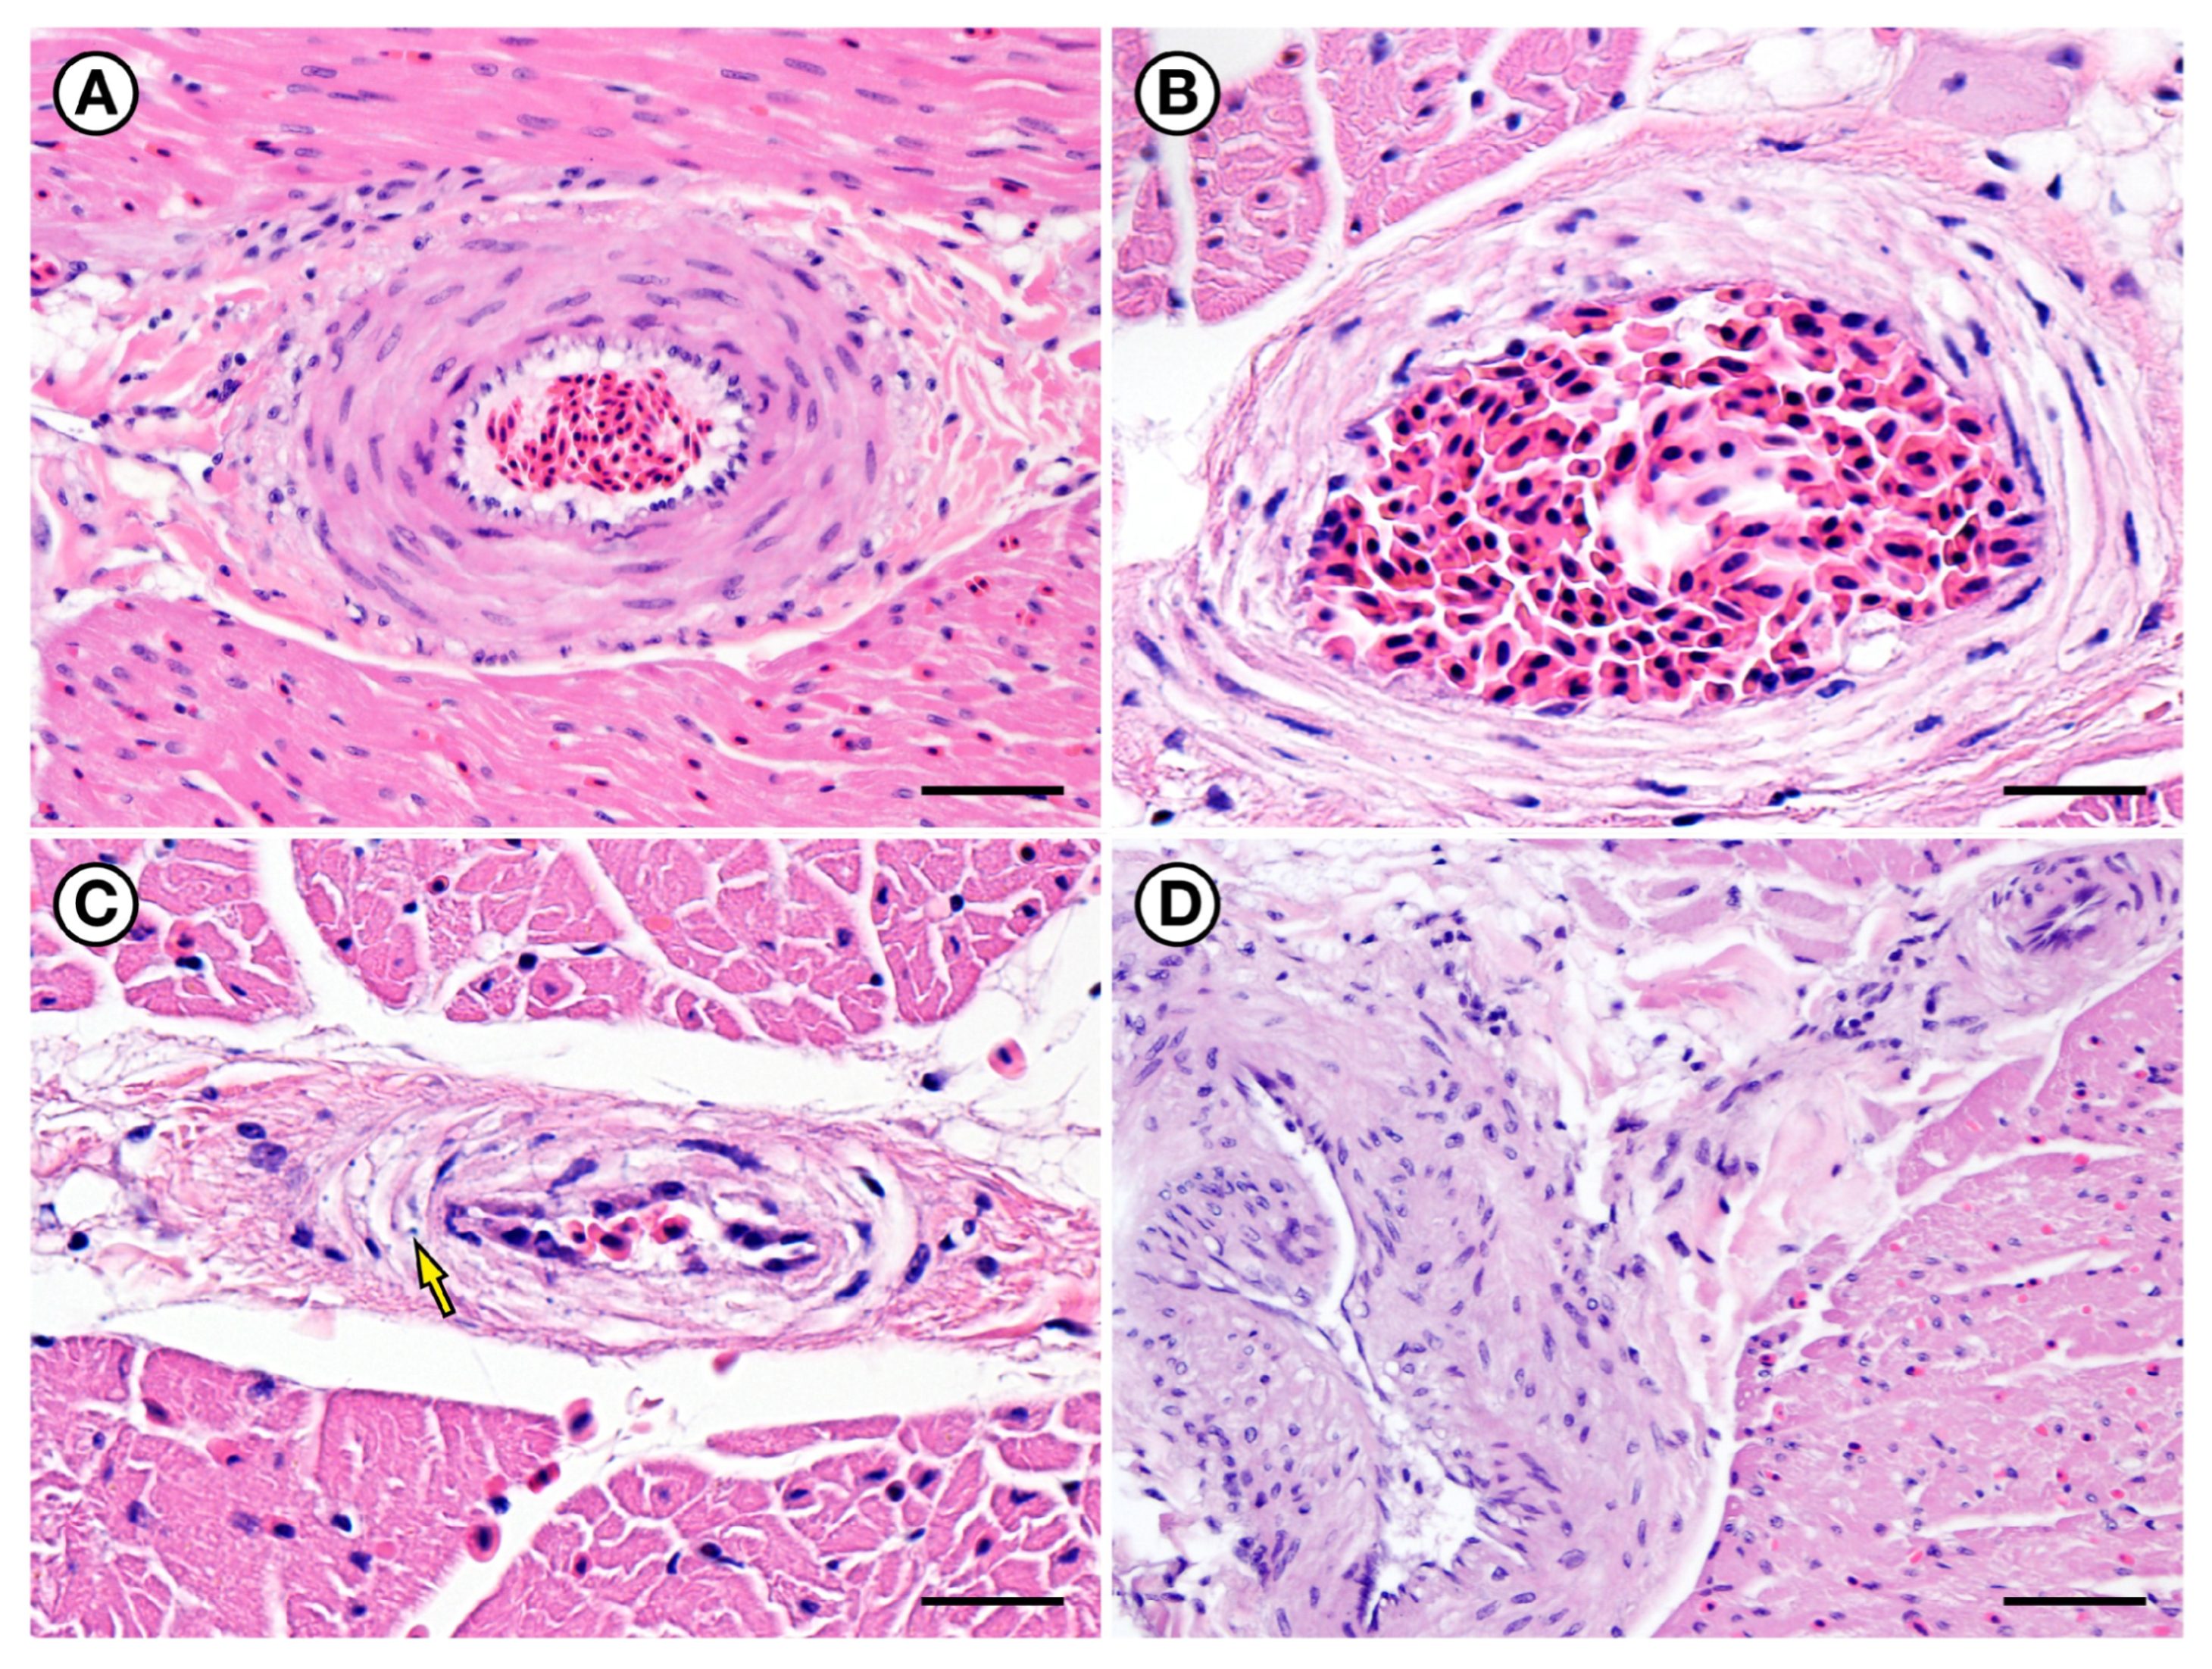
Mild to moderate coronary arterial pathology was common in birds with acute fatal and sublethal DA toxicosis. (A) Normal coronary arteriole from a negative control PALO (18-0503). (B) Coronary arteriole from a positive control BRPE (15-0100); mural smooth muscle cells were swollen, with pale cytoplasm and mild intercellular edema. (C) Coronary arteriole from a positive control BRPE (15-0100), showing suspected necrosis or apoptosis of mural smooth muscle cells, characterized by cell swelling, cytoplasmic pallor, and karyorrhectic nuclei (arrow). (D) Coronary arteriole from a PALO (IBR 17-0406) that was euthanized 17 days post-stranding; cell swelling and cytoplasmic pallor of mural smooth muscle cells were less severe than in the previous photos, but still apparent. All slides were stained with hematoxylin and eosin. Bars = 65, 30, 30, and 65 µm, respectively.
Figure 13.
Mild to moderate coronary arterial pathology was common in birds with acute fatal and sublethal DA toxicosis. (A) Normal coronary arteriole from a negative control PALO (18-0503). (B) Coronary arteriole from a positive control BRPE (15-0100); mural smooth muscle cells were swollen, with pale cytoplasm and mild intercellular edema. (C) Coronary arteriole from a positive control BRPE (15-0100), showing suspected necrosis or apoptosis of mural smooth muscle cells, characterized by cell swelling, cytoplasmic pallor, and karyorrhectic nuclei (arrow). (D) Coronary arteriole from a PALO (IBR 17-0406) that was euthanized 17 days post-stranding; cell swelling and cytoplasmic pallor of mural smooth muscle cells were less severe than in the previous photos, but still apparent. All slides were stained with hematoxylin and eosin. Bars = 65, 30, 30, and 65 µm, respectively.
Figure 14.
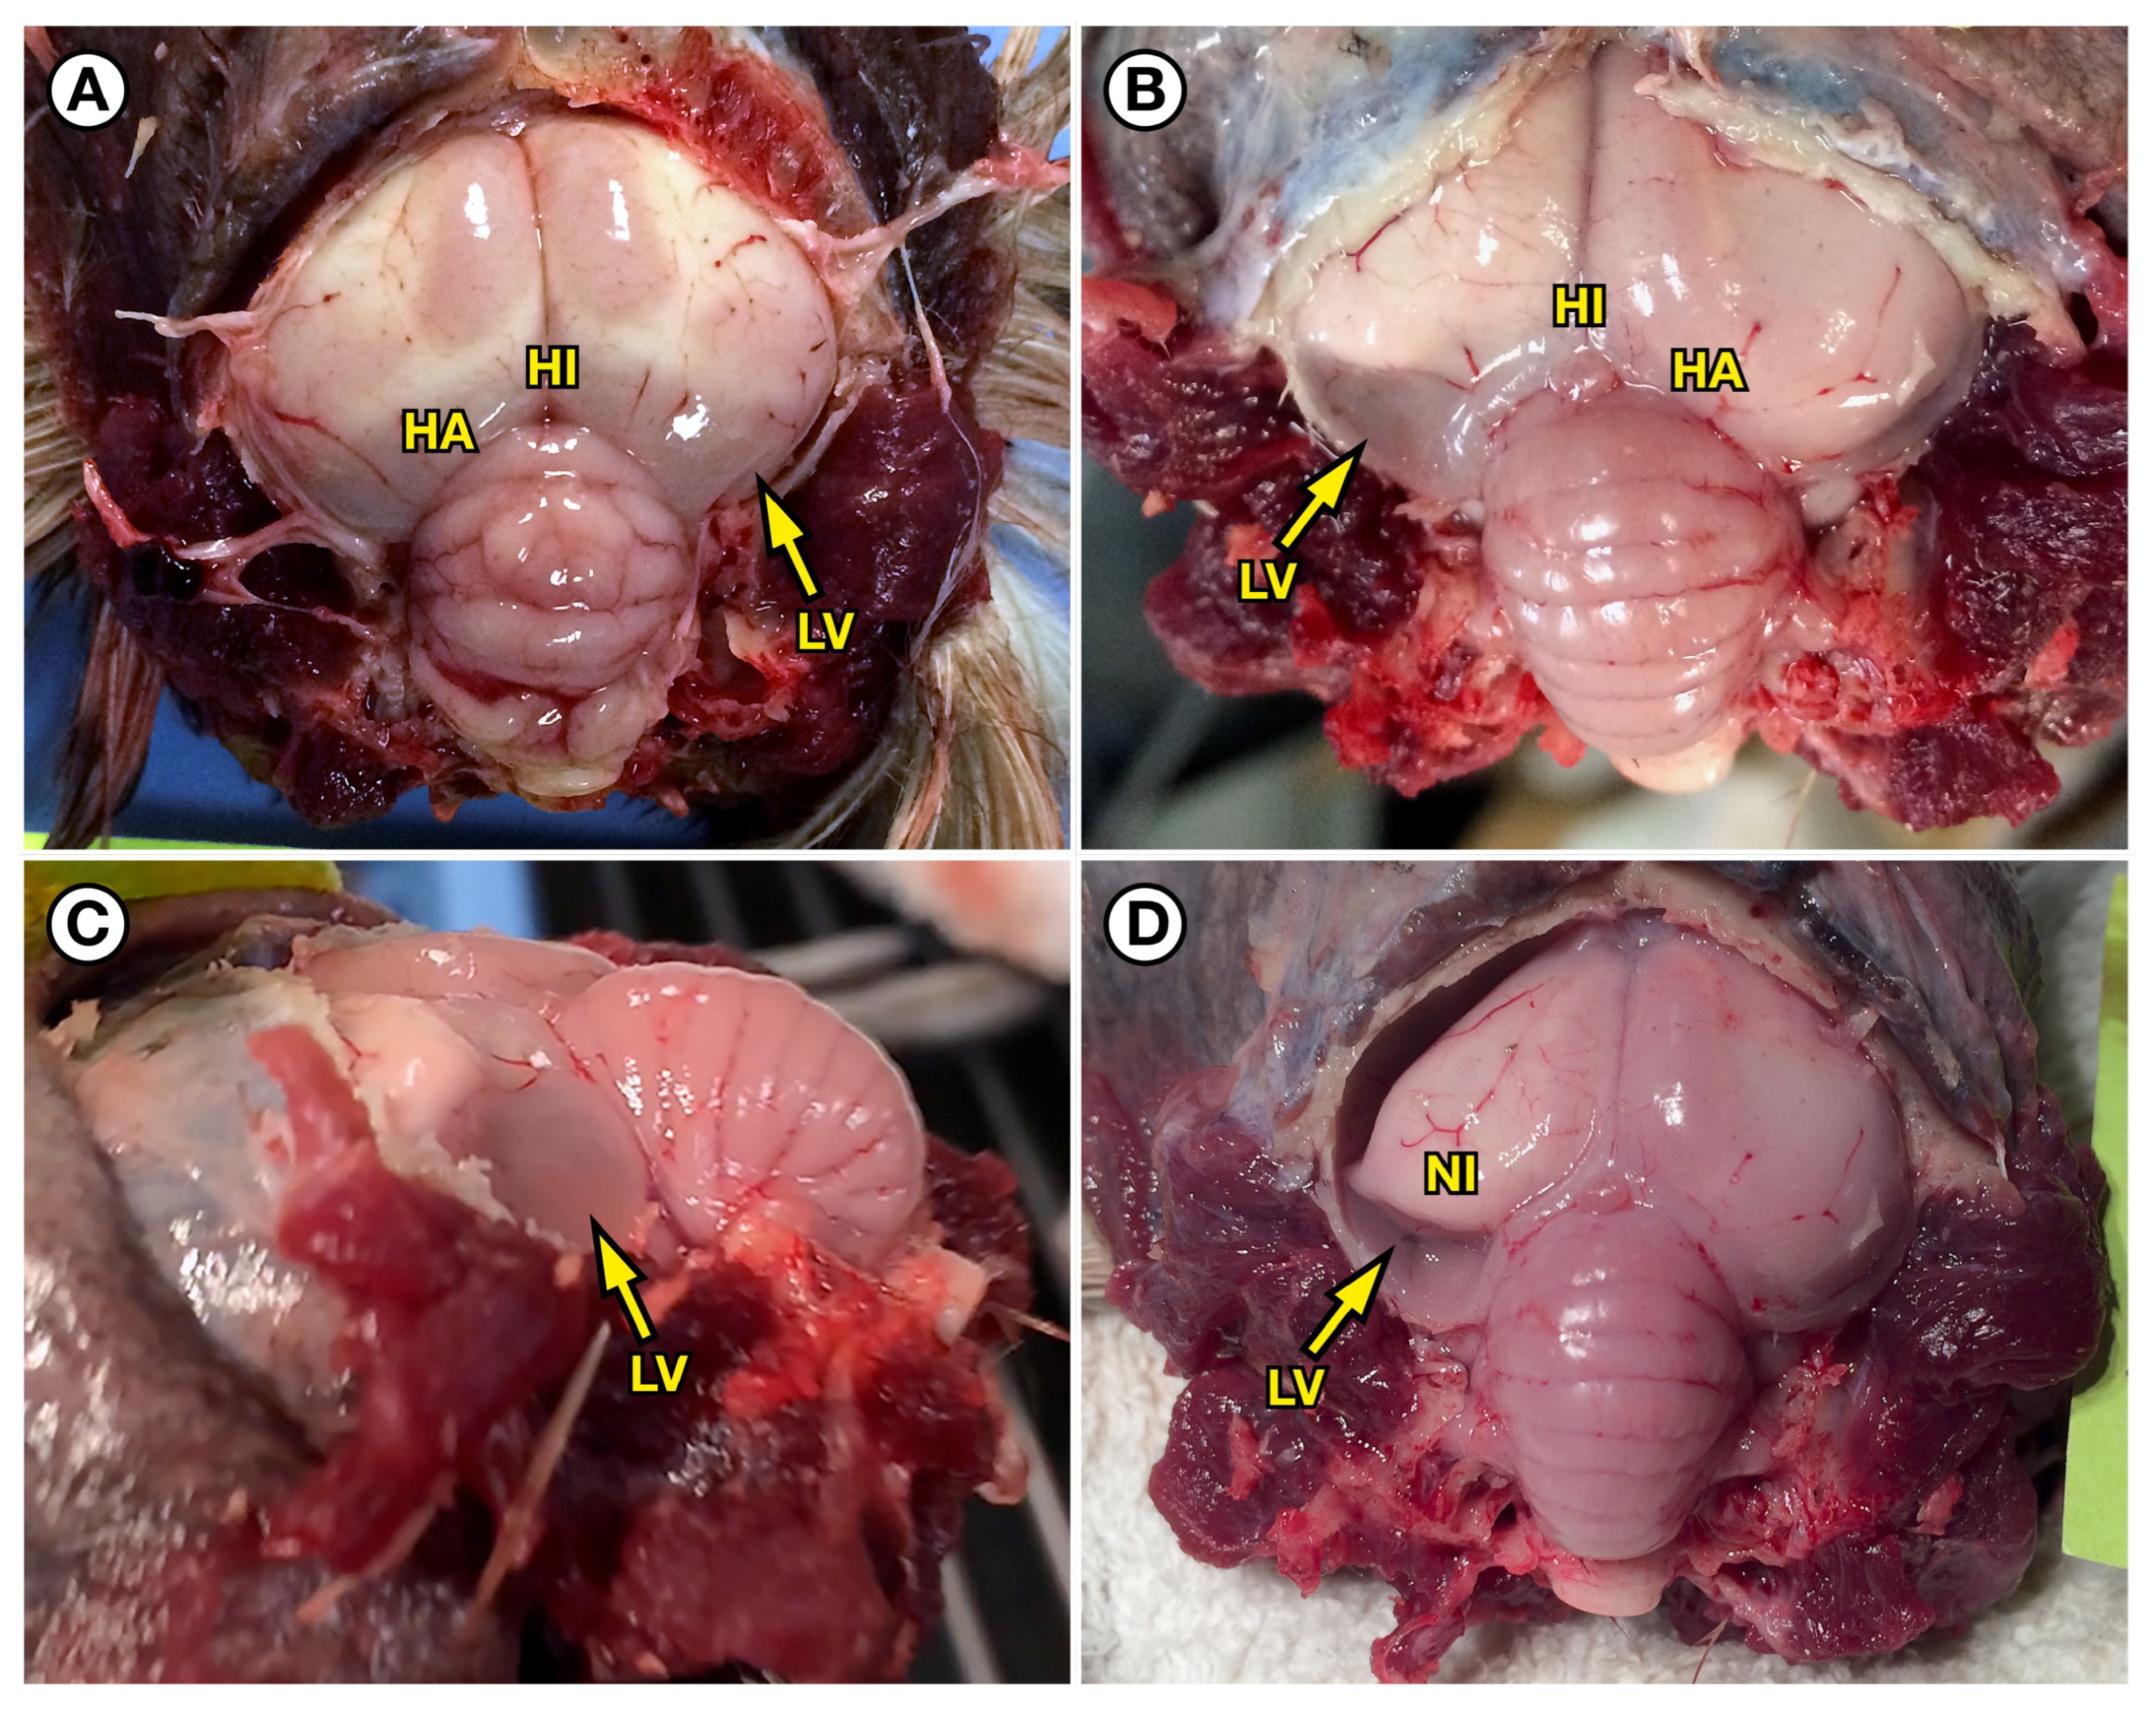
Birds surviving DA toxicosis for several weeks developed irreversible brain pathology that was especially severe and grossly apparent in the caudodorsal cerebrum. (
A) Brain from a PALO (IBR 17-0316) that was euthanized 57 days post-stranding due to severe, chronic behavioral abnormalities. Gross necropsy revealed severe, diffuse pallor of the dorsal and caudal cerebrum, mild diffuse cerebellar enlargement, and suspected meningeal edema. In addition, the hippocampus (HI) and hyperpallium apicale (HA) were severely atrophic and transparent, revealing the underlying markedly dilated and fluid-distended lateral ventricles (LV). Brain tissue beneath the lateral ventricles (the dorsal nidopallium) was also abnormally pale and atrophied, contributing to the apparent ventricular enlargement. (
B) Brain from a second PALO (IBR 17-0615) that was euthanized 86 days post-stranding with severe, chronic behavioral abnormalities. Gross findings in the brain were similar to those described in (
A) above but were more asymmetrical. Note the severe tissue loss in the left caudodorsal cerebrum, resulting in marked enlargement of the left lateral ventricle. The cerebellum was also mildly and diffusely enlarged. (
C) Left lateral view of the same brain (IBR 17-0615) shown in
Figure 14B above, showing severe atrophy of brain tissue in the left caudodorsal cerebral hemisphere and marked enlargement and fluid distension of the left lateral ventricle (LV). (
D) Caudodorsal view of the same brain (IBR 17-0615) shown in (
B,
C) after the hippocampus and hyperpallium apicale were removed over the left cerebral hemisphere, revealing the markedly enlarged lateral ventricle (LV) and the diffusely atrophic and pale dorsal nidopallium (NI) on the ventral surface of the lateral ventricle.
Figure 14.
Birds surviving DA toxicosis for several weeks developed irreversible brain pathology that was especially severe and grossly apparent in the caudodorsal cerebrum. (
A) Brain from a PALO (IBR 17-0316) that was euthanized 57 days post-stranding due to severe, chronic behavioral abnormalities. Gross necropsy revealed severe, diffuse pallor of the dorsal and caudal cerebrum, mild diffuse cerebellar enlargement, and suspected meningeal edema. In addition, the hippocampus (HI) and hyperpallium apicale (HA) were severely atrophic and transparent, revealing the underlying markedly dilated and fluid-distended lateral ventricles (LV). Brain tissue beneath the lateral ventricles (the dorsal nidopallium) was also abnormally pale and atrophied, contributing to the apparent ventricular enlargement. (
B) Brain from a second PALO (IBR 17-0615) that was euthanized 86 days post-stranding with severe, chronic behavioral abnormalities. Gross findings in the brain were similar to those described in (
A) above but were more asymmetrical. Note the severe tissue loss in the left caudodorsal cerebrum, resulting in marked enlargement of the left lateral ventricle. The cerebellum was also mildly and diffusely enlarged. (
C) Left lateral view of the same brain (IBR 17-0615) shown in
Figure 14B above, showing severe atrophy of brain tissue in the left caudodorsal cerebral hemisphere and marked enlargement and fluid distension of the left lateral ventricle (LV). (
D) Caudodorsal view of the same brain (IBR 17-0615) shown in (
B,
C) after the hippocampus and hyperpallium apicale were removed over the left cerebral hemisphere, revealing the markedly enlarged lateral ventricle (LV) and the diffusely atrophic and pale dorsal nidopallium (NI) on the ventral surface of the lateral ventricle.

Figure 15.
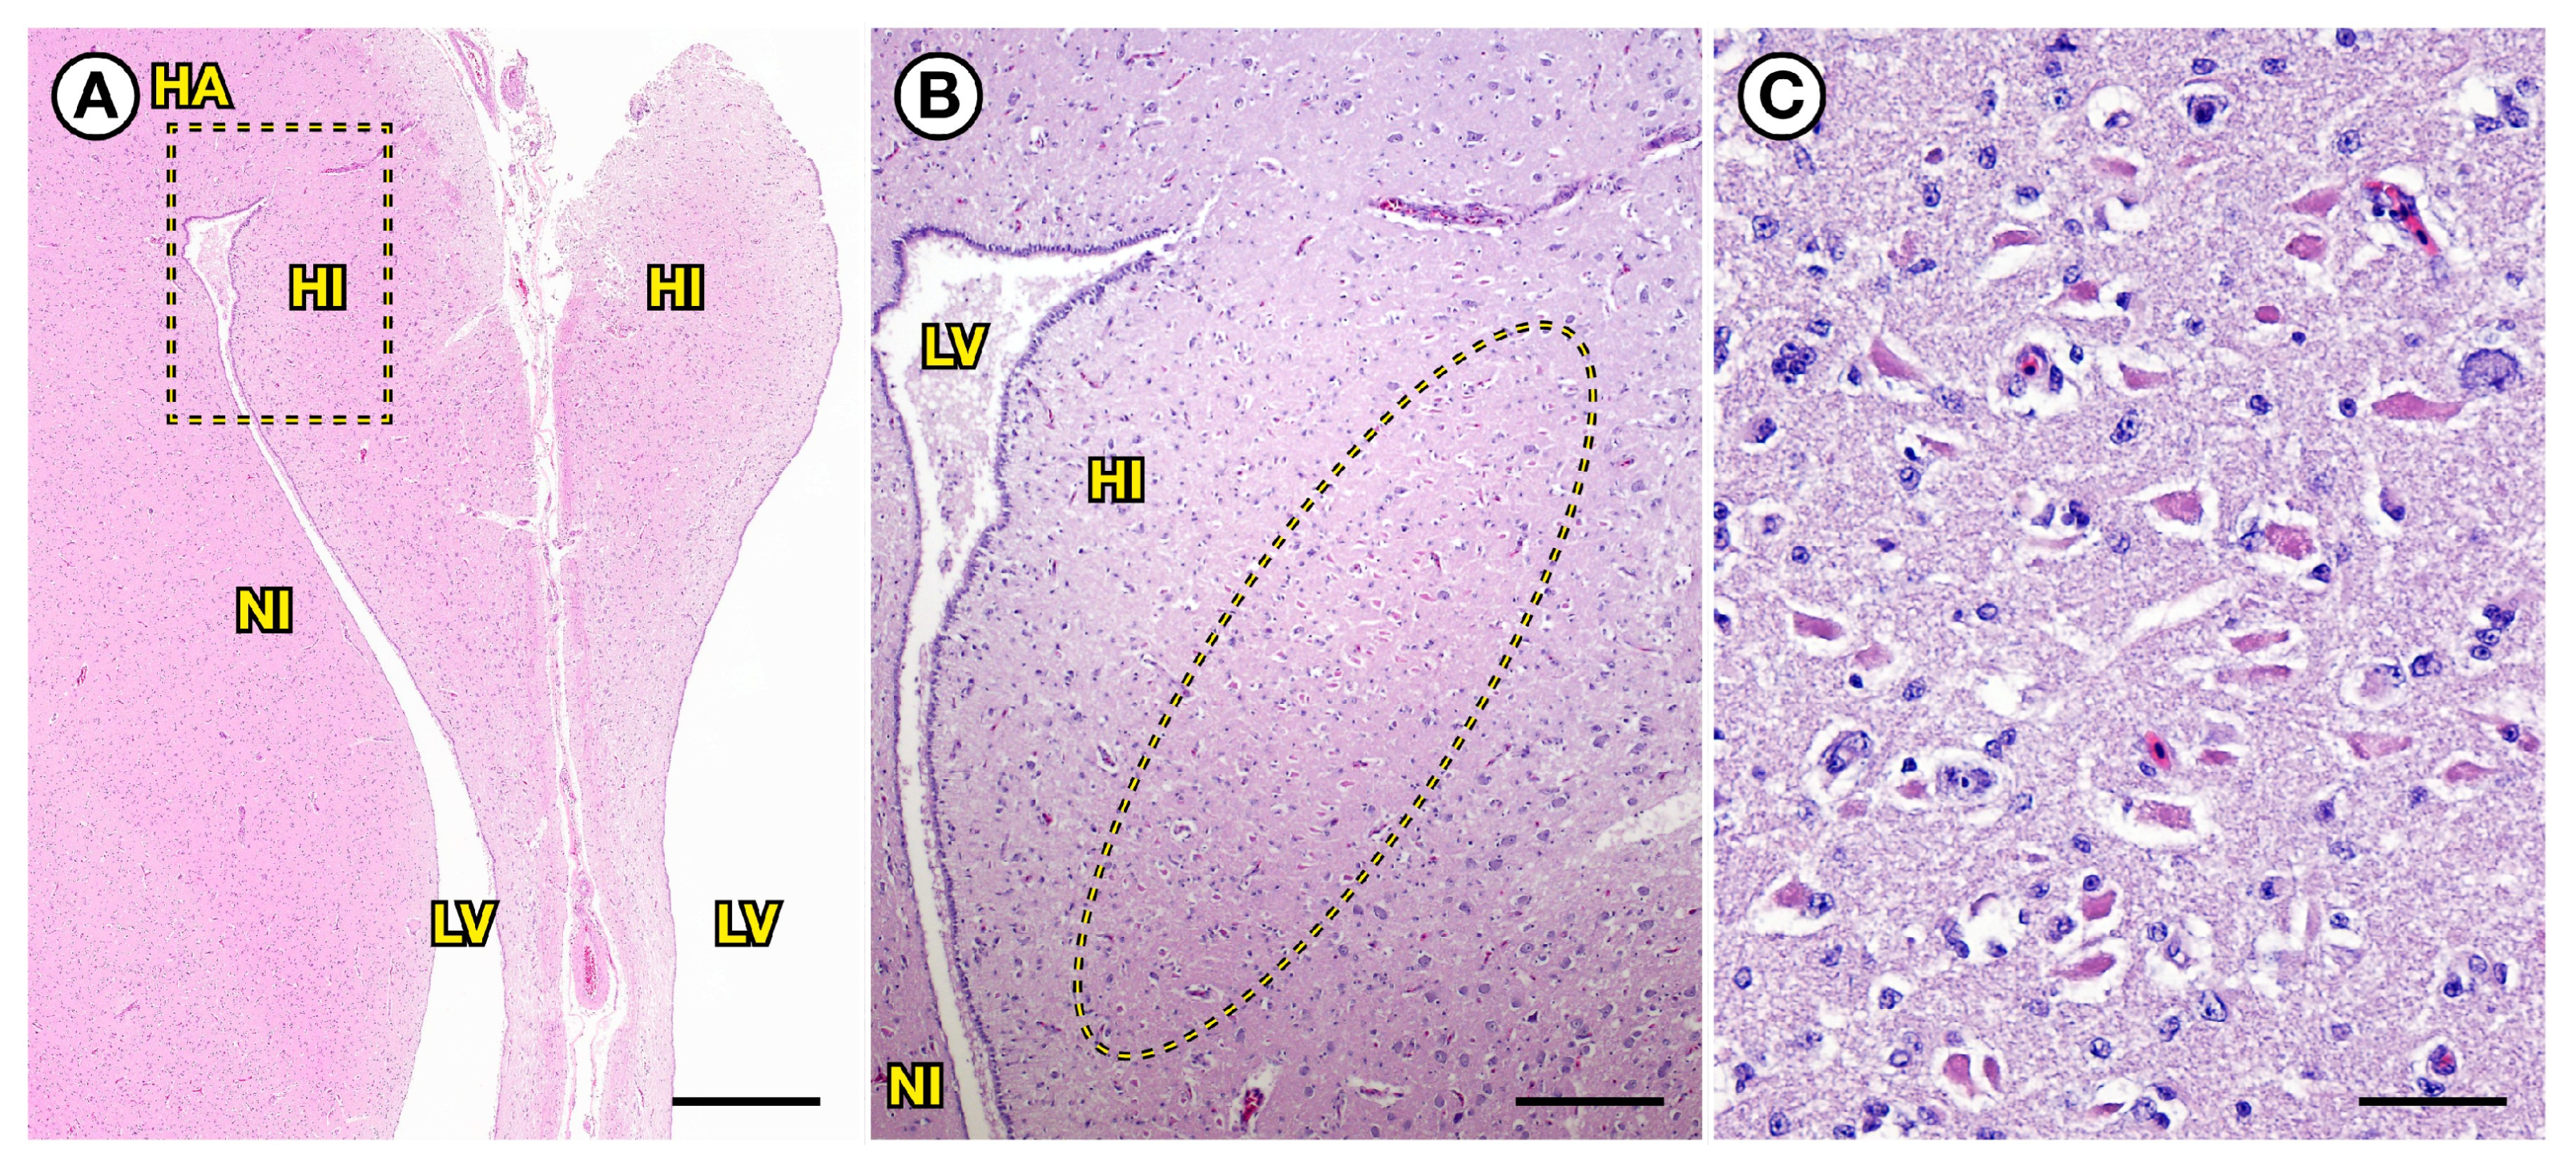
Severe neuronal necrosis was visible within the cerebral hippocampus of a loon that died due to subacute DA toxicosis. (A) Low-magnification view of caudal cerebrum from a PALO (IBR 17-0597) that was euthanized 4 days post-stranding. The severe congestion of the cerebrum, meninges, and choroid plexus that characterized brains of loons that were recovered freshly dead during the mass-mortality event was no longer visible. Locations of the hippocampus (HI), hyperpallium apicale (HA), dorsal nidopallium (NI), and lateral ventricles (LV) are shown. Tissue within the dashed line box is shown at higher magnification in (B). Lateral tissue displacement on the right side of the section is artifactual. (B) Higher-magnification view of the caudodorsal cerebral midline of the same PALO (IBR 17-0597) as in (A). Locations of the hippocampus (HI), dorsal nidopallium (NI), and lateral ventricles (LV) are shown. A linear band of swollen neurons with brightly eosinophilic cytoplasm was visible in the hippocampus (inside of the ellipse), and scant proteinaceous material was present in the ventricle (LV). (C) (IBR 17-0597) Higher-magnification view of the area of hippocampus delineated by the ellipse in (B) above, showing the linear band of swollen neurons with brightly eosinophilic cytoplasm (neuronal necrosis) accompanied by mild to moderate perineuronal gliosis. All slides were stained with hematoxylin and eosin. Bars = 650, 160, and 30 µm, respectively.
Figure 15.
Severe neuronal necrosis was visible within the cerebral hippocampus of a loon that died due to subacute DA toxicosis. (A) Low-magnification view of caudal cerebrum from a PALO (IBR 17-0597) that was euthanized 4 days post-stranding. The severe congestion of the cerebrum, meninges, and choroid plexus that characterized brains of loons that were recovered freshly dead during the mass-mortality event was no longer visible. Locations of the hippocampus (HI), hyperpallium apicale (HA), dorsal nidopallium (NI), and lateral ventricles (LV) are shown. Tissue within the dashed line box is shown at higher magnification in (B). Lateral tissue displacement on the right side of the section is artifactual. (B) Higher-magnification view of the caudodorsal cerebral midline of the same PALO (IBR 17-0597) as in (A). Locations of the hippocampus (HI), dorsal nidopallium (NI), and lateral ventricles (LV) are shown. A linear band of swollen neurons with brightly eosinophilic cytoplasm was visible in the hippocampus (inside of the ellipse), and scant proteinaceous material was present in the ventricle (LV). (C) (IBR 17-0597) Higher-magnification view of the area of hippocampus delineated by the ellipse in (B) above, showing the linear band of swollen neurons with brightly eosinophilic cytoplasm (neuronal necrosis) accompanied by mild to moderate perineuronal gliosis. All slides were stained with hematoxylin and eosin. Bars = 650, 160, and 30 µm, respectively.

Figure 16.
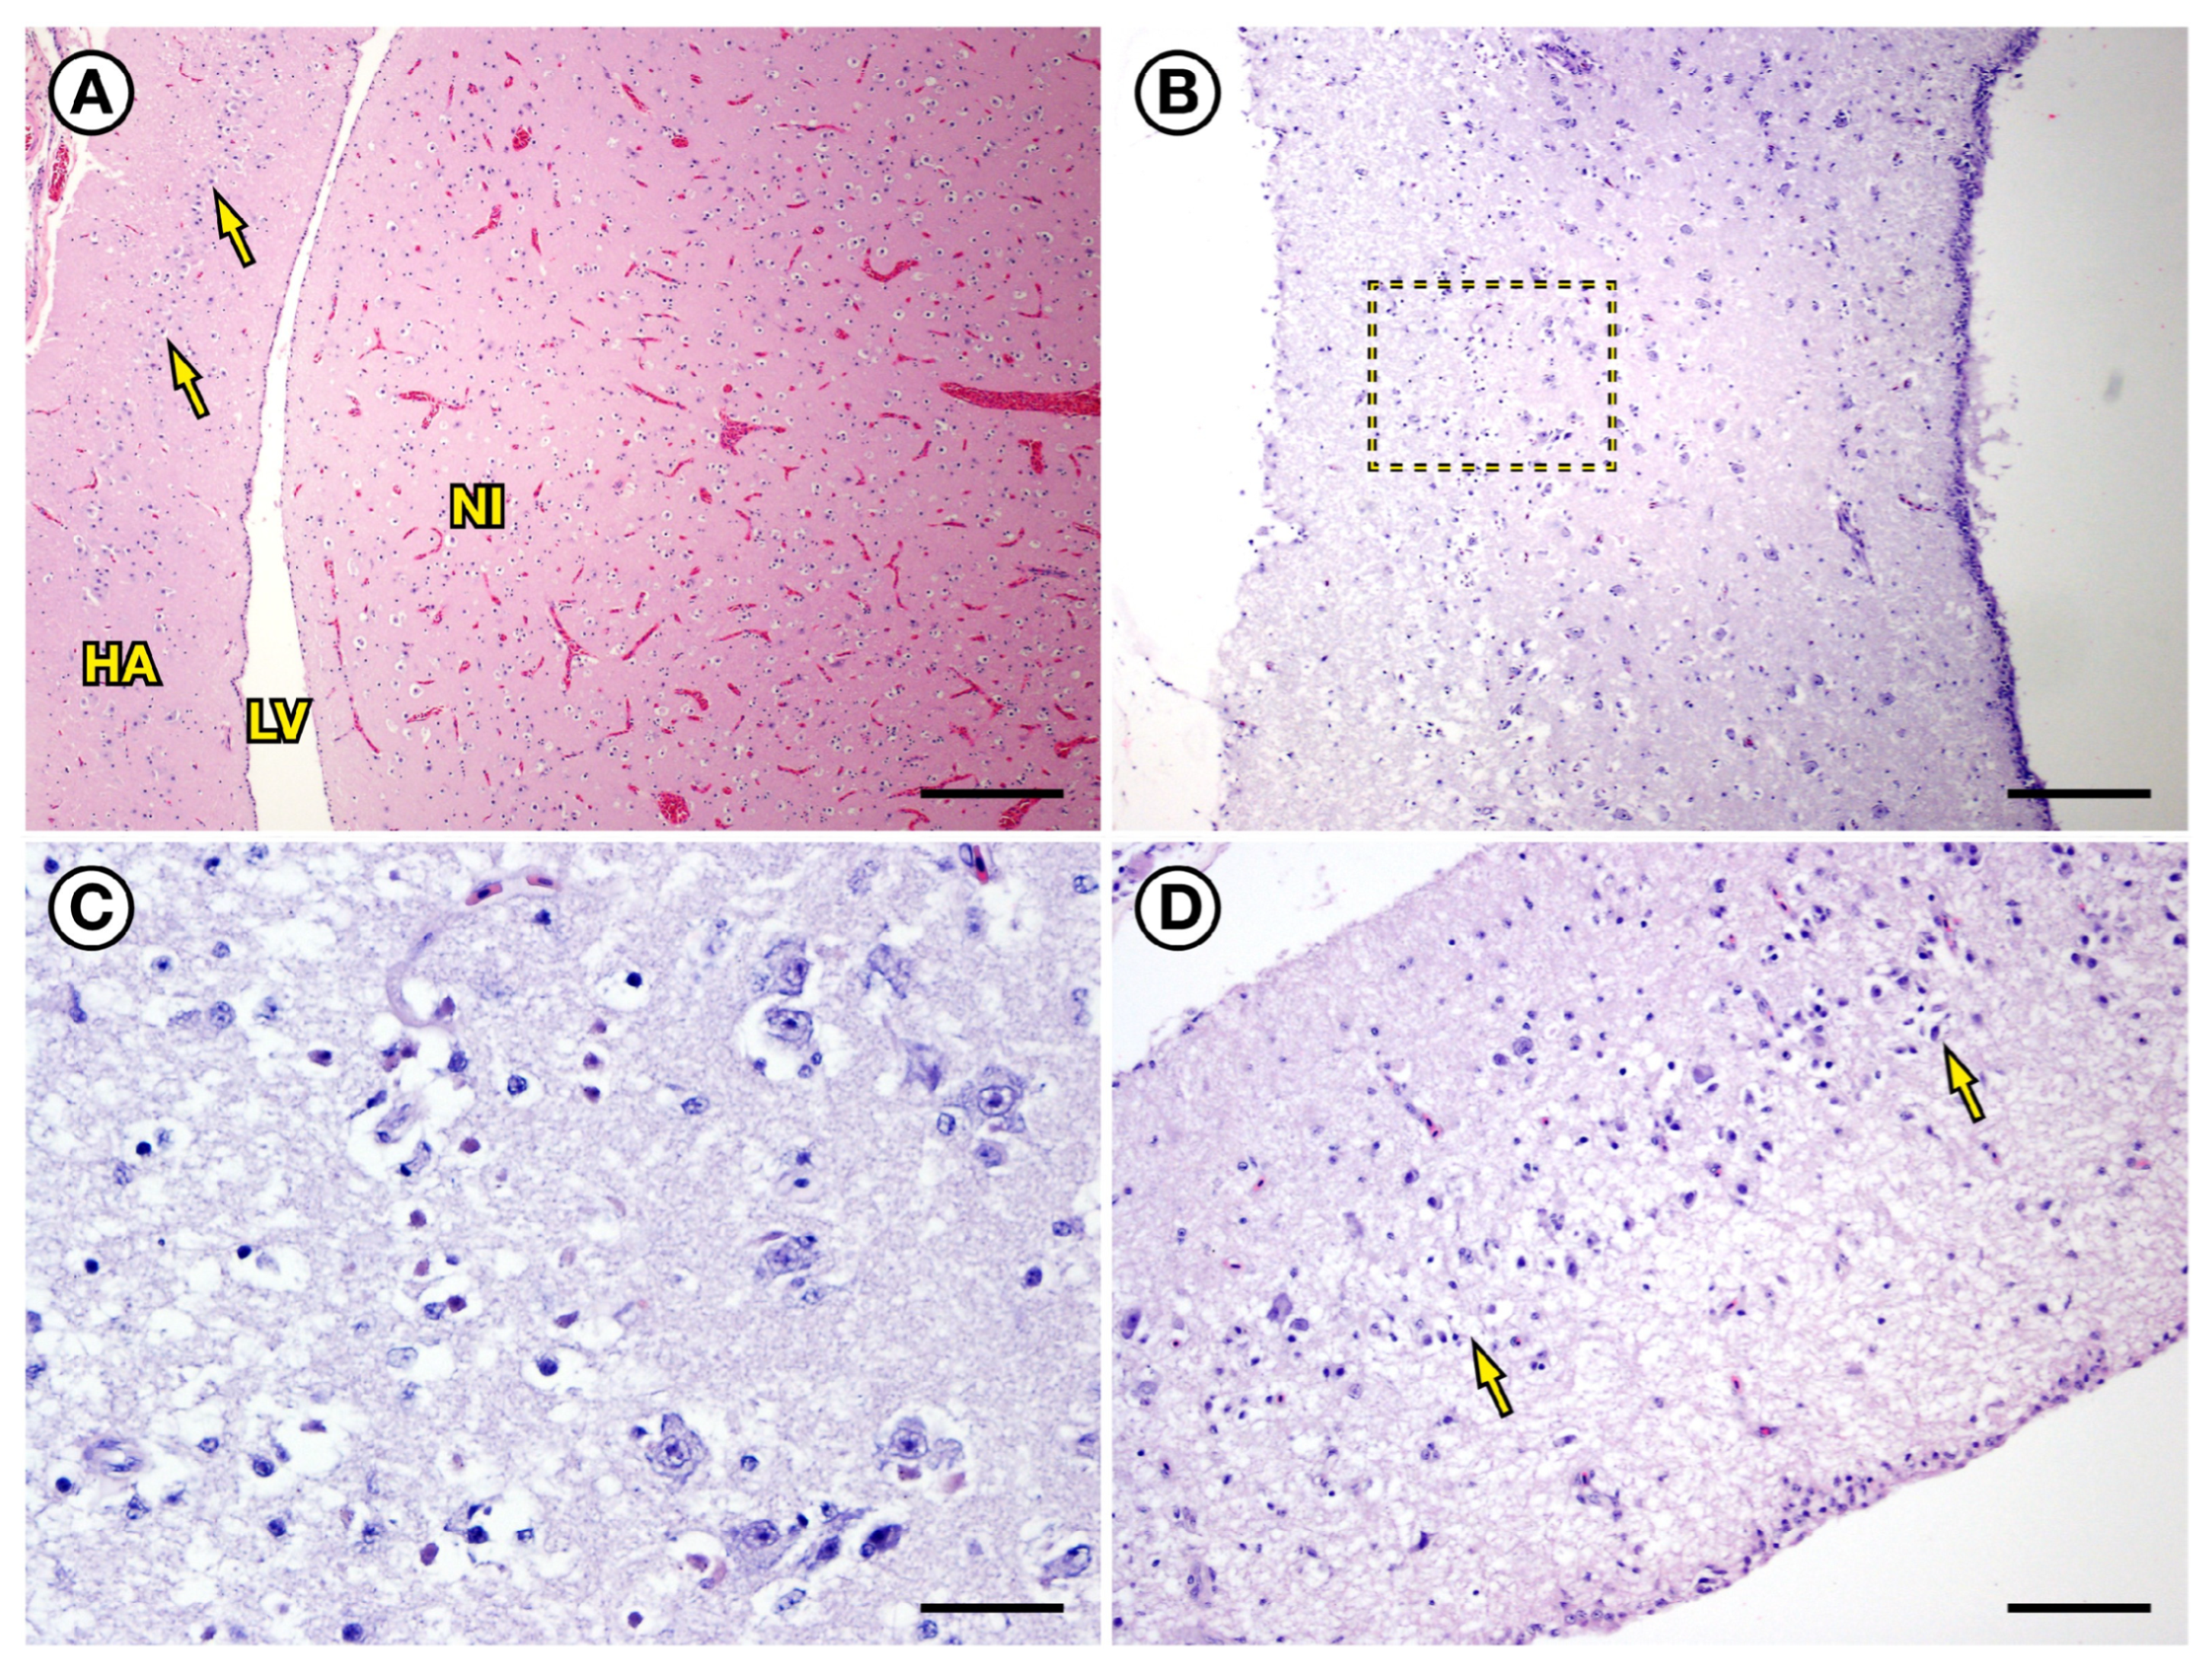
Severe neuronal necrosis was visible in the hyperpallium apicale region of the caudodorsal cerebrum of a loon that died due to subacute DA toxicosis. (A) Hyperpallium apicale (HA), lateral ventricle (LV), and dorsal nidopallium (NI) from the caudodorsal cerebrum of a PALO with acute, fatal DA toxicosis (17-0086), shown for reference. Although there was marked diffuse congestion, the tissue was otherwise microscopically unremarkable. Even at this low magnification, a prominent linear band of neurons is visible running longitudinally along the HA (arrows). (B) Mild to moderate diffuse tissue pallor, spongiosis, and gliosis in the cerebral HA from a PALO (IBR 17-0597) that was euthanized 4 days post-stranding. The region within the dashed box is shown at higher magnification in (C). (C) (IBR 17-0597) Higher-magnification inset from (B) above; numerous small neurons and/or astroglia are necrotic, characterized by brightly eosinophilic cytoplasm, karyorrhexis, and karyolysis. (D) HA from a PALO (IBR 17-0406) that was euthanized after 17 days in care. There was diffuse tissue pallor, spongiosis, and gliosis, and the linear band of neurons running longitudinally along the HA was partially disrupted due to neuronal loss(arrows; compare with (A)). All slides were stained with hematoxylin and eosin. Bars = 325, 160, 30, and 60 µm, respectively.
Figure 16.
Severe neuronal necrosis was visible in the hyperpallium apicale region of the caudodorsal cerebrum of a loon that died due to subacute DA toxicosis. (A) Hyperpallium apicale (HA), lateral ventricle (LV), and dorsal nidopallium (NI) from the caudodorsal cerebrum of a PALO with acute, fatal DA toxicosis (17-0086), shown for reference. Although there was marked diffuse congestion, the tissue was otherwise microscopically unremarkable. Even at this low magnification, a prominent linear band of neurons is visible running longitudinally along the HA (arrows). (B) Mild to moderate diffuse tissue pallor, spongiosis, and gliosis in the cerebral HA from a PALO (IBR 17-0597) that was euthanized 4 days post-stranding. The region within the dashed box is shown at higher magnification in (C). (C) (IBR 17-0597) Higher-magnification inset from (B) above; numerous small neurons and/or astroglia are necrotic, characterized by brightly eosinophilic cytoplasm, karyorrhexis, and karyolysis. (D) HA from a PALO (IBR 17-0406) that was euthanized after 17 days in care. There was diffuse tissue pallor, spongiosis, and gliosis, and the linear band of neurons running longitudinally along the HA was partially disrupted due to neuronal loss(arrows; compare with (A)). All slides were stained with hematoxylin and eosin. Bars = 325, 160, 30, and 60 µm, respectively.

Figure 17.
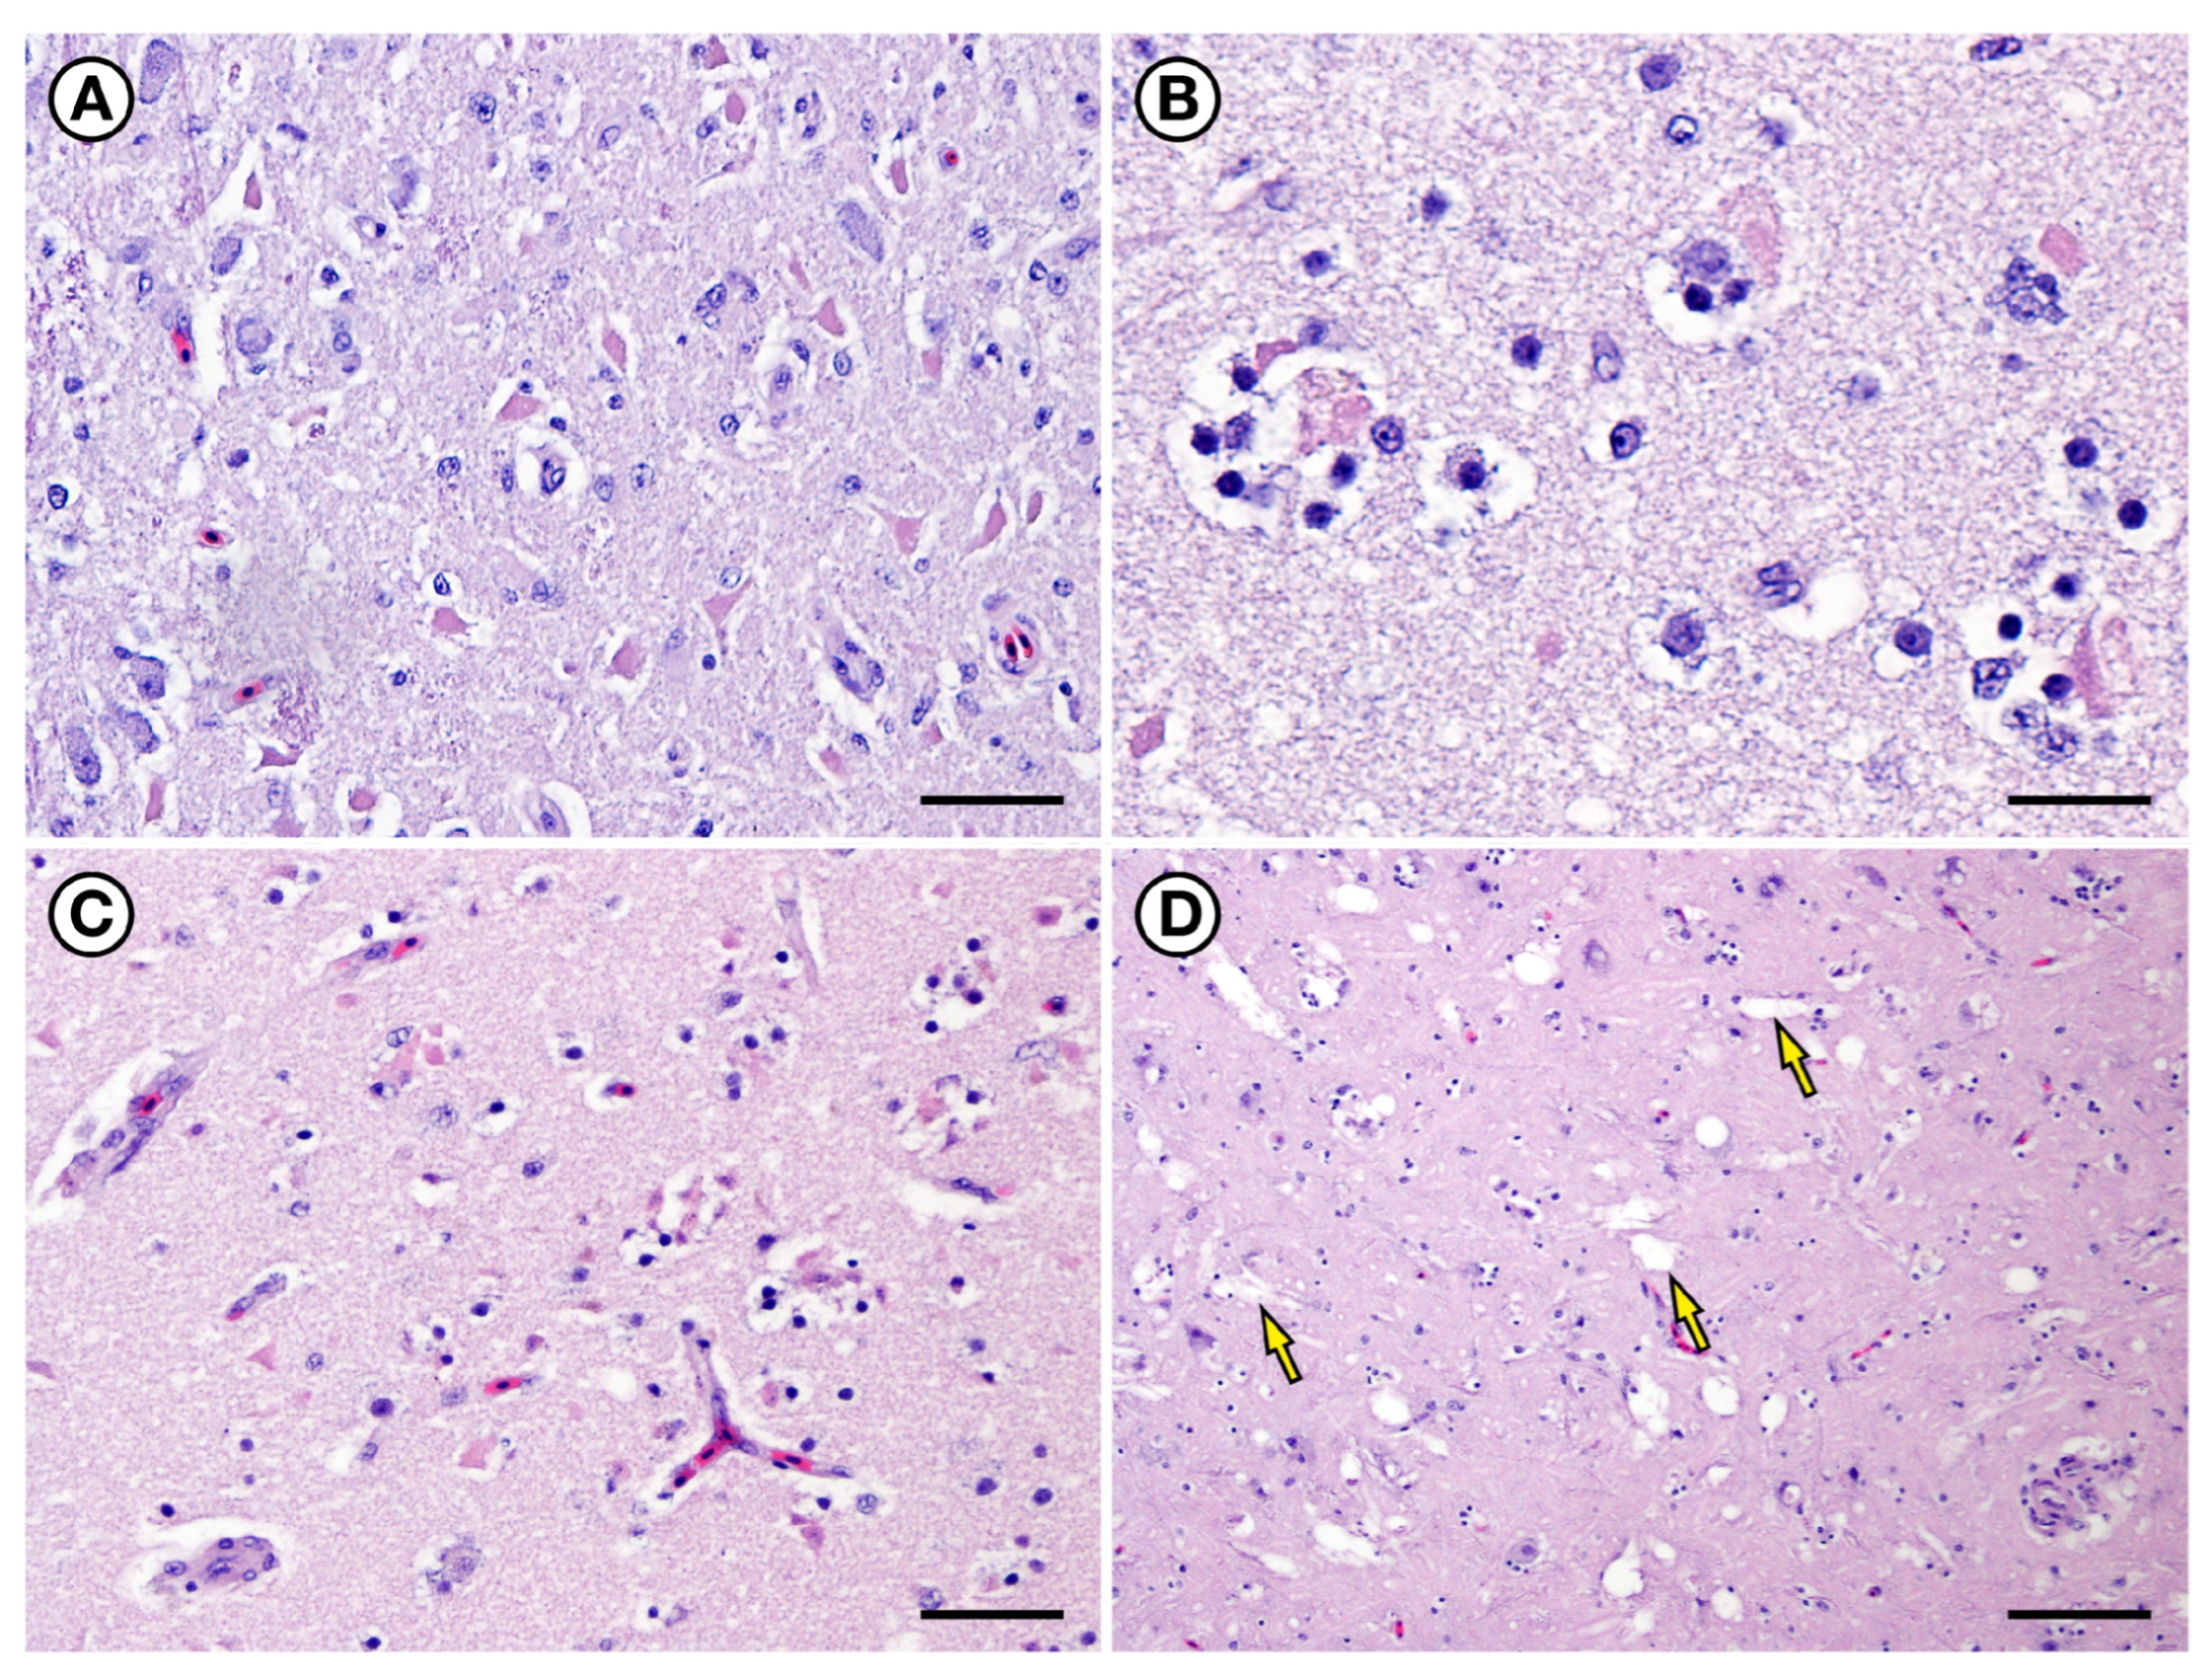
Severe neuronal necrosis, neurophagocytosis, and astrogliosis were visible in the cerebrum of a loon that was euthanized due to subacute DA toxicosis. (A) Numerous swollen, hypereosinophilic (aka “red dead”) neurons and moderate gliosis in the hippocampus of a PALO (IBR 17-0597) that was euthanized 4 days post-stranding. (B) (IBR 17-0597) In some areas of the brain, swollen glial or phagocytic cells with prominent pale cytoplasm surrounded and were phagocytosing necrotic neurons (neurophagocytosis). (C) (IBR 17-0597) Areas of neuronal necrosis and neurophagocytosis were often accompanied by perilesional vascular hypertrophy. (D) (IBR 17-0597) Multifocal axonal degeneration (arrows) was due to necrosis of the corresponding neurons. All slides were stained with hematoxylin and eosin. Bars = 35, 16, 35, and 65 µm, respectively.
Figure 17.
Severe neuronal necrosis, neurophagocytosis, and astrogliosis were visible in the cerebrum of a loon that was euthanized due to subacute DA toxicosis. (A) Numerous swollen, hypereosinophilic (aka “red dead”) neurons and moderate gliosis in the hippocampus of a PALO (IBR 17-0597) that was euthanized 4 days post-stranding. (B) (IBR 17-0597) In some areas of the brain, swollen glial or phagocytic cells with prominent pale cytoplasm surrounded and were phagocytosing necrotic neurons (neurophagocytosis). (C) (IBR 17-0597) Areas of neuronal necrosis and neurophagocytosis were often accompanied by perilesional vascular hypertrophy. (D) (IBR 17-0597) Multifocal axonal degeneration (arrows) was due to necrosis of the corresponding neurons. All slides were stained with hematoxylin and eosin. Bars = 35, 16, 35, and 65 µm, respectively.
Figure 18.
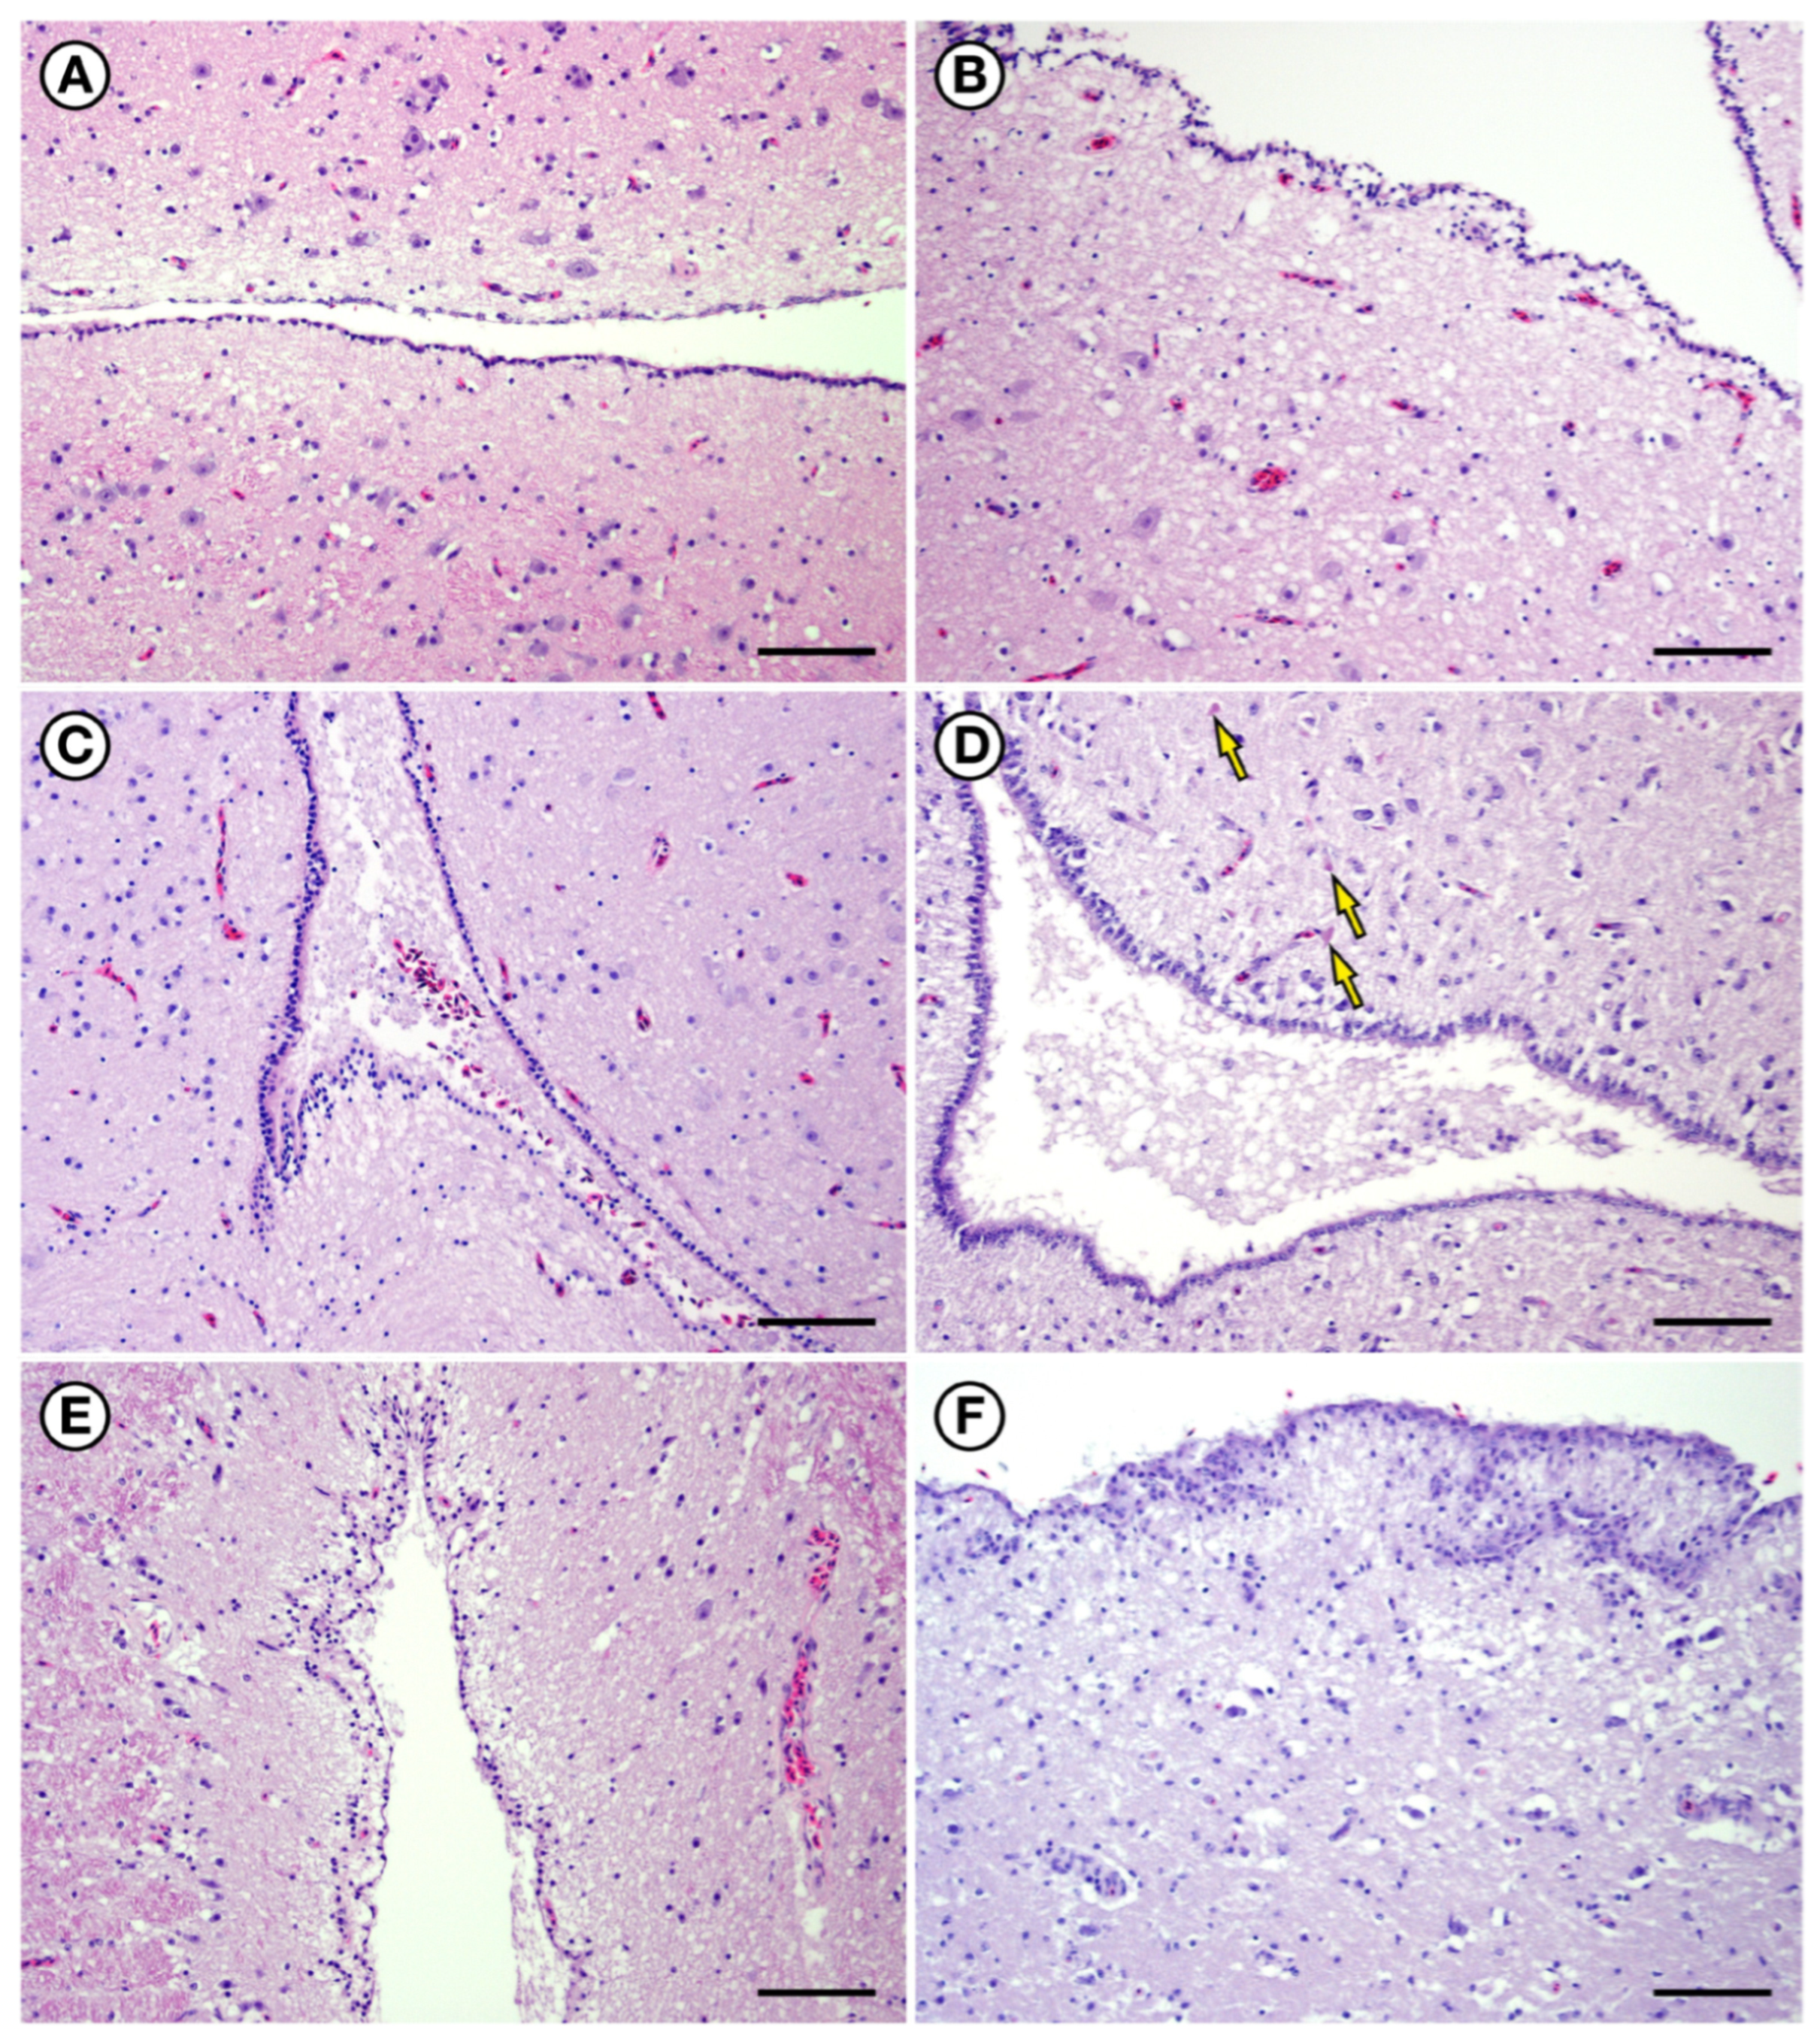
Ventricular and periventricular pathology was common in the cerebrum of birds with DA toxicosis. (A) Microscopic view of normal lateral ventricle from a negative control PALO (18-0503). (B) Lateral ventricle from a positive control BRPE (15-0100); the ependymal surface was irregular, with mild cytoplasmic vacuolation of ependymal cells, and the periventricular neuropil was congested and spongiotic. (C) Lateral ventricle from a PALO (17-0086) with acute, fatal DA toxicosis; the periventricular neuropil was congested and spongiotic, and there was scant hemorrhage admixed with proteinacious material in the ventricular lumen. (D) Lateral ventricle from a PALO (IBR 17-0597) that was euthanized 4 days post-stranding; the periventricular neuropil was congested and spongiotic, the ventricular lumen contained proteinacious material, and several necrotic (e.g., “red dead”) neurons were visible near the ventricles (arrows). (E) Lateral ventricle from a RTLO (IBR 17-0353); that was euthanized 18 days post-stranding. Although the vascular congestion had normalized, there was moderate periventricular spongiosis, and the ventricular surface was irregular and uneven with a partial double layer of ependymal cells. (F) Lateral ventricle from a PALO (IBR 17-0406) that was euthanized 17 days post-stranding; There was moderate perivascular spongiosis, and the ventricular surface was irregular and uneven, with multiple layers of ependymal cells forming small clefts and invaginations. All slides were stained with hematoxylin and eosin. Bars = 160, 65, 160, 160, 160, and 160 µm, respectively.
Figure 18.
Ventricular and periventricular pathology was common in the cerebrum of birds with DA toxicosis. (A) Microscopic view of normal lateral ventricle from a negative control PALO (18-0503). (B) Lateral ventricle from a positive control BRPE (15-0100); the ependymal surface was irregular, with mild cytoplasmic vacuolation of ependymal cells, and the periventricular neuropil was congested and spongiotic. (C) Lateral ventricle from a PALO (17-0086) with acute, fatal DA toxicosis; the periventricular neuropil was congested and spongiotic, and there was scant hemorrhage admixed with proteinacious material in the ventricular lumen. (D) Lateral ventricle from a PALO (IBR 17-0597) that was euthanized 4 days post-stranding; the periventricular neuropil was congested and spongiotic, the ventricular lumen contained proteinacious material, and several necrotic (e.g., “red dead”) neurons were visible near the ventricles (arrows). (E) Lateral ventricle from a RTLO (IBR 17-0353); that was euthanized 18 days post-stranding. Although the vascular congestion had normalized, there was moderate periventricular spongiosis, and the ventricular surface was irregular and uneven with a partial double layer of ependymal cells. (F) Lateral ventricle from a PALO (IBR 17-0406) that was euthanized 17 days post-stranding; There was moderate perivascular spongiosis, and the ventricular surface was irregular and uneven, with multiple layers of ependymal cells forming small clefts and invaginations. All slides were stained with hematoxylin and eosin. Bars = 160, 65, 160, 160, 160, and 160 µm, respectively.

Figure 19.
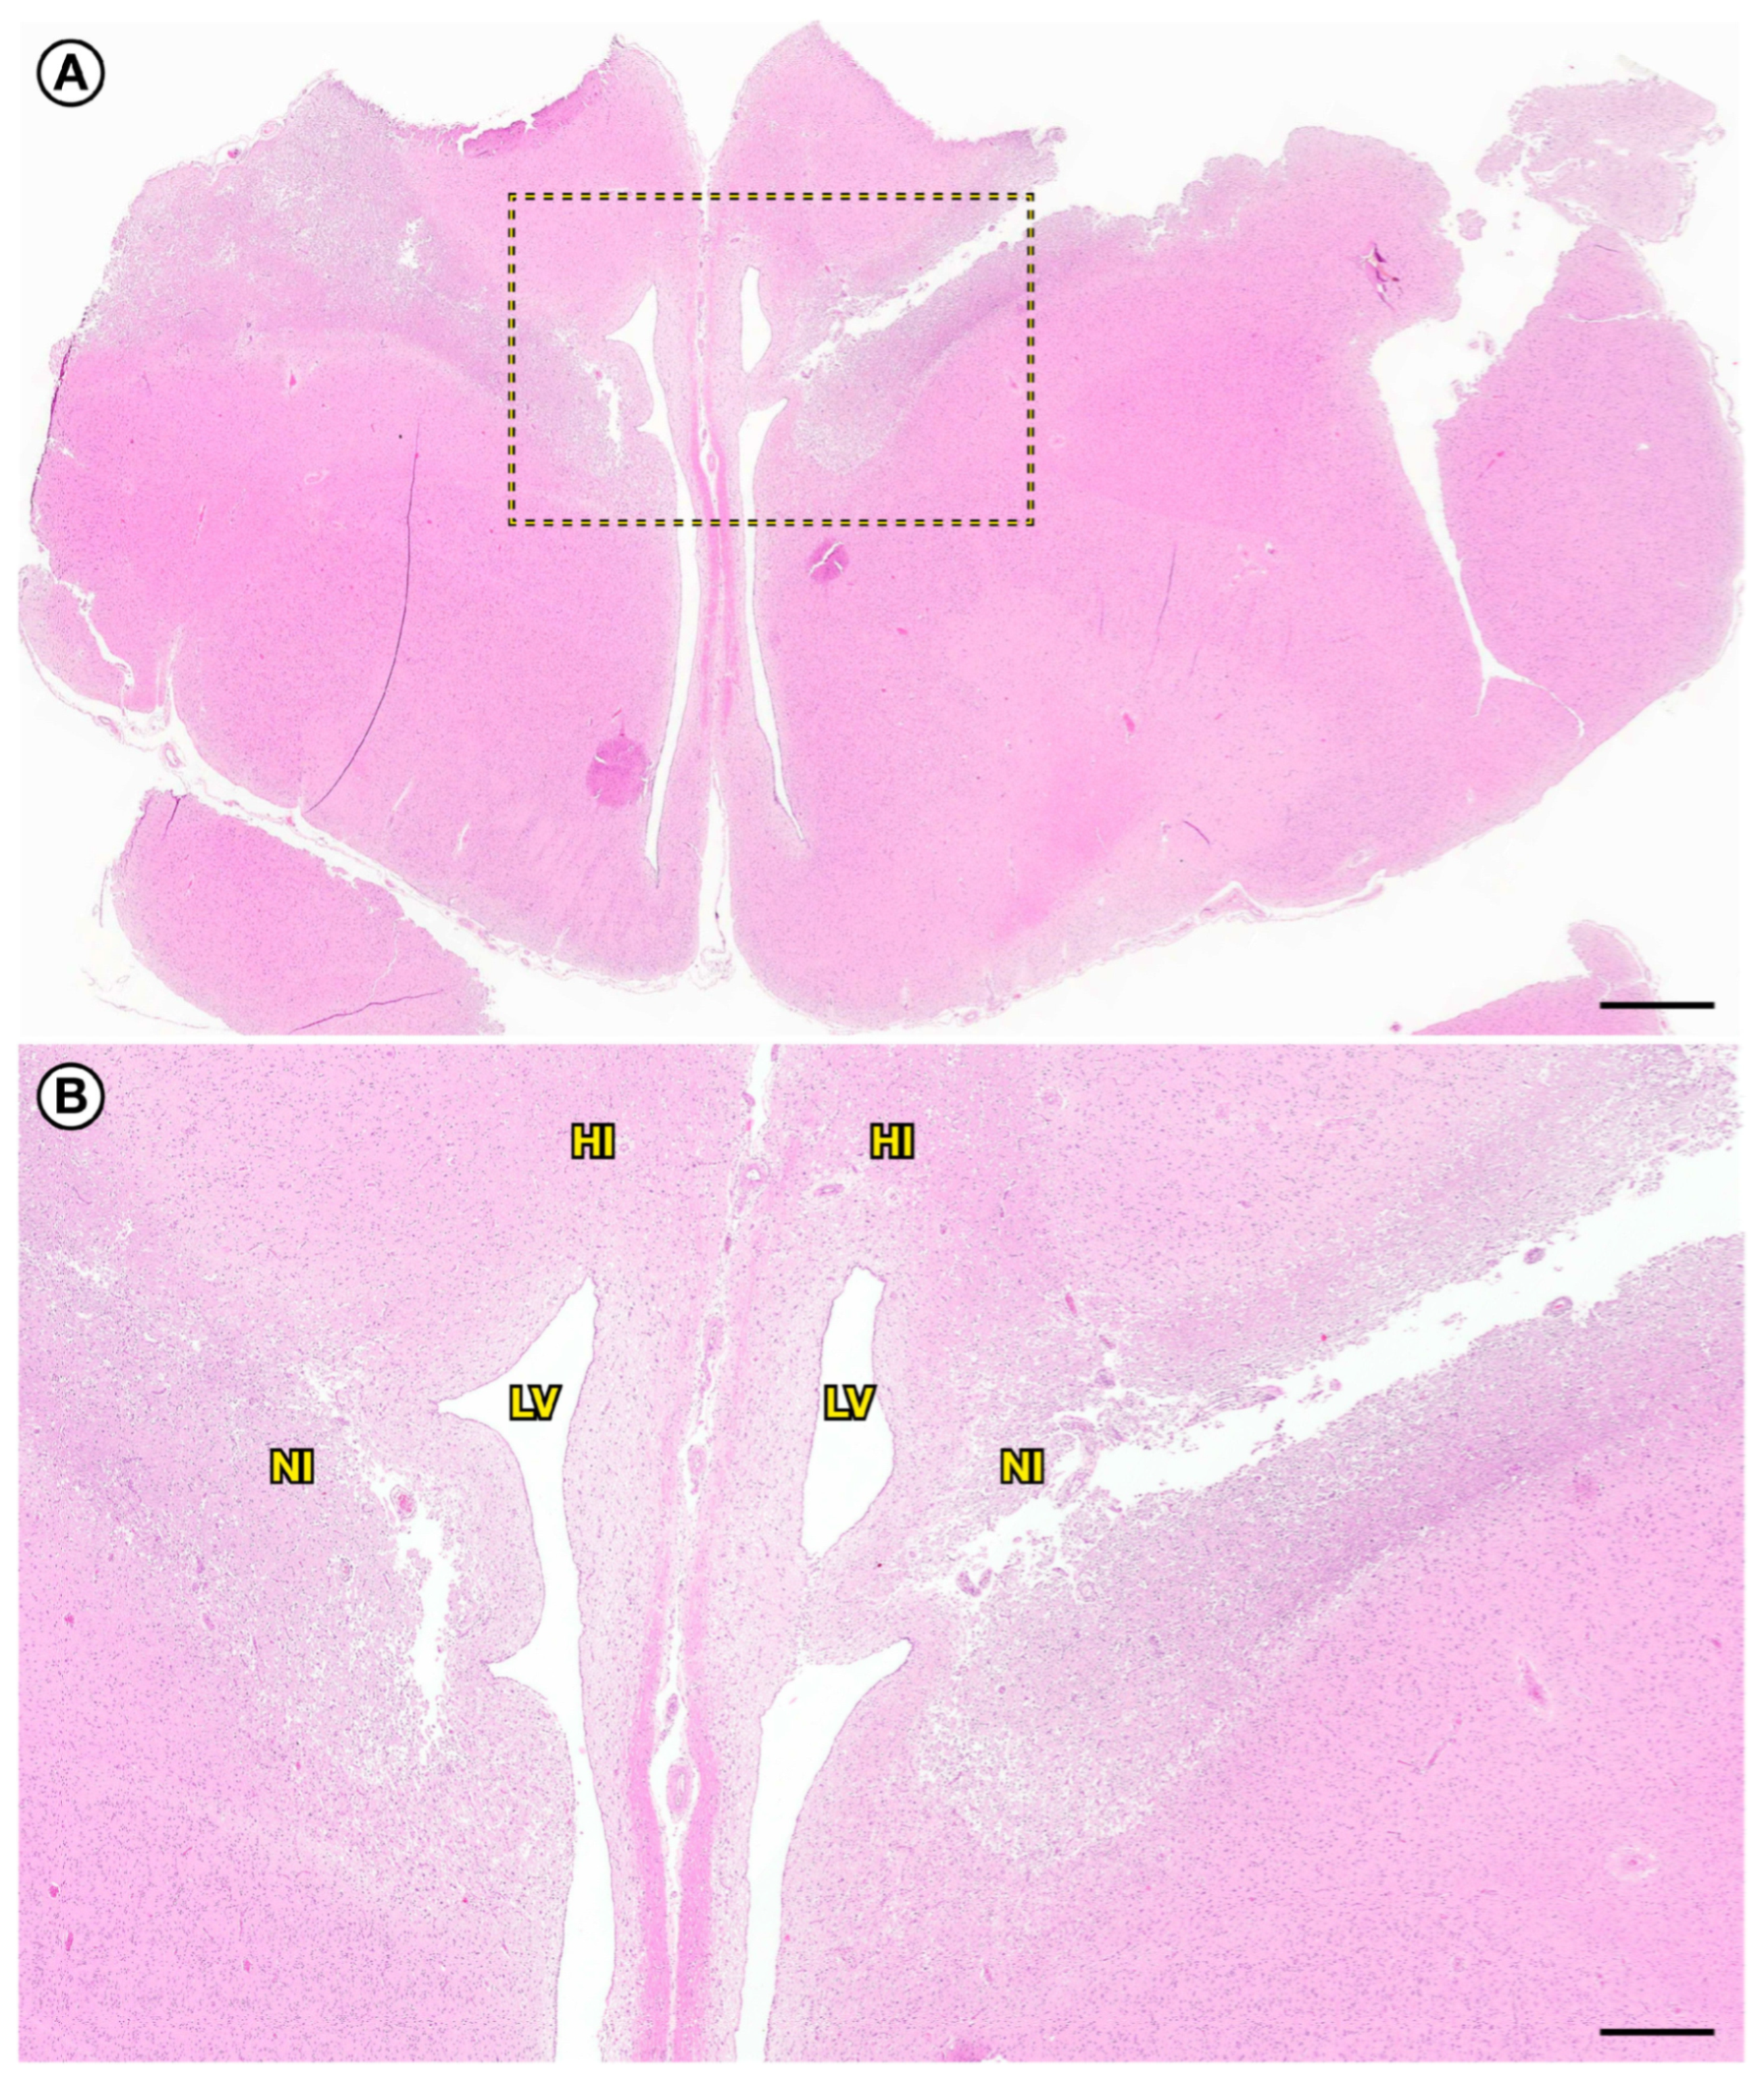
Chronic sublethal DA toxicosis in loons was associated with severe, variably symmetrical degeneration and atrophy of the caudodorsal periventricular cerebrum. (
A) Low-magnification view of caudal cerebrum from a PALO (IBR 17-0406) that was euthanized 17 days post-stranding. Severe, well-demarcated, bilaterally symmetrical encephalomalacia and tissue atrophy were visible in the caudodorsal cerebrum. This lesion was most severe along the periventricular midline, and extended laterally as a V-shaped band of malacic cerebral tissue that surrounded the moderately dilated lateral ventricles. (
B) (IBR 17-0406) Higher-magnification view of the region of the dorsal cerebral midline delineated by a box in the previous photo. Well-defined areas of grossly apparent, bilaterally symmetrical encephalomalacia and tissue atrophy in the dorsal, dorsolateral, and dorsomedial cerebrum corresponded with the locations of the hippocampus (HI), dorsal nidopallium (NI), and lateral ventricles (LV) (compare with the negative control tissue in
Figure 5). All slides were stained with hematoxylin and eosin, with images obtained using a digital scanning microscope. Bars = 1500 and 500 µm, respectively.
Figure 19.
Chronic sublethal DA toxicosis in loons was associated with severe, variably symmetrical degeneration and atrophy of the caudodorsal periventricular cerebrum. (
A) Low-magnification view of caudal cerebrum from a PALO (IBR 17-0406) that was euthanized 17 days post-stranding. Severe, well-demarcated, bilaterally symmetrical encephalomalacia and tissue atrophy were visible in the caudodorsal cerebrum. This lesion was most severe along the periventricular midline, and extended laterally as a V-shaped band of malacic cerebral tissue that surrounded the moderately dilated lateral ventricles. (
B) (IBR 17-0406) Higher-magnification view of the region of the dorsal cerebral midline delineated by a box in the previous photo. Well-defined areas of grossly apparent, bilaterally symmetrical encephalomalacia and tissue atrophy in the dorsal, dorsolateral, and dorsomedial cerebrum corresponded with the locations of the hippocampus (HI), dorsal nidopallium (NI), and lateral ventricles (LV) (compare with the negative control tissue in
Figure 5). All slides were stained with hematoxylin and eosin, with images obtained using a digital scanning microscope. Bars = 1500 and 500 µm, respectively.

Figure 20.
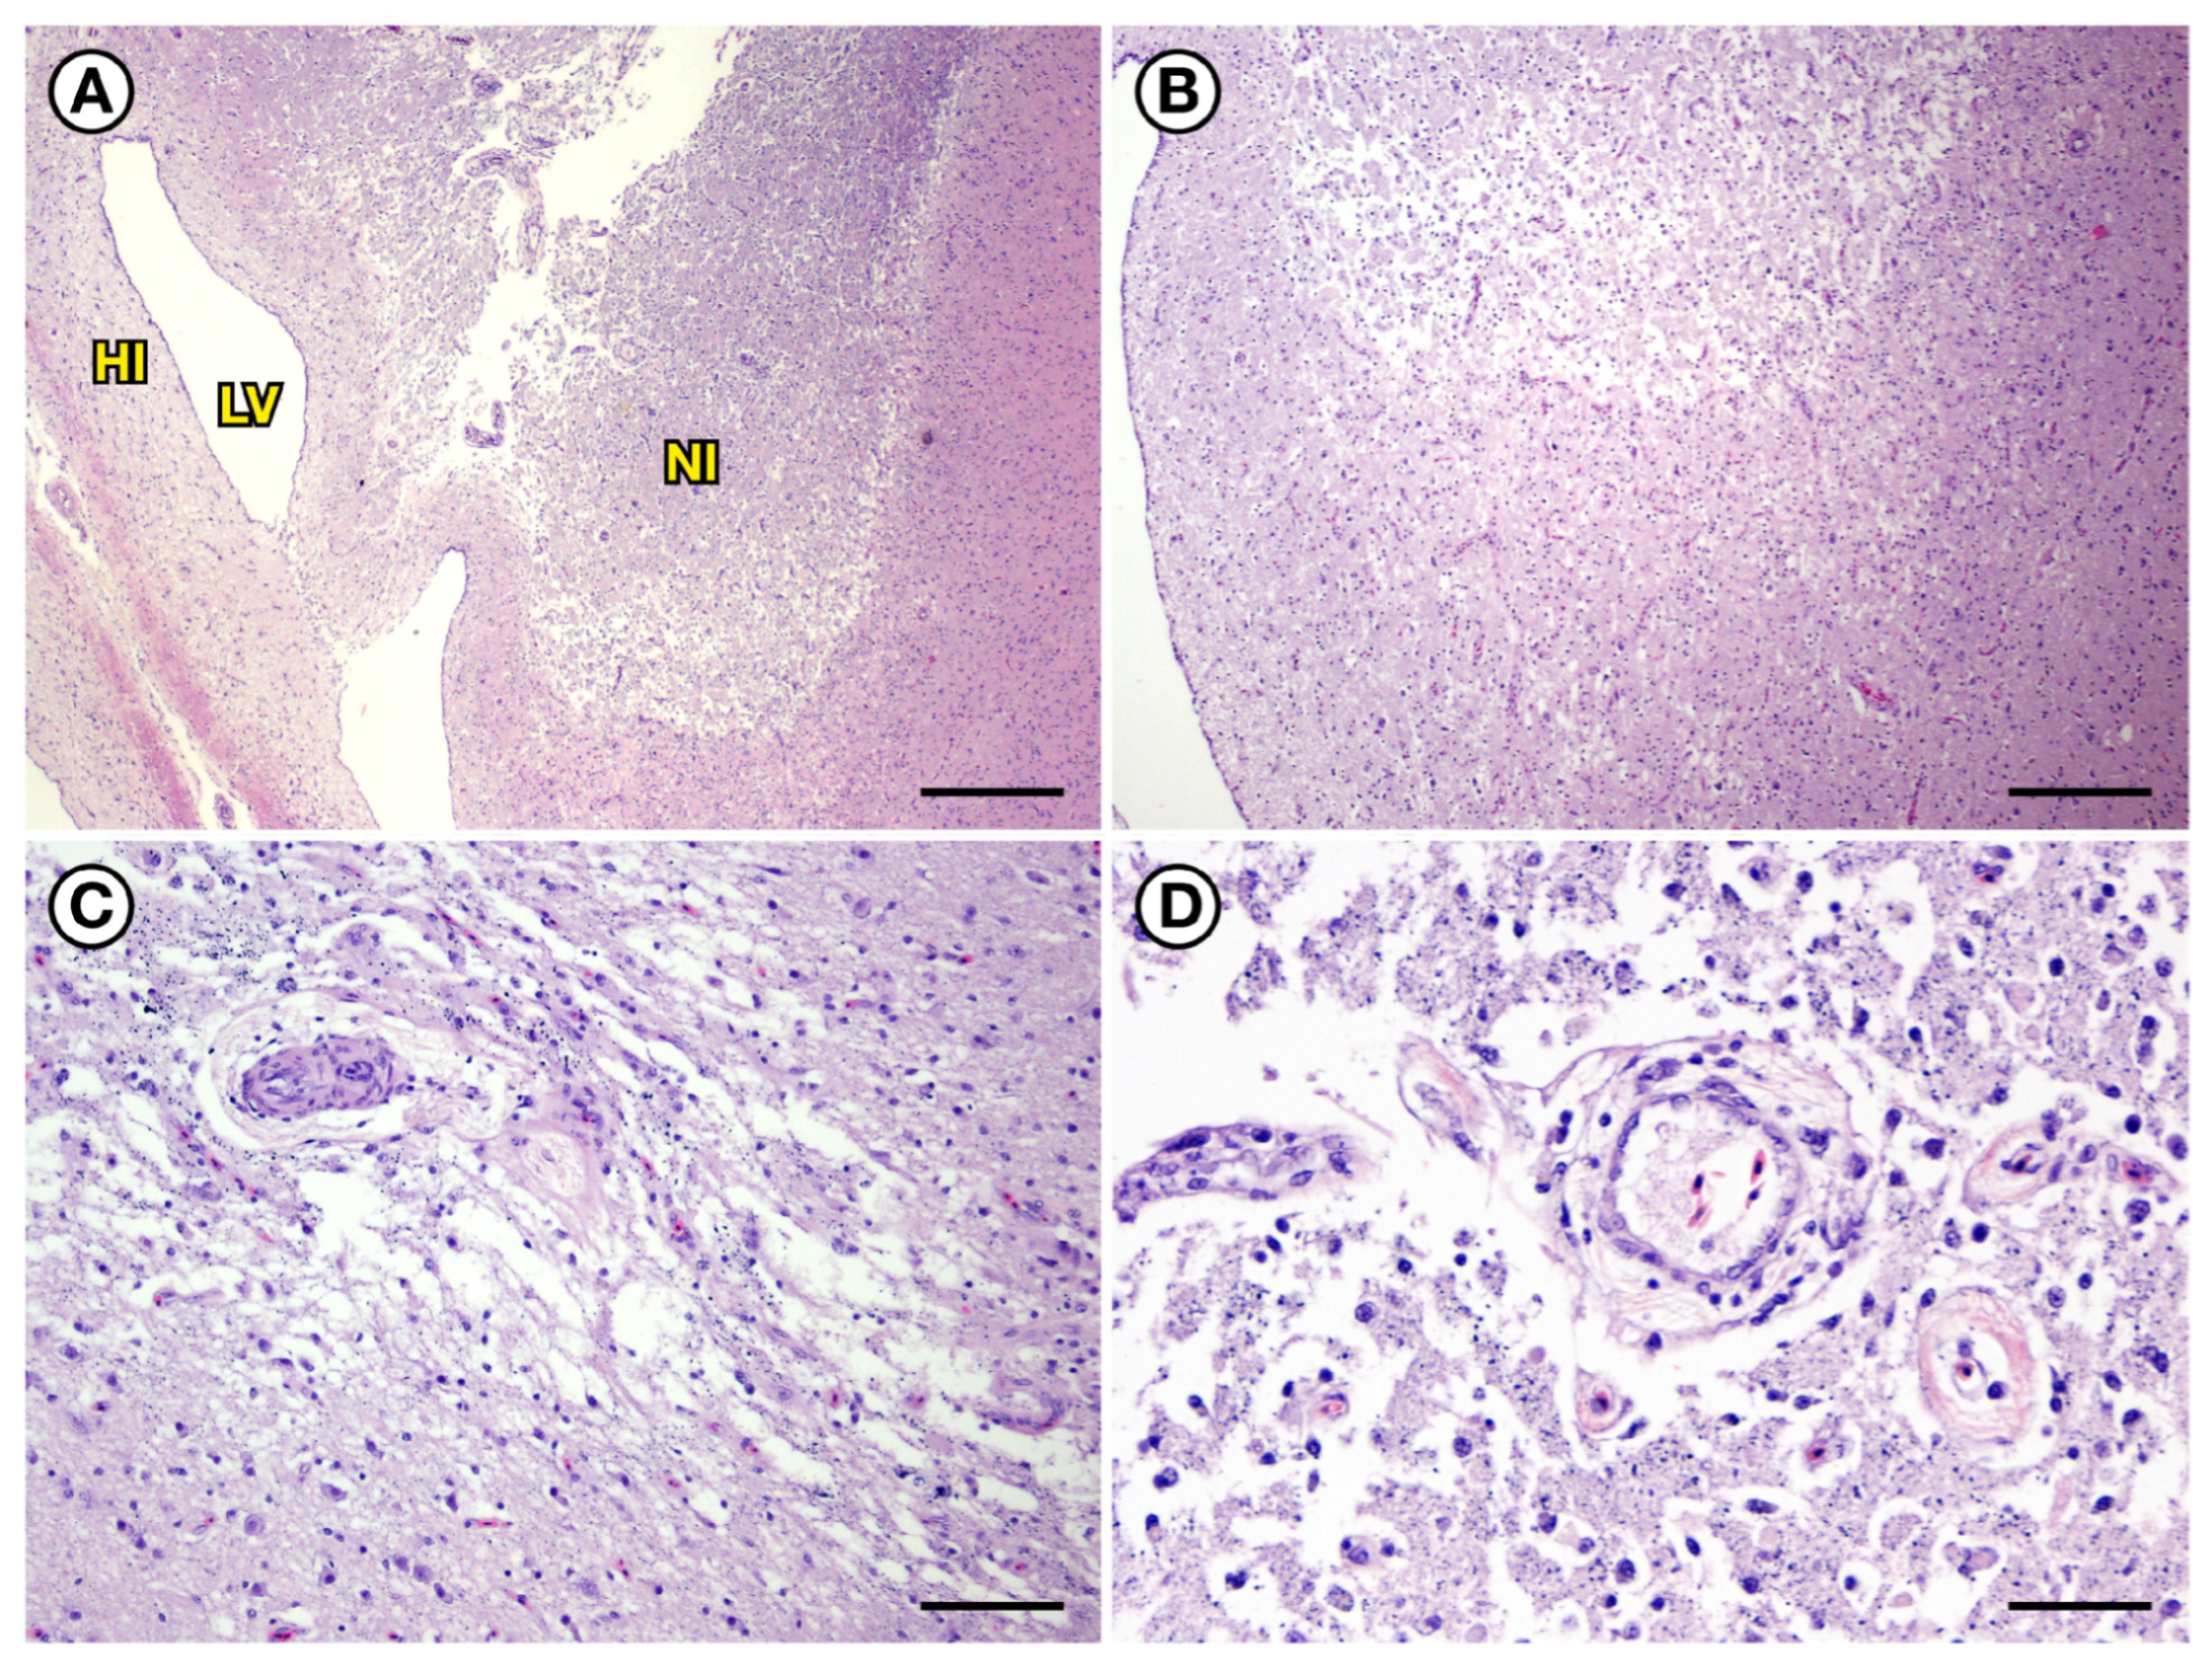
Severe atrophy, malacia, and dystrophic mineralization of the caudodorsal cerebrum were visible in loons with chronic neurological deficits due to DA toxicosis that survived ≥17 days post-stranding. (A) Caudodorsal cerebrum of a PALO (IBR 17-0406) that was euthanized 17 days post-stranding. Grossly, the caudodorsal cerebrum was soft, opaque, pale, and edematous. On the microscope, a large, well-demarcated region of tissue atrophy, malacia, and partial cavitation encompassed much of the dorsal nidopallium (NI) and the hippocampus (HI), and there was moderate dilation of the lateral ventricle (LV). (B) (IBR 17-0406) Higher-magnification view of the tissue shown in (A); the central zone of cerebral malacia and cavitation was surrounded by gliotic and spongiotic neuropil with prominent vascular hypertrophy. (C) (IBR 17-0406) Tissue malacia was associated with accumulation of glial cells, cell debris, and grey to black granular pigment. (D) (IBR 17-0406) In severely affected areas, normal brain tissue was replaced by cavitated tissue filled with glial cells, cellular debris, grey to black granular pigment, and dystrophic mineralization. All slides were stained with hematoxylin and eosin. Bars = 325, 160, 65, and 40 µm, respectively.
Figure 20.
Severe atrophy, malacia, and dystrophic mineralization of the caudodorsal cerebrum were visible in loons with chronic neurological deficits due to DA toxicosis that survived ≥17 days post-stranding. (A) Caudodorsal cerebrum of a PALO (IBR 17-0406) that was euthanized 17 days post-stranding. Grossly, the caudodorsal cerebrum was soft, opaque, pale, and edematous. On the microscope, a large, well-demarcated region of tissue atrophy, malacia, and partial cavitation encompassed much of the dorsal nidopallium (NI) and the hippocampus (HI), and there was moderate dilation of the lateral ventricle (LV). (B) (IBR 17-0406) Higher-magnification view of the tissue shown in (A); the central zone of cerebral malacia and cavitation was surrounded by gliotic and spongiotic neuropil with prominent vascular hypertrophy. (C) (IBR 17-0406) Tissue malacia was associated with accumulation of glial cells, cell debris, and grey to black granular pigment. (D) (IBR 17-0406) In severely affected areas, normal brain tissue was replaced by cavitated tissue filled with glial cells, cellular debris, grey to black granular pigment, and dystrophic mineralization. All slides were stained with hematoxylin and eosin. Bars = 325, 160, 65, and 40 µm, respectively.




 ,
,