Article

Development of a Sensitive UPLC-MS/MS Method for the Simultaneous Quantification of Mycotoxins in Wheat Products and Human Urine

1
School of Public Health, Baotou Medical College, Baotou 014040, China
2
Chaoyang District Center for Disease Control and Prevention (Chaoyang District Health Supervision Institute), Beijing 100021, China
3
NHC Key Laboratory of Food Safety Risk Assessment, China National Center for Food Safety Risk Assessment, Beijing 100021, China
4
School of Public Health, Southern Medical University, Guangzhou 510515, China
*
Authors to whom correspondence should be addressed.
Toxins 2026, 18(5), 219; https://doi.org/10.3390/toxins18050219
Submission received: 31 March 2026 / Revised: 28 April 2026 / Accepted: 1 May 2026 / Published: 6 May 2026
(This article belongs to the Special Issue Detection and Risk Assessment of Microbial Toxins in Food)

Abstract

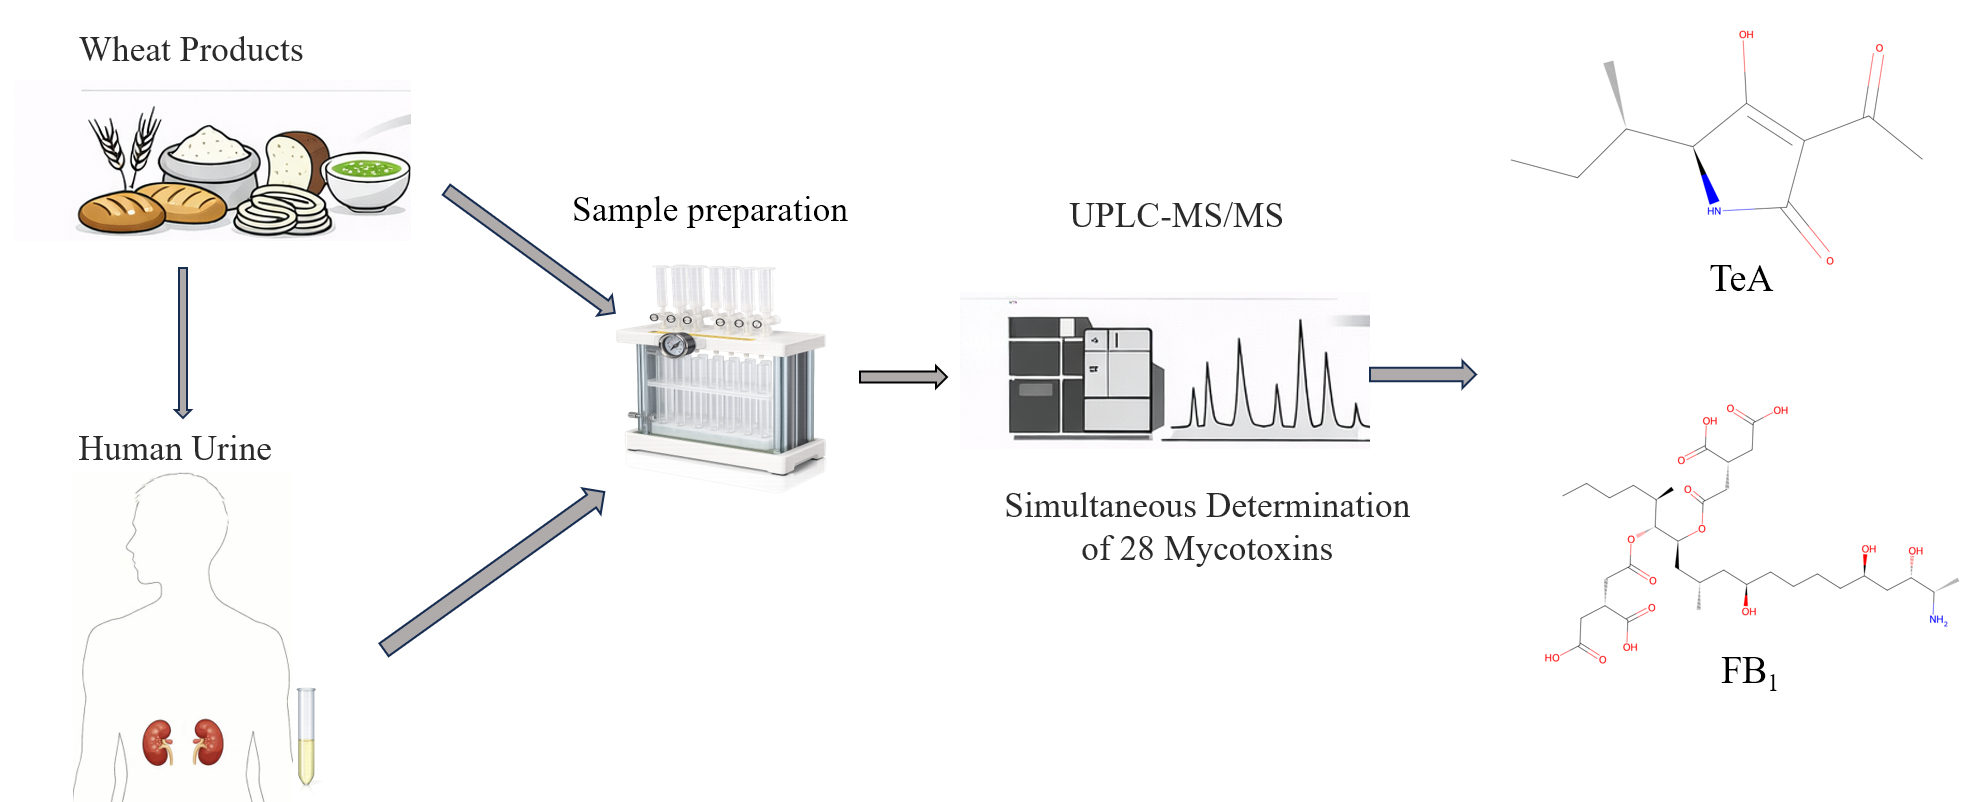
Mycotoxin contamination in wheat products has consistently been a key issue of concern in food safety, and urinary biomonitoring provides an effective approach for assessing internal human exposure. In this study, a sensitive ultra-performance liquid chromatography–tandem mass spectrometry method was developed and validated for the simultaneous determination of 28 mycotoxins in wheat products and human urine. For the two matrices, the extraction solvent, acid concentration, solid-phase extraction cartridge type, and enzymatic hydrolysis parameters were optimized. Under the optimized conditions, all target compounds showed excellent linear relationships within the tested concentration ranges (R2 > 0.99). In wheat products, the spiked recoveries ranged from 70.2% to 120%, the repeatabilities ranged from 1.6% to 9.1%, and the limits of detection and limits of quantification were 0.001~8.3 μg/kg and 0.002~25.0 μg/kg, respectively. In urine, the spiked recoveries ranged from 79.3% to 120%, the repeatabilities ranged from 0.7% to 9.4%, and the limits of detection and limits of quantification were 0.0001~1.0 μg/L and 0.0002~3.0 μg/L, respectively. Analysis of real samples showed that at least seven mycotoxins were detected in wheat product samples, and at least five were detected in urine samples. In wheat products, the detection rates of deoxynivalenol, enniatin B, enniatin A1, enniatin B1, tenuazonic acid, and tentoxin were all 100%, whereas in urine, the detection rate of fumonisin B1 reached 100%, and tenuazonic acid showed the highest mean concentration in both matrices. In conclusion, the developed ultra-performance liquid chromatography–tandem mass spectrometry method is suitable for the simultaneous quantification of 28 mycotoxins in wheat products and human urine, and its preliminary application demonstrates good practical applicability.
Key Contribution: An optimized ultra-performance liquid chromatography–tandem mass spectrometry (UPLC-MS/MS) method was developed and validated for the simultaneous determination of 28 mycotoxins in wheat products and human urine, thereby providing a reliable methodological basis for future occurrence investigation and biomonitoring studies.

Graphical Abstract

1. Introduction

Mycotoxins are secondary metabolites mainly generated by Aspergillus, Penicillium, Fusarium, Alternaria, and Claviceps molds. They are generally stable compounds and are mostly found in agricultural products and their derived food and feed products [1,2,3,4]. The Food and Agriculture Organization of the United Nations (FAO) has estimated that at least 25% of agricultural crops worldwide are affected by mycotoxin contamination each year [5]. Apart from major mycotoxin classes, so-called emerging mycotoxins such as alternariol (AOH), alternariol monomethyl ether (AME), tentoxin (TEN), tenuazonic acid (TeA), and altenuene (ALT) produced by Alternaria species, as well as beauvericin (BEA) and enniatins (ENNs) produced by Fusarium species, have received increasing attention in recent years [6,7].
Both regulated and emerging mycotoxins are widely detected in cereal crops and often occur as co-contaminants, posing a serious threat to food safety [8,9,10]. Wheat is one of the most important foods and provides a staple food source for approximately 35% of the global population [11]. China is one of the major wheat-producing countries worldwide, accounting for a substantial proportion of global wheat production, and wheat-based products, which are important dietary staples, particularly in northern China [12,13]. Recent studies have shown that deoxynivalenol (DON), zearalenone (ZEN), BEA, ENNs, and Alternaria toxins are frequently detected in wheat [7,14,15,16]. In 2021, 321 wheat samples collected in China were found to contain at least one mycotoxin. The detection rates of mycotoxins ranged from 7.1% to 100%, and DON and TeA showed the highest detection rates and concentration levels. The highest concentration was 921.8 μg/kg [7]. Another study by Hassine et al. on durum wheat from Tunisia showed that multiple mycotoxins, including DON, ZEN, ochratoxin A (OTA), enniatin A1 (ENNA1), enniatin B (ENNB), and enniatin B1 (ENNB1), were detected in durum wheat from Tunisia collected during 2021–2022; the detection rates ranged from 5.98% to 40.71%, with concentrations ranging from 0.01 to 384.2 μg/kg. [17].
Most mycotoxins are hepatotoxic, nephrotoxic, teratogenic, immunosuppressive and estrogenic, posing diverse health hazards to humans and animals [1,2,3,4]. Several food-contaminating fungal species have been reported to interfere with estrogenic pathways [18,19]. Among the Alternaria mycotoxins known to date, AOH and AME have been reported to exert not only genotoxic effects, but also to potentially act as endocrine-disrupting chemicals (EDCs) [20,21,22]. Therefore, it is critical to assess human exposure to these food contaminants.
Mycotoxin contamination in food does not fully reflect the actual internal exposure of individuals; urinary biomonitoring has become one of the major approaches for assessing mycotoxin exposure in human populations [23,24,25]. Urine is the most common biomatrix used to assess exposure to mycotoxins due to its accessibility and easy sampling. In the human body, absorbed mycotoxins are primarily excreted into the urine. As a result, both free toxins and their metabolites or conjugated forms can be detected in urine [23,26]. Some mycotoxins can be monitored directly as parent compounds in urine, such as fumonisin B1 (FB1), fumonisin B2 (FB2), fumonisin B3 (FB3), OTA, ENNA, ENNA1, ENNB, BEA, AOH, and TEN, whereas others are more appropriately assessed through their metabolites or conjugated forms [23]. In the case of aflatoxins, aflatoxin B1 (AFB1) can be biotransformed in the liver to aflatoxin M1 (AFM1) and subsequently excreted in urine. Therefore, AFM1 is considered more informative than unmetabolized AFB1 in urinary biomonitoring [23,27]. For DON, it is present in human urine mainly as glucuronide conjugates, and thus, urinary DON is commonly determined after enzymatic hydrolysis to measure the free form [26]. Among these, AFM1, DON, and deoxynivalenol-15-glucuronide (DON-15-GlcA) have been used as urinary biomarkers of exposure [23,26,28]. ENNB1 can undergo phase I biotransformation in humans, including hydroxylation, carbonylation, carboxylation, and N-demethylation. Both the parent compound and its metabolites may, therefore, serve as potential urinary biomarkers for exposure [29,30]. One study showed that the detection rate of AFM1 in urine samples from lactating women in Bangladesh was 88.9%, with a mean concentration of 109.9 ± 52.8 pg/mL and a range of 40.0 ~ 223.8 pg/mL [27].
Although various LC–MS/MS-based methods for the determination of multiple mycotoxins have been widely reported, the number of toxins covered remains limited, typically including only several or a dozen conventional mycotoxins. Moreover, the methods established to simultaneously determine both conventional and emerging mycotoxins are still relatively scarce [31,32,33,34,35]. In addition, food samples and biological samples always use different pretreatments, including different extraction solvents and different solid-phase extraction (SPE) methods. In this study, we aimed to establish a solid-phase extraction method for two matrices in order to improve detection efficiency. Meanwhile, considering that conventional mycotoxins have remained at relatively high contamination levels in recent years and that emerging mycotoxins have attracted increasing attention, it is necessary to establish a sensitive ultra-performance liquid chromatography–tandem mass spectrometry (UPLC–MS/MS) method for the simultaneous determination of 28 mycotoxins in wheat products and human urine, including AFB1, aflatoxin B2 (AFB2), aflatoxin G1 (AFG1), aflatoxin G2 (AFG2), AFM1, OTA, ochratoxin B (OTB), ochratoxin C (OTC), FB1, FB2, FB3, T-2 toxin (T-2), HT-2 toxin (HT-2), DON, 3-acetyldeoxynivalenol (3-Ac-DON), 15-acetyldeoxynivalenol (15-Ac-DON), sterigmatocystin (ST), cyclopiazonic acid (CPA), ENNA, ENNA1, ENNB, ENNB1, BEA, ALT, AOH, AME, TEN, and TeA. In this study, different extraction solvents were used for wheat products and human urine, while the same solid-phase extraction procedure was applied for cleanup of both matrices. Finally, the established method was applied to the analysis of real samples, providing technical support for the assessment of mycotoxin contamination in wheat products and human biomonitoring.

2. Results and Discussion

2.1. Optimization of Sample Extraction Solvent

Due to the diversity of 28 mycotoxins, with logp values approximately spanning about −1.4 to 5.0 and pKa values spanning 2.6 to 18.8, the extraction solvent is one of the most critical factors affecting mycotoxin extraction efficiency during sample pretreatment. To achieve the maximum extraction of multiple mycotoxins from wheat products and urine, this study compared different extraction solvents for these two matrices.
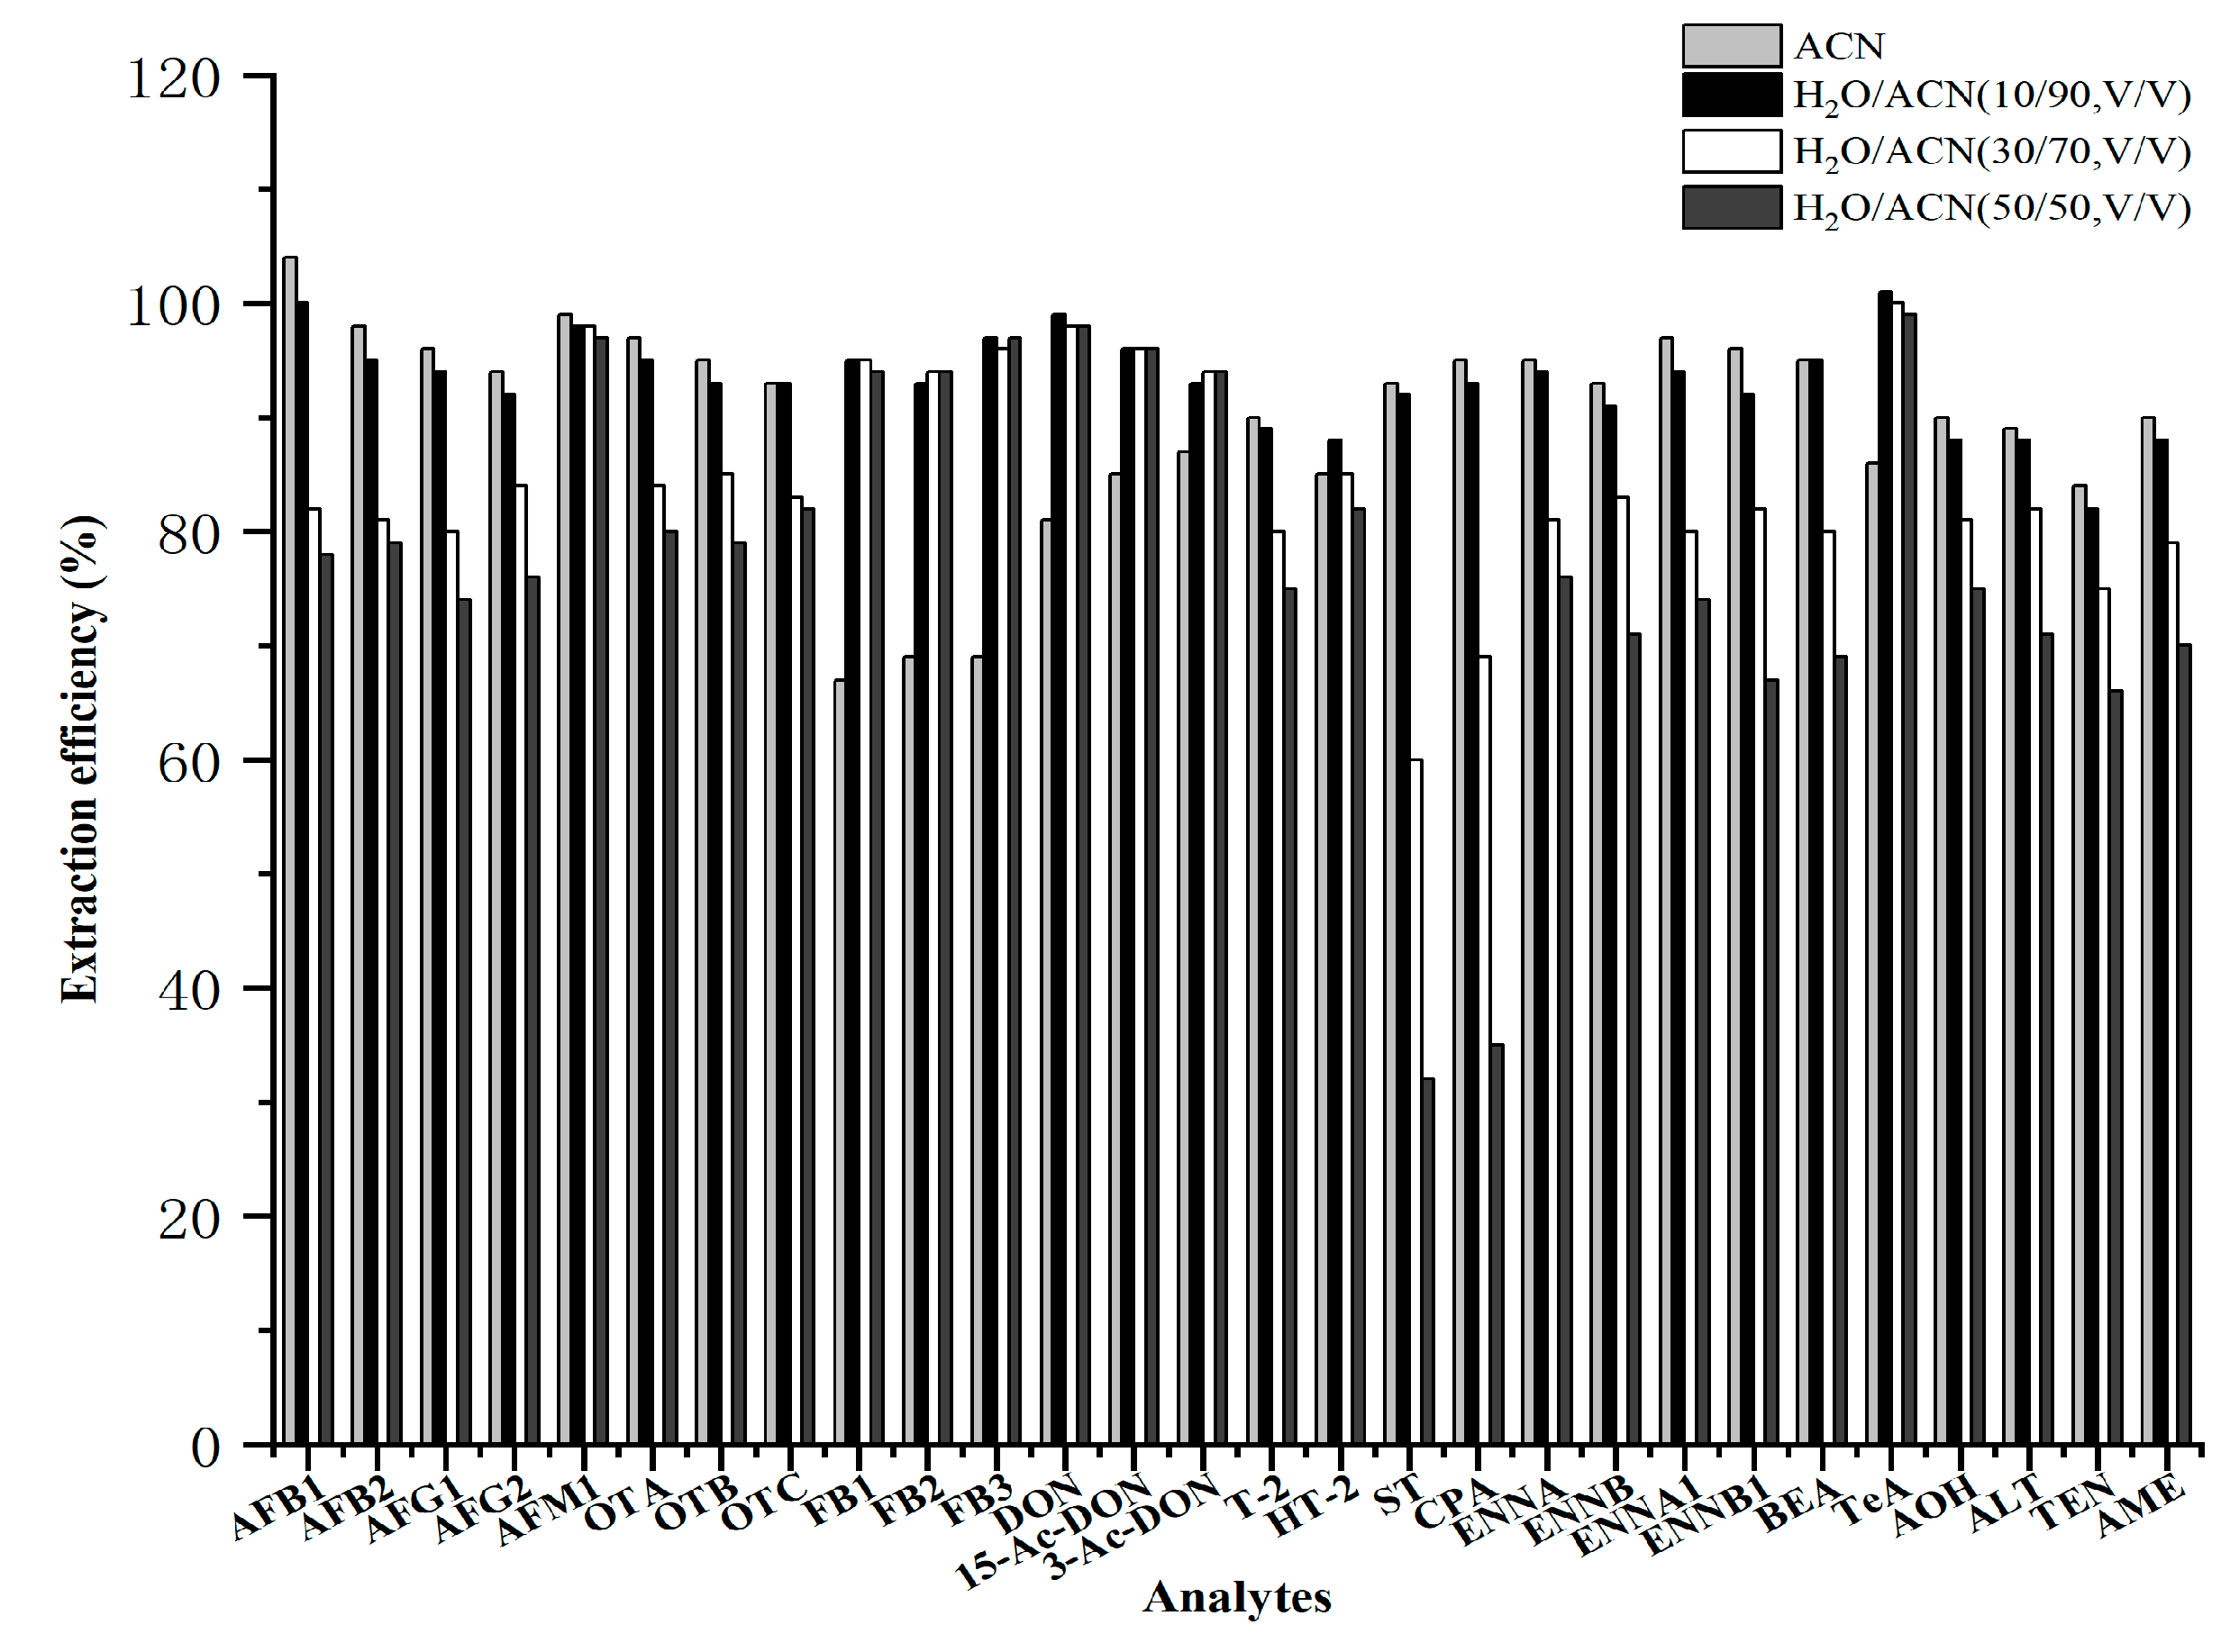
For the wheat product matrix, this study evaluated the efficiency of four extraction solvents, including acetonitrile (ACN), H2O/ACN (10/90, v/v), H2O/ACN (30/70, v/v), and H2O/ACN (50/50, v/v). The results presented in Figure 1 indicate that when H2O/ACN (10/90, v/v) was used as the extraction solvent, the extraction efficiencies of all mycotoxins exceeded 85%. However, when the proportion of water increased to 30% and 50%, the extraction efficiencies of aflatoxins (AFs) (except AFM1), ST, CPA, ENNs, and BEA were lower than those obtained with H2O/ACN (10/90, v/v). When using ACN as the extraction solvent, the extraction efficiencies of fumonisins (FBs) were all below 70%, which was probably related to the structure of FBs. FBs contain multiple hydroxyl and carboxyl groups in their molecules, which readily form hydrogen bonds with water and therefore show relatively high hydrophilicity; thus, a certain proportion of water in the extraction solvent was necessary to improve the extraction efficiency [36]. Therefore, H2O/ACN (10/90, v/v) was selected as the extraction solvent.
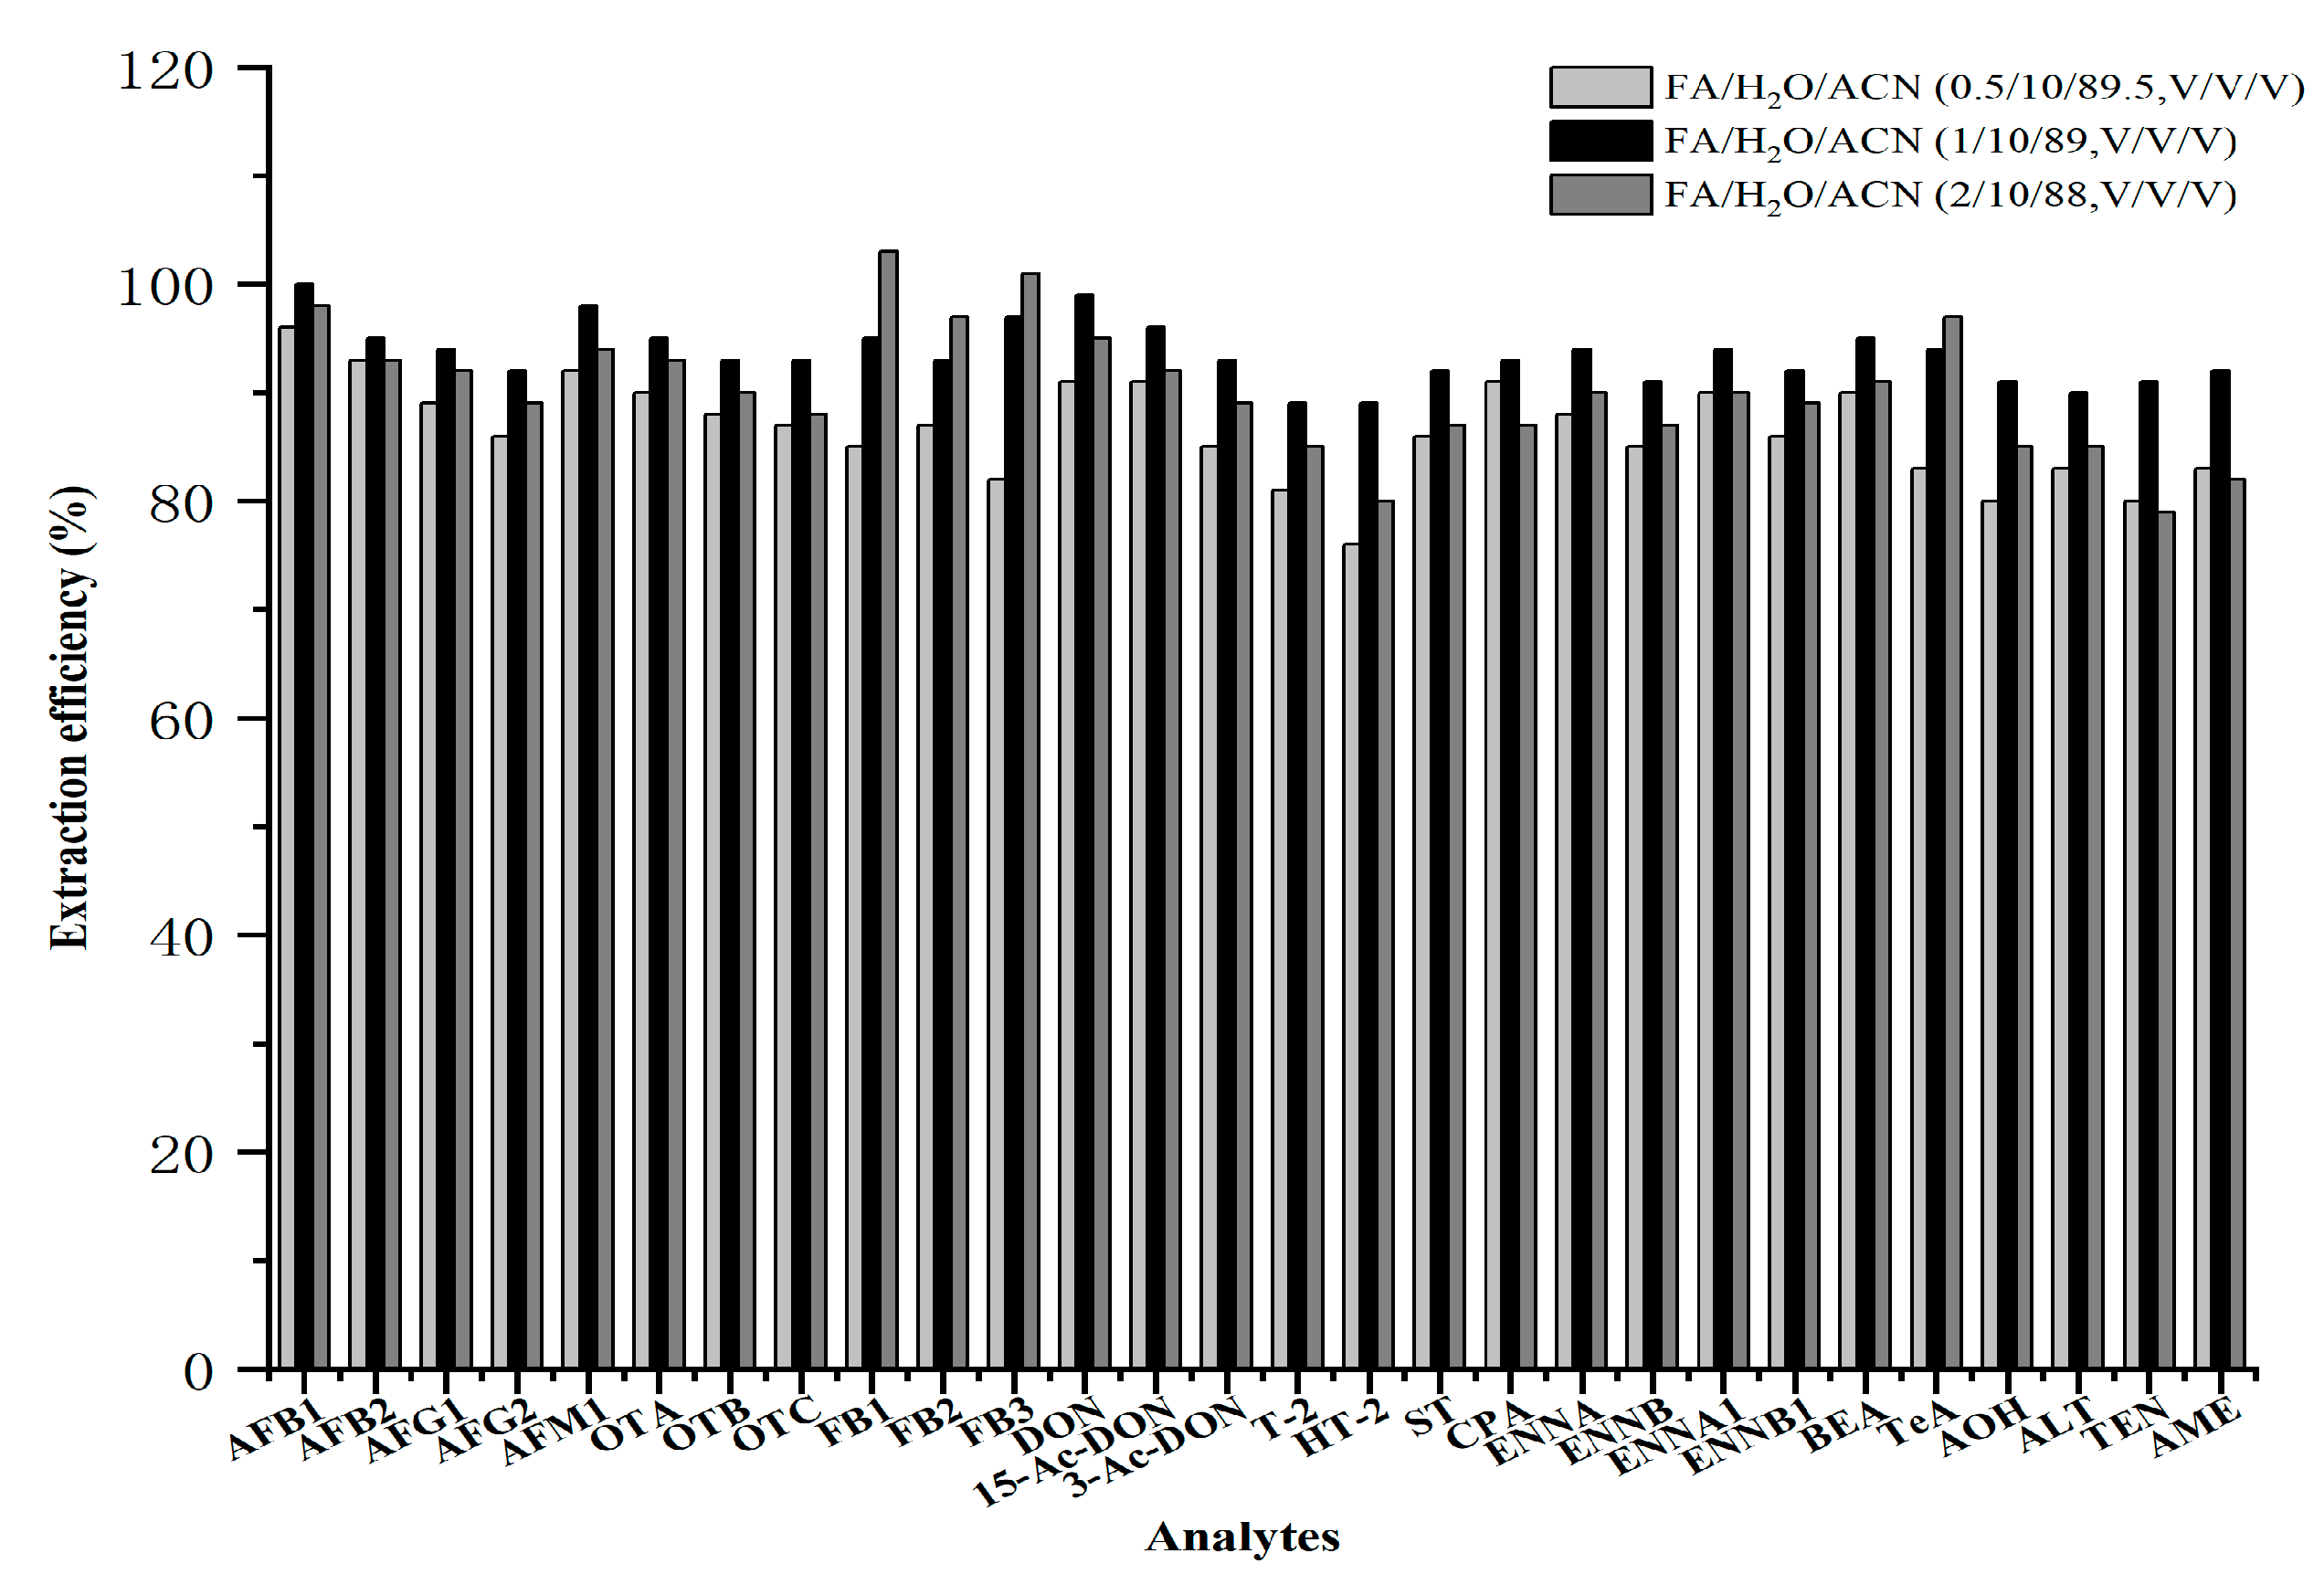
Because FBs and TeA are sensitive to acidic conditions, they are more likely to transfer from the aqueous phase to the organic phase under acidic conditions [37,38,39]. Therefore, this study compared the effects of adding three different formic acid concentrations (0.5%, 1.0%, and 2.0%) to H2O/ACN (10/90, v/v) on extraction efficiency. As shown in Figure 2, the addition of formic acid obviously improved the extraction efficiencies of FBs and TeA. When the formic acid concentration increased from 0.5% to 1.0%, the extraction efficiencies of all toxins were higher than 89.0%. However, when the formic acid concentration increased to 2.0%, the extraction recovery of all other compounds, except FBs and TeA, decreased. The recovery of TEN decreased from 91.0% to 79.0%. Overall, H2O/ACN (10/90, v/v) containing 1.0% formic acid was finally selected as the extraction solvent.
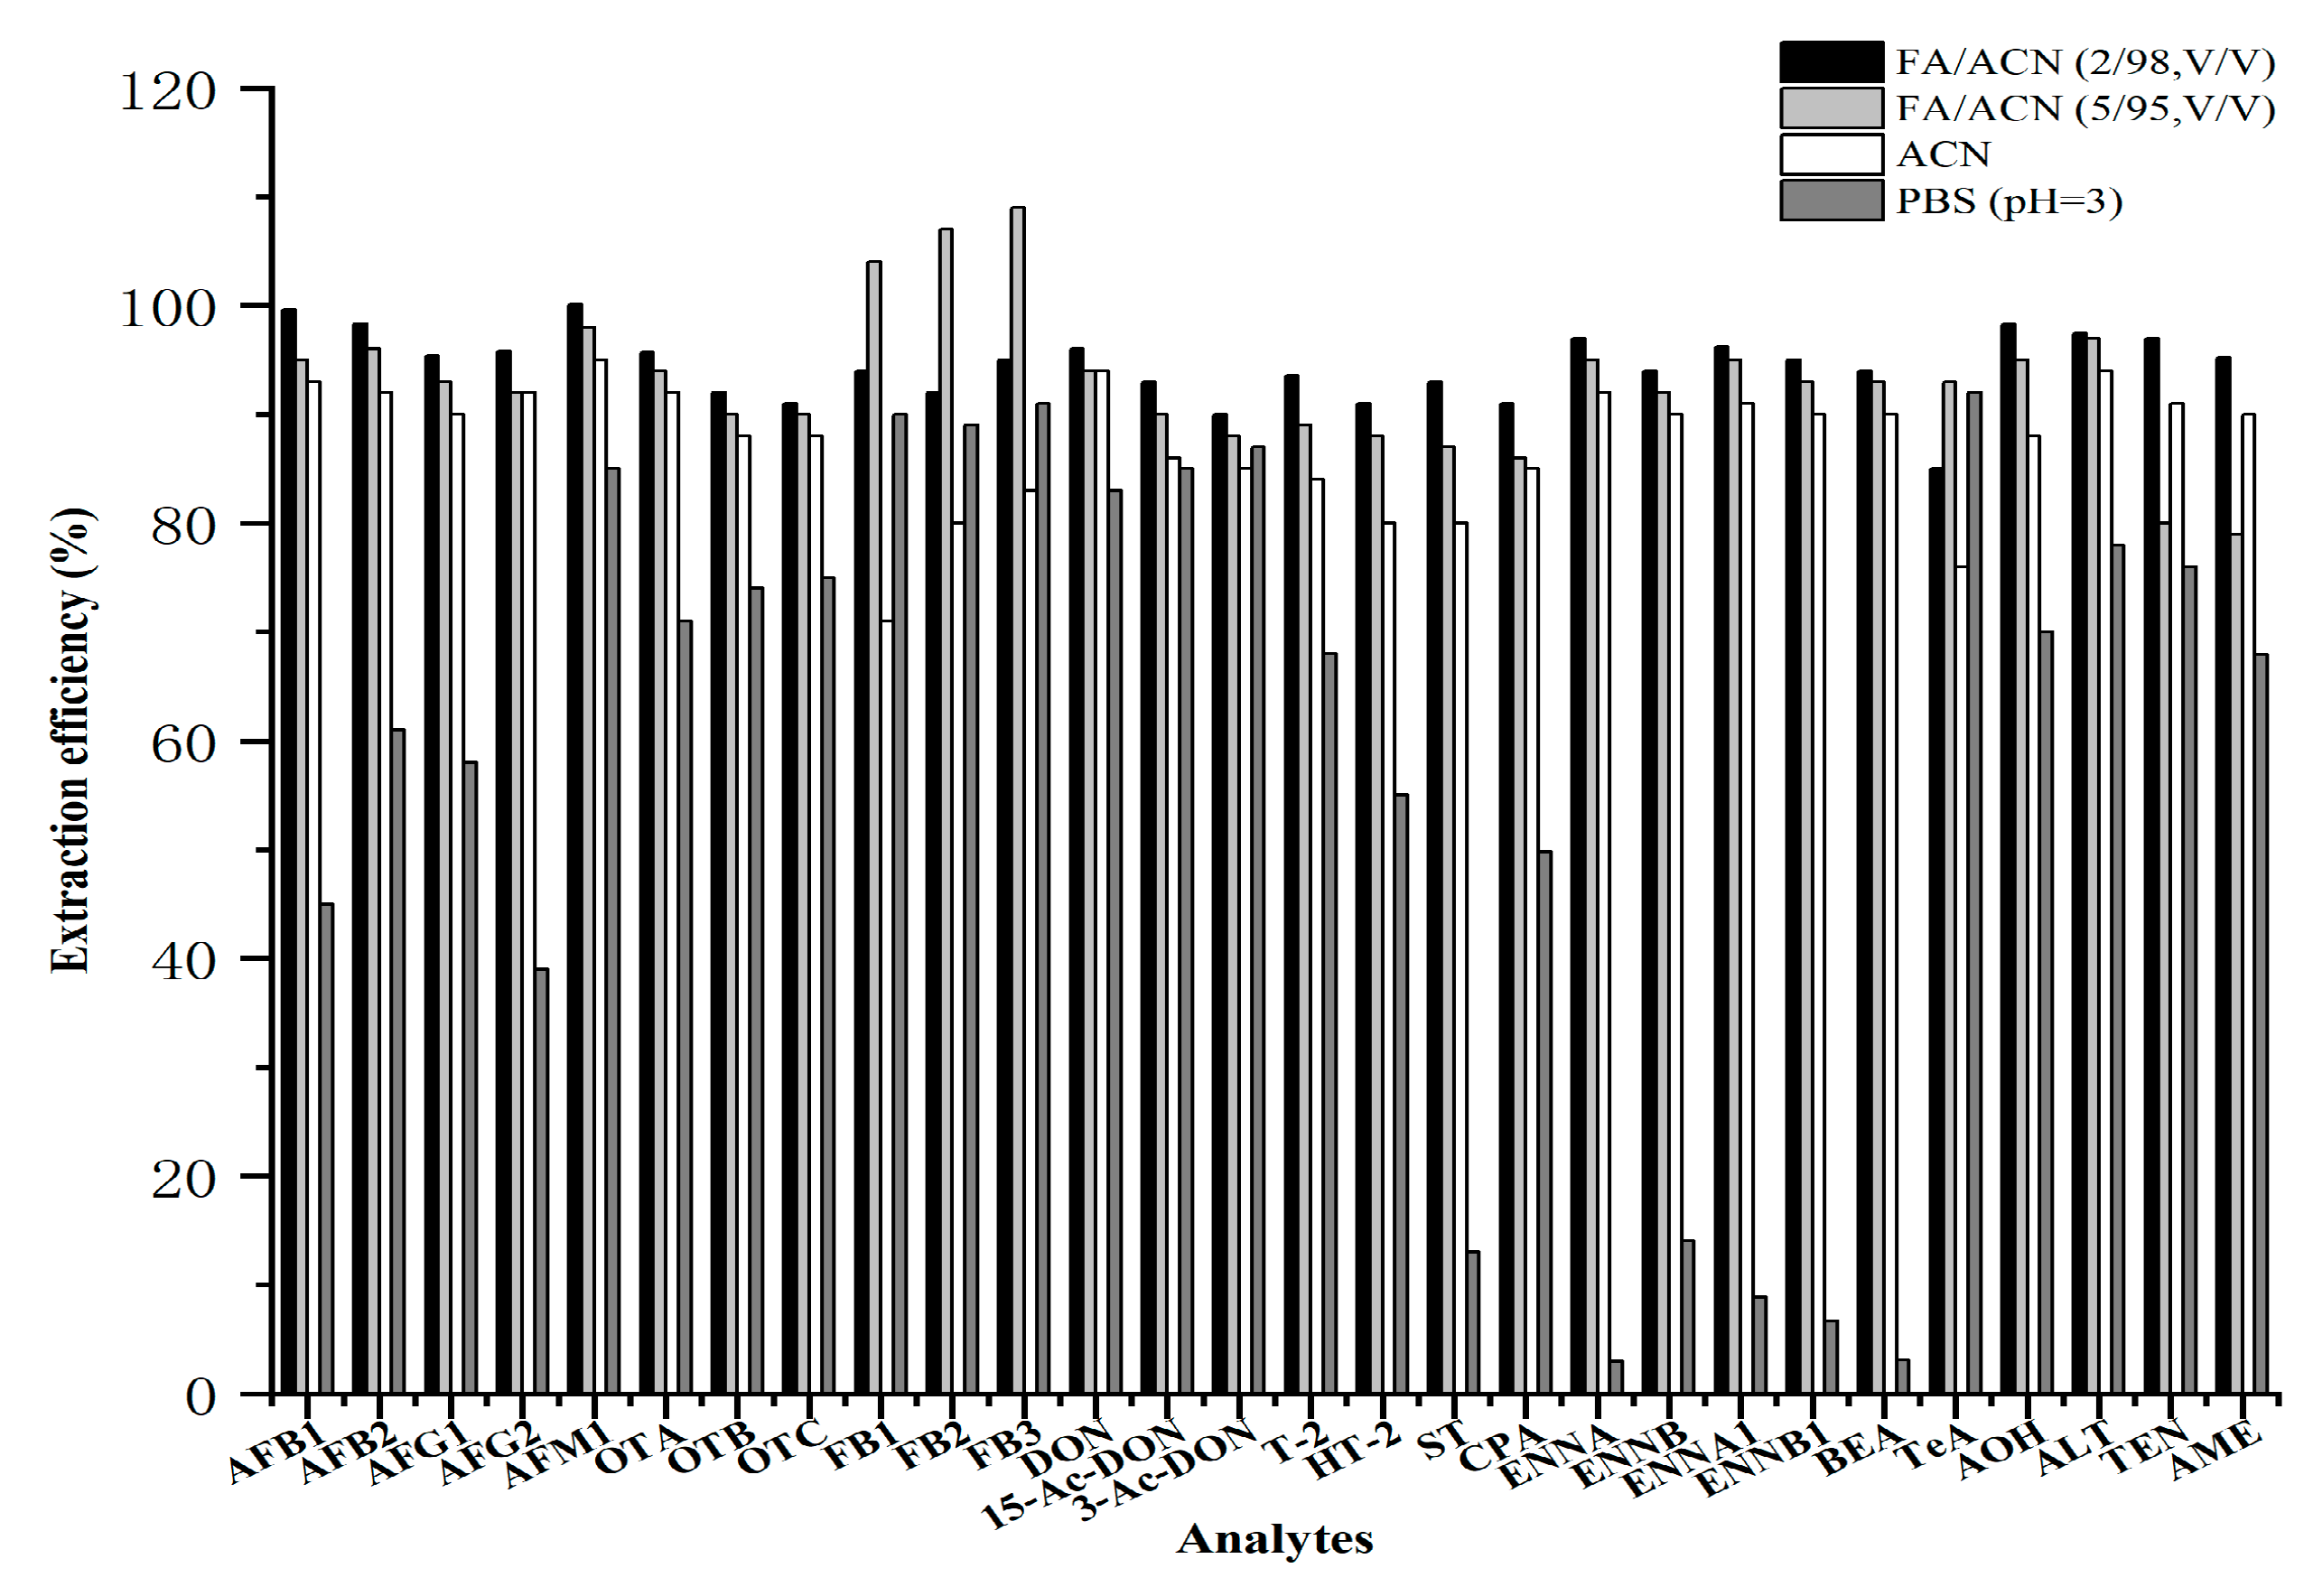
For the urine matrix, we evaluated four different extraction solvents, including ACN, formic acid (FA) /ACN (2/98, v/v), FA/ACN (5/95, v/v), and phosphate-buffered saline (PBS) (pH = 3). As illustrated in Figure 3, when the concentration of FA increased to 2.0%, the extraction efficiencies of all toxins were above 85.0%, and AFM1 showed the highest extraction efficiency at 100%. When the concentration of FA increased to 5.0%, the extraction efficiencies of TEN and AME decreased from 97.0% and 95.2% to 80.0 and 79.0%, respectively. When PBS (pH = 3) was used as the extraction solvent, only AFM1, FBs, 3-Ac-DON, 15-Ac-DON, and TeA showed satisfactory extraction recoveries, all above 85.0%. Therefore, acetonitrile containing 2.0% formic acid was selected as the extraction solvent in this study.

2.2. Optimization of Sample Cleanup

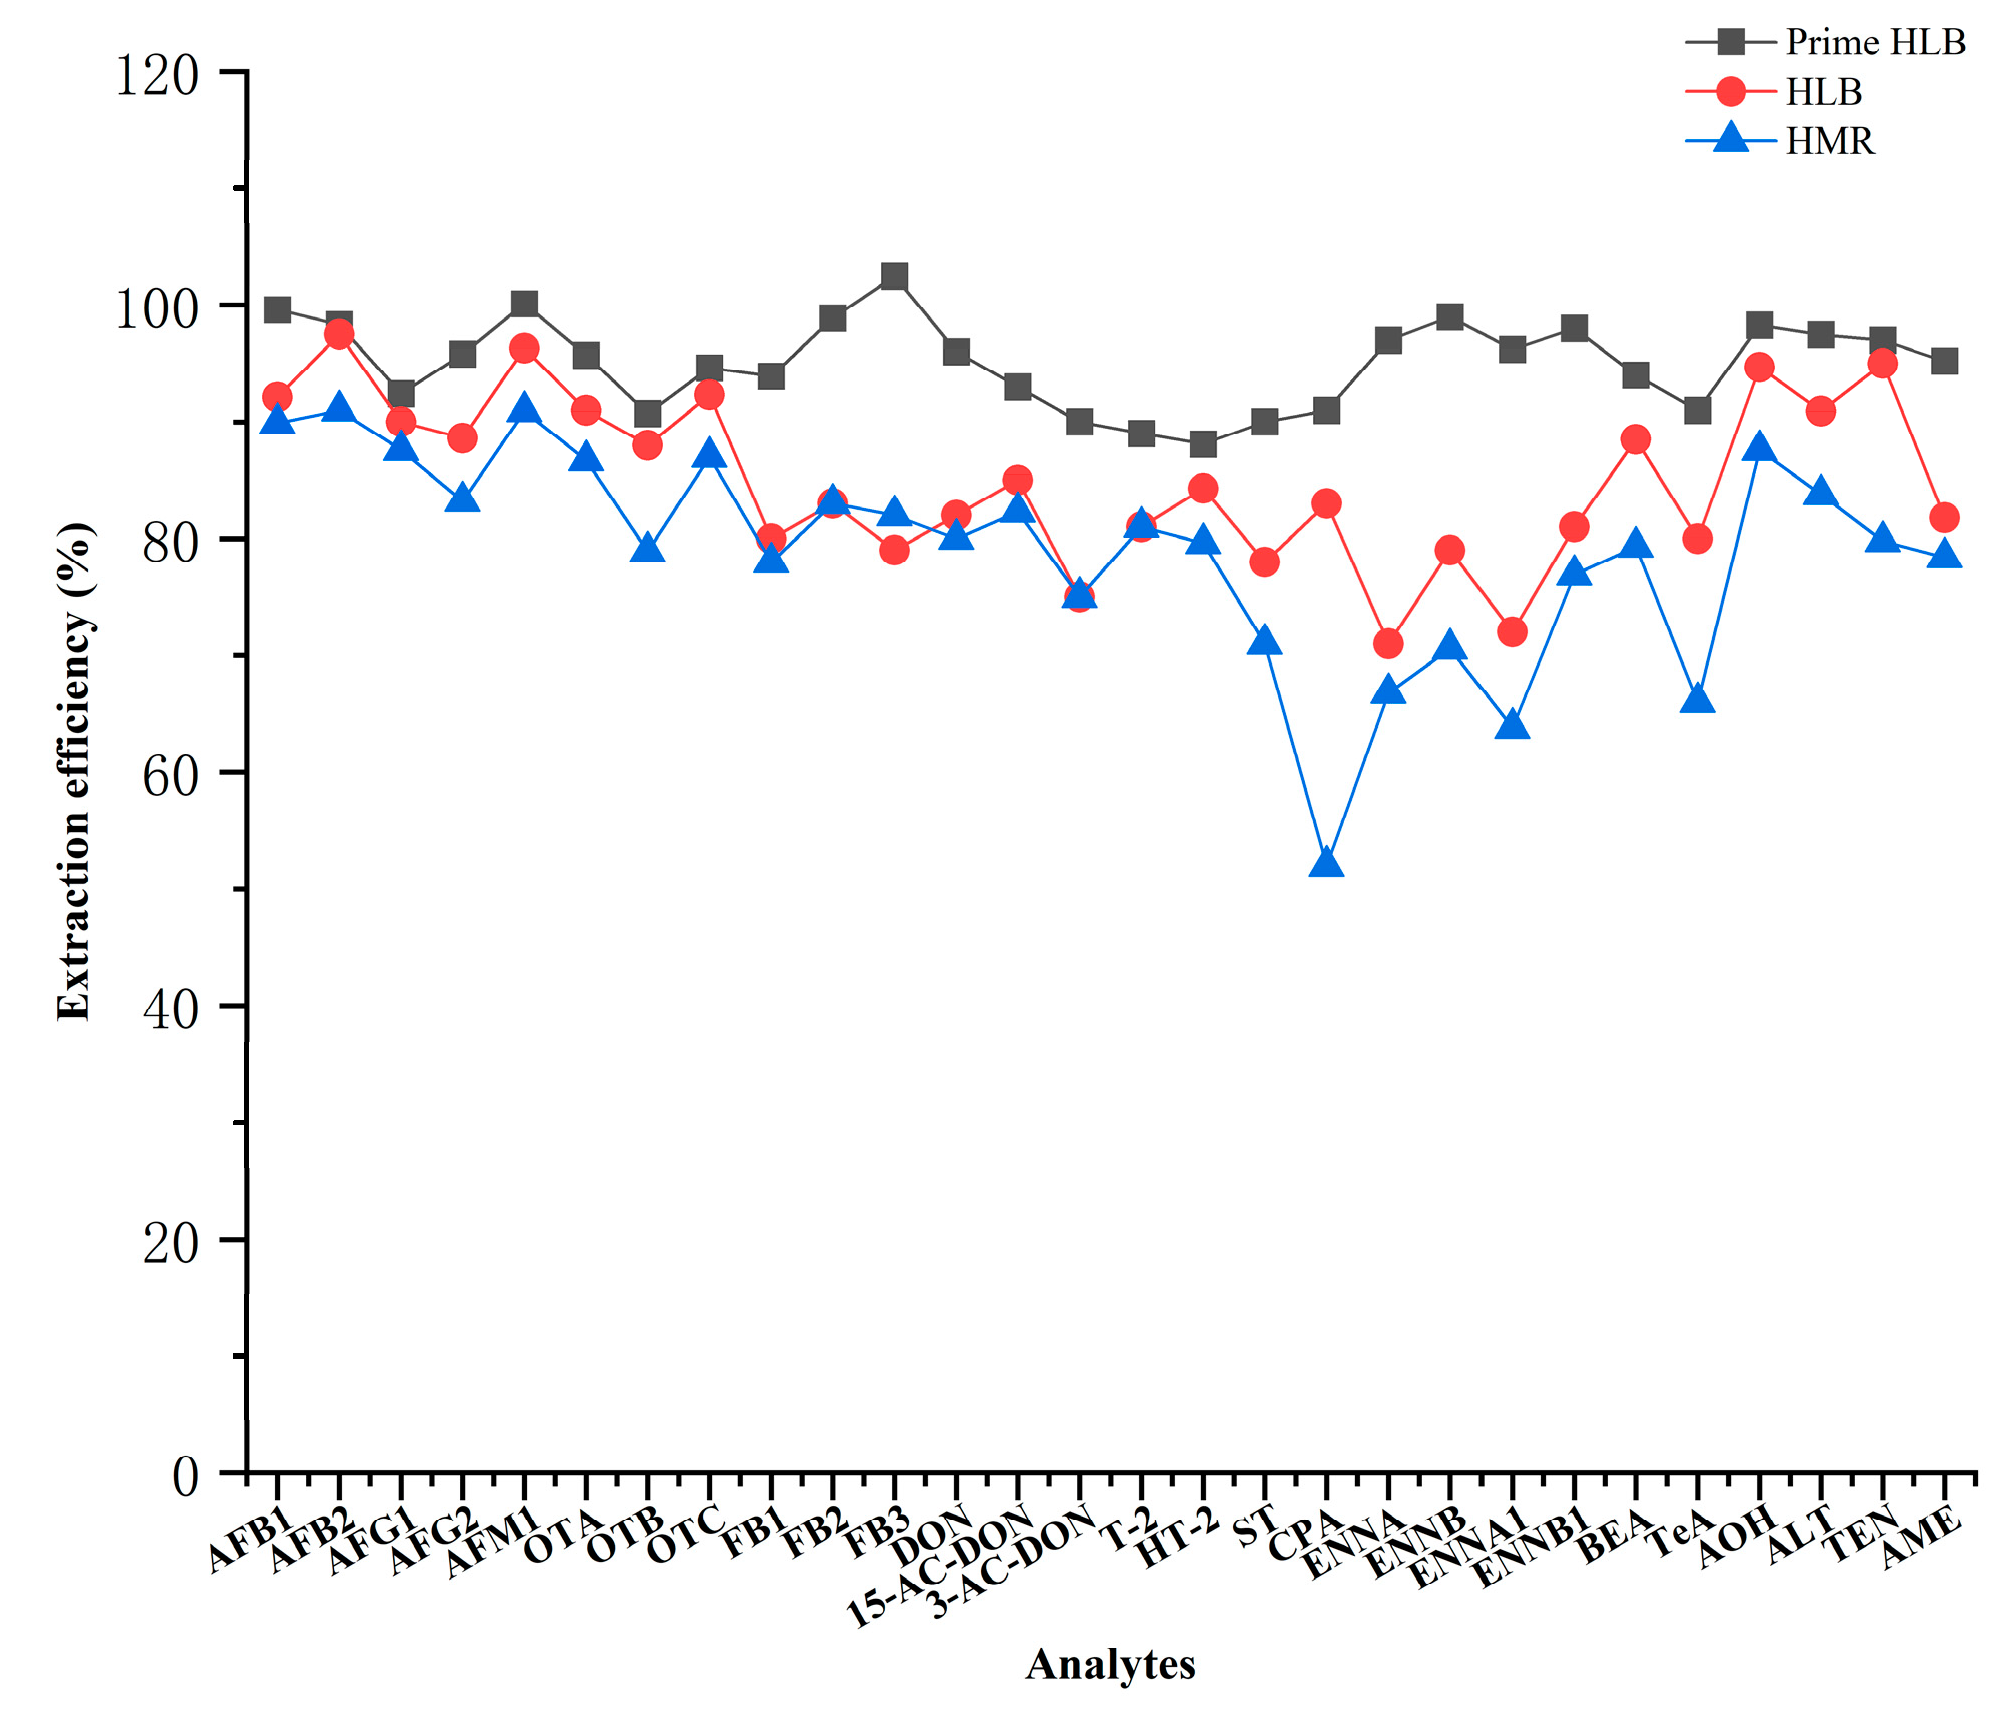
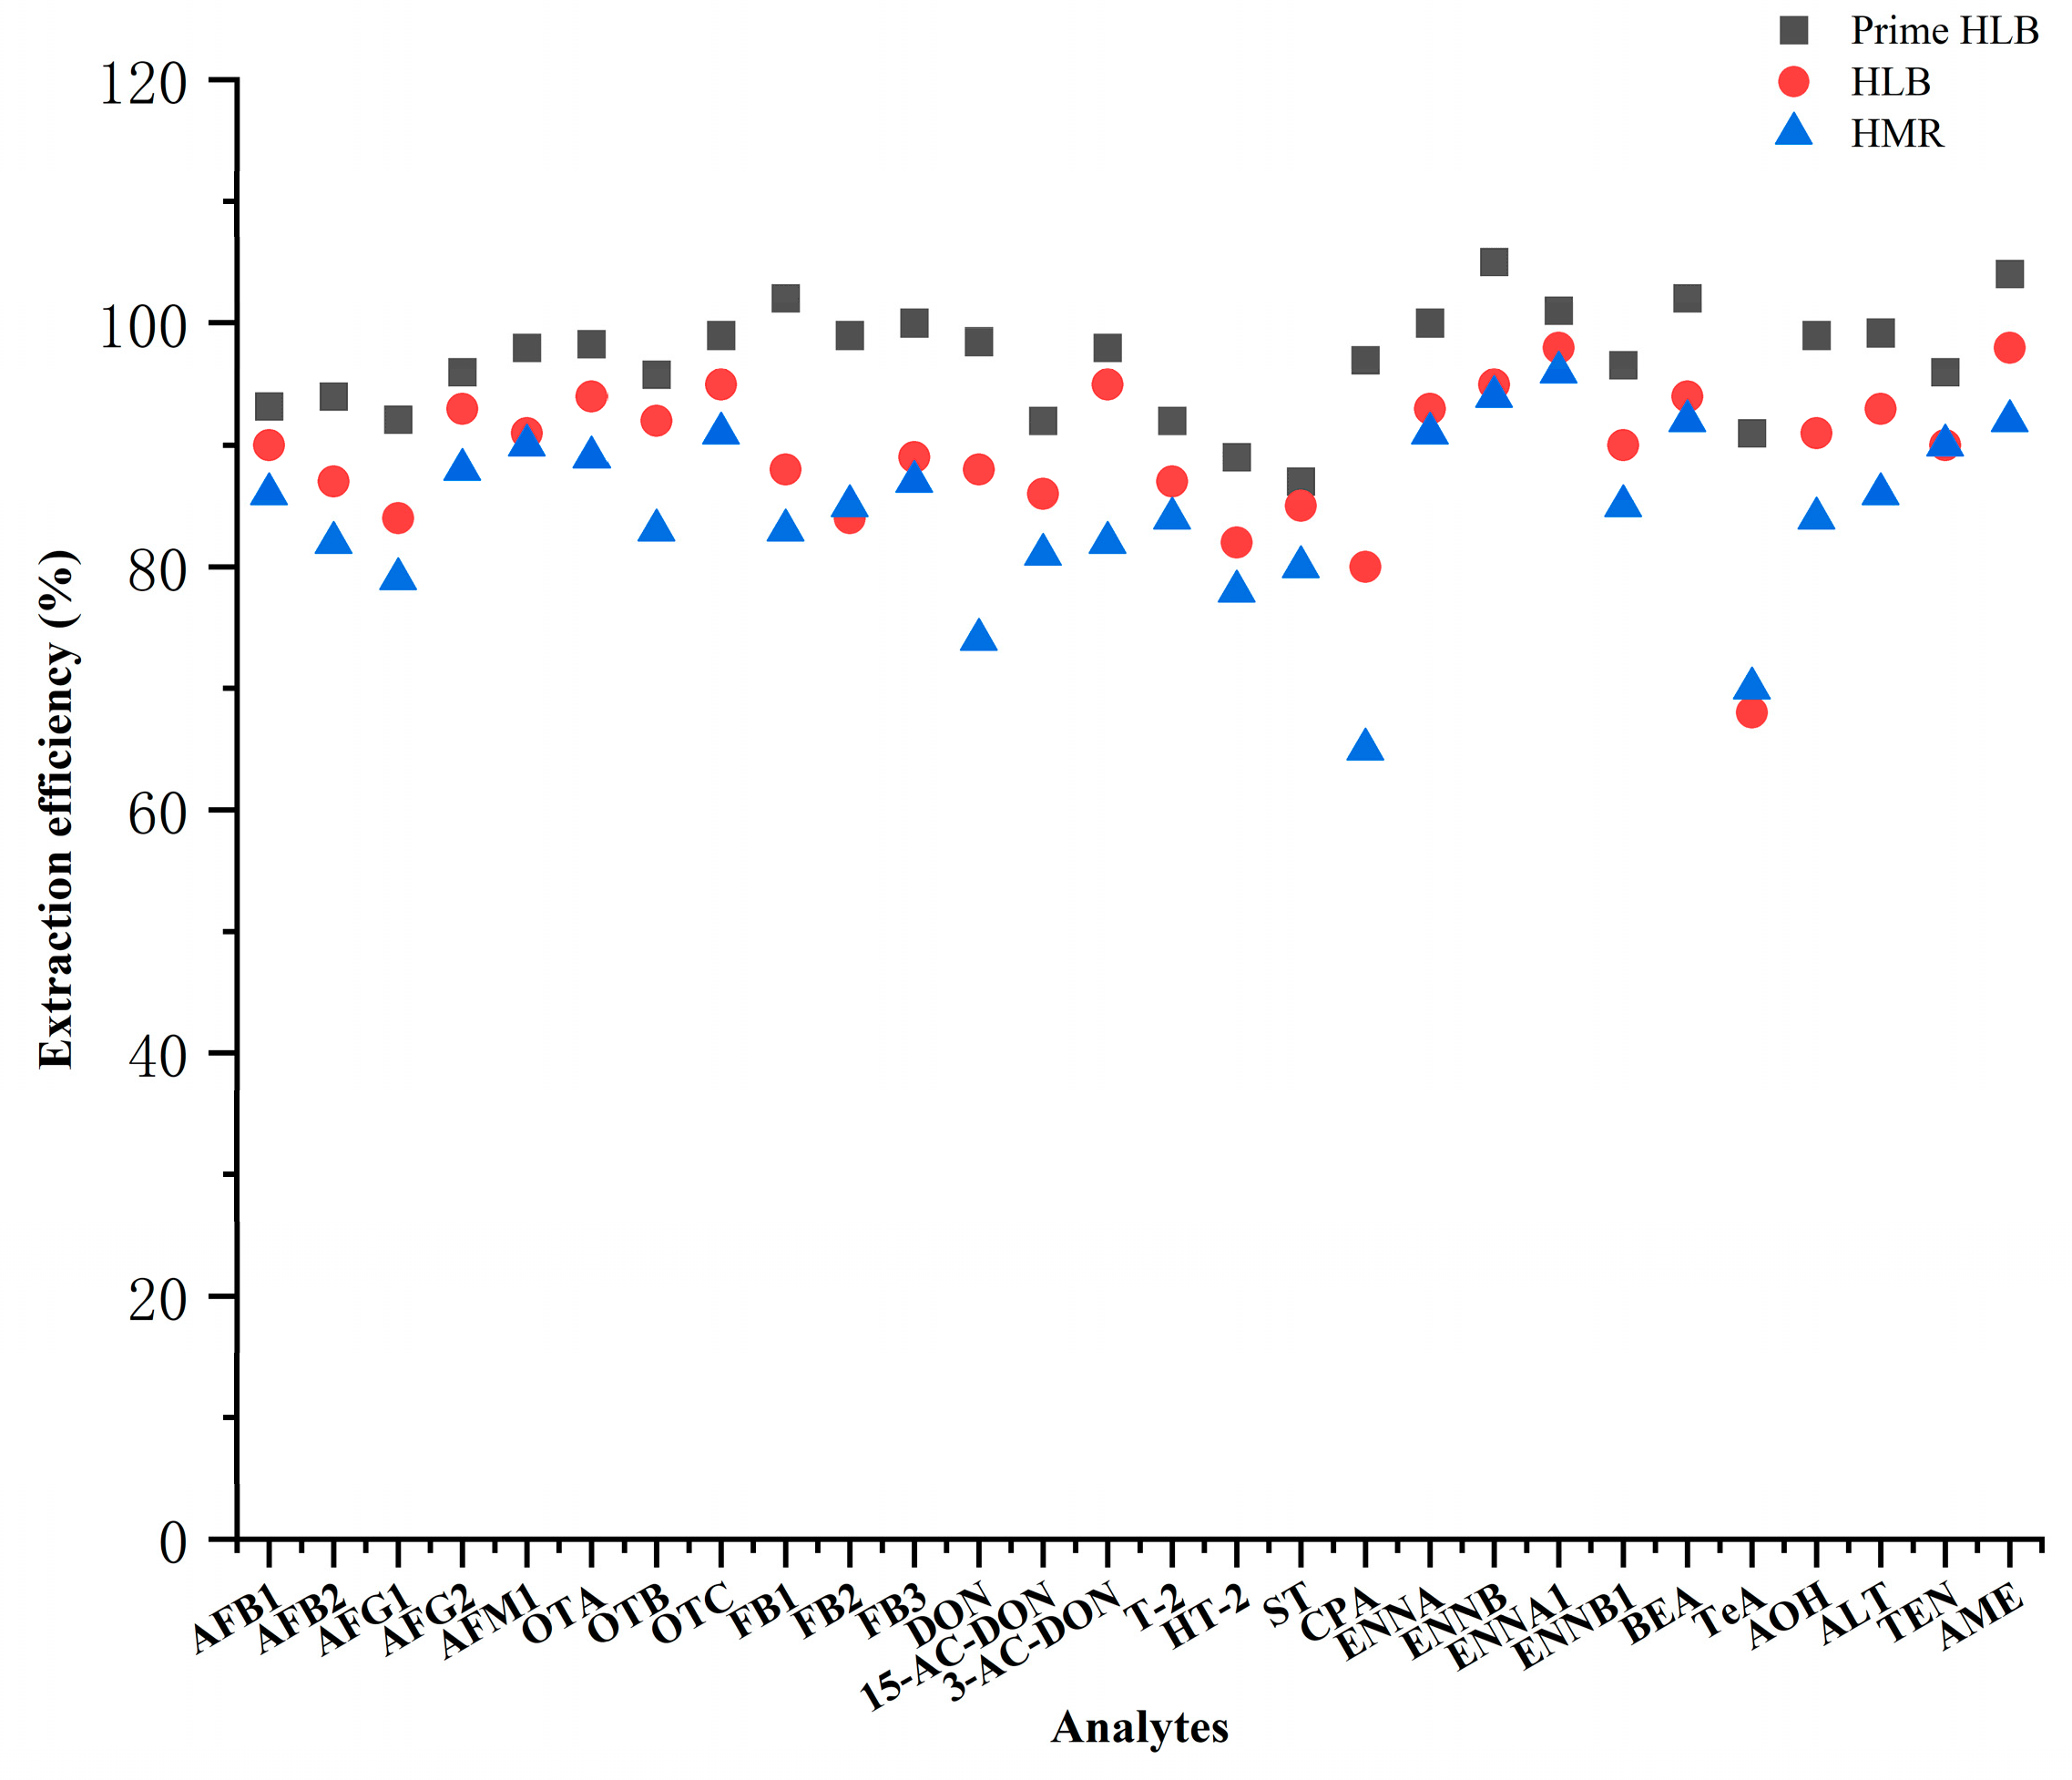
Wheat products mainly contain proteins, lipids, pigments, and other interfering substances, whereas urine mainly contains salt, urea, and endogenous metabolites. These substances can easily cause matrix effects during analysis and, thus, affect quantitative accuracy. The SPE technique was employed to remove matrix interferences and improve method stability and accuracy. In this study, three different solid-phase extraction cartridges (Prime HLB, HLB, and HMR) were compared for their effects on the extraction recoveries of multiple mycotoxins in wheat products and urine. In both matrices, the extraction efficiencies obtained with the Prime HLB cartridge were higher than those obtained with the other two cartridges, as illustrated in Figure 4 and Figure 5. The extraction efficiencies obtained with the Prime HLB cartridge were 88.1~102% and 91.0~105%, respectively. Therefore, the Prime HLB cartridge was selected as the solid-phase extraction cartridge for sample cleanup in both matrices.

2.3. Optimization of Enzyme Hydrolysis

After renal metabolism, mycotoxins in urine may exist not only in free forms but also as glucuronide conjugates formed through phase II metabolism. These conjugated metabolites are more polar and cannot be fully detected by conventional methods designed for free toxins. Therefore, β-glucuronidase was added to urine samples for enzymatic hydrolysis to convert the conjugated metabolites into their free forms [23].
In this study, a 1.0 mL urine sample was treated with different volumes of β-glucuronidase, namely 10.0 µL (1000 U), 20.0 µL (2000 U), 30.0 µL (3000 U), and 40.0 µL (4000 U). After incubation in a 37 °C water bath for 16 h, the extraction efficiencies of DON and TeA increased with increasing amounts of β-glucuronidase, whereas no obvious changes were observed for the other mycotoxins. When the enzyme volume increased from 20.0 µL to 30.0 µL, no further obvious improvement in extraction efficiency was observed. These results indicated that the optimal extraction efficiency could be achieved by adding 20.0 µL β-glucuronidase per milliliter of urine sample. DON and TeA, which may occur in conjugated forms in urine, became free forms when urine samples were hydrolyzed [23]. Therefore, 20.0 µL β-glucuronidase was added to each 1.0 mL urine sample in this study.

2.4. Validation Experiments

The established method (enzymatic hydrolysis, SPE cleanup, and UPLC-MS/MS analysis) was evaluated in terms of linearity, recovery (RE), repeatability (RSD), limit of detection (LOD), limit of quantification (LOQ), and matrix effects (MEs). Method validation was conducted with reference to the general principles of ICH Q2(R2) for analytical procedure validation [40]. For the wheat product matrix, the analytical performance was further evaluated in light of the Commission Implementing Regulation (EU) 2023/2782 [41].
The standard stock solutions were diluted with H2O/ACN (1/9, v/v) to prepare mixed standard solutions. For wheat product samples, the concentration range of 0.01~400 μg/L was used. For urine samples, the concentration range was 0.001~200 μg/L. Satisfactory linearity was obtained with correlation coefficients (R2) greater than 0.99 for all analytes in both matrices.
For both methods, recoveries were calculated based on the internal standard method. In wheat product samples, the mean spiked recoveries ranged from 70.2% to 120%, and the RSDs ranged from 1.6% to 9.1%. In urine samples, the mean spiked recoveries ranged from 79.3% to 120%, and the RSDs ranged from 0.7% to 9.4%. The detailed RE (%) and RSD (%) values at each concentration level are presented in Table 1 and Table 2. For wheat product samples, the low spiking levels for all compounds were set as follows: AFB1 and AFG1, 0.08 μg/L; AFB2 and AFG2, 0.02 μg/L; AFM1, 0.1 μg/L; OTA, OTB, and OTC, 0.2 μg/L; FB1, FB2, FB3, and CPA, 5.0 μg/L; T-2, HT-2, DON, 3-Ac-DON, and 15-Ac-DON, 10.0 μg/L; ST, 1.0 μg/L; ENNA, ENNA1, and BEA, 1.0 μg/L; ENNB and ENNB1, 0.2 μg/L; ALT, 2.5 μg/L; AOH, 2.0 μg/L; TeA, 5.0 μg/L; TEN, 1.0 μg/L; and AME, 0.2 μg/L. For urine samples, the low spiking levels for all compounds were set as follows: AFB1 and AFG1, 0.04 μg/L; AFB2 and AFG2, 0.01 μg/L; AFM1, 0.05 μg/L; OTA, OTB, and OTC, 0.1 μg/L; FB1, FB2, FB3, and CPA, 2.5 μg/L; T-2, HT-2, DON, 3-Ac-DON, and 15-Ac-DON, 5.0 μg/L; ST, 0.5 μg/L; ENNA, ENNA1, and BEA, 0.05 μg/L; ENNB and ENNB1, 0.01 μg/L; ALT, 1.25 μg/L; AOH, 1.0 μg/L; TeA, 2.5 μg/L; TEN, 0.5 μg/L; and AME, 0.1 μg/L. For both matrices, the medium and high spiking levels for AFG1, AFB1, AFG2, AFB2, AFM1, OTA, OTB, OTC, FB1, FB2, FB3, T-2, HT-2, DON, 3-Ac-DON, 15-Ac-DON, ST, and CPA were set at 10-fold and 40-fold of the low spiking level, respectively. For ENNA, ENNA1, BEA, ENNB, ENNB1, ALT, AOH, TeA, TEN, and AME, the medium and high spiking levels were set at 2.5-fold and 10-fold of the low spiking levels, respectively, in wheat products. For ENNA, ENNA1, BEA, ENNB, and ENNB1, the medium and high spiking levels were set at 40-fold and 100-fold of the low spiking levels, respectively; for ALT, AOH, TeA, TEN, and AME, the medium and high spiking levels were set at 4-fold and 10-fold of the low spiking levels, respectively, in urine.
The LODs and LOQs were calculated by the low spiking level analyte concentrations corresponding to signal-to-noise ratios (S/N) of 3 and 10, respectively. In wheat product samples, the LODs ranged from 0.001 to 8.3 μg/kg, and the LOQs ranged from 0.002 to 25.0 μg/kg. In urine samples, the LODs ranged from 0.0001 to 1.0 μg/L, and the LOQs ranged from 0.0002 to 3.0 μg/L (Table 1 and Table 2). For the wheat product matrix, the LODs and LOQs of the method established in this study were superior to those of previously published methods. For instance, Kim et al. developed an LC–MS/MS method for 35 mycotoxins in wheat flour with LODs ranging from 0.01 to 7.50 μg/kg and LOQs ranging from 0.02 to 22.73 μg/kg [42]; Narváez et al. validated a method for 24 mycotoxins in breakfast cereals with LOQs of 0.20–12.5 μg/kg [43]. Compared with these studies, our method for wheat products exhibited lower minimum detection limits. Regarding the urine matrix, Peris-Camarasa et al. reported a UHPLC–MS/MS method for 12 urinary mycotoxins with LOQs ranging from 0.005 to 0.5 ng/mL [25]. The method developed in the present study demonstrated more favorable detection limits.
In this study, matrix effects in wheat product samples and urine samples were systematically evaluated. As shown in Table 1 and Table 2, the matrix effects ranged from 33.9% to 116% in wheat product samples and from 9.65% to 114% in urine samples. Among all analytes, AFB1, AFB2, and AFG1 exhibited pronounced signal suppression in both matrices. Interference from endogenous matrix components can give rise to matrix effects, resulting in signal enhancement or suppression of the target analytes. Although some target compounds exhibited matrix effects to a certain extent, the matrix-induced signal variations were effectively compensated after internal standard correction. The recoveries of all target mycotoxins ranged from 70.2% to 120%, with RSDs ranging from 0.7% to 9.4%, indicating that internal standard correction ensured the accuracy of the method.
Overall, compared with previously reported methods, the present method offers several practical advantages. It can be applied to both wheat products and human urine, covers a broad panel of 28 mycotoxins, achieves satisfactory sensitivity, and simplifies the sample preparation procedure. These features make the presented method suitable for integrating mycotoxin occurrence investigation and human biomonitoring studies.

2.5. Application of the Method

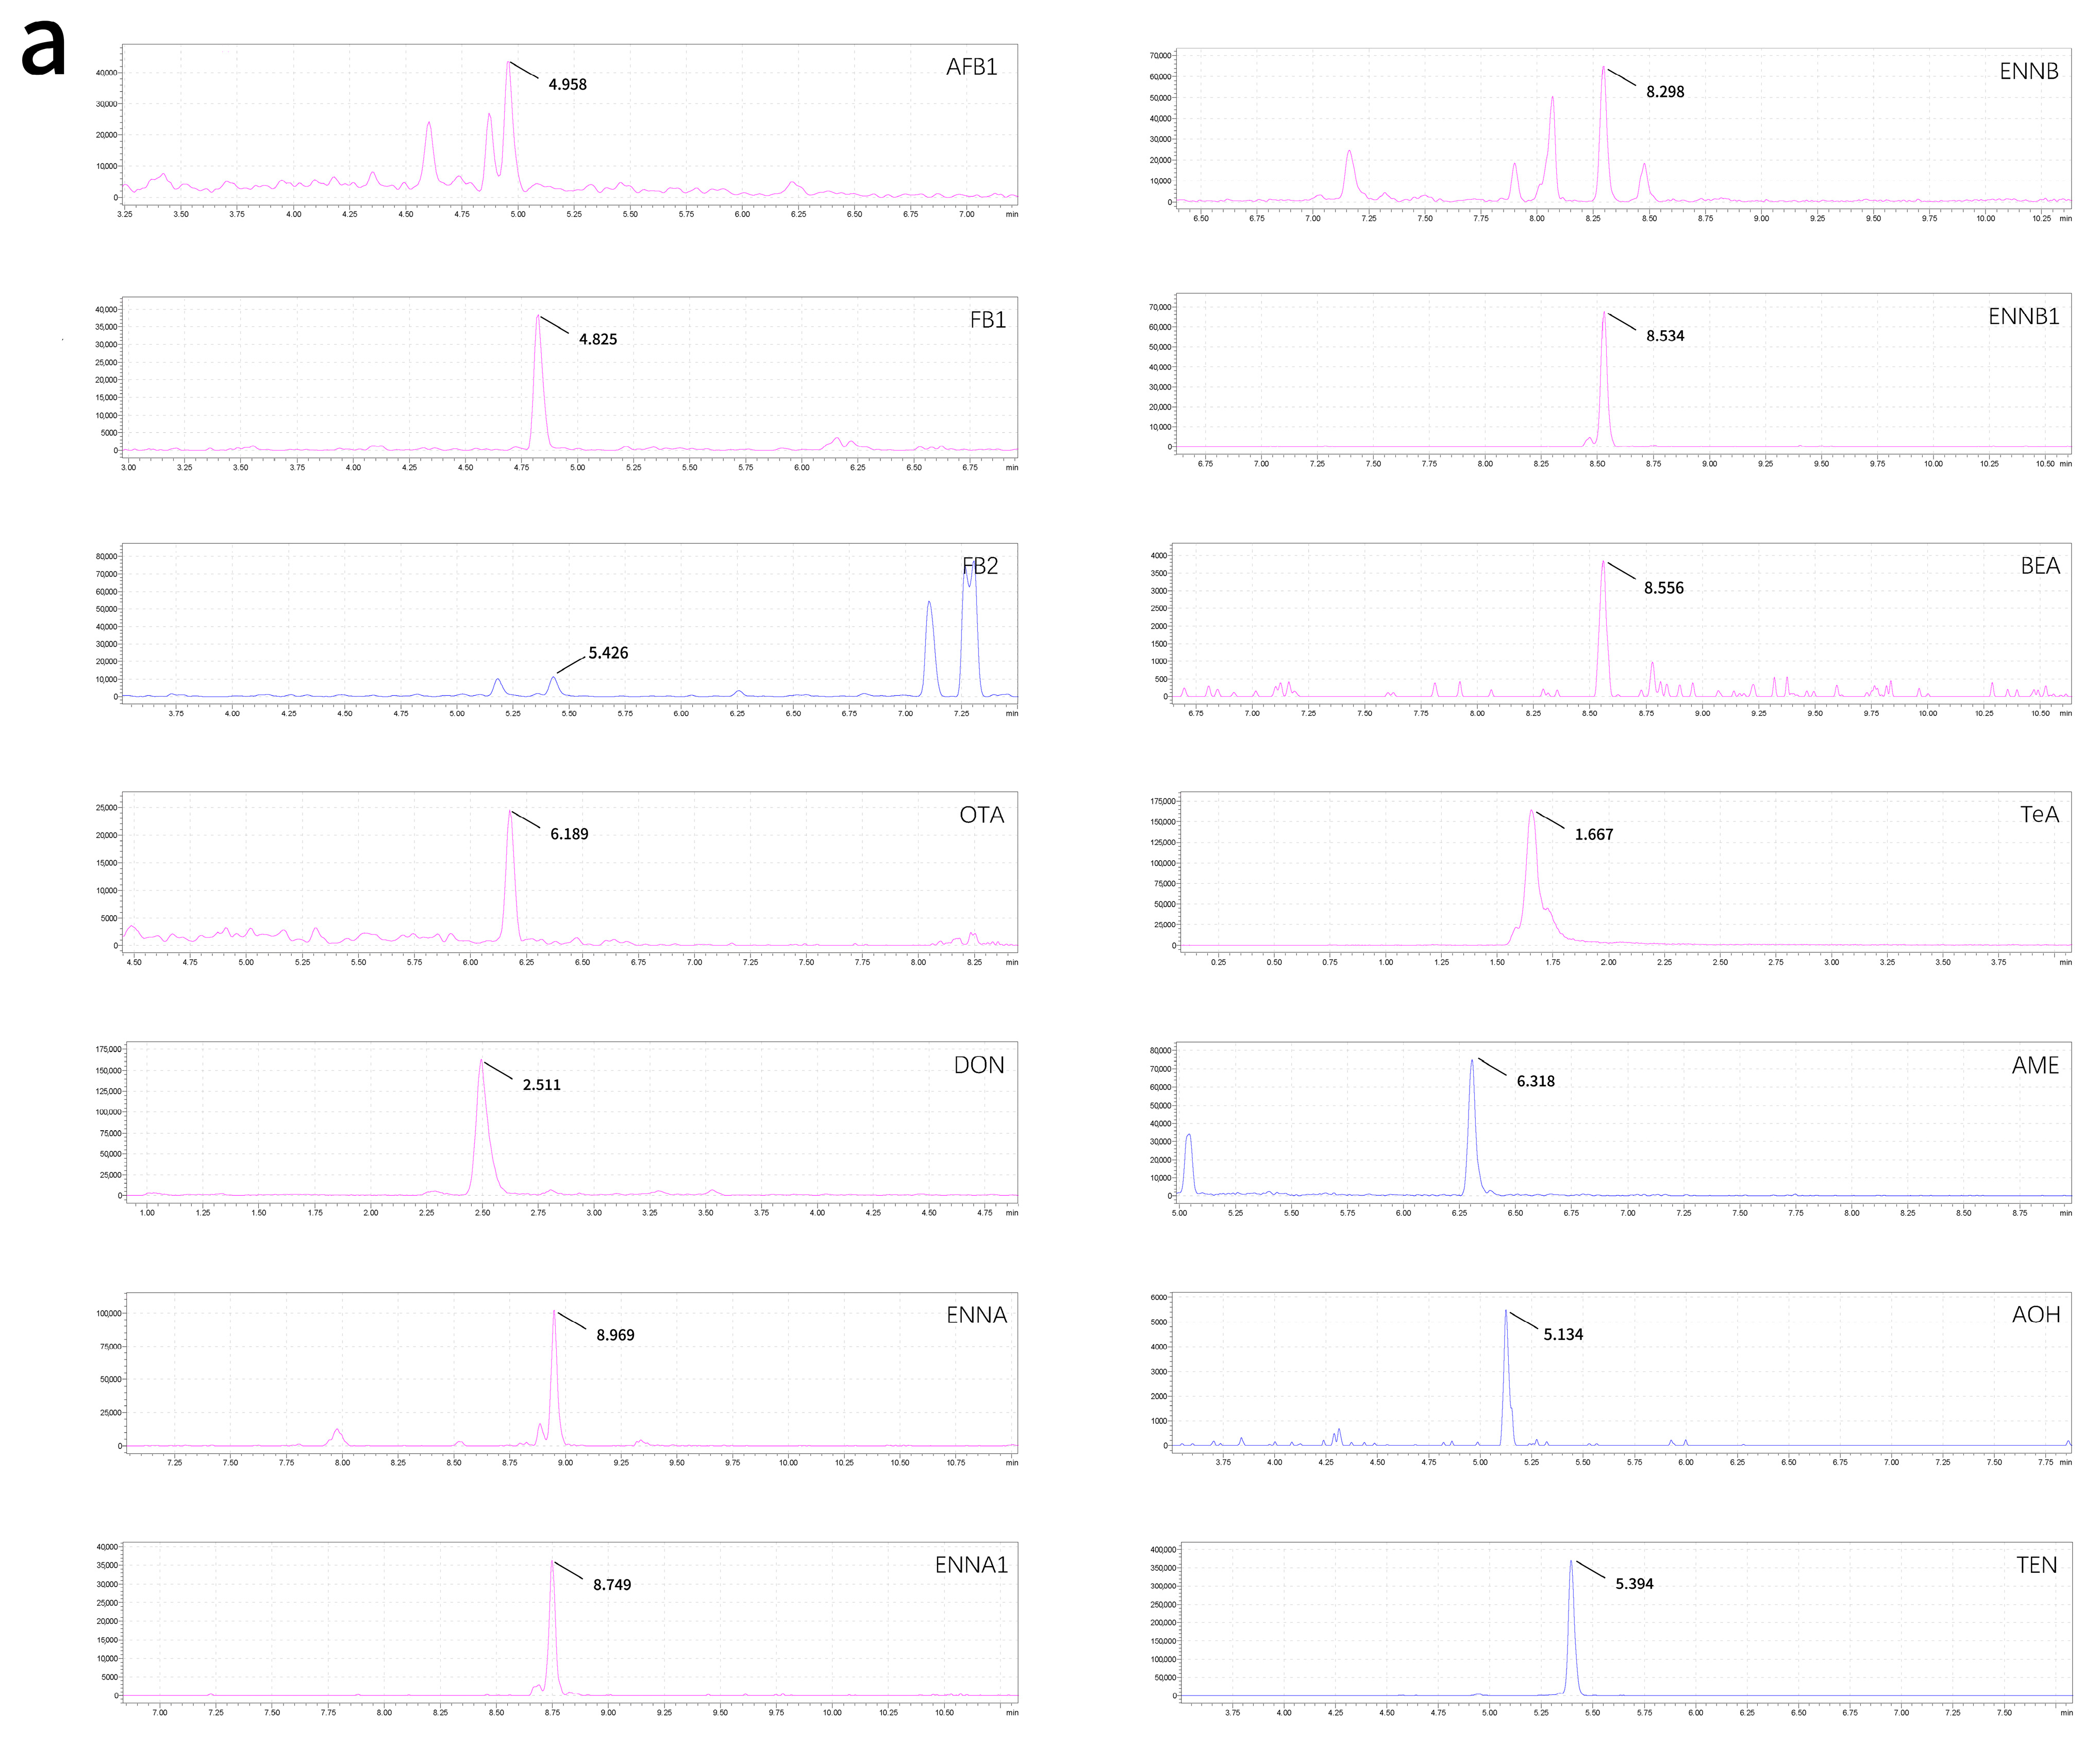
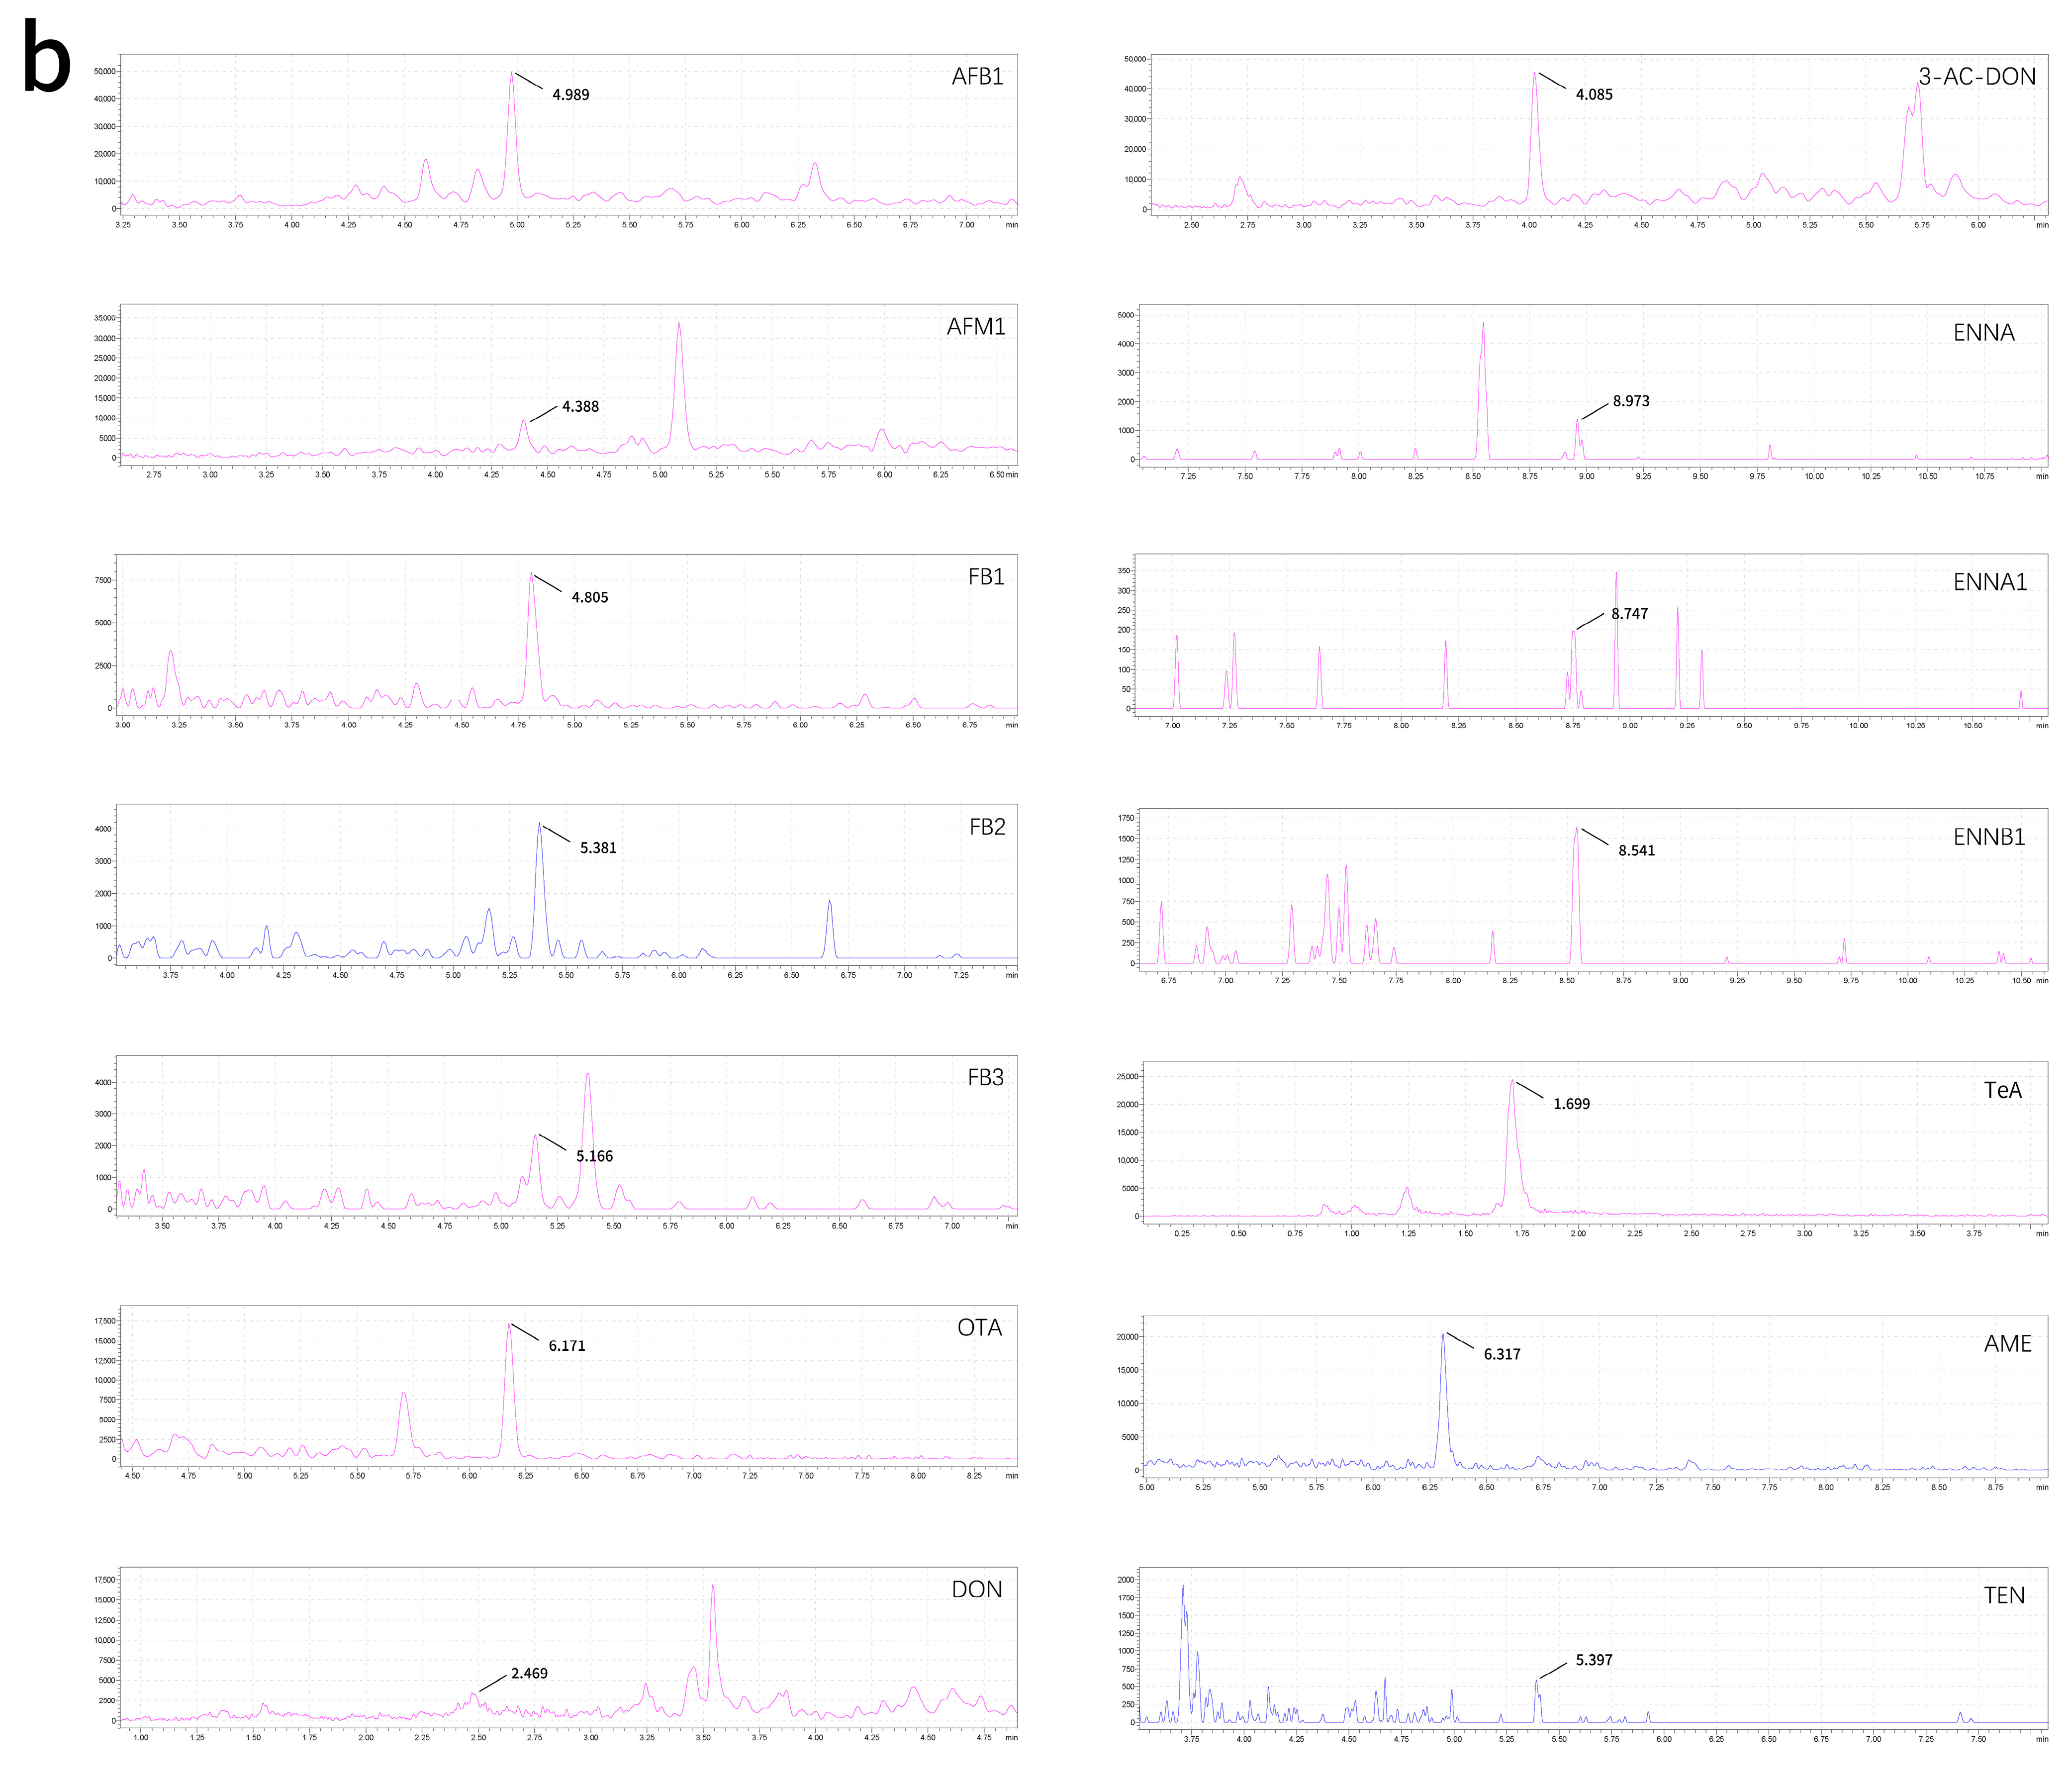
The optimized method was applied to the analysis of 10 wheat product samples and 10 urine samples to evaluate its practical applicability. Quality control (QC) samples were included in all analytical batches, and the measured values were required to be within ±15% of the theoretical values. Multiple mycotoxins were detected in both matrices. In wheat product samples, at least seven mycotoxins were detected in each sample, with DON, ENNB, ENNA1, ENNB1, TeA, and TEN detected in all samples, and the concentrations of these mycotoxins ranged from 0.061 to 108.06 μg/kg. In urine samples, at least five mycotoxins were detected in each sample, and FB1 was detected in all samples. TeA showed the highest mean detected concentration in both matrices. The mean concentrations of wheat product and urine samples were 39.89 ± 37.18 μg/kg and 14.7 ± 14.8 μg/L, respectively. The detailed occurrence results are summarized in Table 3, and representative multiple reaction monitoring (MRM) chromatograms are shown in Figure 6. It should be noted that these real sample data were obtained from a limited number of samples and are presented only for methodological demonstration, rather than as representative contamination or population exposure levels. Nevertheless, the successful detection of multiple target analytes in both matrices confirms the practical applicability of the developed UPLC–MS/MS method to complex food and biological samples.

3. Conclusions

In this study, an accurate, sensitive, and efficient UPLC-MS/MS method was established for the determination of 28 mycotoxins in wheat products and human urine. The mean spiked recoveries of the target toxins ranged from 70.2% to 120% in wheat products and from 79.3% to 120% in human urine, with RSD ranges of 1.6~9.1% and 0.7~9.4%, respectively. These values were all within acceptable ranges. After optimization, the method showed good sensitivity, with LODs of 0.001~8.3 μg/kg and LOQs of 0.002~25.0 μg/kg for wheat product samples, and LODs of 0.0001~1.0 μg/L and LOQs of 0.0002~3.0 μg/L for urine samples.
The optimized method was successfully applied to the analysis of wheat products and urine, in which at least seven and five mycotoxins were detected in wheat product samples and urine samples, respectively. In this preliminary application, TeA showed the highest detected concentration in both matrices, while FB1 exhibited relatively high detection rates in both matrices. These findings support the practical applicability of the proposed method in real samples. Overall, the established method can be used for the simultaneous quantitative determination of 28 mycotoxins in wheat products and human urine and provides technical support for the assessment of contamination levels in wheat products and for human biomonitoring.

4. Materials and Methods

4.1. Reagents and Chemicals

Methanol, acetonitrile, formic acid, and ammonium acetate were all LC-MS-grade and were purchased from Fisher Scientific (Waltham, MA, USA). β-Glucuronidase (from abalone, 100,000 U) was purchased from ANPEL Laboratory Technologies (Shanghai, China). Anhydrous sodium dihydrogen phosphate (NaH2PO4) and anhydrous disodium hydrogen phosphate (Na2HPO4) were both HPLC-grade and were purchased from Dikma Technologies (Beijing, China). The Prime HLB (3 cc, 60 mg) and HLB (3 cc, 60 mg) solid-phase extraction cartridges, as well as the ACQUITY UPLC BEH C18 (2.1 × 100 mm, 1.7 µm) column, were purchased from Waters (Milford, MA, USA). The HMR (20 mg, 30 μm, 1 mL) solid-phase extraction cartridge was purchased from Anavo (Beijing, China). Ultrapure water was prepared using a water purification system.
An ultra-high performance liquid chromatography–tandem triple quadrupole mass spectrometer (LC-MS 30A-8060NX, Shimadzu, Kyoto, Japan), high-speed refrigerated centrifuge (5810R, Eppendorf, Hamburg, Germany), electronic balance (ME204, METTLER TOLEDO, Greifensee, Switzerland), vortex mixer (MS 3 Basic, IKA, Staufen, Germany), nitrogen evaporator (N-EVAP-24, Organomation, Berlin, MA, USA), ultrapure water system (Millipore, Burlington, MA, USA), constant-temperature shaking water bath (SW22, Julabo, Seelbach, Germany), and shaker (HS 501 D, IKA, Staufen, Germany) were used.
The standard solutions of 28 mycotoxins and 18 isotopically labeled mycotoxins standard solutions were both purchased from Qingdao Pribolab Pte. Ltd. (Qingdao, China). (AFB2, AFG2, AFB1, and AFG1, 1.0 μg/mL; OTA, OTB, and OTC, 10.0 μg/mL; ENNA, ENNA1, BEA, ENNB, ENNB1, AME, TEN, AOH, ST, TeA, ALT, AFM1, FB1, FB2, FB3, DON, 3-Ac-DON, 15-Ac-DON, CPA, T-2, and HT-2, 100 μg/mL; 13C15-AME, 40 μg/L; 13C17-AFG1, 13C17-AFG2, 13C17-AFB1, 13C17-AFB2, and 13C17-AFM1, 100 μg/L; 13C34-FB1, 13C34-FB2, 13C33-ENNB, 13C34-ENNB1, 13C20-OTA, and 13C22-TEN, 200 μg/L; 13C14-AOH, 400 μg/L; 13C15-DON, 13C17-3-Ac-DON, 13C10-TeA, 13C15-ALT, and 13C45-BEA, 1000 μg/L). All standard solutions were stored at −20 °C.

4.2. Samples

In this study, random urine samples were collected from 10 participants at the Physicochemical Laboratory of Beijing Chaoyang District Center for Disease Control and Prevention (Chaoyang District Health Supervision Institute), Beijing, including 3 males and 7 females. In addition, 10 wheat product samples, all of which were wheat flour from different brands, were collected from the retail markets in Chaoyang District, Beijing. All samples were stored at −20 °C. All urine samples were anonymized prior to analysis. These samples were used solely for methodological demonstration and preliminary applicability evaluation of the proposed method.

4.3. Preparation of Standard Solutions and Quality Control Samples

Before use, the standard solutions of the 28 mycotoxins were diluted with H2O/ACN (1/9, v/v) to prepare working solutions at concentrations ranging from 0.001 to 400 μg/L.
Corresponding isotopically labeled internal standards were not commercially available for some target compounds; surrogate internal standards were selected for correction based on the similarity in retention times and response behaviors. 13C34-ENNB1 was used as the internal standard for ENNA and ENNA1; 13C34-FB2 was used as the internal standard for FB3; 13C20-OTA was used as the internal standard for OTB, OTC, ST, CPA, T-2, and HT-2; and 13C17-3-Ac-DON was used as the internal standard for 15-Ac-DON. The remaining 18 mycotoxins were quantified using their corresponding internal standards.
All standard solutions at different concentrations contained 0.4 μg/L 13C15-AME; 1.0 μg/L 13C17-AFG1, 13C17-AFG2, 13C17-AFB1, 13C17-AFB2, and 13C17-AFM1; 2.0 μg/L 13C34-FB1, 13C34-FB2, 13C33-ENNB, 13C34-ENNB1, 13C20-OTA, and 13C22-TEN; 4.0 μg/L 13C14-AOH; and 10.0 μg/L 13C45-BEA, 13C15-DON, 13C17-3-Ac-DON, 13C10-TeA, and 13C15-ALT.
The QC samples were prepared by spiking the above mixed standard solution into analyte-free blank samples to obtain three concentration levels (low, medium, and high). QC samples were analyzed in each batch of test samples, and the measured values were required to be within ±15% of the theoretical values.
To monitor potential background contamination during sample preparation and instrumental analysis, solvent blanks and procedural blanks were included in each analytical batch. The procedural blanks consisted of blank matrix samples and were subjected to the same extraction, cleanup, and UPLC–MS/MS analytical procedures as the test samples, but without the addition of target analytes. The solvent blanks were used to evaluate potential contamination and interference originating from the solvents and the instrumental system. No obvious interfering peaks corresponding to the target analytes were observed in the blank samples.

4.4. Sample Preparation

Wheat product samples: Accurately weigh 2.00 g of the ground sample (to 0.01 g) into a 50.0 mL centrifuge tube, add the internal standards, and vortex-mix thoroughly. Then, add 10.0 mL of 1.0% formic acid H2O/ACN (10/90, v/v) to the mixed extraction solvent. After vortex mixing, extract the sample by shaking for 30 min. Following centrifugation at 10,000 r/min for 10 min at 4 °C, 1.0 mL of the supernatant is collected for cleanup.
Urine samples: The urine samples were thawed at room temperature and centrifuged at 10,000 r/min for 10 min at 4 °C. Then, 1.0 mL of urine was transferred into a 5.0 mL centrifuge tube, and the internal standards were added, followed by vortex mixing. After the addition of 20.0 µL β-glucuronidase (from abalone), the mixture was vortex-mixed and enzymatically hydrolyzed in a 37 °C water bath for 16.0 h. After the mixture was cooled to room temperature, 1.0 mL of FA/ACN (2/98, v/v) extraction solvent was added, followed by vortex mixing, and the mixture was allowed to stand for 30 min. After centrifugation at 10,000 r/min for 10 min at 4 °C, the supernatant was collected for cleanup.
The supernatants of both wheat product and urine samples were subjected to cleanup using a Prime HLB solid-phase extraction cartridge, separately. After sample loading, the cartridge pass-through was collected. The cartridge was then eluted sequentially with 1.0 mL of acetonitrile and 1.0 mL of methanol. The pass-through fraction and the cartridge eluates were combined and evaporated to near dryness under a stream of nitrogen in a 37 °C water bath. The residues were reconstituted with ACN/H2O (1/9, v/v) to final volumes of 200 μL for wheat product samples and 500 μL for urine samples. After vortex mixing for 1 min and centrifugation at 10,000 r/min for 10 min, the supernatants were collected for analysis.
For the determination of free target toxins, β-glucuronidase (from abalone) was not added to the sample; the enzymatic hydrolysis step was omitted, and all other procedures remained the same.

4.5. LC-MS/MS Condition

Analyses were performed using the UPLC-MS/MS system, consisting of an LC-30A (Shimadzu, Kyoto, Japan) binary pump and automatic injector coupled to an LCMS-8060NX triple quadruple mass spectrometer (Shimadzu, Kyoto, Japan).

4.5.1. Chromatographic Condition

Separation was achieved on a 2.1 × 100 mm, 1.7 µm BEH C18 column (Waters, Milford, MA, USA). The flow rate was 0.3 mL/min, the column temperature was 40 °C, and the injection volume was 10.0 μL. For the target compounds (AFB1, AFB2, AFG1, AFG2, AFM1, OTA, OTB, OTC, FB1, FB2, FB3, HT-2, T-2, DON, 3-Ac-DON, 15-Ac-DON, ST, and CPA), mobile phase 1 consisted of A (0.1% formic acid in water) and B (acetonitrile). For the target compounds (ENNA, ENNA1, ENNB, ENNB1, BEA, TeA, AOH, ALT, TEN, and AME), mobile phase 2 consisted of A (5.0 mmol/L ammonium acetate aqueous solution) and B (acetonitrile). The gradient program was as follows: 0–1.00 min, 10% B; 1.00–8.00 min, 10–95% B; 8.00–12.00 min, 95% B; 12.00–12.10 min, 95–10% B; and 12.10–16.00 min, 10% B.

4.5.2. Mass Spectrometry Condition

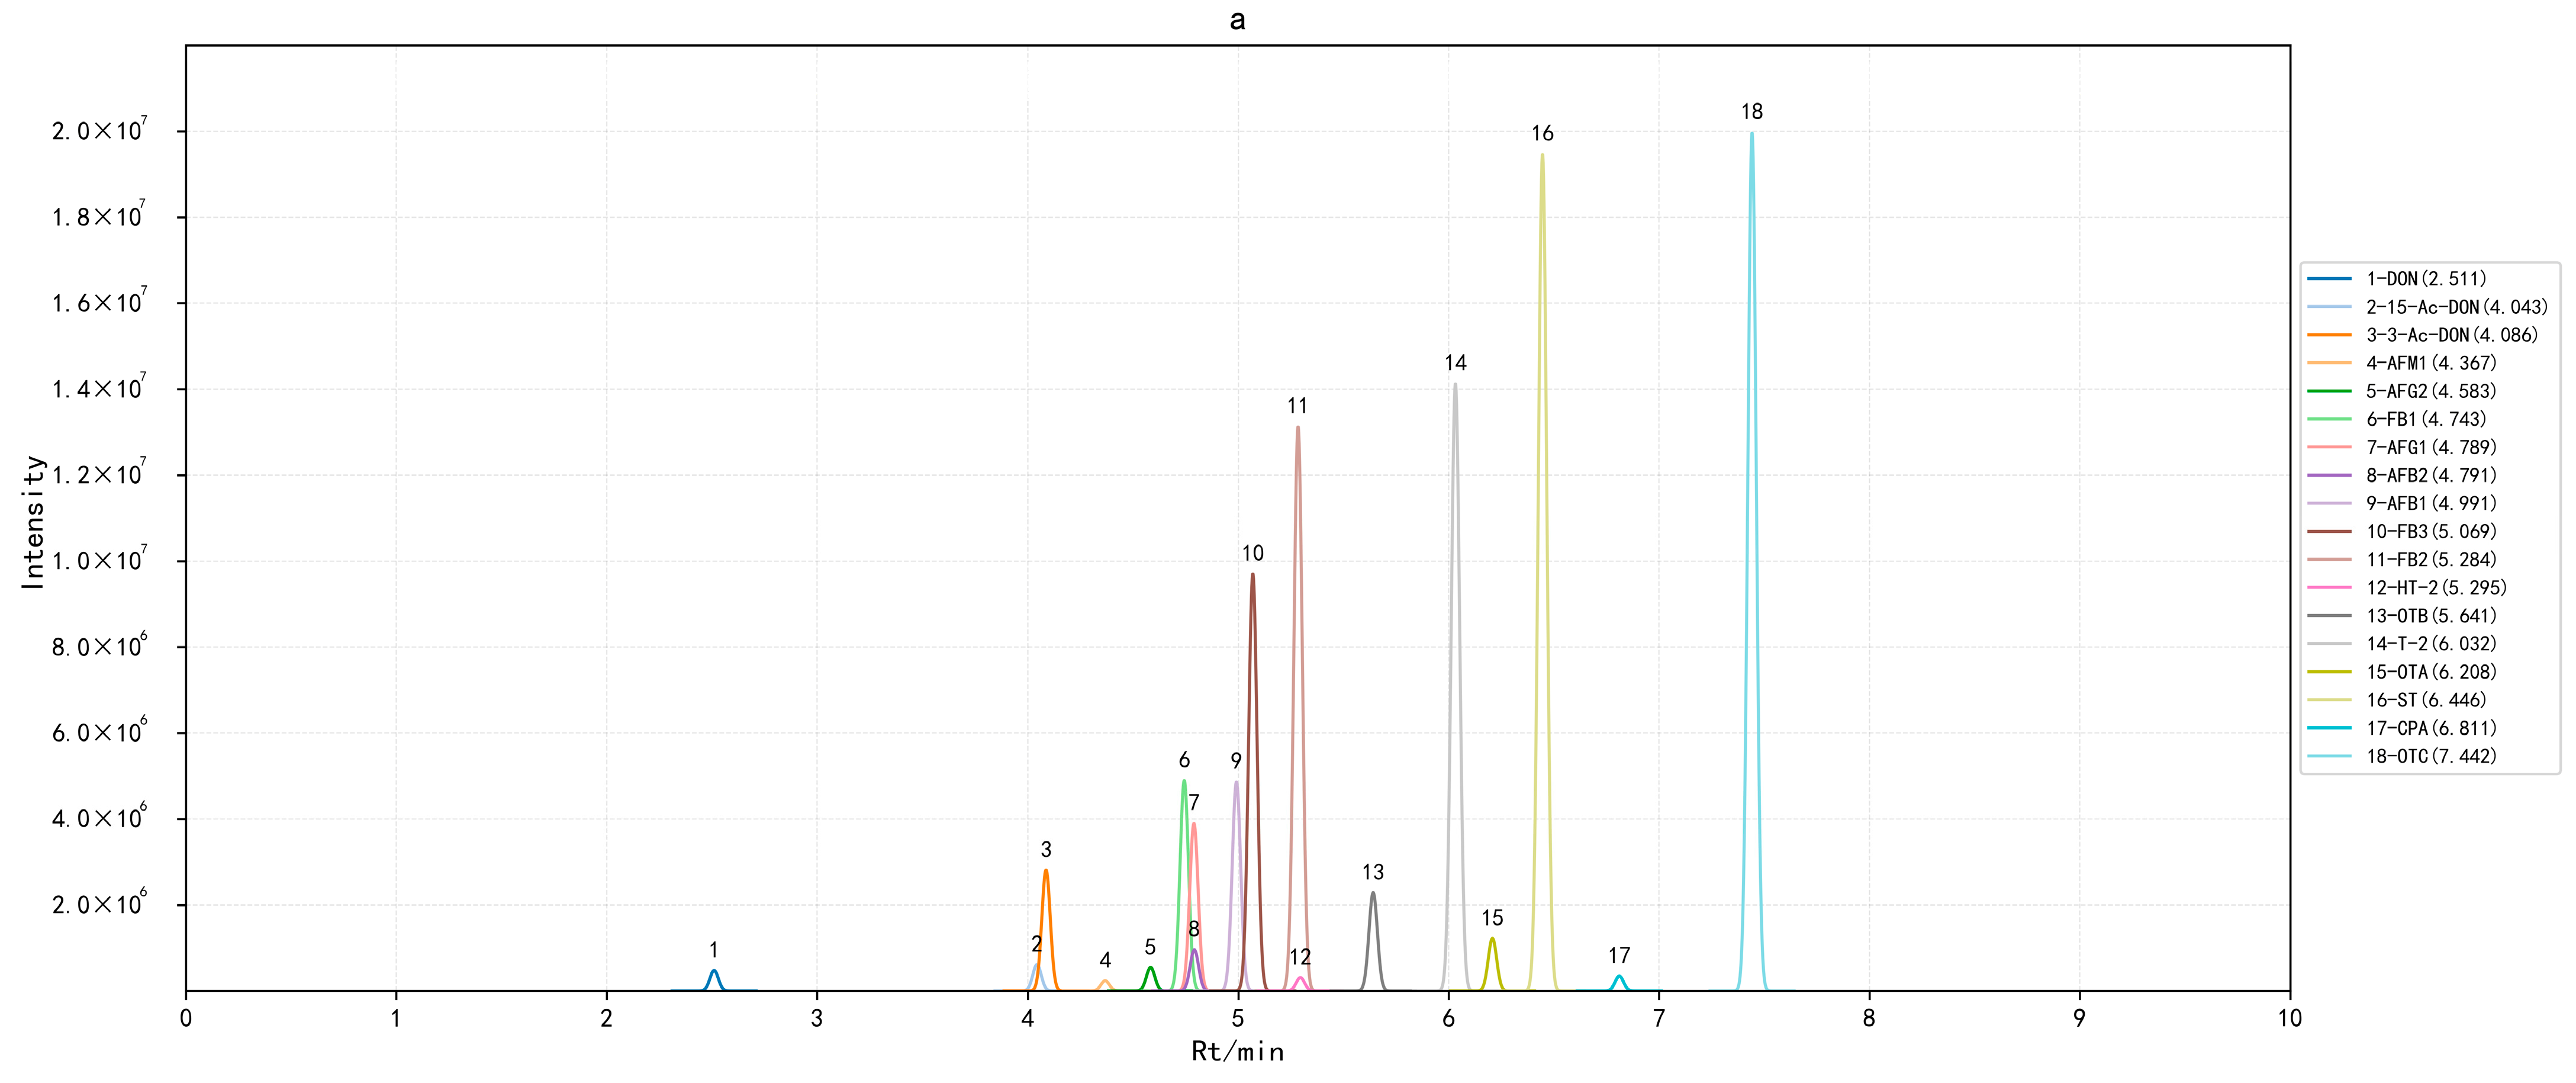
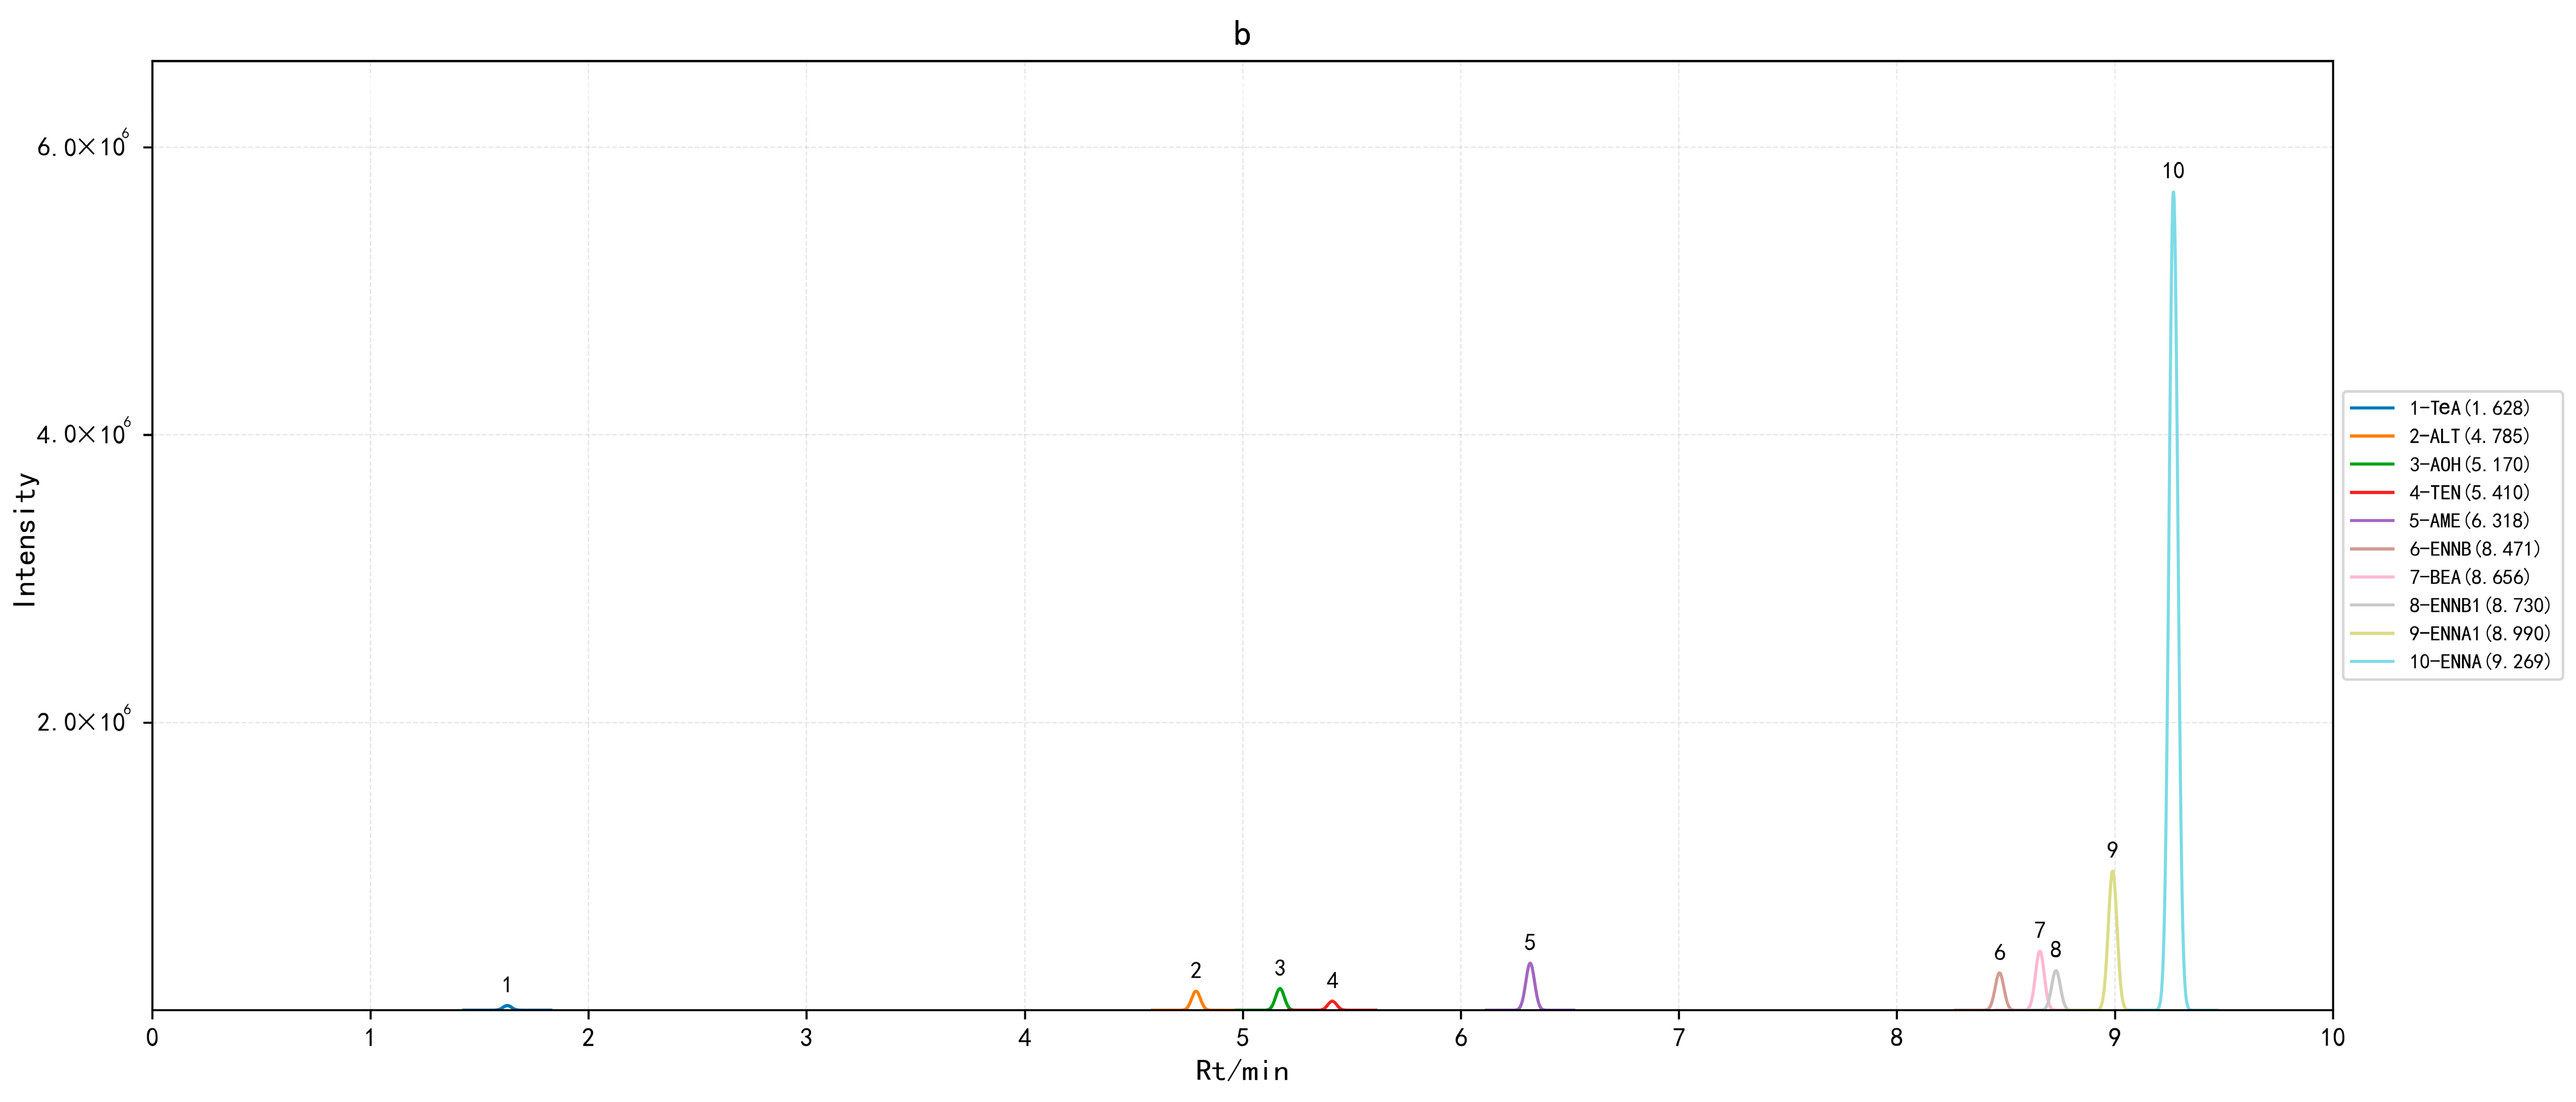
Both positive and negative ionization modes were run simultaneously, and MRM was employed during infusion. Other ionization source parameters were set as follows: interface temperature (I) was 300 °C, desolvation temperature was 526 °C, heat block temperature (H) was 400 °C, nebulizing gas flow (N) was 3.0 L/min, drying gas flow (G) was 5.0 L/min, heating gas flow (F) was 10.0 L/min, and DL temperature (D) was 250 °C. Other MS/MS acquisition conditions are provided in Table 4. Figure 7 shows the chromatograms of the 28 target compounds in the standard solution.

4.6. Method Validation

The performance of the developed method, comprising enzymatic hydrolysis, SPE cleanup, and UPLC-MS/MS analysis, was assessed by evaluating linearity, recovery (RE), repeatability (RSD), limit of detection (LOD), limit of quantification (LOQ), and matrix effects (MEs). Method validation was performed according to the general principles outlined in ICH Q2(R2) for analytical procedure validation [40]. In addition, the analytical performance for the wheat product matrix was considered in light of the Commission Implementing Regulation (EU) 2023/2782 [41].
The linearity of the different compounds was evaluated over the range of 0.001–400 μg/L. The LOD and LOQ were assessed from the results obtained for the analytes at the low spiking level, corresponding to signal-to-noise ratios (S/N) of 3 and 10, respectively. Using the internal standard correction method, the RE and RSD at low, medium, and high concentration levels were determined using six replicate blank samples. MEs were evaluated by comparing the peak areas of the analytes in blank matrix-matched standard solutions with those in pure solvent standard solutions. RE was evaluated by comparing the peak areas of the analytes in blank matrix samples spiked before sample pretreatment with those in blank matrix samples spiked after sample pretreatment. Based on the above validation principles, the obtained performance characteristics were considered acceptable for the intended application of this method in wheat products and urine samples.

Author Contributions

Methodology, B.G. and S.W.; validation, B.G. and S.W.; formal analysis, B.G., X.L. and Z.X.; investigation, B.G. and J.S.; writing—original draft preparation, B.G. and S.W.; writing—review and editing, B.G. and S.W.; supervision, J.M. and X.H.; project administration, S.W. and X.H.; funding acquisition, X.H. All authors have read and agreed to the published version of the manuscript.

Funding

This research was funded by the General Program of the Beijing Natural Science Foundation, grant number (7212145).

Institutional Review Board Statement

Not applicable.

Informed Consent Statement

Not applicable.

Data Availability Statement

The original contributions presented in this study are included in the article. Further inquiries can be directed to the corresponding authors.

Conflicts of Interest

The authors declare no conflicts of interest.

References

  1. Marin, S.; Ramos, A.J.; Cano-Sancho, G.; Sanchis, V. Mycotoxins: Occurrence, toxicology, and exposure assessment. Food Chem. Toxicol. 2013, 60, 218–237. [Google Scholar] [CrossRef]
  2. Karsauliya, K.; Yahavi, C.; Pandey, A.; Bhateria, M.; Sonker, A.K.; Pandey, H.; Sharma, M.; Singh, S.P. Co-occurrence of mycotoxins: A review on bioanalytical methods for simultaneous analysis in human biological samples, mixture toxicity and risk assessment strategies. Toxicon 2022, 218, 25–39. [Google Scholar] [CrossRef]
  3. IARC Working Group on the Evaluation of Carcinogenic Risks to Humans. Some Traditional Herbal Medicines, Some Mycotoxins, Naphthalene and Styrene; World Health Organization: Geneva, Switzerland, 2002; Volume 82, pp. 1–556. [Google Scholar]
  4. EFSA Panel on Contaminants in the Food Chain; Schrenk, D.; Bodin, L.; Chipman, J.K.; Del Mazo, J.; Grasl-Kraupp, B.; Hogstrand, C.; Hoogenboom, L.R.; Leblanc, J.C.; Nebbia, C.S.; et al. Risk assessment of ochratoxin A in food. EFSA J. 2020, 18, e06113. [Google Scholar] [CrossRef] [PubMed]
  5. Eskola, M.; Kos, G.; Elliott, C.T.; Hajšlová, J.; Mayar, S.; Krska, R. Worldwide contamination of food-crops with mycotoxins: Validity of the widely cited ‘FAO estimate’ of 25%. Crit. Rev. Food Sci. Nutr. 2020, 60, 2773–2789. [Google Scholar] [CrossRef]
  6. Fraeyman, S.; Croubels, S.; Devreese, M.; Antonissen, G. Emerging Fusarium and Alternaria Mycotoxins: Occurrence, Toxicity and Toxicokinetics. Toxins 2017, 9, 228. [Google Scholar] [CrossRef]
  7. Ji, X.; Jin, C.; Xiao, Y.; Deng, M.; Wang, W.; Lyu, W.; Chen, J.; Li, R.; Li, Y.; Yang, H. Natural Occurrence of Regulated and Emerging Mycotoxins in Wheat Grains and Assessment of the Risks from Dietary Mycotoxins Exposure in China. Toxins 2023, 15, 389. [Google Scholar] [CrossRef]
  8. Yu, J.; Pedroso, I.R. Mycotoxins in Cereal-Based Products and Their Impacts on the Health of Humans, Livestock Animals and Pets. Toxins 2023, 15, 480. [Google Scholar] [CrossRef] [PubMed]
  9. Kolawole, O.; Siri-Anusornsak, W.; Petchkongkaew, A.; Elliott, C. A systematic review of global occurrence of emerging mycotoxins in crops and animal feeds, and their toxicity in livestock. Emerg. Contam. 2024, 10, 100305. [Google Scholar] [CrossRef]
  10. Niaz, W.; Iqbal, S.Z.; Ahmad, K.; Majid, A.; Haider, W.; Li, X. Mycotoxins: A comprehensive review of its global trends in major cereals, advancements in chromatographic detections and future prospectives. Food Chem. X 2025, 27, 102350. [Google Scholar] [CrossRef] [PubMed]
  11. Alomari, D.Z.; Schierenbeck, M.A.-O.; Alqudah, A.A.-O.; Alqahtani, M.A.-O.; Wagner, S.A.-O.; Rolletschek, H.; Borisjuk, L.; Röder, M.A.-O. Wheat Grains as a Sustainable Source of Protein for Health. Nutrients 2023, 15, 4398. [Google Scholar] [CrossRef]
  12. Mottaleb, K.A.; Kruseman, G.; Frija, A.; Sonder, K.; Lopez-Ridaura, S. Projecting wheat demand in China and India for 2030 and 2050: Implications for food security. Front. Nutr. 2023, 9, 1077443. [Google Scholar] [CrossRef]
  13. Food and Agriculture Organization of the United Nations. Agricultural Production Statistics 2014–2024; FAO: Rome, Italy, 2025. [Google Scholar]
  14. Luan, Y.; Zhang, D.; Liu, Z.; Sun, X.; Yang, X. Occurrence of regulated, emerging, and masked mycotoxins in Chinese wheat between 2021 and 2022. Toxicon 2025, 260, 108344. [Google Scholar] [CrossRef] [PubMed]
  15. Xu, W.; Liang, J.; Zhang, J.; Song, Y.; Zhao, X.; Liu, X.; Zhang, H.; Sui, H.; Ye, J.; Wu, Y.; et al. Natural Occurrence and Co-Occurrence of Beauvericin and Enniatins in Wheat Kernels from China. Toxins 2024, 16, 290. [Google Scholar] [CrossRef]
  16. Zheng, W.; Zhang, J.; Shi, Y.; He, C.; Zhou, X.; Jiang, J.; Wang, G.; Zhang, J.; Xu, J.; Shi, J.; et al. Natural Occurrence of Conventional and Emerging Fusarium Mycotoxins in Freshly Harvested Wheat Samples in Xinjiang, China. Toxins 2025, 17, 591. [Google Scholar] [CrossRef]
  17. Hassine, M.; Ben Hassouna, K.; Tissaoui, S.; Baraket, M.; Slim, A.; Slama, O.A.; Amara, H.S.; Al-Amiery, A.; Pallarés, N.; Berrada, H.; et al. Prevalence and Risk Assessment of Multiple Mycotoxins in Durum Wheat from Fields Under Different Agricultural Practices in Tunisia. Toxins 2025, 17, 410. [Google Scholar] [CrossRef]
  18. Cimbalo, A.; Alonso-Garrido, M.; Font, G.; Manyes, L. Toxicity of mycotoxins in vivo on vertebrate organisms: A review. Food Chem. Toxicol. 2020, 137, 111161. [Google Scholar] [CrossRef]
  19. EFSA Panel on Contaminants in the Food Chain. Scientific Opinion on the risks for public health related to the presence of zearalenone in food. EFSA J. 2011, 9, 2197. [CrossRef]
  20. EFSA Panel on Contaminants in the Food Chain. Scientific Opinion on the risks for animal and public health related to the presence of Alternaria toxins in feed and food. EFSA J. 2011, 9, 2407. [CrossRef]
  21. Frizzell, C.; Ndossi, D.; Kalayou, S.; Eriksen, G.S.; Verhaegen, S.; Sorlie, M.; Elliott, C.T.; Ropstad, E.; Connolly, L. An in vitro investigation of endocrine disrupting effects of the mycotoxin alternariol. Toxicol. Appl. Pharmacol. 2013, 271, 64–71. [Google Scholar] [CrossRef] [PubMed]
  22. Stypula-Trebas, S.; Minta, M.; Radko, L.; Jedziniak, P.; Posyniak, A. Nonsteroidal mycotoxin alternariol is a full androgen agonist in the yeast reporter androgen bioassay. Environ. Toxicol. Pharmacol. 2017, 55, 208–211. [Google Scholar] [CrossRef] [PubMed]
  23. Cramer, B.; Visintin, L.; Maris, E.; Kuhn, M.; Degen, G.H.; Turner, P.C.; Humpf, H.-U.; De Saeger, S. Human biomonitoring of mycotoxins: Key challenges and future directions. Mycotoxin Res. 2025, 42, 13. [Google Scholar] [CrossRef]
  24. Marín-Sáez, J.; Hernández-Mesa, M.; Gallardo-Ramos, J.A.; Gámiz-Gracia, L.; García-Campaña, A.M. Assessing human exposure to pesticides and mycotoxins: Optimization and validation of a method for multianalyte determination in urine samples. Anal. Bioanal. Chem. 2024, 416, 1935–1949. [Google Scholar] [CrossRef]
  25. Peris-Camarasa, B.; Pardo, O.; Dualde, P.; Coscollà, C. Multi-mycotoxin determination in human urine by UHPLC-MS/MS: An environmentally friendly and high-throughput approach. J. Chromatogr. A 2025, 1760, 466317. [Google Scholar] [CrossRef]
  26. Mengelers, M.J.B.; van den Brand, A.D.; Zhao, S.; Hoogenveen, R.; Ougier, E. Human Biomonitoring Guidance Values for Deoxynivalenol Derived under the European Human Biomonitoring Initiative (HBM4EU). Toxins 2024, 16, 139. [Google Scholar] [CrossRef]
  27. Tuba, H.R.; Rana, S.; Fariha, K.A.; Degen, G.H.; Ali, N. Aflatoxin M1 Levels in Milk and Urine Samples of Nursing Mothers in Bangladesh: Exposure Assessment of Infants. Toxins 2025, 17, 399. [Google Scholar] [CrossRef] [PubMed]
  28. Ali, S.; Franco, B.B.; Rezende, V.T.; Ullah, S.; Wahab, N.; Freire, L.G.D.; Rosim, R.E.; Tonin, F.G.; Corassin, C.H.; Del Ciampo, L.A.; et al. Children’s exposure to mycotoxins and risk characterization using urinary biomarkers in São Paulo, Brazil. Environ. Pollut. 2025, 385, 127160. [Google Scholar] [CrossRef] [PubMed]
  29. Rodríguez-Carrasco, Y.; Narváez, A.; Izzo, L.; Ritieni, A. Biomonitoring of Enniatin B1 and Its Phase I Metabolites in Human Urine: First Large-Scale Study. Toxins 2020, 12, 415. [Google Scholar] [CrossRef]
  30. Behr, A.C.; Fæste, C.K.; Azqueta, A.; Tavares, A.M.; Spyropoulou, A.; Solhaug, A.; Olsen, A.K.; Vettorazzi, A.; Mertens, B.; Zegura, B.; et al. Hazard characterization of the mycotoxins enniatins and beauvericin to identify data gaps and improve risk assessment for human health. Arch. Toxicol. 2025, 99, 1791–1841. [Google Scholar] [CrossRef]
  31. Budagova, G.; Buyukunal, S.K.; Muratoglu, K. Determination of mycotoxins in breakfast cereals by LC-MS/MS. Food Control 2025, 168, 110971. [Google Scholar] [CrossRef]
  32. Long, Y.; Wang, Y.; Zhang, G.; Chen, Y. Magnetic covalent organic framework with theory calculation coupled to UPLC-MS/MS for selective enrichment and simultaneous quantification of seven emerging mycotoxins in wheat. Food Chem. 2025, 500, 147476. [Google Scholar] [CrossRef] [PubMed]
  33. Dasi-Navarro, N. Development and Validation of LC-Q-TOF-MS Methodology to Determine Mycotoxin Biomarkers in Human Urine. Toxins 2022, 14, 651. [Google Scholar] [CrossRef]
  34. Zhang, D.; Liu, B. Development and validation of a simultaneous quantitative analytical method for two Alternaria toxins and their metabolites in plasma and urine using ultra-high-performance liquid chromatography-tandem mass spectrometry. J. Sep. Sci. 2024, 47, e2400223. [Google Scholar] [CrossRef]
  35. Visintin, L.; Garcia Nicolas, M.; De Saeger, S.; De Boevre, M. Validation of a UPLC-MS/MS Method for Multi-Matrix Biomonitoring of Alternaria Toxins in Humans. Toxins 2024, 16, 296. [Google Scholar] [CrossRef]
  36. Anumudu, C.K.; Ekwueme, C.T.; Uhegwu, C.C.; Ejileugha, C.; Augustine, J.; Okolo, C.A.; Onyeaka, H. A Review of the Mycotoxin Family of Fumonisins, Their Biosynthesis, Metabolism, Methods of Detection and Effects on Humans and Animals. Int. J. Mol. Sci. 2024, 26, 184. [Google Scholar] [CrossRef]
  37. De Baere, S.; Croubels, S.; Novak, B.; Bichl, G.; Antonissen, G. Development and Validation of a UPLC-MS/MS and UPLC-HR-MS Method for the Determination of Fumonisin B1 and Its Hydrolysed Metabolites and Fumonisin B2 in Broiler Chicken Plasma. Toxins 2018, 10, 62. [Google Scholar] [CrossRef]
  38. Hu, S.; Ye, B.; Li, H.; Yan, P.; Chen, D.; Zhao, M. Enhanced selectivity for convenient extraction of acidic mycotoxins using a miniaturized centrifugal integrated cold-induced phase separation: Determination of fumonisins and ochratoxins in cereals as a proof-of-concept study. Food Chem. 2024, 454, 139715. [Google Scholar] [CrossRef] [PubMed]
  39. Leite, M.; Freitas, A.; Barbosa, J.; Ramos, F. Comprehensive assessment of different extraction methodologies for optimization and validation of an analytical multi-method for determination of emerging and regulated mycotoxins in maize by UHPLC-MS/MS. Food Chem. Adv. 2023, 2, 100145. [Google Scholar] [CrossRef]
  40. International Council for Harmonisation of Technical Requirements for Pharmaceuticals for Human Use. ICH Q2(R2) Guideline: Validation of Analytical Procedures; International Council for Harmonisation of Technical Requirements for Pharmaceuticals for Human Use: Geneva, Switzerland, 2023. [Google Scholar]
  41. European Commission. Commission Implementing Regulation (EU) 2023/2782 of 14 December 2023 Laying Down the Methods of Sampling and Analysis for the Control of the Levels of Mycotoxins in Food and Repealing Regulation (EC) No 401/2006. 2023. Available online: http://data.europa.eu/eli/reg_impl/2023/2782/oj (accessed on 18 April 2026).
  42. Kim, D.-B.; Nam, M.; Kim, Y.-S.; Kim, M.-S. Optimization, Validation, and Application of Cleanup-Coupled Liquid Chromatography-Tandem Mass Spectrometry for the Simultaneous Analyses of 35 Mycotoxins and Their Derivatives in Cereals. Foods 2024, 13, 3617. [Google Scholar] [CrossRef] [PubMed]
  43. Narváez, A.; Izzo, L.; Castaldo, L.; Lombardi, S.; Rodríguez-Carrasco, Y.; Ritieni, A. Multi-Mycotoxin Method Development Using Ultra-High Liquid Chromatography with Orbitrap High-Resolution Mass Spectrometry Detection in Breakfast Cereals from the Campania Region, Italy. Toxins 2023, 15, 148. [Google Scholar] [CrossRef]
Figure 1. Extraction efficiencies of different extraction solvents for 28 mycotoxins in wheat products.
Toxins 18 00219 g001
Figure 2. Extraction efficiencies of different formic acid concentrations for 28 mycotoxins in wheat products.
Toxins 18 00219 g002
Figure 3. Extraction efficiencies of different extraction solvents for 28 mycotoxins in urine.
Toxins 18 00219 g003
Figure 4. Extraction efficiencies of different SPE cartridges for 28 mycotoxins in wheat products.
Toxins 18 00219 g004
Figure 5. Extraction efficiencies of different SPE cartridges for 28 mycotoxins in urine.
Toxins 18 00219 g005
Figure 6. Representative MRM chromatograms of mycotoxins detected in wheat product samples (a) and urine samples (b).
Toxins 18 00219 g006aToxins 18 00219 g006b
Figure 7. MRM chromatograms of (a) a standard mixture of 18 mycotoxins (100 μg/L FB1, FB2, FB3, CPA; 4.0 μg/L OTA, OTB, OTC; 200 μg/L DON, 3-Ac-DON, 15-Ac-DON, T-2, HT-2; 1.6 μg/L AFB1, AFG1; 0.4 μg/L AFB2, AFG2; 2.0 μg/L AFM1; 20.0 μg/L ST) and (b) a standard mixture of 10 mycotoxins (1.0 μg/L ENNB, ENNB1, AME; 5.0 μg/L ENNA, ENNA1, BEA, TEN; 12.5 μg/L ALT; 25.0 μg/L TeA; 10.0 μg/L AOH).
Toxins 18 00219 g007aToxins 18 00219 g007b
Table 1. Linear range, recovery, repeatability, LOD, LOQ and ME of 28 kinds of mycotoxins in wheat products (n = 6).
AnalyteLinear Range (μg/L)RE (%)RSD (%)LOQ (μg/kg)LOD (μg/kg)ME (%)
LowMediumHigh
AFB10.04~3.2079.878.096.42.2~3.90.020.0147.7
AFB20.01~0.8085.61051144.7~7.40.10.0333.9
AFG10.04~3.2086.01021196.3~7.40.40.143.9
AFG20.01~0.8091.11051144.4~5.90.10.0368.7
AFM10.05~4.0092.193.61063.4~6.80.250.0882.9
OTA0.1~8.001121201112.4~8.90.50.2100
OTB0.1~8.0076.01051092.8~6.70.150.05107
OTC0.1~8.0076.410495.83.2~7.10.050.0298
FB12.5~2001151161104.8~6.60.250.08110
FB22.5~20086.992.81004.1~6.20.250.08106
FB32.5~20070.280.899.53.1~5.30.250.08116
T-25.0~40076.387.988.53.7~7.61.250.4116
HT-25.0~4001041111112.1~6.020.06.793
DON5.0~4001191091104.9~8.21.250.485.4
3-Ac-DON5.0~40089.891.494.85.1~8.85.01.787.0
15-Ac-DON5.0~40096.11021114.2~7.625.08.382.4
ST0.5~40.097.21041082.5~4.60.160.05108
CPA2.5~20072.270.272.41.6~4.620.06.795.3
ENNA0.05~10.01151131034.5~7.70.0250.008115
ENNA10.05~10.01111131182.7~9.10.0250.008108
ENNB0.01~2.01131081153.7~7.80.0020.001114
ENNB10.01~2.01091171183.5~7.40.0020.001116
BEA0.05~10.082.596.71204.6~6.00.050.02109
ALT1.25~25.087.21051022.0~4.81.250.4110
AOH1.0~20.093.51081055.9~7.30.30.186.1
TeA2.5~50.093.41031033.2~4.80.250.0892.7
TEN0.5~10.086.410495.72.4~5.00.020.0197
AME0.1~2.089.61041141.9~2.20.030.0199
Table 2. Linear range, recovery, repeatability, LOD, LOQ and ME of 28 kinds of mycotoxins in urine (n = 6).
AnalyteLinear Range (μg/L)RE (%)RSD (%)LOQ (μg/L)LOD (μg/L)ME (%)
LowMediumHigh
AFB10.004~1.6083.21051062.1~4.10.0010.000310.9
AFB20.001~0.401161041003.2~6.40.00250.000823.3
AFG10.004~1.6010096.181.71.8~2.50.0010.00039.65
AFG20.001~0.4092.11191004.6~9.40.00250.000882.7
AFM10.005~2.0011895.194.53.8~7.90.001250.000489.9
OTA0.01~4.0083.610398.31.6~3.70.0030.00187.3
OTB0.01~4.0079.789.879.33.4~5.70.0040.00183.0
OTC0.01~4.0089.499.099.32.6~5.10.0040.00194.4
FB10.25~1001161021051.6~5.70.050.0291.7
FB20.25~10011398.099.01.9~3.70.0250.008103
FB30.25~10012096.51011.4~7.10.030.0193.9
T-20.50~20094.392.495.61.5~3.10.20.0783.7
HT-20.50~20094.097.294.32.6~8.40.60.287.4
DON0.50~20098.41091084.3~5.61.20.497.6
3-Ac-DON0.50~2001051031013.9~5.01.00.394.2
15-Ac-DON0.50~2001071061082.9~7.00.60.285.9
ST0.05~20.086.295.096.01.0~2.90.050.0297.1
CPA0.25~10010398.01011.0~2.03.01.0113
ENNA0.005~5.099.21001012.8~4.10.00080.000299.0
ENNA10.005~5.098.91031062.6~3.10.00050.000184.2
ENNB0.001~1.01001031050.7~4.60.00020.000199.8
ENNB10.001~1.099.297.11011.6~4.20.00020.000183.8
BEA0.005~5.096.693.11011.2~3.10.00060.000290.1
ALT0.125~12.599.311199.22.3~8.90.070.0294.4
AOH0.10~10.01071091043.0~6.40.040.0196.6
TeA0.25~25.01151071013.6~8.20.50.2114
TEN0.05~5.010092.01033.4~8.60.010.003109
AME0.01~1.01061081042.2~4.60.0030.00193.0
Table 3. Occurrence of mycotoxins in wheat products and urine samples with enzyme treatment (n = 10).
AnalytesWheat ProductsUrine
Positive
(%)
Mean ± SD
(μg/kg)
Range
(μg/kg)
Median
(μg/kg)
Positive
(%)
Mean ± SD
(μg/L)
Range (μg/L)Median
(μg/L)
AFB130%0.008 ± 0.0030.005~0.010.0150%0.0119 ± 0.00220.0086~0.01390.0128
AFM1ND 50%0.0742 ± 0.04470.0383~0.14940.0564
FB180%0.302 ± 0.288<LOD~0.960.225100%0.10 ± 0.020.07~0.120.10
FB230%0.10 ± 0.06<LOD~0.150.1290%0.019 ± 0.0090.010~0.0330.016
FB3ND 20%0.017 ± 0.00140.016~0.0180.017
OTA30%0.43 ± 0.310.25~0.790.2510%0.0220.0220.022
DON100%31.59 ± 23.534.90~85.6025.9560%2.2 ± 1.70.6~5.51.9
3-Ac-DONND 40%2.5 ± 1.51.0~4.62.3
ENNA1100%0.510 ± 0.5820.061~1.6290.21120%0.0010.0010.001
ENNA80%0.126 ± 0.1240.013~0.3720.07440%0.00035 ± 0.000130.0002~0.00050.00035
ENNB1100%0.978 ± 1.0690.064~2.6270.37260%0.0022 ± 0.00030.0020~0.00280.0022
ENNB100%2.365 ± 2.9600.079~7.7481.018ND
BEA20%0.31 ± 0.120.22~0.390.31ND
TeA100%39.89 ± 37.181.09~108.0618.6890%14.7 ± 14.80.3~43.411.9
AOH70%0.7 ± 1.00.15~2.70.15ND
TEN100%5.83 ± 6.720.21~18.522.9360%0.024 ± 0.0130.012~0.0450.023
AME90%0.60 ± 0.770.13~2.530.2970%0.019 ± 0.0180.003~0.0440.010
For calculation of mean, standard deviation and median values, a concentration < LOD was assigned half the LOD.
Table 4. MRM transitions and MS/MS parameters for 28 target compounds.
AnalyteTime (min)Precursor Ion
(m/z)
Product Ion
(m/z)
Q1 (V)CE (V)Q3 (V)
TeA1.628196.1112 *
139
11
11
23
19
19
27
DON2.511297249.1 *
203.1
−14
−11
−9
−16
−17
−24
15-Ac-DON4.043339137.1 *
321
−16
−17
−19
−12
−30
−24
3-Ac-DON4.086339231.1 *
203
−17
−15
−16
−19
−27
−21
AFM14.367329273 *
229
−16
−16
−24
−40
−19
−24
AFG24.583331245 *
257
−16
−16
−30
−32
−17
−19
FB14.743722.2352.2 *
334.4
−20
−20
−36
−40
−25
−13
ALT4.785291.1186.1 *
214.1
17
11
26
25
20
19
AFG14.789329243 *
283
−16
−16
−27
−25
−17
−20
AFB24.791315259 *
287
−15
−15
−30
−25
−13
−20
AFB14.991313241 *
285
−15
−15
−35
−23
−17
−20
FB35.069706.2336.3 *
318.2
−20
−20
−38
−40
−16
−22
AOH5.170257147.1 *
159.1
14
14
33
36
29
15
FB25.284706.3336.4 *
318.25
−20
−20
−36
−40
−24
−16
HT-25.295425263.1 *
245
−16
−12
−12
−15
−18
−16
TEN5.410413.1214.1 *
271.2
23
13
25
19
24
28
OTB5.641370.1205 *
187
−26
−26
−22
−36
−22
−21
T-26.032484.3185.1 *
305
−11
−11
−19
−14
−13
−22
OTA6.208404.1239 *
358
−11
−11
−22
−16
−26
−26
AME6.318271.1256.1 *
228.1
15
15
23
28
25
14
ST6.446325.1310.1 *
281.1
−12
−16
−24
−35
−23
−20
CPA6.811335.05139.7 *
179.75
19
19
27
27
24
30
OTC7.442432358 *
239
−16
−22
−17
−26
−14
−18
ENNB8.471640.486.1 *
196.2
−32
−32
−55
−26
−17
−14
ENNB18.730654.5196.2 *
210.2
−24
−24
−24
−23
−14
−15
BEA8.656784.4244.1 *
134.1
−28
−40
−32
−55
−28
−24
ENNA18.990668.5210.15 *
100.1
−24
−24
−23
−54
−15
−11
ENNA9.269699.1210.2 *
228.3
−20
−24
−33
−36
−14
−27
13C10-TEA1.629206.1144.9151613
13C15-DON2.487312263.1−15−14−26
13C17-3-Ac-DON4.086356245−17−17−17
13C17-AFM14.366346.1288.1−17−24−21
13C17-AFG24.580347.9329.9−17−26−24
13C34-FB14.743756.5356.4−22−42−26
13C15-ALT4.784306226.8172510
13C17-AFG14.786346257−17−26−18
13C17-AFB24.788332272.9−16−30−20
13C17-AFB14.988329.9254.9−16−37−18
13C14-AOH5.172271226.9142724
13C34-FB25.285740.4358.4−20−38−26
13C22-TEN5.408434.8286.7233018
13C20-OTA6.205424.1250−12−24−18
13C15-AME6.317286.05269.85152427
13C33-ENNB8.469673.5207.3−20−27−15
13C45-BEA8.656829.4259.3 *
143.3
−24
−24
−27
−55
−10
−25
13C34-ENNB18.727688.9207.1 *
225.3
−20
−24
−25
−32
−22
−12
* Quantifier transition.
Disclaimer/Publisher’s Note: The statements, opinions and data contained in all publications are solely those of the individual author(s) and contributor(s) and not of MDPI and/or the editor(s). MDPI and/or the editor(s) disclaim responsibility for any injury to people or property resulting from any ideas, methods, instructions or products referred to in the content.