Article

Crotoxin B from the South American Rattlesnake Crotalus vegrandis Blocks Voltage-Gated Calcium Channels Independent of Its Intrinsic Catalytic Activity


by
Markus Eicheldinger
1,
Erick Miranda-Laferte
1,
Francisco Castilla
1,
Nadine Jordan
1,
Beatrix Santiago-Schübel
2 and
Patricia Hidalgo
1,3,*
1
Institute of Biological Information Processing (IBI-1)—Molecular and Cellular Physiology, Forschungszentrum Jülich, 52425 Jülich, Germany
2
Institute of Biological Information Processing (IBI-7)—Structural Biochemistry, Forschungszentrum Jülich, 52425 Jülich, Germany
3
Institute of Biochemistry, Heinrich-Heine University, 40225 Düsseldorf, Germany
*
Author to whom correspondence should be addressed.
Toxins 2026, 18(1), 36; https://doi.org/10.3390/toxins18010036
Submission received: 15 October 2025 / Revised: 6 January 2026 / Accepted: 7 January 2026 / Published: 10 January 2026

Abstract

Neurotoxicity following South American Crotalus rattlesnake bite is primarily caused by crotoxin, the most abundant component in their venom. Despite the central role of voltage-gated calcium channels (CaV) in neurotransmission, direct targetability by crotoxin has been poorly explored. Crotoxin is a non-covalent heterodimer formed by an acidic subunit (CA) and a basic toxic phospholipase A2 subunit (CB). Here, we chromatographically isolated the CB subunit from Crotalus vegrandis and studied its effect on CaV heterologously expressed in tsA201 cells using the whole-cell patch-clamp technique. Mass spectrometry analysis identified a protein that matched with 97% sequence coverage the CBc isoform from Crotalus durissus terrificus. Isolated CB exhibited moderate phospholipase activity that was not correlated to its cytotoxic effect on cultured tsA201 cells. Using Ba2+ as a charge carrier to prevent the enzymatic activity, we found that CB inhibited currents mediated by the N-type CaV2.2 and CaV1.2 L-type calcium channels, in a dose–dependent manner, with higher potency for the latter, and negligible changes in the voltage dependence of channel activation. Our results reveal a novel phospholipase-independent biological activity and a molecular target of CB providing new insights into the pathophysiology of Crotalus snakebite envenoming with potential clinical therapeutic implications.
Key Contribution: A basic phospholipase A2 subunit of Crotoxin isolated from Crotalus vegrandis directly inhibits N-type and L-type calcium channels independent of its inherent catalytic activity.

1. Introduction

Snakebites from South American rattlesnakes (genus Crotalus) are highly lethal through a variety of systemic effects including neurotoxicity, myotoxicity, and hemotoxicity [1,2,3]. Crotoxin is the most abundant proteic neurotoxin of C. durissus and C. vegrandis venom and the main cause for the high neurotoxic effect following crotalus envenoming [3,4].
Crotoxin is a complex composed of an acidic (CA), nontoxic and noncatalytic subunit, and a basic (CB), weakly toxic, phospholipase A2 (PLA2) active subunit [5,6]. CA promotes the interaction of CB with specific crotoxin receptors at the cell membrane, substantially potentiating the toxicity of the heterodimeric complex and leading to the dissociation of the subunits [3,7,8]. The PLA2 catalytic activity of CB is strictly dependent on the presence of Ca2+ ions and, in the absence of CA, the different CB isoforms display similar three-dimensional structure, enzymatic activity and toxicity but different biological effects [6,8,9,10,11,12,13]. Among the latter, uncomplexed CB exerts cardiotoxic, analgesic, nephrotoxic, immunomodulatory, anti-inflammatory, anticoagulant, and anti-tumour effects that may or may not be dependent on its PLA2 activity [5,6,9,14,15,16]. The fact that the variety of pharmacological actions of CB are not readily associated with the potency of its enzymatic activity suggests that some of the effects are determined by interactions with different partners at the cell surface of the target tissue [9,15,17]. Those interactions, either with lipids or proteins, are mediated by regions outside the catalytic site [12].
Isolated CB from C. durissus terrificus exhibits distinctive presynaptic actions in ex vivo preparations derived from the peripheral and central nervous system; it reduces evoked acetylcholine neurotransmitter release at the neuromuscular junction, whereas it stimulates glutamate release in rat cerebrocortical synaptosomes in a Ca2+- and PLA2 activity-dependent manner, though at ten times higher concentrations than CA/CB heterodimer [18,19]. Despite the main role of voltage-gated calcium channels (CaV) in neurotransmission, excitation–contraction and excitation–secretion coupling in nerve, muscle and gland cells, respectively, a direct effect of isolated CB on CaV channels has not been demonstrated. Here, we applied electrophysiological methods to investigate the effect of CB purified from C. vegrandis on canonical presynaptic and postynaptic CaV channels.
CaV channels are heteromultimers composed of a main multispanning transmembrane CaVα1-pore-forming subunit encompassing the voltage sensor and drug-binding sites, and several nonhomologous accessory subunits, CaVβ, CaVα2δ and CaVγ, that regulate the conduction properties and surface expression of the channel [20]. CaVα1 and CaVβ constitute the functional core of the high-voltage activated calcium channels, which are grouped into two subfamilies; CaV1.x or L-type encoded by CaV1.1 to 1.4 pore-forming subunits and CaV2.x encoded by CaV2.1 (P/Q-type), CaV2.2 (N-type), and CaV2.3 (R-type) subunits [21,22]. In the central nervous system, CaV2.2 channels are localized in the active zone at the presynaptic terminal and calcium entering through these channels directly triggers neurotransmitter release, whereas CaV1.2 is mainly localized postsynaptically in dendritic spines [23,24]. In neurons, CaV1.2 contributes to the excitation–transcription coupling and plays important roles in neuronal function, such as long-term synaptic plasticity and neurodevelopment [24,25]. Furthermore, the CaV1.2 channel is the main CaV channel expressed in cardiac muscle cells, where it mediates excitation–contraction coupling [26].
C. vegrandis, commonly known as the Uracoan rattlesnake, is geographically limited to a semiarid savanna region near Uracoa in Venezuela [1]. This unique distribution and specific habitat make its venom attractive to uncover new compounds targeting CaV channels since venom composition varies with geographical distribution as well as with sex and age [27,28,29,30].
The purified CB from C. vegrandis displayed PLA2 activity and cytotoxicity and, most notably, isolated CB directly blocked CaV1.2 and CaV2.2 channels heterologously expressed in tsA201 cells. Blockade was not associated with the intrinsic PLA2 catalytic activity.
Our results expand the current understanding of the pharmacological and biological impact of crotoxin and may improve the clinical management and outcome of C. vegrandis snakebite envenoming events.

2. Results

2.1. Isolation of Highly Purified CB Subunit of Crotoxin from C. vegrandis Whole Venom Extract

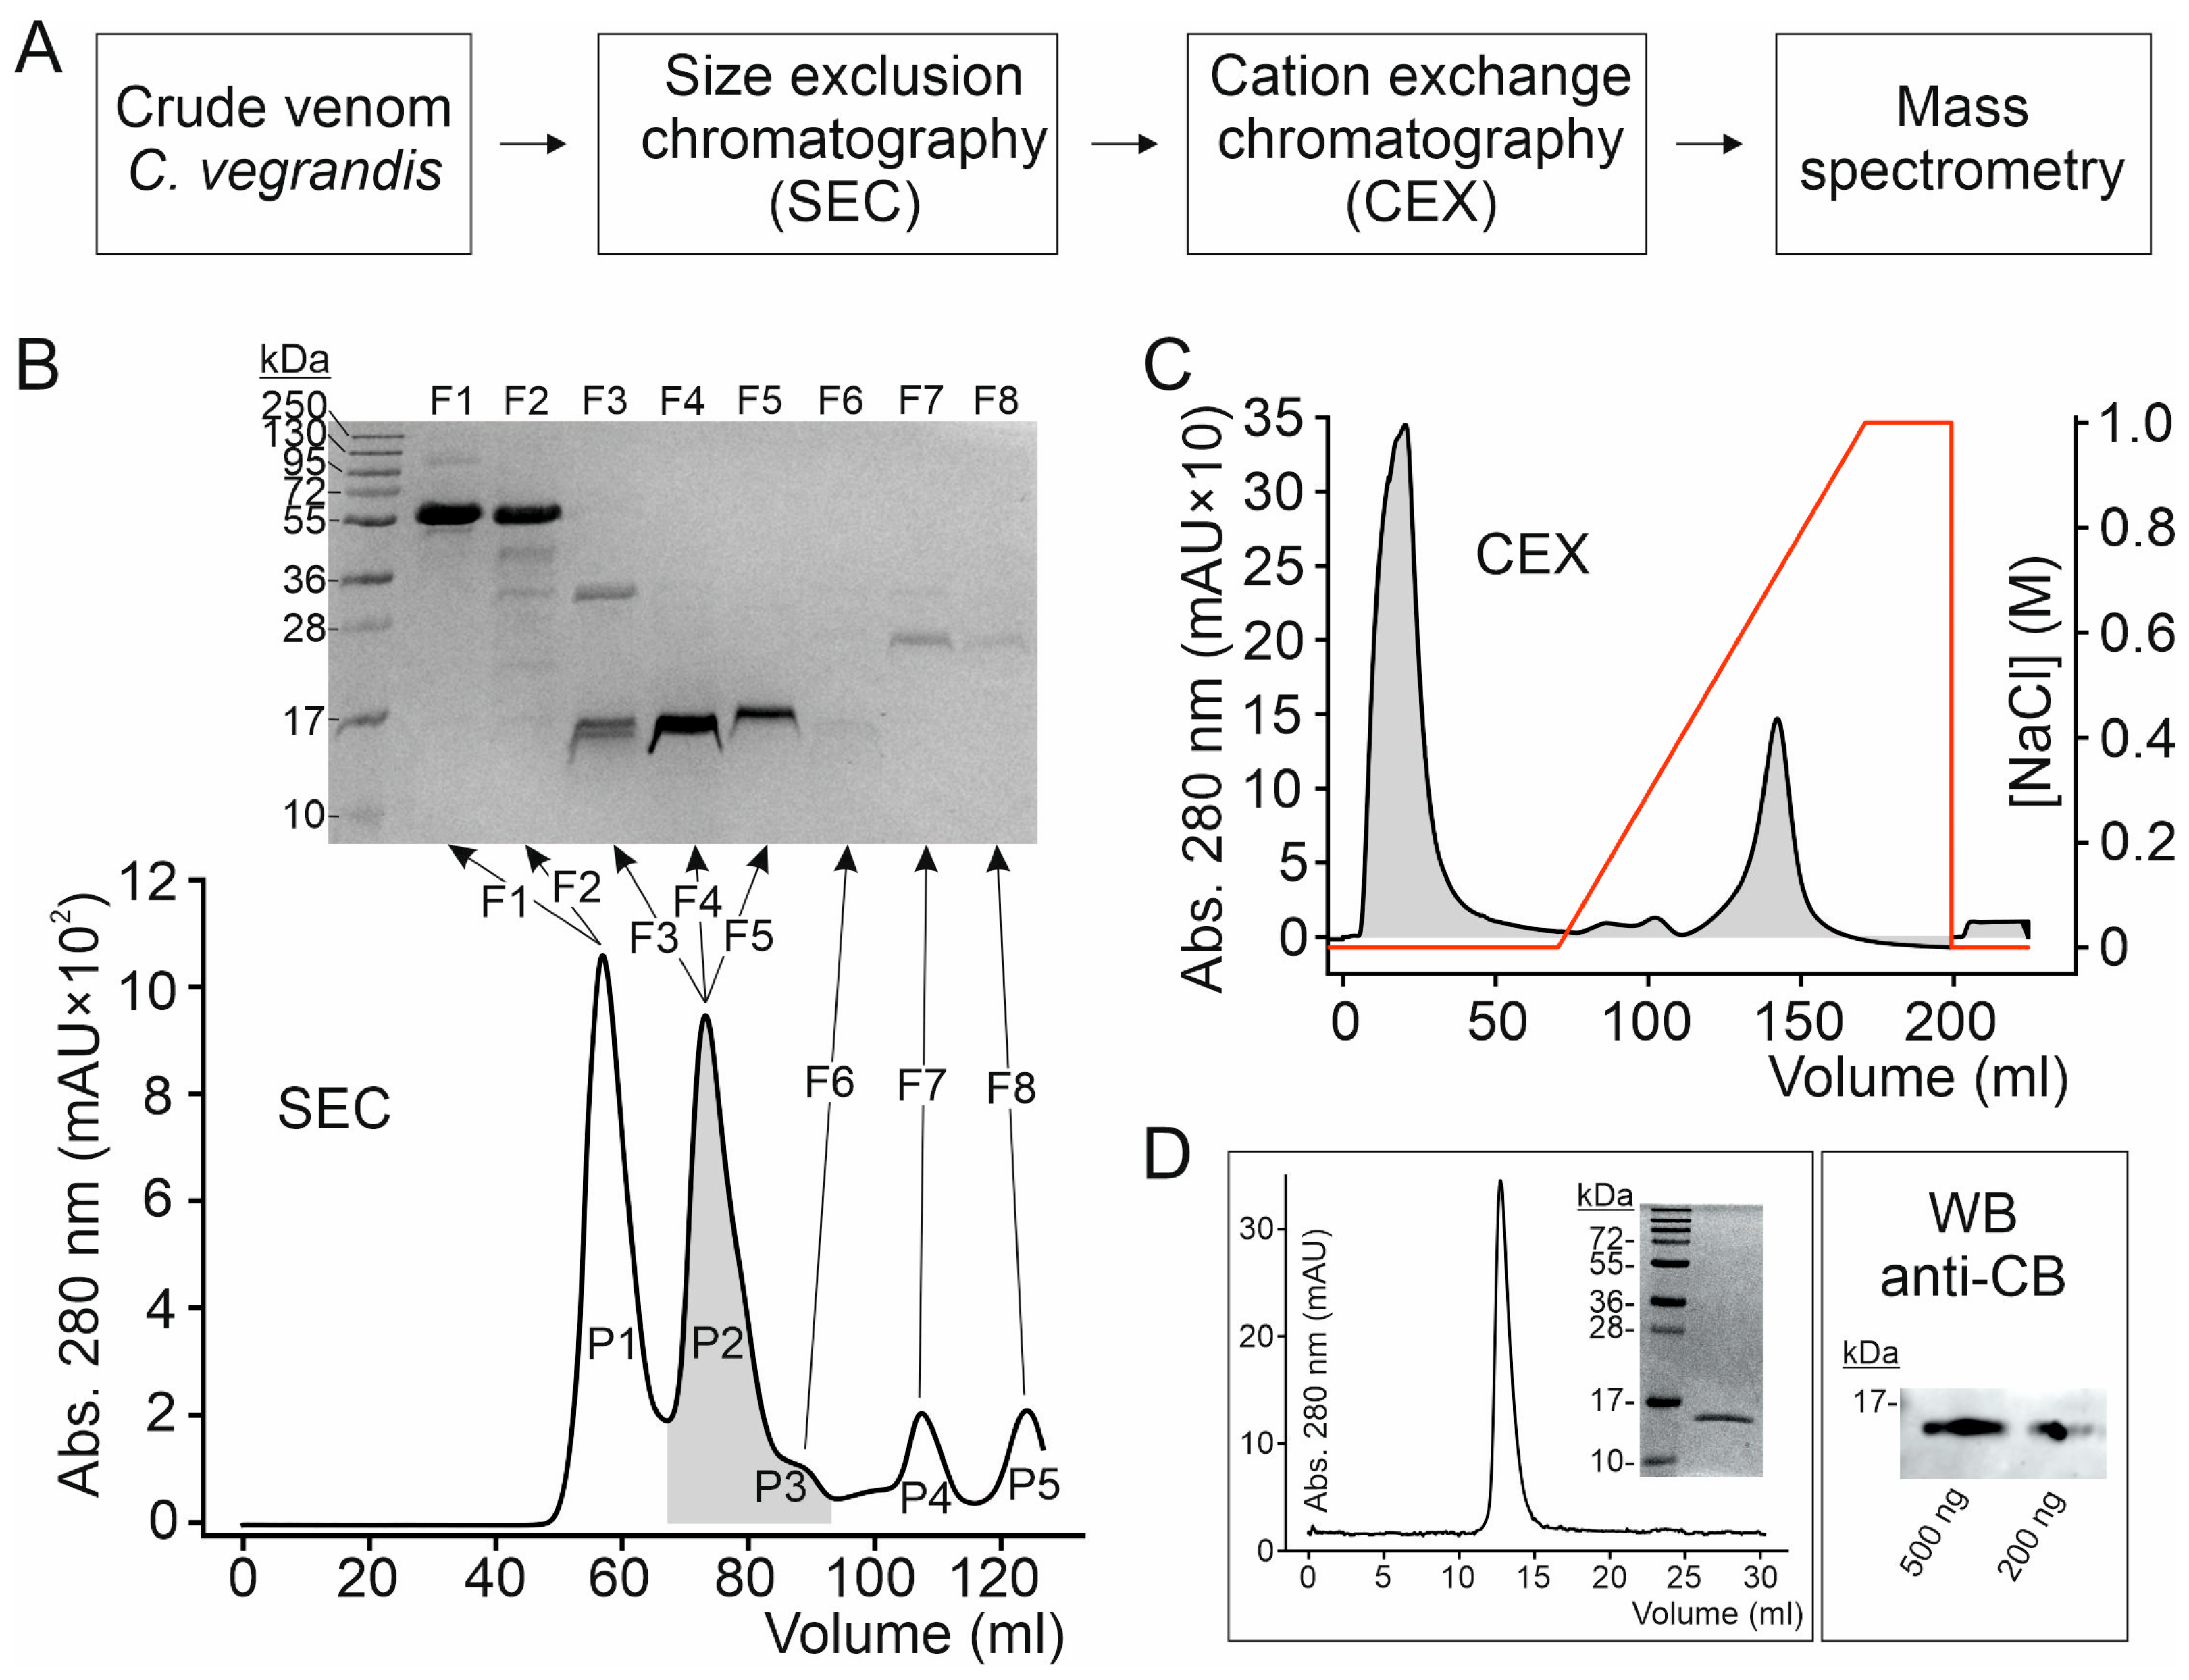
To purify CB, we used the commercially available venom extract from C. vegrandis available from LatoxanTM. The crude extract was fractionated via size exclusion chromatography (SEC) onto a 120 mL bed-volume Superdex 75 16/60 column, followed by cation exchange chromatography (CEX), considering the positively charged nature of CB. The eluted fractions were analyzed by SDS-PAGE and the candidate protein was subjected to mass spectrometry analysis (Figure 1A).
Two major well-resolved chromatographic peaks, namely P1 and P2, eluted from the SEC column loaded with the whole venom extract (Figure 1B). Fractions under these peaks were collected and resolved in reducing SDS-PAGE. The proteins underlying P2 migrate below the 17 kDa molecular mass marker in SDS-PAGE gel and, therefore, are comparable to the molecular mass of the putative CB subunit of a crotoxin homologue from the venom of C. vegrandis [4]. The P2–containing fractions were collected, pooled and loaded onto a CEX column. Bound proteins were eluted with a linear NaCl gradient, resulting in one main peak eluting at 700 mM NaCl concentration that contained a highly purified protein (at about 15 kDa) as assessed by reducing SDS-PAGE (Figure 1B). The purified protein eluted as a single monodisperse peak in analytical SEC, indicating a homogeneous protein with no indication of protein aggregation, and when analyzed by Western-blot, it was detected by the anti-CB antibody against the CB subunit from C. durissus terrificus (Figure 1B).
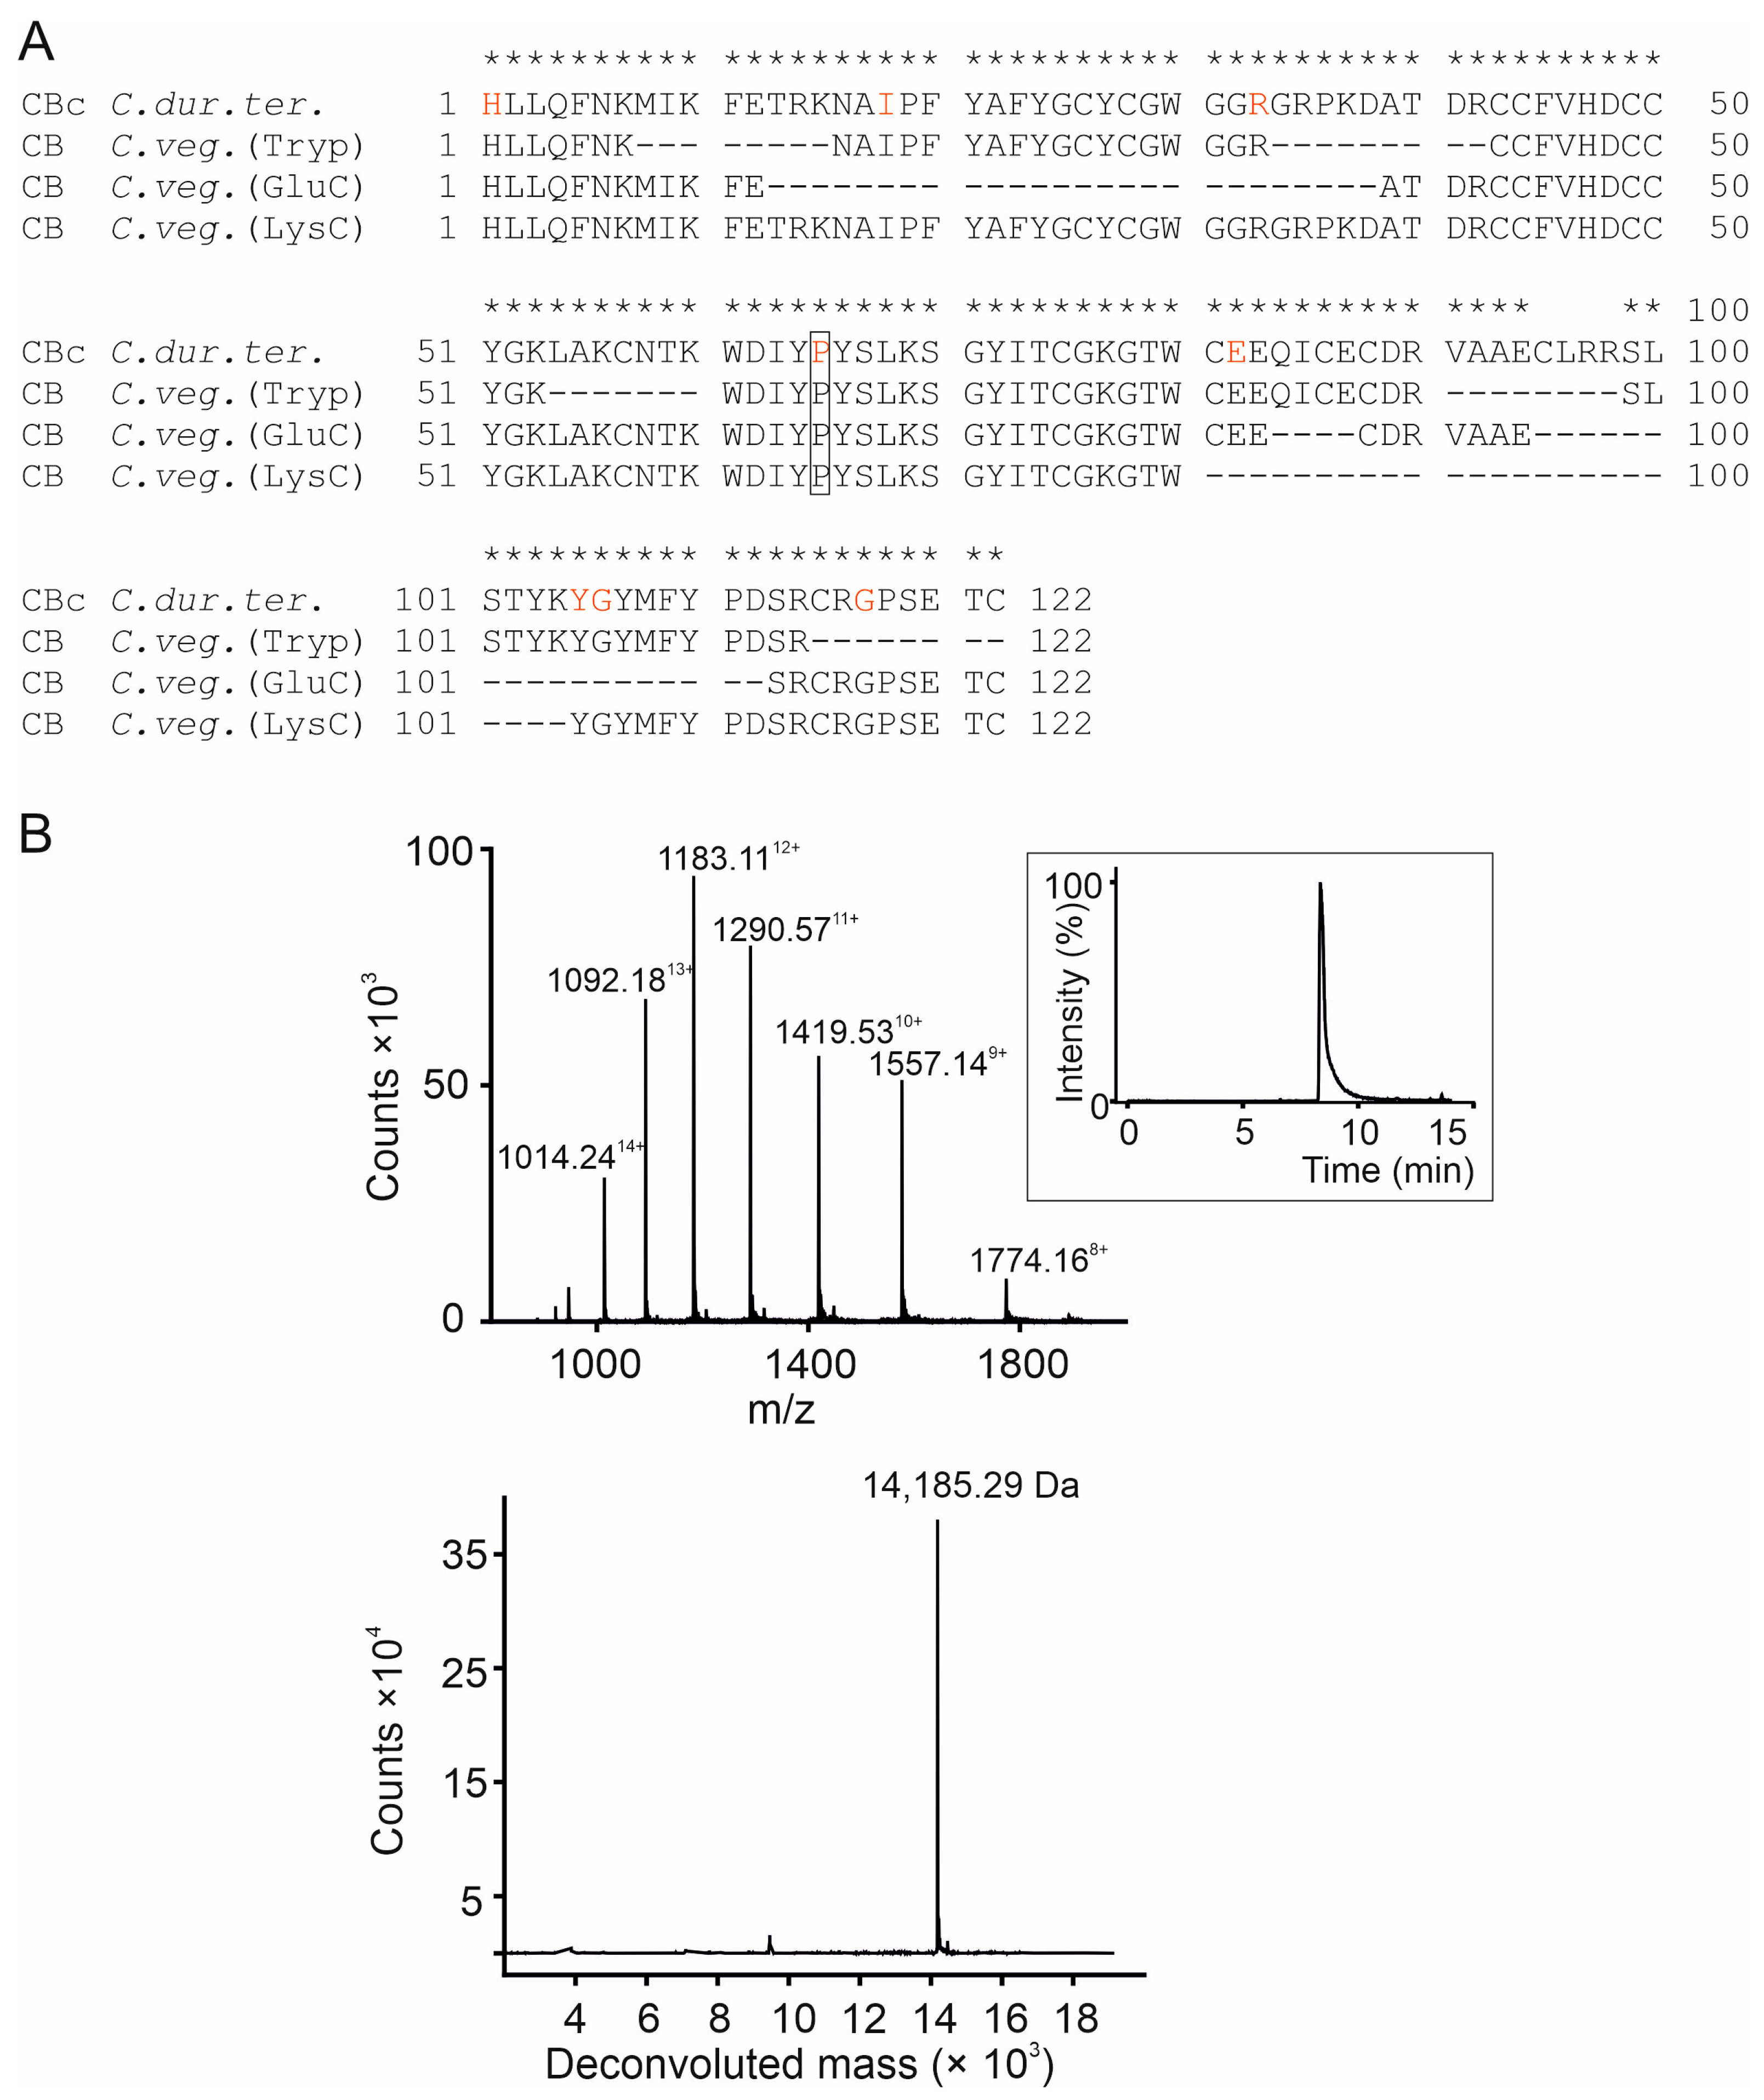
Mass spectrometry analysis of CB purified from C. vegrandis digested with Trypsin, GluC and LysC proteases identified peptide fragments that matched 97% of the amino acid sequence of CBc subunit from C. durissus terrificus (UniProtKB P62022) (Figure 2A). Moreover, the average molecular mass of the toxin was determined to be 14,185.29 Da (Figure 2B), which precisely matches the predicted average molecular mass of 14,185.35 Da of CBc from C. durissus terrificus.
The four different natural CB isoforms, CBa2, CBb, CBc, and CBd, differ from each other in eight amino acids spanning along the 122 residues of the CB from C. durissus terrificus [6,12] (Figure 2A). Mass spectrometry analysis confidently identified the eight variable amino acids that include the proline residue at position 65 that is only found in the CBc isoform (Figure 2A).
Altogether, these results confirm the occurrence of CB in the venom extract from C. vegrandis, as previously reported [1,4,31], and demonstrate the presence of CBc-like isoform.

2.2. The Protein Composition of the Crude Venom Does Not Vary with the Sex and Age of C. vegrandis

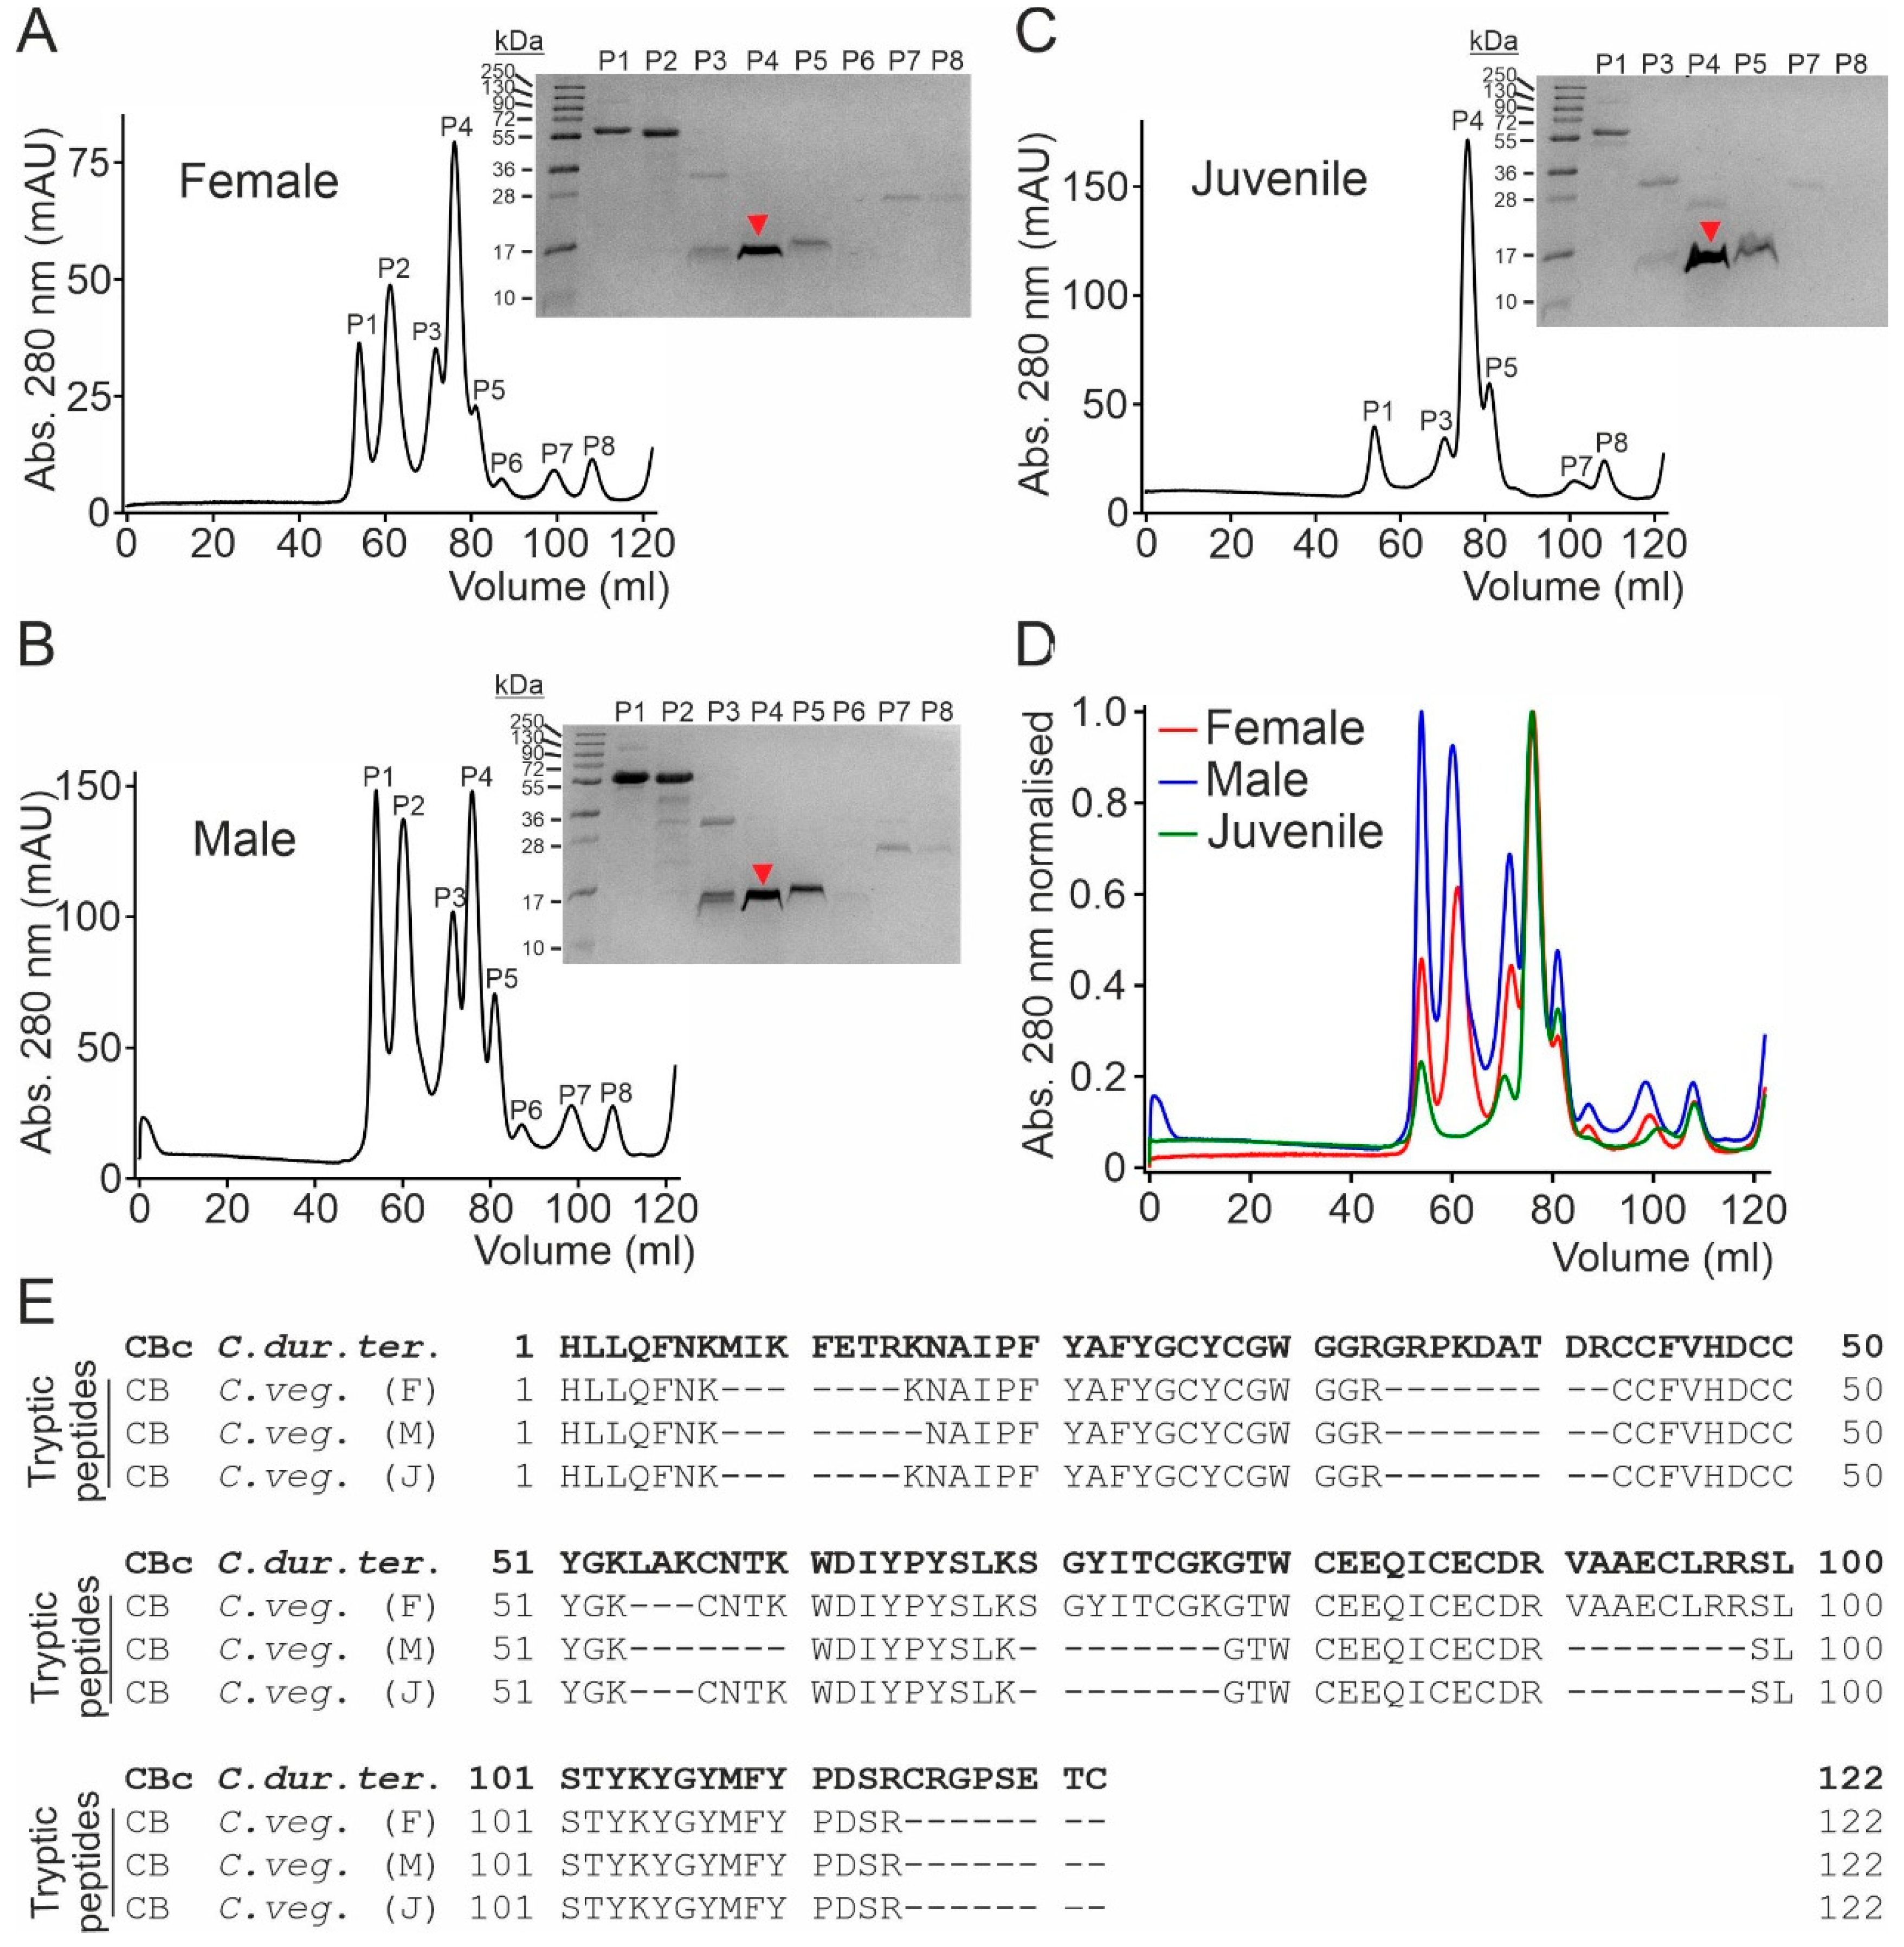
To evaluate potential variations related to sex or age, we assessed the constituents of crude venom extracts collected from male, female and juvenile specimens of C. vegrandis (Gifftierhaus Eimsheim e.V). The three samples were separately fractionated via SEC, and the eluted fractions were analyzed by SDS-PAGE, followed by mass spectrometry (Figure 3). The elution profiles of the female, male and juvenile samples showed several chromatographic peaks with virtually identical retention volumes among the three samples and protein migration pattern in SDS-PAGE (Figure 3A–C). The overlap of the elution profiles shows that they mainly differ in their relative abundance, with the most prominent peak, particularly in the female and juvenile samples, eluting at around 78 mL and migrating at about 15 kDa in reducing SDS-PAGE (Figure 3D). From all three gels, the major band at around 15 kDa was excised, subjected to tryptic digestion and mass spectrometry analysis. This analysis resulted in the identification of several tryptic peptides that highly matched the amino acid sequence of the CBc subunit from C. durissus terrificus (Figure 3E).

2.3. Phospholipase Activity and Cytotoxicity of CB Subunit Purified from C. vegrandis

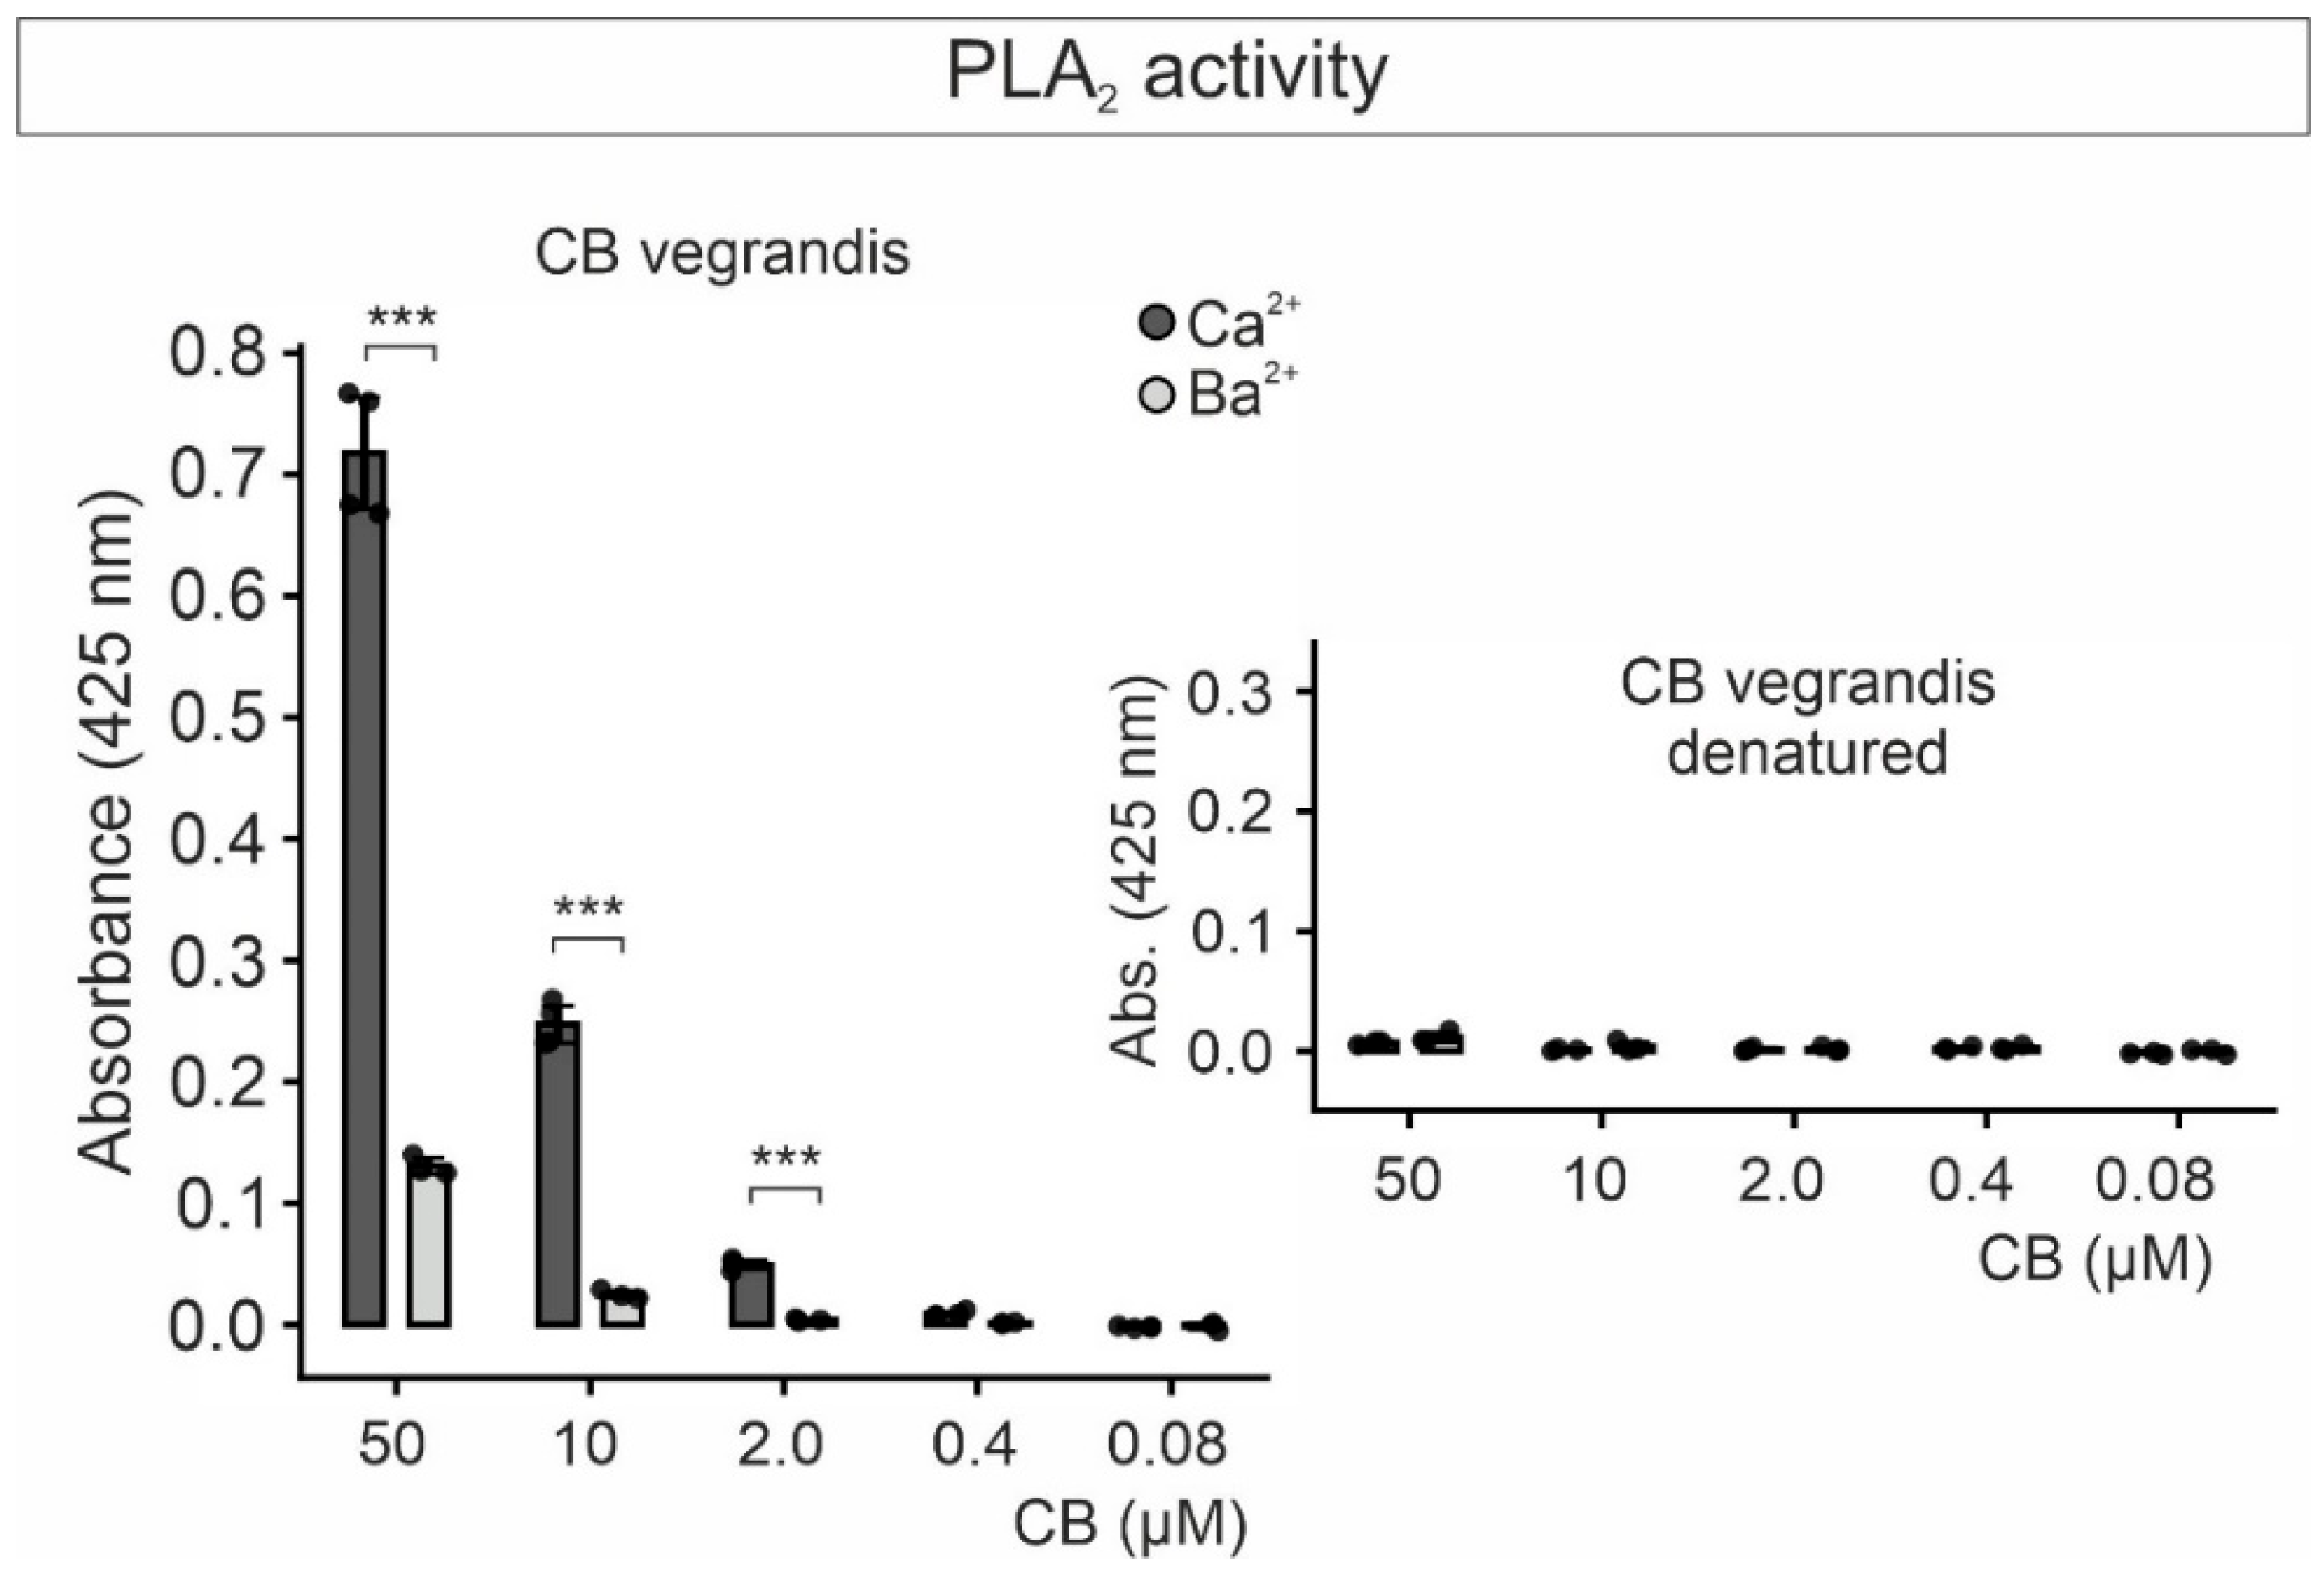
The PLA2 capability of the purified CB from C. vegrandis, at concentrations between 0.08 µM and 50 µM, was tested using a colorimetric assay [32,33]. In the presence of Ca2+ (10 mM), CB displayed a relatively robust PLA2 activity at the highest concentration tested that decreased considerably with decreasing CB concentrations up to undetectable levels at concentrations lower than 0.4 µM (Figure 4). When Ca2+ was substituted in the assay solution with an equimolar concentration of Ba2+ to inhibit PLA2 action [13] the enzymatic activity was indeed dramatically reduced at all CB concentrations (Figure 4). At 10 µM CB PLA2 activity was barely detectable and about ten-fold lower as compared with the one estimated in the Ca2+-containing solution. Heat denaturation of CB completely abolished the enzymatic activity in both, Ca2+- and Ba2+-containing solutions, indicating that lipolysis was indeed mediated by the protein (Figure 4). Therefore, CB purified from C. vegrandis retained its catalytic action, and consequently its overall three-dimensional architecture.
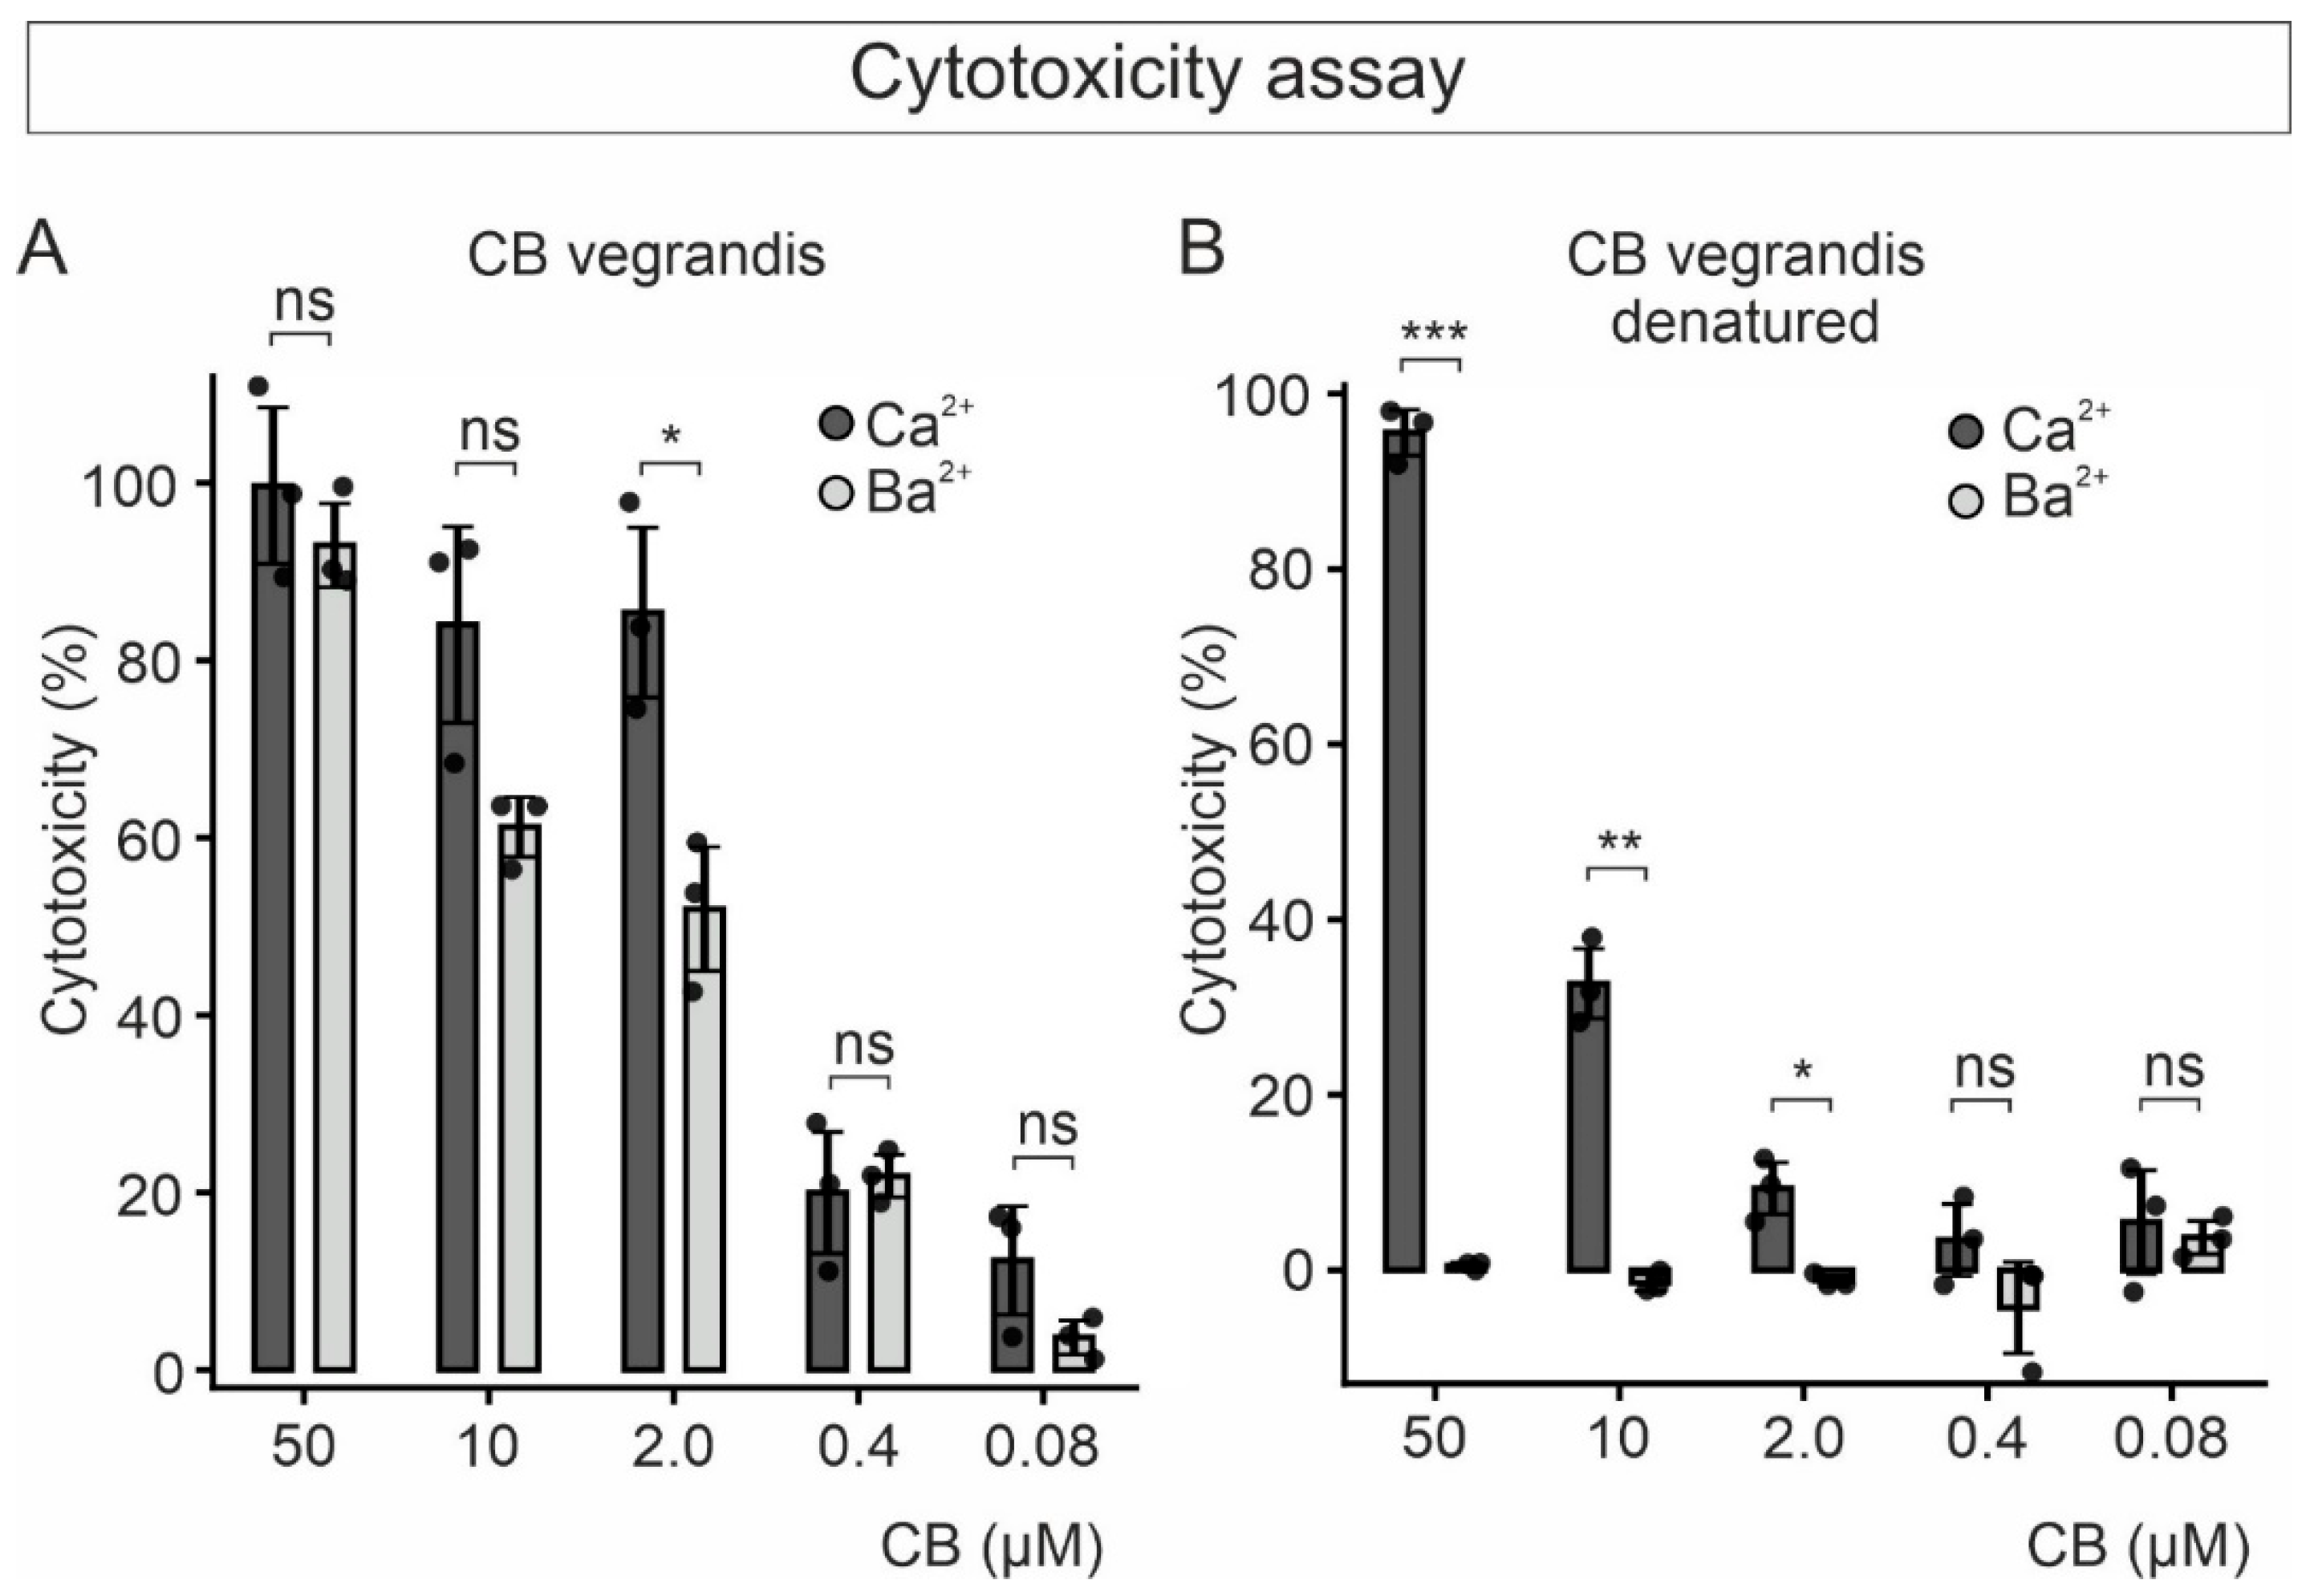
We next examined the cytotoxicity induced by the CB from C. vegrandis using a commercially available colorimetric kit (LDH-CytoxTM) that measures the lactate dehydrogenase (LDH) activity resulting from the release of the enzyme from damaged cells. In contrast to the PLA2 activity, CB exhibited rather comparable cytotoxic activity in solutions containing 10 mM of either Ba2+ or Ca2+ (Figure 5A). Whereas the PLA2 activity of CB is rather insignificant in the presence of Ba2+, its cytotoxic effect still takes place to a considerable extent, suggesting the occurrence of non-enzymatic mechanisms contributing to cytotoxicity.
Heat denaturation of CB—at all concentrations tested—blunted cell death in Ba2+- but not in Ca2+-containing solution (Figure 5B). Concentrations of the denatured toxin higher than 2.0 µM were able to exert cytotoxic effects. It is likely that high concentrations of Ca2+ might increase the thermal stability of the protein or induce toxic conformational changes.

2.4. Internalization of CB Purified from C. vegrandis in HeLa Cells

It has been suggested that CB interacts with extracellular and intracellular biological targets and thus, it must be internalized into cells to exert some of the effects [18,34]. Internalization of CB sourced from C. durissus terrificus into cerebellar granule cells [18] and mammary epithelial cells [35] has been previously shown.
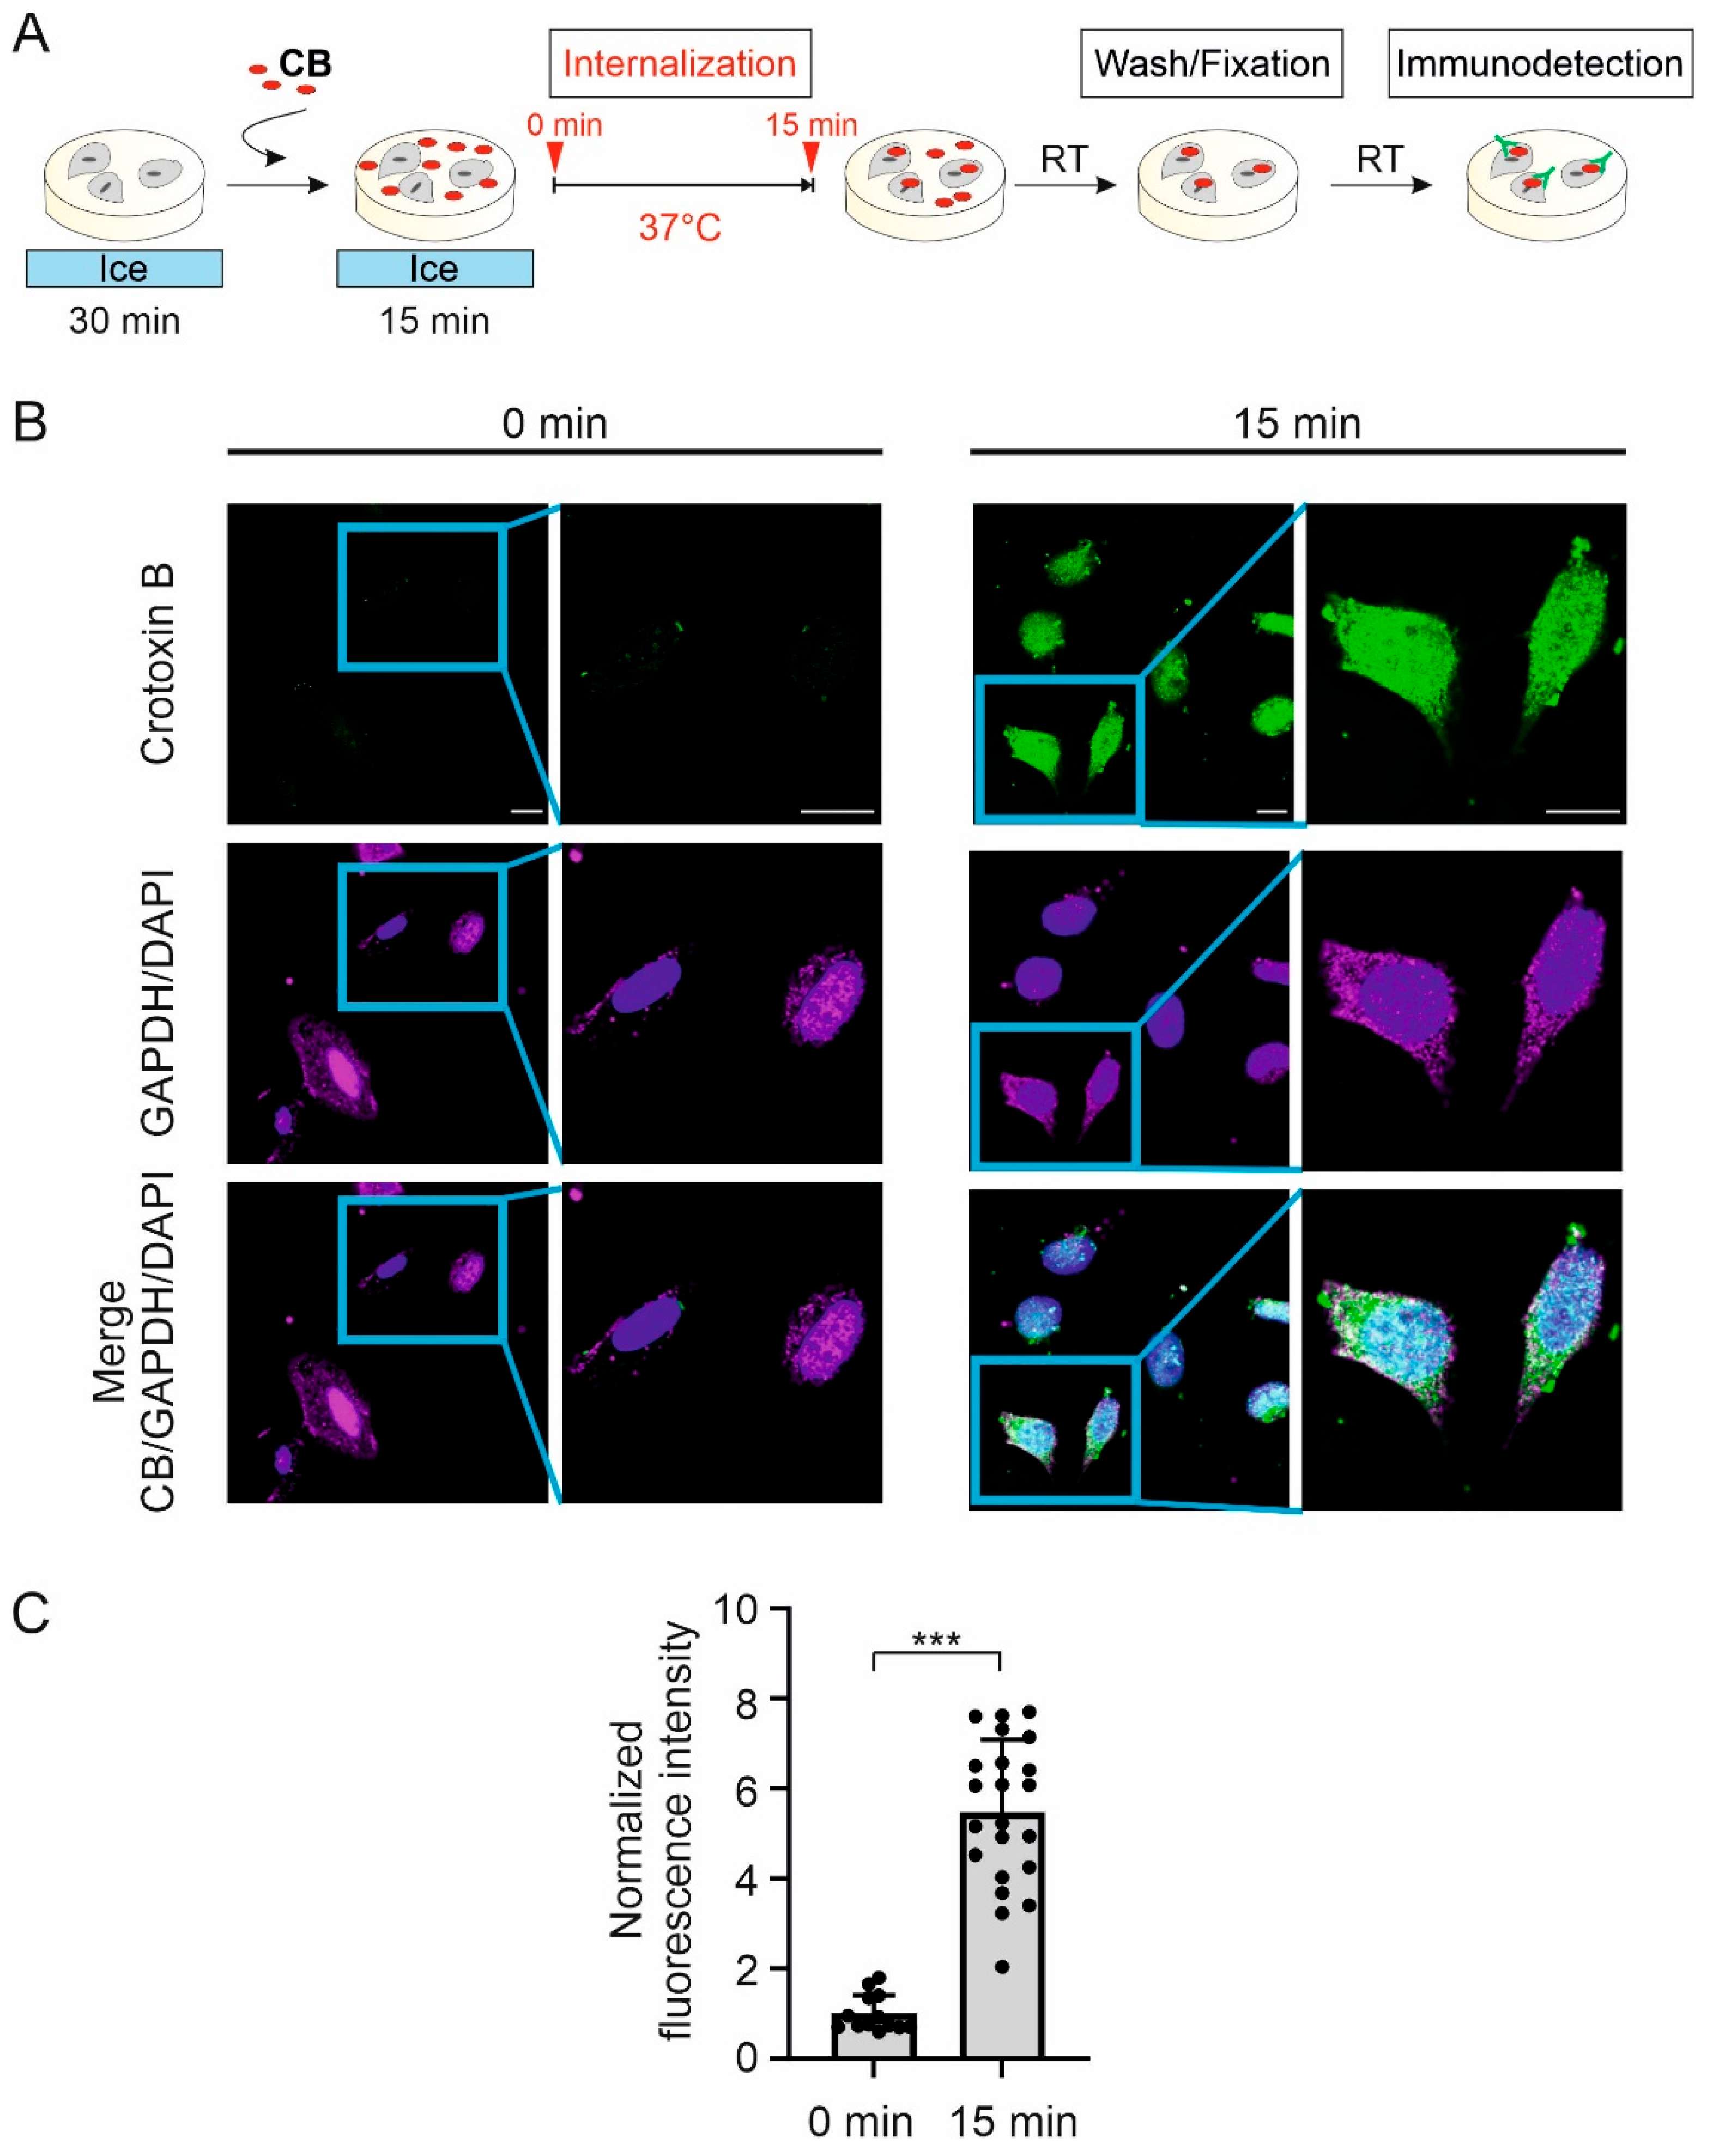
We here tested whether purified CB is internalized by HeLa cells. HeLa cells were chosen over tsA201cells because they exhibit a larger cytosol to nuclear ratio that allows better visualization of internalized proteins. Cells were incubated with 1µM CB on ice to inhibit endocytosis and transferred to 37 °C for 15 min to allow internalization of CB. Then cells were fixed and immunostained (Figure 6A). Control cells were fixed before the transfer to 37 °C (t = 0). The immunostained cells were visualized using laser-scanning confocal fluorescence microscopy.
Following the 15 min incubation at 37 °C with CB, the distribution of the fluorescent signal from CB overlaps with the signals of the intracellular GAPDH and the DAPI nuclear marker, indicating that CB was internalized into the cell and localized to the cytoplasm and nucleus (Figure 6B). In control cells, the fluorescence signal from CB was barely visible and significantly lower than that at 15 min (Figure 6B,C). This result demonstrates the capability of CB from C. vegrandis to be internalized, independently of CA.

2.5. Effect of CB Purified from C. vegrandis on CaV2.2 and CaV1.2 Calcium Channels Expressed in tsA201 Cells

Given that phospholipid hydrolysis leads to damage of the plasma membrane, precluding electrophysiological recordings, we measured ion currents through CaV channels using the whole-cell patch clamp technique with Ba2+ (instead of Ca2+) as charge carrier. Replacement of Ca2+ by Ba2+ successfully inhibited the PLA2 activity of CB (Figure 4). Currents were recorded from CaV2.2 and CaV1.2 channel complexes heterologously expressed in tsA201 cells after transfection with either CaV2.2/CaVβ4 or CaV1.2/CaVβ2 encoding plasmids. CaVβ subunit is included since it is required for plasma membrane targeting and normal function of the CaVα1 pore-forming subunits, with CaVβ4 and CaVβ2 displaying preferences for CaV2.2 and CaV1.2, respectively [21,36].
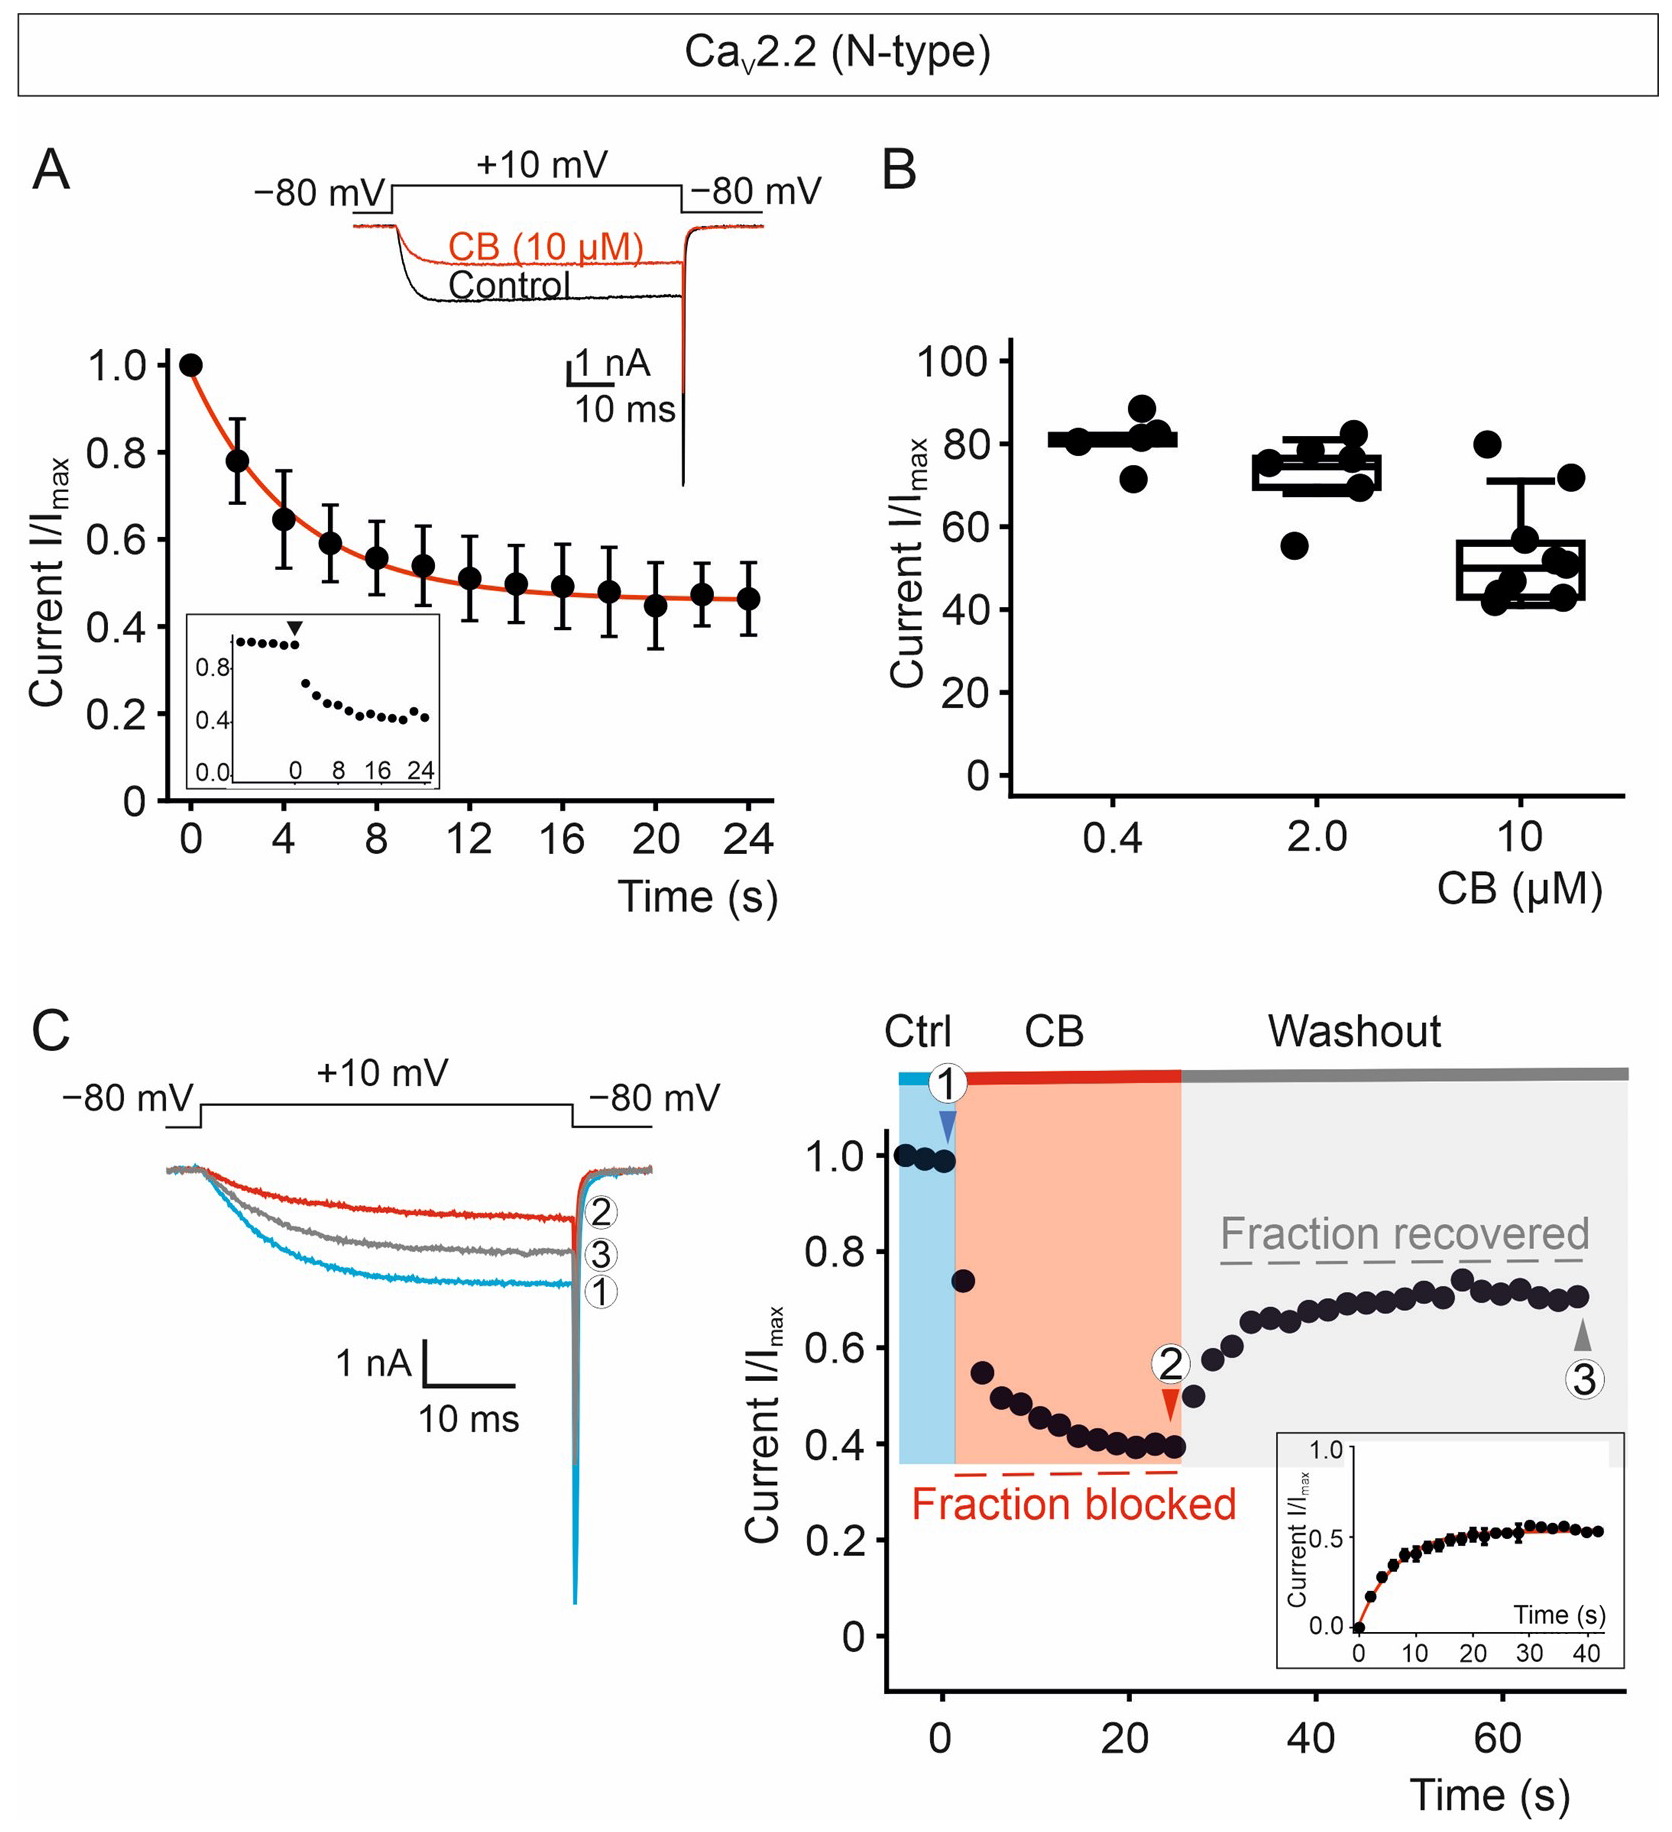
Whole-cell recordings from cells expressing the CaV2.2 channel complex showed ionic currents evoked by a voltage step to +10 mV from a holding potential of −80 mV, which were significantly reduced upon continuous perfusion of the cell with 10 µM of CB (Figure 7A). To verify that steady-state blockade was achieved, the time course of CB-mediated current inhibition was monitored by recording the current responses elicited by the voltage step to +10 mV repetitively applied every 2 s. By perfusion with 10 µM of CB, a steady-state inhibition was reached after about 12 s, resulting in a current decrease of approximately 50% (Figure 7A). Lower concentrations of CB, namely 0.4 µM and 2.0 µM, inhibited currents to a lesser extent (Figure 7B). Due to cell damage, recordings at CB concentrations higher than 10 µM were shunned.
To study the recovery of the block, once a steady-state blockade was established using 10 µM CB, the toxin was washed out by perfusing the cell expressing CaV2.2 channels with control solution (Figure 7C). CaV2.2-mediated current inhibition was partially reversible upon removal of CB, with approximately 50% recovery. Recovery from the block occurs within seconds; this rapid reversal is inconsistent with the irreversible damage characteristic of cytotoxicity.
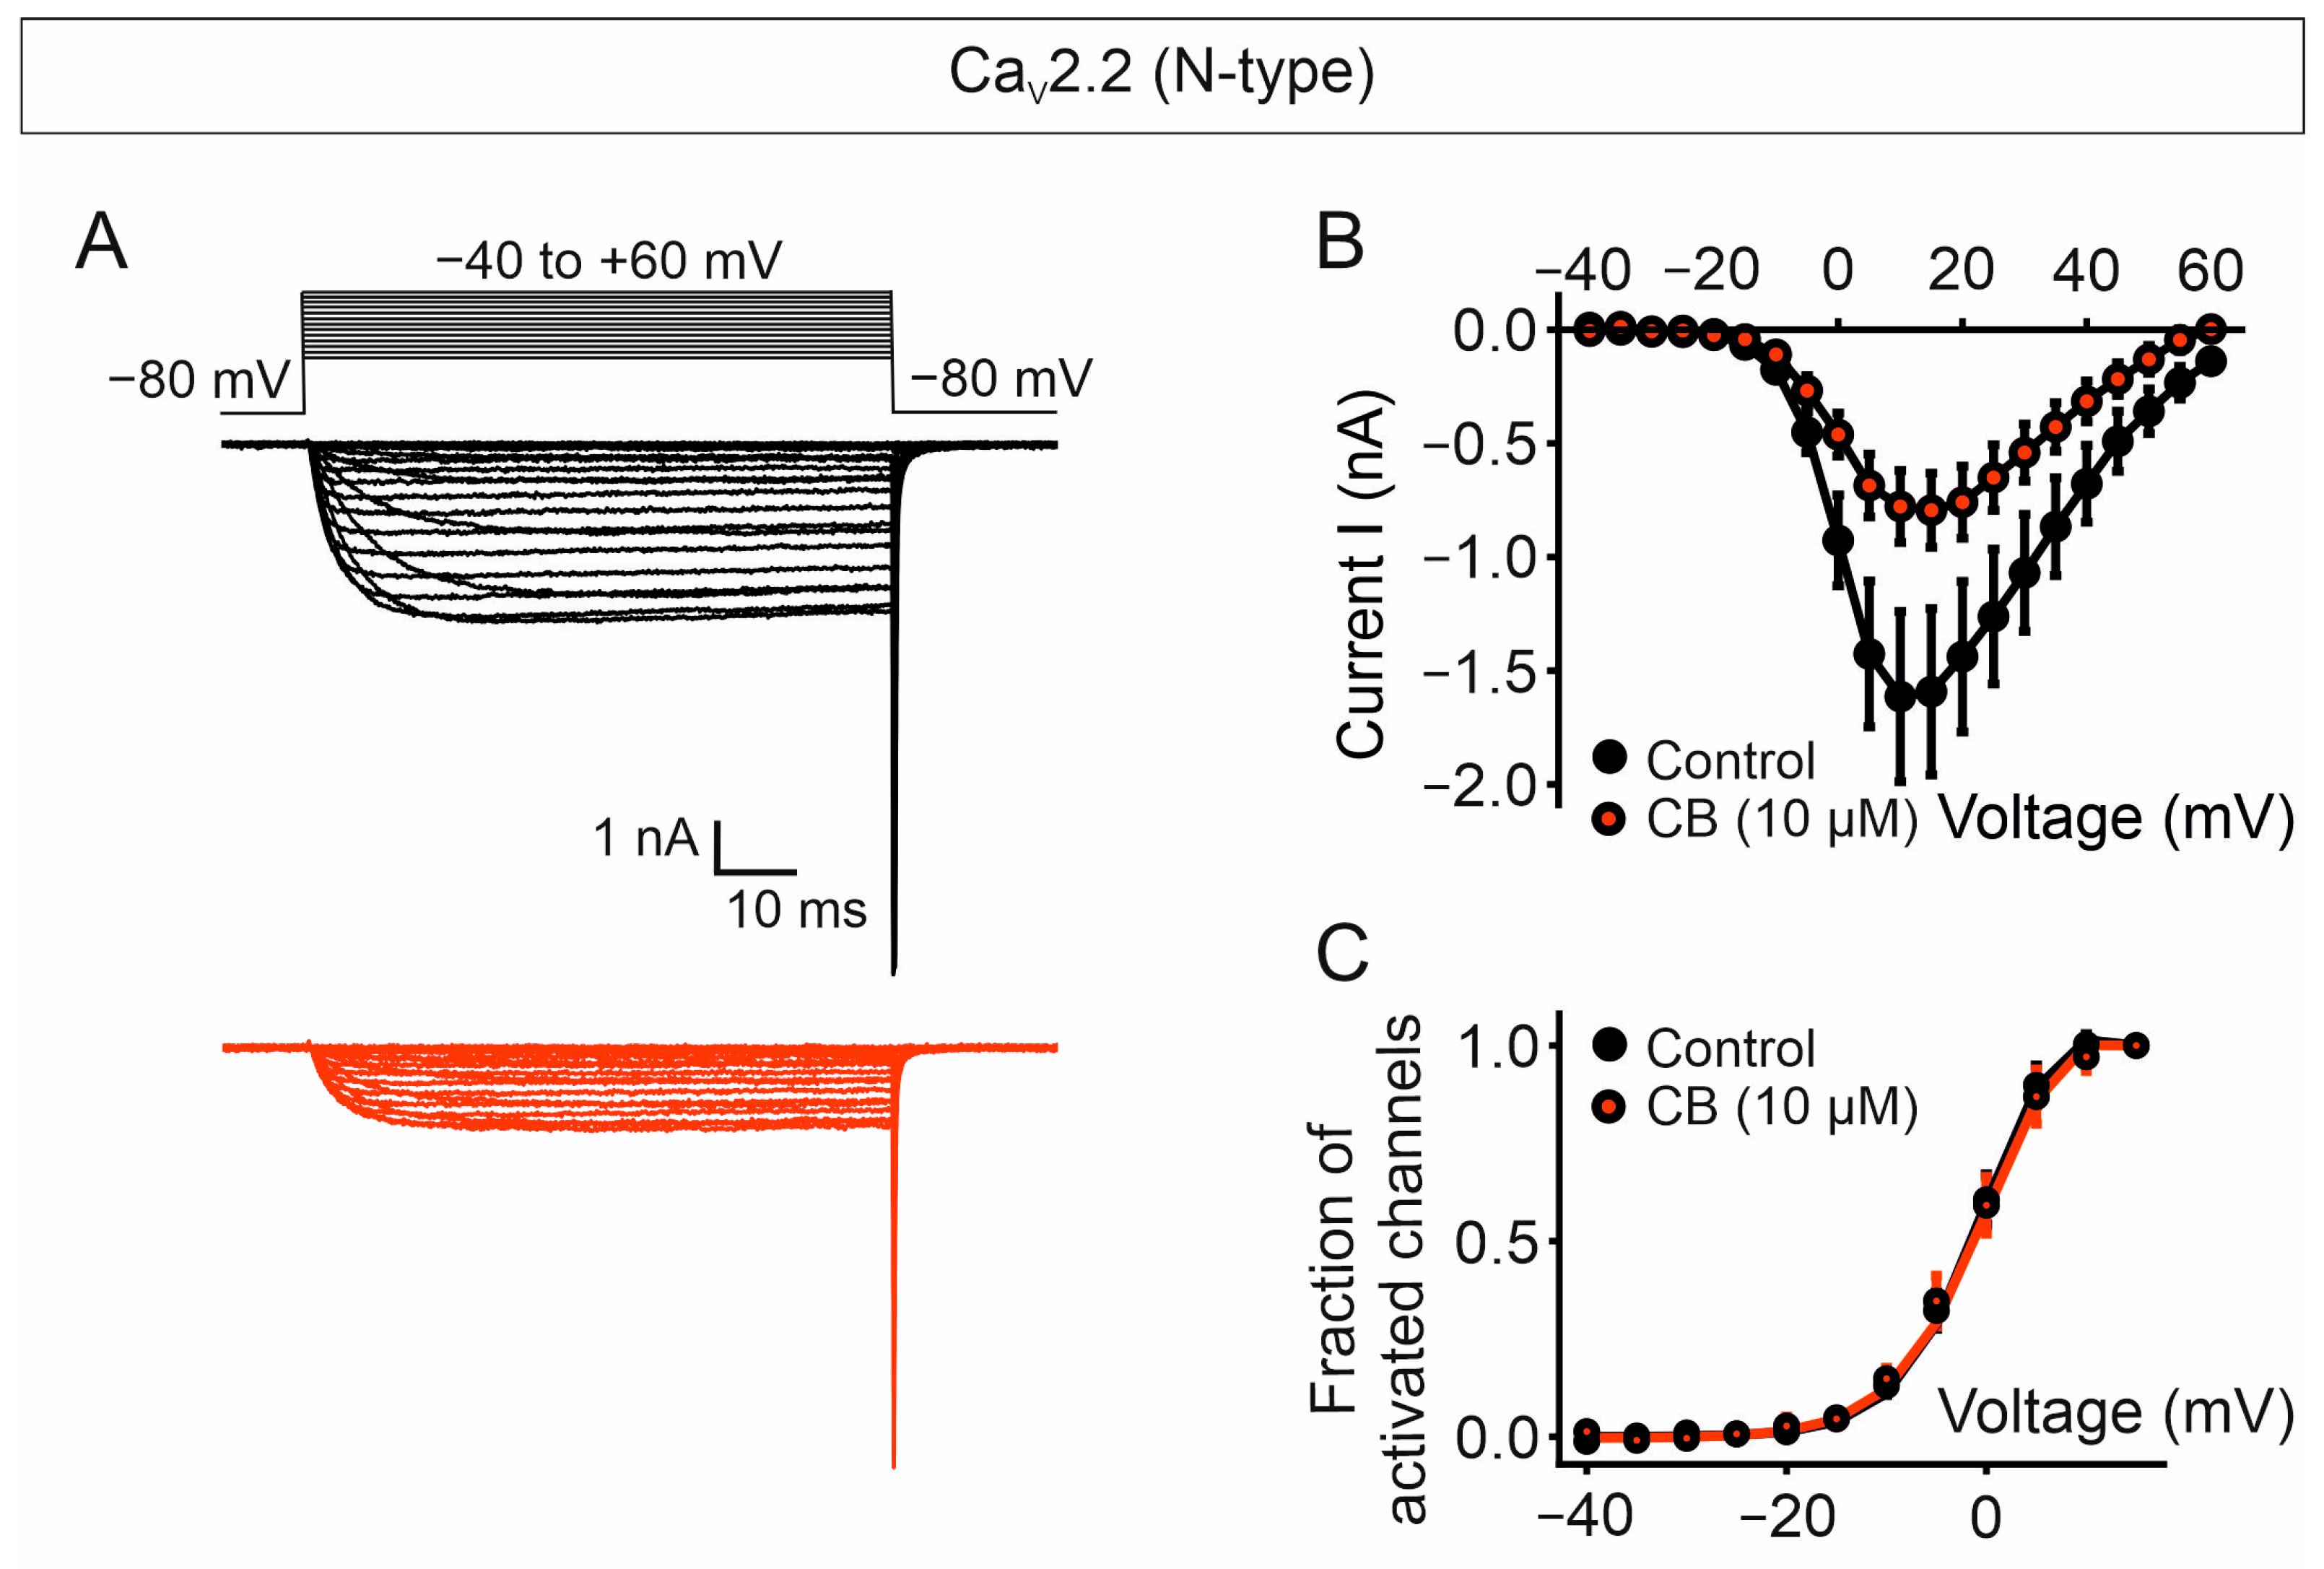
The voltage-dependent ionic currents in response to different voltage steps, from −40 mV to +60 mV, from a holding potential of −80 mV, in the absence and presence of CB, are shown in Figure 8A. The ionic current versus voltage (I/V) plot shows that CB reduces ionic currents amplitude at all voltages and with an average decrease of about 50% in the maximal (peak) current obtained at +10 mV (Imax, −1.61 ± 0.37 nA and −0.78 ± 0.16 nA; p = 0.0078, paired t-test, for control cells and CB-treated cells, respectively) (Figure 8B). Furthermore, virtually identical curves for the fraction of activated channels versus voltage were obtained for control cells and cells exposed to CB, indicating that CB-mediated current reduction is not caused by alterations in the voltage dependence of activation of the channel (Figure 8C).
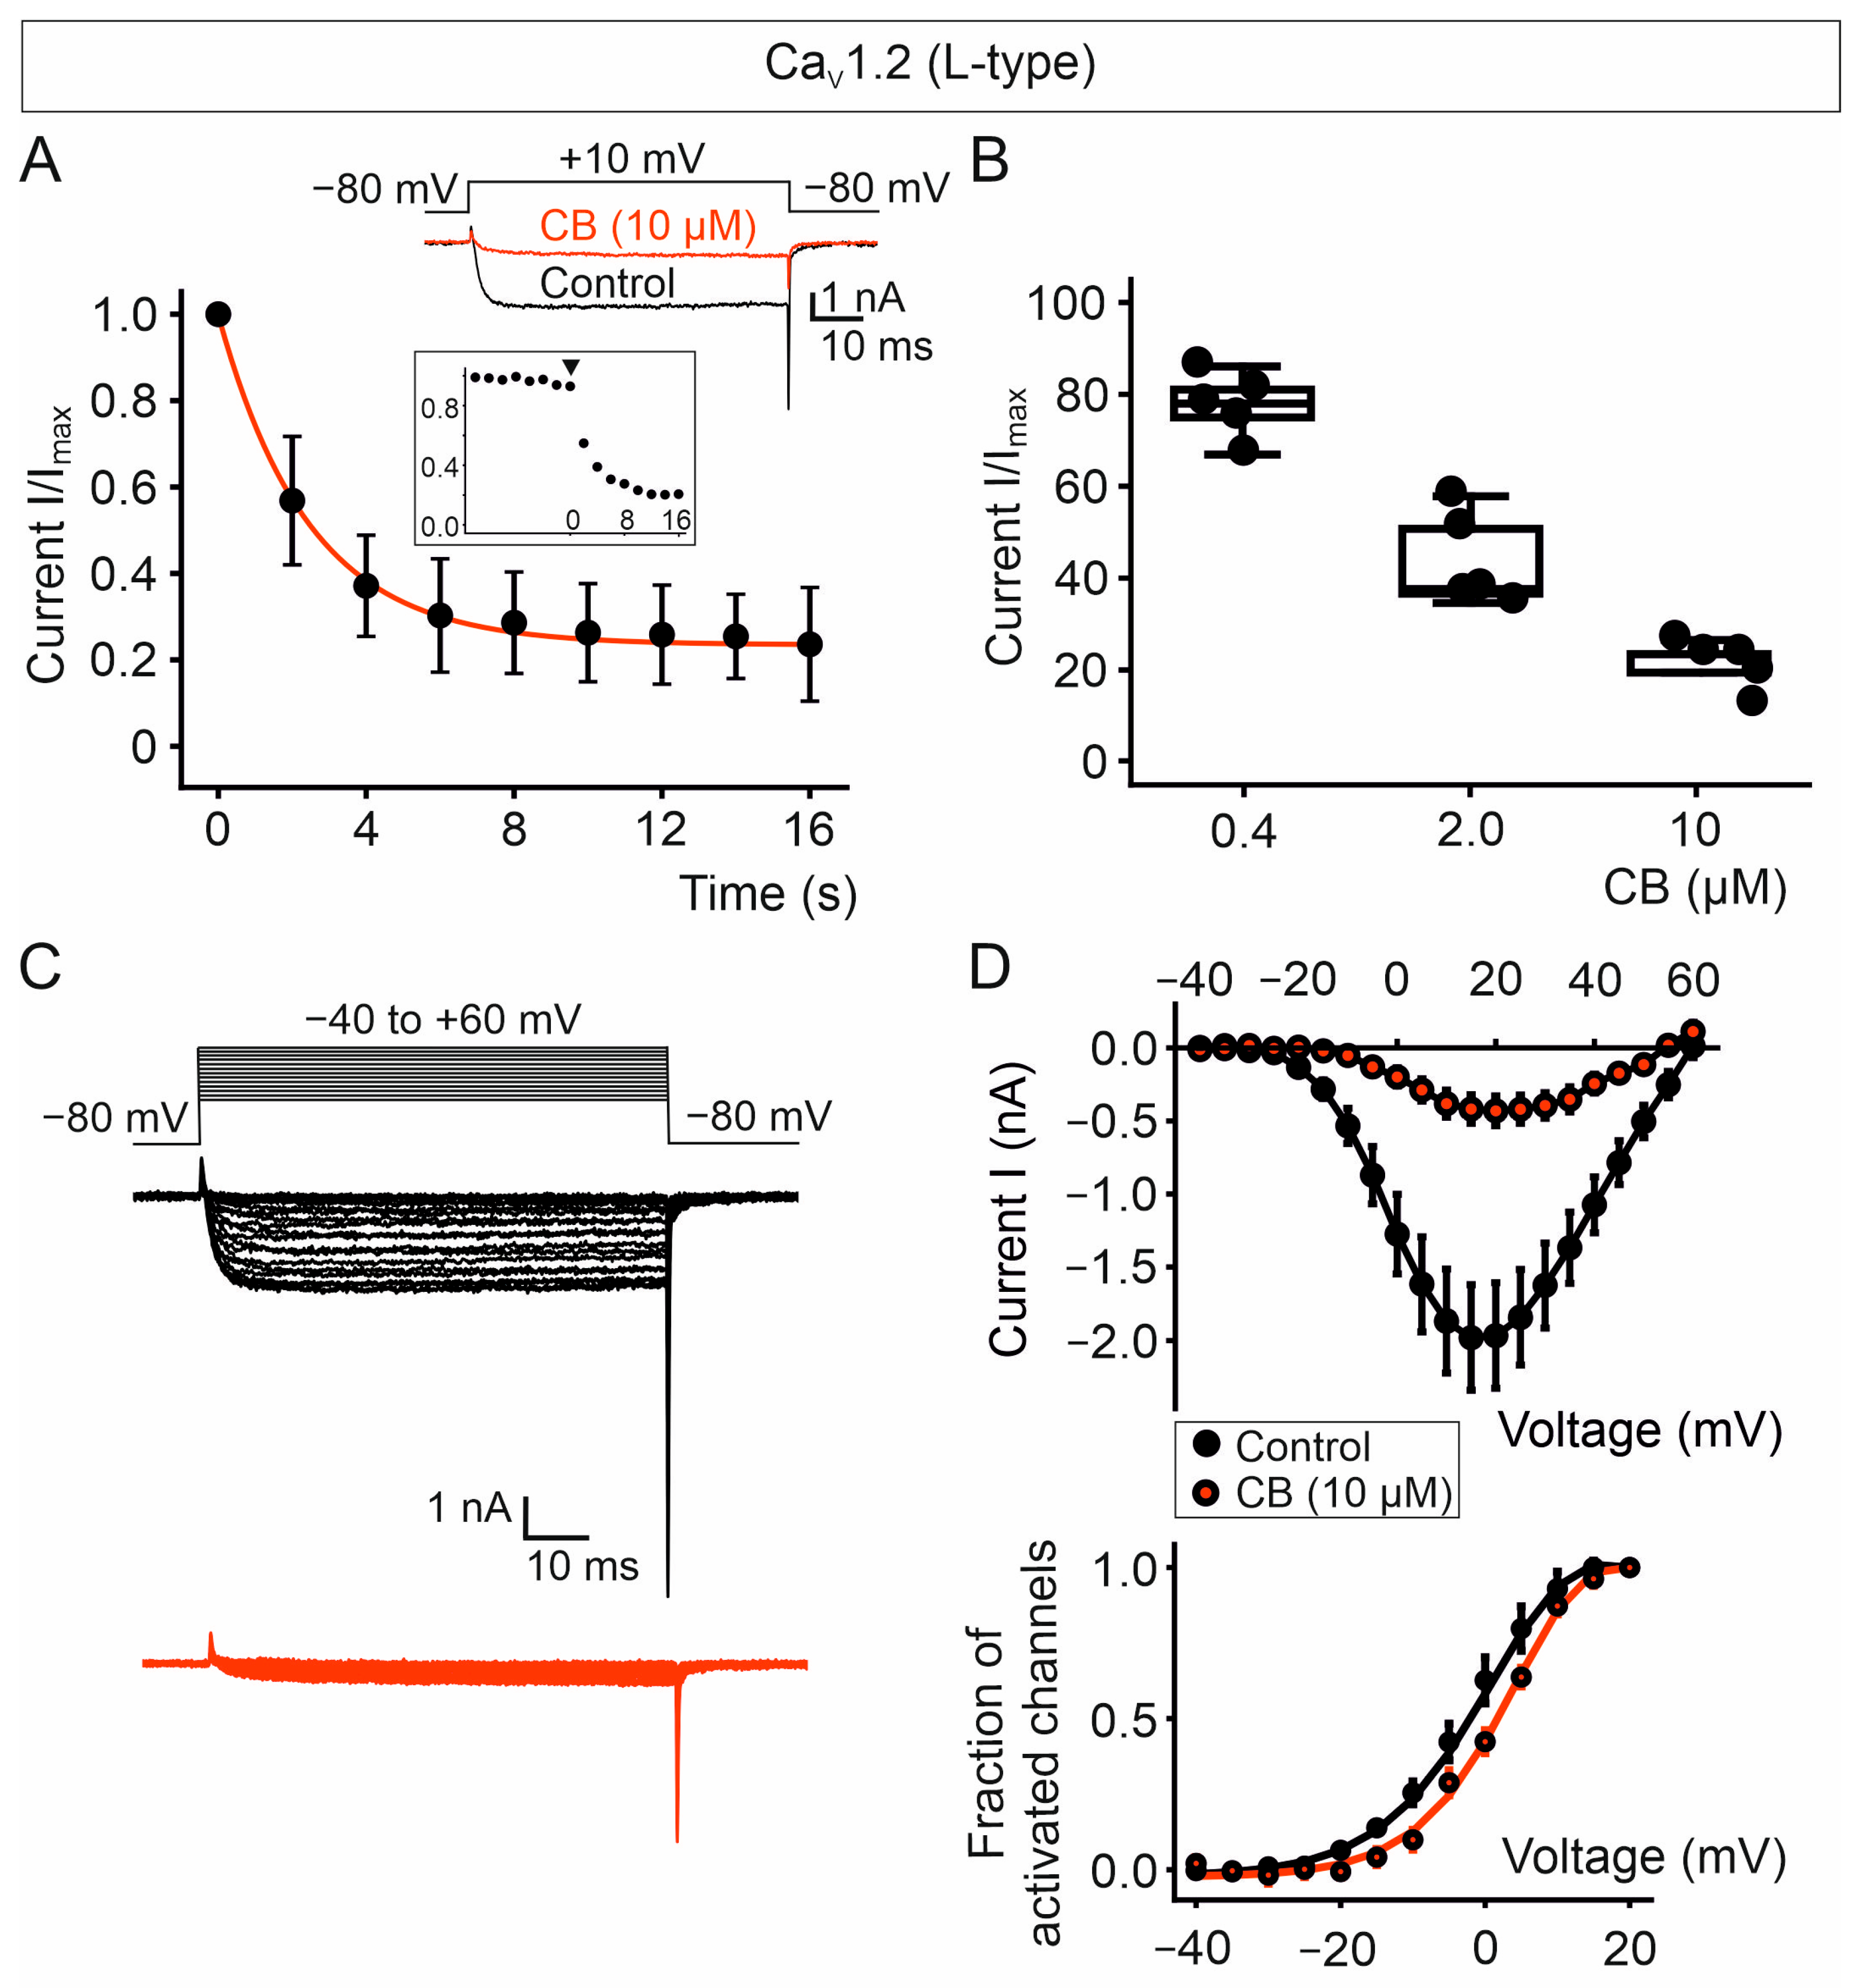
As for the CaV2.2 channel complex, we employed the single voltage protocol to monitor the temporal course of the current inhibition through CaV1.2 complexes (Figure 9A). Blockade of CaV1.2 currents after perfusion with 10 µM of CB reached an equilibrium within about 10 s with nearly 80% of current inhibition. CB inhibits the 50% of the CaV1.2-mediated currents at a concentration of approximately 2.0 µM (Figure 9B), which is about five-fold less than the CB concentration needed to achieve the same current decrease in CaV2.2-expressing cells. Therefore, CB appears to block CaV1.2 with apparent higher potency than CaV2.2 channels.
In the presence of 10 µM CB, the maximal current amplitude (measured at +15 mV) decreased 79% compared with control cells as shown in the ionic current versus voltage (I/V) plot for CaV1.2 complexes (Imax, −1.98 ± 0.36 nA and −0.42 ± 0.10 nA; p = 0.0070, paired t-test, for control cells and CB-treated cells, respectively) (Figure 9C,D). The fraction of activated channels versus voltage plot obtained from CB-treated cells shows a modest rightward shift of 3.8 mV in the half-activation voltage compared to the control cells (Figure 9D). This relatively small change in the voltage dependence of activation in the presence of the CB subunit is not sufficient to account for the significant reduction in the current amplitude mediated by CaV1.2 channels.

3. Discussion

The main finding of the present work is that the basic CB subunit of crotoxin from C. vegrandis suffices to block ion conduction through the voltage-gated CaV1.2 and CaV2.2 calcium channels in the tsA201 mammalian heterologous expression system. CaV block is independent of its intrinsic PLA2 enzymatic activity and the presence of the acidic CA subunit. To the best of our knowledge, this is the first study reporting direct inhibition of CaV-mediated currents by an isolated CB subunit. The molecular mass of CB restricts its absorption into the bloodstream and its passage across the blood–brain barrier and entry into the central nervous system. It has been shown that a significant amount of the crotoxin is absorbed into the lymphatic system. Once in the bloodstream, its rapid clearance suggests it might move quickly towards its tissue targets [37,38]. The L-type calcium channels directly regulate the contraction of vascular smooth muscle, and their blockade will lead to muscle relaxation and vasodilation, which will further improve the movement of the toxin from the bloodstream into its specific tissue targets. On the other hand, although several studies have shown effects of crotoxin that suggest it reaches the central nervous system [39,40,41], whether or not CB actually crosses the barrier remains unresolved. If indeed CB has the ability to permeate the blood–brain barrier and access the central nervous system, then blocking of CaV channels would have a significant impact on the prey’s survival.
Blockade of CaV2.2 occurs with no alterations in the voltage dependence of activation of the channel, compatible with the notion that CB operates as a pore blocker [42]. The incomplete recovery of CaV2.2 channels from CB block suggests a state-dependent mechanism of block, which has been observed for peptide toxins that display preferential interaction with the inactivated state of the channel [43,44]. Future studies are required to determine potential CB-induced changes in the voltage dependence of channel inactivation, as such alterations would critically influence the amount of calcium entering the cell and, consequently, its availability for downstream signals. Despite the underlying mechanism, the blockade of CaV2.2 channels anticipates an acute biological effect after exposure to the venom, given that CaV2.2 channels directly trigger neurotransmission; an incoming action potential into the nerve terminal opens CaV2.2 channels, allowing Ca2+ influx at the presynaptic nerve terminal, which in turn permits neurotransmitter release [23]. Therefore, inhibition of CaV2.2 currents results in decreased calcium for neurotransmission with a concomitant impairment of synaptic activity.
The inhibition of CaV2.2-mediated currents by CB demonstrated in this study is in apparent contrast to the increase in glutamate release induced by CB (from C. durissus terrificus) observed in rat cerebral cortex synaptosomes [18]. This effect depended on the PLA2 enzymatic activity of CB and on the entry of calcium via neuronal CaV2.1 and CaV2.2 channels. The authors proposed that the generation of arachidonic acid, facilitated by CB, stimulates Ca2+ permeation and, in turn, glutamate release [18]. A direct effect of CB on CaV channels was not explored. The study showed internalization of CB from C. durissus terrificus that is in line with our result showing that purified CB from C. vegrandis is internalized within minutes into HeLa cells. The capability of CB to enter into the cell and interact with intracellular targets [5,34,45] may expand not only the variety of biological actions but also confer the ability to induce diverse pharmacological effects at different time scales, i.e., fast inhibition of CaVs from the extracellular side can be followed by intracellular actions acting directly or indirectly on a different target.
The current inhibition through CaV1.2 is more potent than for CaV2.2, and it is accompanied by a small right shift in the voltage activation curve, suggesting that changes in the gating of the channel might slightly contribute to current inhibition. An opposing effect on L-type calcium channels has been observed with the heterodimeric crotoxin (CA/CB subunits) from C. durissus terrificus, in which the toxin induced a two-fold increment in the peak current amplitude mediated by these channels, reported in neonatal rat cardiomyocytes [46]. Therefore, we attribute the different effects on CaV-mediated currents to the presence of CA, which changes the modus operandi of CB, diversifying the crotoxin effects in different tissues [5,8].
In the heart, CaV1.2 localizes to the transverse tubules of the cardiomyocytes, and its activation is mandatory for initiating cardiac contractions [26]. The upregulation of CaV1.2 channels by β-adrenergic stimulation increases heart rate and contractile force, being central to the fight-or-flight response [47,48,49]. This response is activated upon perceived danger and is key for the survival of the animal during immediate stress, i.e., by a prey exposed to the predator. A blockade of the cardiac CaV1.2 would profoundly interfere with this acute stress reaction. Additionally, it is well established that adrenaline strongly potentiates CaV1.2 function during sympathetic stimulation; whether and how CB could alter the adrenergic enhancement of Ca2+ influx remains to be elucidated. It is worth mentioning that calmodulin, which is a key regulator of L-type channels gating, has been reported to be one of the intracellular acceptors for ammodytoxin, a presynaptic PLA2 neurotoxin from Vipera ammodytes [50,51]. In the future, it will be interesting to investigate a potential interaction of CB from C. vegrandis with calmodulin and its role in CaV modulation.
In the brain, CaV1.2 sits at the postsynaptic side and does not contribute to neurotransmitter release but to calcium signalling, including gene transcription [24,25]. Additionally, isolated CB is mainly described as acting presynaptically, with postsynaptic effects [52] and binding to other ion channels in either heterologous expression or ex vivo systems have been reported [53,54]. A blockade of postsynaptic CaV1.2 by CB may have a relatively long-term effect by influencing excitation–transcription coupling. Within this framework, it has been observed that two hours after intraperitoneal administration of crotoxin (CA/CB), rats develop behavioural alterations [39]. Moreover, these changes could be attributed to other effects of CB, a blockade of CaV1.2 channels with a well-established role in stress response and brain function, which can explain the behavioural changes after C. vegrandis snakebite [36,55,56,57].
The PLA2 activity of CB in Ca2+-containing solution was relatively high at the highest concentration of toxin (50 µM) as compared with lower concentrations (≤10 µM). In Ba2+-containing solution, the PLA2 activity measured was negligible except at 50 µM CB. Heat-denatured CB exhibits no PLA2 activity in either Ca2+ or Ba2+ solution, demonstrating that the catalytic activity is solely mediated by the toxin. Despite the insignificant degree of catalytic activity of CB in Ba2+, its cytotoxicity levels were comparable to those obtained in Ca2+-containing solution, indicating that cytotoxicity is not caused primarily by its lipolytic activity. Results from several studies have suggested that CB can exert pharmacological effects in a phospholipase-independent manner by interacting with phospholipids even in the absence of divalent cations. Both binding to synaptic membranes and neurotoxicity, but not its phospholipase activity, are virtually lost upon tyrosine modification [13,58]. The most relevant tyrosine residue determining neurotoxicity and membrane binding affinity, at position 21, is present in the purified CB from C. vegrandis as assessed by mass spectrometry-analyzed tryptic peptides [58]. Therefore, we assume that, under our conditions, cytotoxicity of CB is not inherent to its catalytic activity but associated with its ability to interact and damage cell membranes [3,5,7,13,15,59,60]. Alternatively, we cannot fully discard that a minimal PLA2 activity may be sufficient for an early membrane perturbation effect promoting, among other actions, toxin internalization and a chain of intracellular events leading to further cell damage.

4. Conclusions

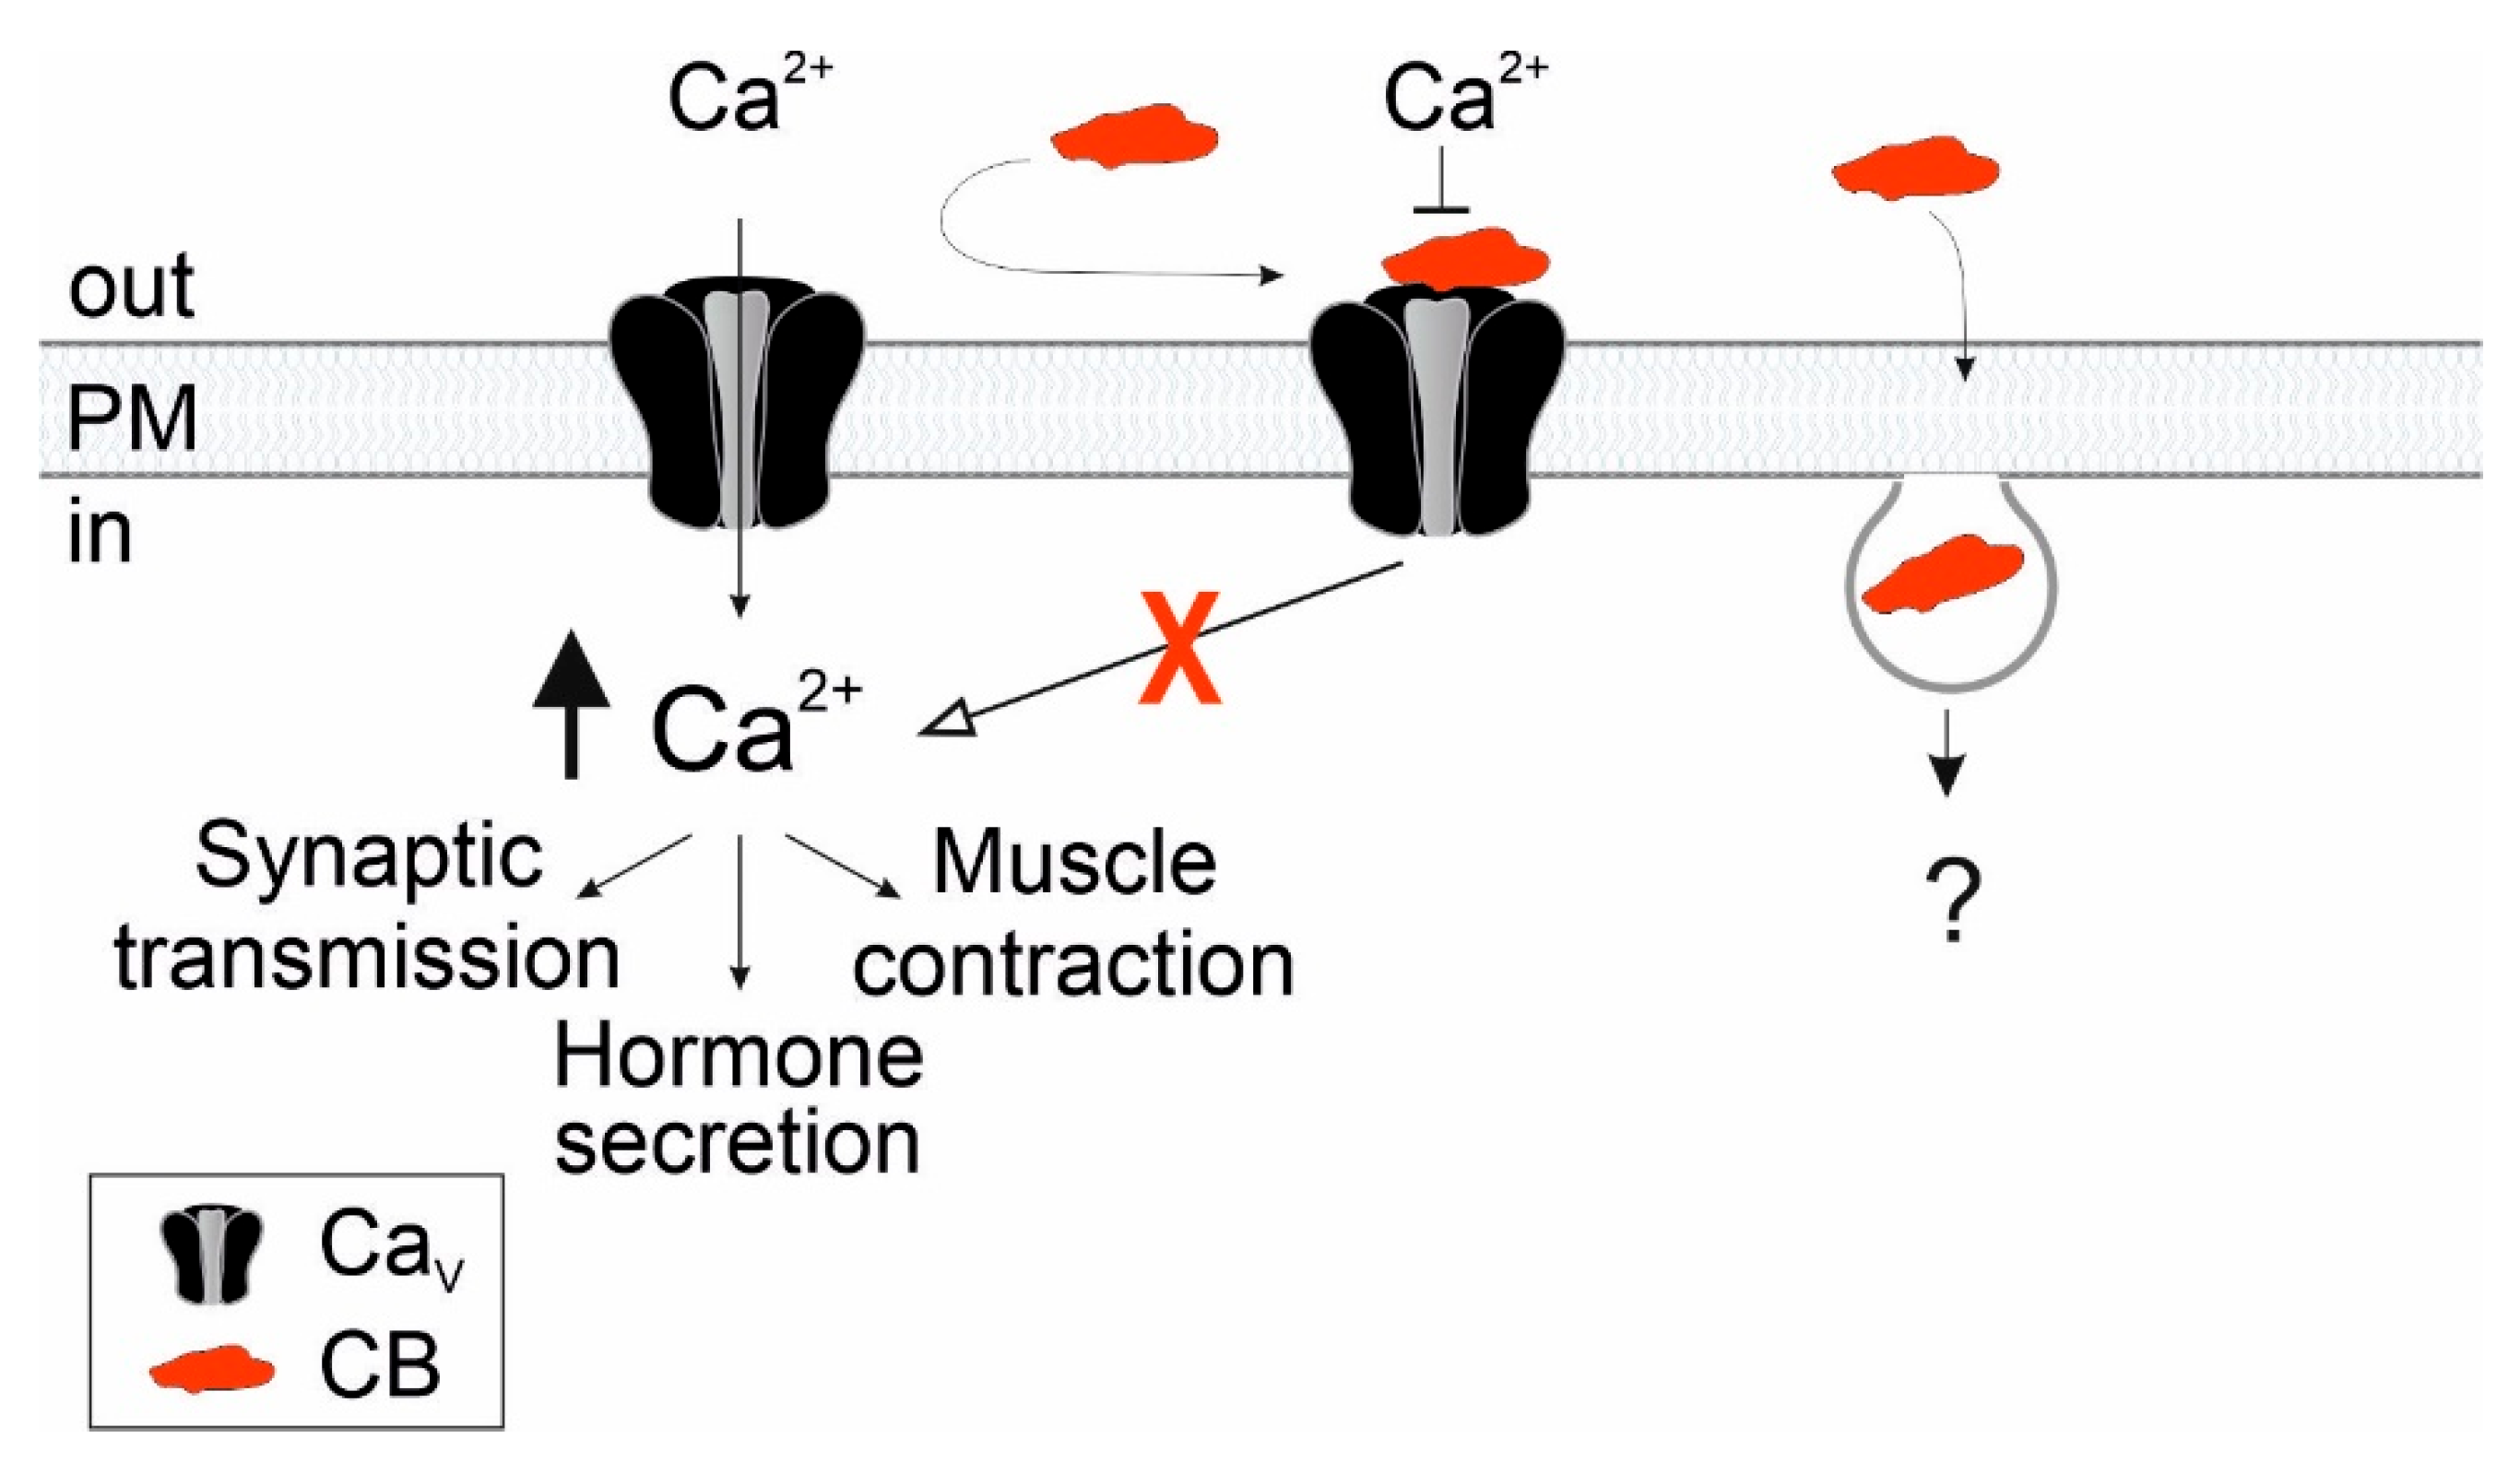
The present study reveals that CaV channels, which are intimately involved in neurotransmission and cardiac contraction, are molecular targets of the PLA2 subunit of crotoxin purified from C. vegrandis. The capability of CB to be internalized opens potential mechanisms of action; however, the fate of internalized CB and interactions with intracellular targets remain to be elucidated (Figure 10).
Our findings enlarge the list of ion channels targeted by the CB subunit of crotoxin and its pharmacological effects, providing new insights into the clinical aspects of rattlesnake envenomation.

5. Materials and Methods

5.1. Crotalus vegrandis Crude Venom Source

Two sources of venom were used: (a) venoms extracted from captive male, a female and five unsexed juveniles (13 weeks old) individuals of C. vegrandis [61] by Michael Steige from Gifttierhaus Eimsheim e.V. in Eimsheim (Germany). The taxonomy of the species follows the current status according to the Reptile Database (www.reptile-database.org, accessed on 14 October 2025). The venom from the three different species (male, female, and juvenile) was handled separately at all times and individually purified. After lyophilization using a Savant Speed Vac Plus SC110 A (Thermo Fisher Scientific, Dreieich, Germany), the crude venoms were stored at −80 °C until use. (b) Lyophilized venom from C. vegrandis was purchased from Latoxan Laboratory (Portes-lès-Valence, France). This venom was extracted from several specimens and corresponded to a mix of adult male and female. Upon arrival, it was stored at −80 °C until use.

5.2. Purification of Crotoxin CB Subunit from Crude Venom from LatoxanTM

The crude venom from LatoxanTM was directly purchased from Latoxan Laboratory (Portes-lès-Valence, France). CB was purified from the crude venom using size exclusion chromatography (SEC) with a Superdex 75 16/160 GL column, 120 mL bed volume (GE Healthcare), followed by cation exchange chromatography (CEX) using a HiTrap SP Sepharose Fast Flow column (Thermo Fisher Scientific, Dreieich, Germany). The lyophilized venom was resuspended in 100 mM ammonium acetate buffer, pH 6.8, and loaded onto the Superdex 75 pre-equilibrated with the same buffer. The fractions containing CB, as judged by SDS-PAGE analysis, were pooled and loaded onto a CEX column equilibrated with 100 mM ammonium acetate buffer, pH 6.8. After washing with 100 mM ammonium acetate buffer, pH 6.8, the protein was eluted with a linear gradient from 0 to 100% with start and end buffer containing 100 mM ammonium acetate buffer, pH 6.8, not supplemented or supplemented with 1 M NaCl, respectively. The fractions containing CB, as judged by SDS-PAGE, were pooled, dialyzed overnight against ammonium acetate buffer without salt using a dialysis cassette (Slide-A-Lyzer 3.500 MWCO, Thermo Fisher Scientific, Dreieich, Germany) and concentrated using Amicon with 5.000 MWCO (Merck, Darmstadt, Germany). The concentrated CB sample was lyophilized overnight and stored at −80 °C until use.

5.3. Western-Blot Analysis of CB Purified from C. vegrandis

Purified CB was resolved in a 15% reduced SDS-PAGE and blotted onto a nitrocellulose membrane (GE Healthcare, Life Science, Solingen, Germany) for 1 h in transfer buffer (10 mM NaHCO3, 3 mM NaCO3, pH 9.9). Membranes were blocked in 5% BSA blocking buffer (10 mM Tris, 150 mM NaCl, 0.1% Triton X-100, pH 7.5) and incubated with anti-CB antibody against the CB subunit from C. durissus terrificus (Anti-South American/Mojave rattlesnake crotoxin antibody A10G, Hölzel, Germany) [62]. After several washes, membranes were incubated with anti-mouse IgG HRP-conjugated secondary antibody (Thermo Fisher Scientific, Dreieich, Germany). Protein bands were detected using a chemiluminescent detection kit (ECL Chemiluminescent Substrate, Thermo Fisher Scientific, Dreieich, Germany).

5.4. Phospholipase Activity of CB Purified from C. vegrandis

The phospholipase A2 enzymatic activity of the CB subunit of crotoxin purified from C. vegrandis crude venom obtained from LatoxanTM (Portes-lès-Valence, France) was measured colorimetrically, as previously described [32,33]. The compound 4N3OBA (Merck, Darmstadt, Germany), used as substrate, was dissolved at a concentration of 50 mg/mL in chloroform. Aliquots of 80 µL (4 mg 4N3OBA) were evaporated under vacuum to remove chloroform and stored at −20 °C until use. The substrate was resuspended in 1 mL of assay buffer (10 mM Tris/HCl, 10 mM CaCl2 or BaCl2, 100 mM NaCl, pH 7.8), vortexed, centrifuged (2000× g, 2 min), and the supernatant was separated and used as a cleared substrate solution. The different concentrations of CB used for the assay were prepared in 10 µL aliquots and added to 190 µL of substrate solution placed in a 96-well plate, incubated for 40 min at 37 °C, and the absorbance at 425 nm was measured in a Tecan infiniteTM M1000 Pro plate reader. The concentration of purified CB was calculated using a molecular mass of 14.2 kDa and an extinction coefficient of 32,190 cm−1 M−1 [63,64].

5.5. Cytotoxicity Assay of CB Purified from C. vegrandis

The colorimetric cytotoxicity LDH-CytoxTM assay (BioLegend, San Diego, CA, USA) was used to evaluate the cytotoxicity of the purified CB subunit of crotoxin from C. vegrandis crude venom (LatoxanTM, Portes-lès-Valence, France). Cytotoxicity was determined following the manufacturer’s instructions. Briefly, tsA201 cells were seeded in 10 cm dishes and grown in Dulbecco’s modified Eagle medium (DMEM, see below). The day of the assay, cells were harvested and resuspended in external solution (ES) used for whole cell recording containing 145 mM TEA-Cl, 10 mM BaCl2, 1 mM MgCl2, 10 mM HEPES, adjusted to pH 7.4 with TEA-OH, and transferred to a 96-well plate (12,500 cells per well). CB was added at different concentrations to the cell suspension and incubated for 90 min at 37 °C. After incubation, cytotoxicity of CB was determined by the absorbance measured at 490 nm as described in the cytotoxicity LDH-CytoxTM assay instruction manual in a Tecan infiniteTM M1000 Pro plate reader. The percentage of cytotoxicity is reported as the fraction between lysed cells by CB (CB) and a lysis buffer (B), with untreated cells (U) being subtracted from the corresponding absorbance values, as follows:
The average absorbance was calculated from three experiments with three replicates each.
C y t o t o x i c i t y % = C B U B U × 100

5.6. cDNA Constructs

The following constructs were used to transiently transfect tsA201 cells for whole-cell patch-clamp recordings. CaV2.2 (accession number: Q00975-1) fused to EGFP, CaV1.2 (accession number: P15381) fused to mNeonGreen, CaVβ4 (accession number: O00305-2) fused to mCherry and CaVβ2a (CaVβ2-N3, accession number: Q8VGC3-2) fused to mRFP. Fusion of the channel subunits to fluorescence proteins facilitates recognition of transfected cells.

5.7. Cell Culture and Transfection

tsA201 cells (Merck, Darmstadt, Germany) were grown at 37 °C with 5% CO2 in Dulbecco’s modified Eagle medium (DMEM) supplemented with 10% fetal bovine serum (Merck, Darmstadt, Germany) and penicillin/streptomycin. For patch-clamp recordings, tsA201 cells were transiently co-transfected with either CaV2.2-EGFP and CaVβ4-mCherry or CaV1.2-mNeonGreen and CaVβ2a-mRFP. Cells were seeded onto 50 mm dishes and transfected using the calcium phosphate method. Cells were split 24 h after transfection and incubated for 24 h more before recordings. For laser scanning confocal fluorescence microscopy, cells were seeded in poly-lysine-coated 18 mm glass coverslips 24 h before use.

5.8. Internalization Assay and Laser Scanning Confocal Fluorescence Microscopy

Internalization assay was performed on HeLa seeded onto 1.8 mm coverslips. Cells were incubated in cold Hank’s Balanced Salt Solution (HBSS) on ice for 30 min to inhibit endocytosis. Then the cell bathing solution was replaced by cold HBSS supplemented with 1 µM of purified CB, and the cells were incubated on ice for an additional 15 min to allow CB binding to the cell surface. Then, the cells were transferred to 37 °C to allow internalization of CB. All the following steps were performed at room temperature. After three washes with PBS, cells were fixed with 4% paraformaldehyde (Merck, Darmstadt, Germany) in PBS for 10 min and washed several times. Coverslips that were fixed directly after ice incubation with CB were taken as a control (time = 0). After fixation, cells were permeabilized with 0.5% Triton X-100 in PBS, blocked using a filtered 5% solution in PBS of normal goat serum, NGS (Merck, Darmstadt, Germany), and incubated for 60 min with anti-crotoxin antibody (Anti-South American/Mojave rattlesnake crotoxin antibody A10G, Hölzel, Köln, Germany) diluted 1:200 in blocking solution followed by incubation with antibody anti-GADPH (GAPDH (14C10) rabbit monoclonal antibody 2118, Cell signalling), diluted 1:100 in blocking solution. Cells were then washed five times with 0.1% Tween-20 in PBS and stained for 60 min with the corresponding secondary antibodies (goat anti-mouse IgG antibody coupled to Alexa FluorTM 488 and goat anti-rabbit IgG antibody coupled to Alexa FluorTM 647, Thermo Fisher Scientific, Dreieich, Germany), diluted 1:1000 and 1:1000 in blocking solution, respectively. After several washes with 0.1% Tween-20/PBS, the coverslips were mounted on glass slides using Immunoselect Antifading Mounting Medium DAPI (DianovaTM, Biozol, Germany) and stored at RT until use (usually the next day). Laser scanning confocal imaging was carried out on a Leica inverted confocal microscope using a 63×/1.4 NA oil immersion objective (Leica). To visualize Alexa FluorTM 488 fluorescence, cells were excited with a 488 nm argon laser, and the emitted light was monitored between 500 and 540 nm. Alexa FluorTM 647 was excited using a 633 nm laser, and emission was detected in the 640–700 nm range. Detection of DAPI was performed using a 405 nm laser, and emission was collected from 415 to 450. For presentation, images were exported and formatted using Fiji ImageJ v2.16.0/1.54p [65].

5.9. Electrophysiology

Whole-cell patch clamp recordings were performed using an EPC-10 amplifier and the PatchMaster software v2x73.4 (HEKA Elektronik). Barium ions (Ba2+) were used as the charge carrier for the study of CaV-mediated currents. The external solution (ES) contained 145 mM TEA-Cl, 10 mM BaCl2, 1 mM MgCl2, 10 mM HEPES and was adjusted to pH 7.4 with TEA-OH. The internal (pipette) solution contained 130 mM CsCl, 5 mM TEA-Cl, 10 mM HEPES, 10 mM EGTA, 2 mM Mg-ATP, 0.2 mM Na-GTP and was adjusted to pH 7.4 with CsOH. Glass pipettes with resistances of 1–2 MΩ were pulled on a Sutter P-1000 puller (Harvard Apparatus) and polished with a glowing filament using a Narishige MF-830 microforge. Data were analyzed with FitMaster v2x90.2 (HEKA) and Python version 3.8 using common libraries including NumPy v2.2.0, Pandas v2.2.3, matplotlib v3.10.0, SciPy v1.15.1, and Seaborn v0.13.2. The currents were leak subtracted, and series resistance compensation was applied. For toxin application, purified CB were diluted in the external solution, and the cells were detached from the bottom and moved to a perfusion stream containing the diluted toxin. Recordings were performed under continuous perfusion of the cell, either with ES or ES containing the venom fraction. All data are presented as the mean ± SEM.

5.10. Sample Preparation for Mass Spectrometry

CB containing gel bands from the captive individuals were excised, dehydrated, cut into small pieces, reduced in 20 mM dithiothreitol for 30 min at 56 °C, cooled to RT, and then alkylated with 10 mM iodoacetamide for 30 min in the dark. The Lataxan CB protein was dissolved and denatured in 6 m guanidine, buffered with 100 mM HEPES to pH 7.2, cysteine residues reduced with 10 mM DTT and alkylated with 30 mM IAA. All samples were digested with proteomics-grade trypsin, GluC and LysC at an enzyme: proteome ratio of 1:100 for 16 h at 37 °C. Peptides were desalted using home-made C18 STAGE tips [66], dried in a vacuum concentrator and reconstituted in 0.1% formic acid prior to LC/MS analysis.

5.11. LC/MS/MS and Data Analysis

LC–MS/MS analysis was performed with an UltiMate 3000 RSCL nano-HPLC system (Thermo Fisher Scientific, Dreieich, Germany) online coupled to an Impact II Q-TOF mass spectrometer (Bruker, Billerica, MA, USA) via a CaptiveSpray Ion Source boosted with an ACN-saturated nitrogen gas stream. An estimated 1 µg of desalted peptides was loaded on a µPAC reverse phase trap column (PharmaFluidics, Gent, Belgium ) and separated on a 50 cm µPAC reverse phase analytical column (PharmaFluidics, Gent, Belgium) operated at a column temperature of 40 °C. Peptides were eluted with a flow rate of 600 nL min−1 using a binary gradient from 2 to 30% eluent B (A: 0.1% formic acid in water, B: 0.1% formic acid in ACN) with 90 min effective separation time and a total runtime of 2 h per sample. Separated peptides were ionized using a CaptiveSpray nano-ESI source (Bruker) with the nitrogen gas saturated with ACN using a nanobooster (Bruker) and introduced to an Impact II high-resolution QqTOF mass spectrometer (Bruker) as described [67]. Mass spectrometry data were acquired with the Bruker HyStar Software (v5.1, Bruker) in line-mode in a mass range from 200 to 1750 m/z at an acquisition rate of 5 Hz. The 14 most intense ions were selected for fragmentation, with fragment spectra automatically acquired between 5 and 20 Hz depending on the precursor intensity. Selected precursors were excluded for the next 0.4 min unless signal to noise ratio improved 3-fold. Acquired tandem mass spectra were queried with MaxQuant v.2.4.2 [68] against a Serpentes database (release 04/2023). The fragments from the protease digestions were detected by MaxQuant v.2.4.2 using the default setting of a minimum of peptide length of seven amino acids, which provides the best balance between specificity and identification accuracy.

5.12. Mass Determination of Intact Protein

An Agilent HPLC-ESI-QTOF-MS system was used for mass determination of intact protein. The HPLC (Agilent 1260 Infinity series, Waldbronn Germany) system consisted of a binary pump system, an autosampler, a thermostatted column compartment and a 6250 accurate-mass QTOF-MS with an electrospray ionization (ESI) interface with a resolution of 20,000 (Agilent, Waldbronn, Germany). Chromatographic separation was performed on a ZORBAX Eclipse Plus C8 Rapid Resolution, 100 × 4.6 mm, 3.5 µm (Agilent, Waldbronn, Germany). Column temperature was kept at 50 °C. Flow rate was 700 μL/min. The mobile phase consisted of solvent A, which was 0 1% FA in water, and solvent B, which was 1% FA in ACN. Sample injection volume was 20 μL. At the beginning of the run was an isocratic step of 5% B (0–5 min) followed by an increase to 60% B within 20 min. Afterwards, the gradient increased rapidly within 0.5 min to 95% B and was held for cleaning with 95% B for 4.5 min. The gradient returned to 5% B within 0.1 min and equilibrated the system for 4 min. Detection was performed with the QTOF mass detector in the ESI positive ionization mode. The nebulizer pressure was set to 20 psi and the drying gas flow was set to 11 L/min. A fragmentation voltage of 215 V, a skimmer voltage of 68 V and an octopole voltage of 750 V were used. The mass range was set to m/z 500–3200 and the data acquisition rate was two spectra. Source temperature was set to 300 °C. MassHunter software LC–MS Data Acquisition vB.05.01 (Agilent Technologies, Santa Clara, CA, USA) was used to control the instrument and data acquisition.

Author Contributions

Conceptualization, P.H., E.M.-L. and M.E.; methodology, M.E., F.C. and N.J.; formal analysis, M.E., F.C. and B.S.-S.; investigation, M.E., F.C., N.J., E.M.-L. and B.S.-S.; data curation, M.E., E.M.-L. and B.S.-S.; writing—original draft preparation, P.H.; writing—review and editing, P.H., M.E., E.M.-L., F.C. and B.S.-S. Supervision, P.H. and E.M.-L. All authors have read and agreed to the published version of the manuscript.

Funding

This research received no external funding.

Institutional Review Board Statement

Not applicable.

Informed Consent Statement

Not applicable.

Data Availability Statement

The data presented in this study are openly available in a publicly accessible repository at https://jugit.fz-juelich.de/HidalgoPatricia/crotoxin_cb_cav, accessed on 15 October 2025. Raw mass spectrometry and search data have been deposited to the ProteomeXchange Consortium via the PRIDE partner repository with the dataset identifier PXD070916 [69,70].

Acknowledgments

We thank Victor Lugo for his support with the analysis of the electrophysiological data and Christoph Aretzweiler von Schwartzenberg for his assistance with the confocal fluorescence microscopy imaging.

Conflicts of Interest

The authors declare no conflicts of interest.

References

  1. Viala, V.L.; Hildebrand, D.; Fucase, T.M.; Sciani, J.M.; Prezotto-Neto, J.P.; Riedner, M.; Sanches, L.; Nishimura, P.J.; Oguiura, N.; Pimenta, D.C.; et al. Spencer, Proteomic analysis of the rare Uracoan rattlesnake Crotalus vegrandis venom: Evidence of a broad arsenal of toxins. Toxicon 2015, 107, 234–251. [Google Scholar] [CrossRef] [PubMed]
  2. Aguilar, I.; E Girón, M.; Rodríguez-Acosta, A. Purification and characterisation of a haemorrhagic fraction from the venom of the Uracoan rattlesnake Crotalus vegrandis. Biochim. Biophys. Acta 2001, 1548, 57–65. [Google Scholar] [CrossRef] [PubMed]
  3. CBon, C.; Bouchier, V.; Choumet, G.; Faure, M.S.; Jiang, M.P.; Lambezat, F.; Radvanyi, B. Saliou, Crotoxin, half-century of investigations on a phospholipase A2 neurotoxin. Acta Physiol. Pharmacol. Latinoam. 1989, 39, 439–448. [Google Scholar]
  4. Kaiser, I.I.; SD Aird, A. crotoxin homolog from the venom of the Uracoan rattlesnake (Crotalus vegrandis). Toxicon 1987, 25, 1113–1120. [Google Scholar] [CrossRef]
  5. Sampaio, S.C.; Hyslop, S.; Fontes, M.R.; Prado-Franceschi, J.; Zambelli, V.O.; Magro, A.J.; Brigatte, P.; Gutierrez, V.P.; Cury, Y. Crotoxin: Novel activities for a classic beta-neurotoxin. Toxicon 2010, 55, 1045–1060. [Google Scholar] [CrossRef]
  6. Faure, G.; Porowinska, D.; Saul, F. Crotoxin from Crotalus durissus terrificus and Crotoxin-Related Proteins: Structure and Function Relationship. In Toxins and Drug Discovery; Toxinology; Springer: Dordrecht, The Netherlands, 2016. [Google Scholar]
  7. Delot, E.; Bon, C. Model for the interaction of crotoxin, a phospholipase A2 neurotoxin, with presynaptic membranes. Biochemistry 1993, 32, 10708–10713. [Google Scholar] [CrossRef]
  8. Faure, G.; Harvey, A.L.; Thomson, E.; Saliou, B.; Radvanyi, F.; Bon, C. Comparison of crotoxin isoforms reveals that stability of the complex plays a major role in its pharmacological action. Eur. J. Biochem. 1993, 214, 491–496. [Google Scholar] [CrossRef]
  9. Soares, A.M.; Mancin, A.C.; Cecchini, A.L.; Arantes, E.C.; França, S.C.; Gutiérrez, J.M.; Giglio, J.R. Effects of chemical modifications of crotoxin B, the phospholipase A(2) subunit of crotoxin from Crotalus durissus terrificus snake venom, on its enzymatic and pharmacological activities. Int. J. Biochem. Cell Biol. 2001, 33, 877–888. [Google Scholar] [CrossRef]
  10. Gutiérrez, J.M.; Lomonte, B. Phospholipases A2: Unveiling the secrets of a functionally versatile group of snake venom toxins. Toxicon 2013, 62, 27–39. [Google Scholar] [CrossRef]
  11. Marchi-Salvador, D.P.; Corrêa, L.C.; Magro, A.J.; Oliveira, C.Z.; Soares, A.M.; Fontes, M.R.M. Insights into the role of oligomeric state on the biological activities of crotoxin: Crystal structure of a tetrameric phospholipase A2 formed by two isoforms of crotoxin B from Crotalus durissus terrificus venom. Proteins 2008, 72, 883–891. [Google Scholar] [CrossRef]
  12. Nemecz, D.; Ostrowski, M.; Ravatin, M.; Saul, F.; Faure, G. Crystal Structure of Isoform CBd of the Basic Phospholipase A(2) Subunit of Crotoxin: Description of the Structural Framework of CB for Interaction with Protein Targets. Molecules 2020, 25, 5290. [Google Scholar] [CrossRef] [PubMed]
  13. Radvanyi, F.; Keil, A.; Saliou, B.; Lembezat, M.-P.; Bon, C. Binding of divalent and trivalent cations with crotoxin and with its phospholipase and its non-catalytic subunits: Effects on enzymatic activity and on the interaction of phospholipase component with phospholipids. Biochim. Biophys. Acta 1989, 1006, 183–192. [Google Scholar] [CrossRef]
  14. Gimenez, B.T.; Cezarette, G.N.; Bomfim, A.d.S.; Monteiro, W.M.; Russo, E.M.d.S.; Frantz, F.G.; Sampaio, S.V.; Sartim, M.A. Role of crotoxin in coagulation: Novel insights into anticoagulant mechanisms and impairment of inflammation-induced coagulation. J. Venom. Anim. Toxins Incl. Trop. Dis. 2020, 26, e20200076. [Google Scholar] [CrossRef] [PubMed]
  15. Kini, R.M. Excitement ahead: Structure, function and mechanism of snake venom phospholipase A2 enzymes. Toxicon 2003, 42, 827–840. [Google Scholar] [CrossRef] [PubMed]
  16. Rangel-Santos, A.; Dos-Santos, E.; Lopes-Ferreira, M.; Lima, C.; Cardoso, D.; Mota, I. A comparative study of biological activities of crotoxin and CB fraction of venoms from Crotalus durissus terrificus, Crotalus durissus cascavella and Crotalus durissus collilineatus. Toxicon 2004, 43, 801–810. [Google Scholar] [CrossRef]
  17. Kini, R.; Evans, H.J. A model to explain the pharmacological effects of snake venom phospholipases A2. Toxicon 1989, 27, 613–635. [Google Scholar] [CrossRef]
  18. da Silva Lomeo, R.; de Faria Gonçalves, A.P.; da Silva, C.N.; de Paula, A.T.; Santos, D.O.C.; Fortes-Dias, C.L.; Gomes, D.A.; de Lima, M.E. Crotoxin from Crotalus durissus terrificus snake venom induces the release of glutamate from cerebrocortical synaptosomes via N and P/Q calcium channels. Toxicon 2014, 85, 5–16. [Google Scholar] [CrossRef]
  19. Cavalcante, W.L.; Noronha-Matos, J.B.; Timóteo, M.A.; Fontes, M.R.; Gallacci, M.; Correia-De-Sá, P. Neuromuscular paralysis by the basic phospholipase A(2) subunit of crotoxin from Crotalus durissus terrificus snake venom needs its acid chaperone to concurrently inhibit acetylcholine release and produce muscle blockage. Toxicol. Appl. Pharmacol. 2017, 334, 8–17. [Google Scholar] [CrossRef]
  20. Neely, A.; Hidalgo, P. Structure-function of proteins interacting with the α1 pore-forming subunit of high-voltage-activated calcium channels. Front. Physiol. 2014, 5, 209. [Google Scholar] [CrossRef]
  21. Müller, C.S.; Haupt, A.; Bildl, W.; Schindler, J.; Knaus, H.-G.; Meissner, M.; Rammner, B.; Striessnig, J.; Flockerzi, V.; Fakler, B.; et al. Quantitative proteomics of the CaV2 channel nano-environments in the mammalian brain. Proc. Natl. Acad. Sci. USA 2010, 107, 14950–14957. [Google Scholar] [CrossRef]
  22. Hofmann, F.; Belkacemi, A.; Flockerzi, V. Emerging alternative functions for the auxiliary subunits of the voltage-gated calcium channels. Curr. Mol. Pharmacol. 2015, 8, 162–168. [Google Scholar] [CrossRef]
  23. Dolphin, A.C.; Lee, A. Presynaptic calcium channels: Specialized control of synaptic neurotransmitter release. Nat. Rev. Neurosci. 2020, 21, 213–229. [Google Scholar] [CrossRef] [PubMed]
  24. Nanou, E.; Catterall, W.A. Calcium Channels, Synaptic Plasticity, and Neuropsychiatric Disease. Neuron 2018, 98, 466–481. [Google Scholar] [CrossRef] [PubMed]
  25. Dolmetsch, R.E.; Pajvani, U.; Fife, K.; Spotts, J.M.; Greenberg, M.E. Signaling to the nucleus by an L-type calcium channel-calmodulin complex through the MAP kinase pathway. Science 2001, 294, 333–339. [Google Scholar] [CrossRef] [PubMed]
  26. Bodi, I.; Mikala, G.; Koch, S.E.; Akhter, S.A.; Schwartz, A. The L-type calcium channel in the heart: The beat goes on. J. Clin. Investig. 2005, 115, 3306–3317. [Google Scholar] [CrossRef]
  27. Francischetti, I.M.; Gombarovits, M.E.; Valenzuela, J.G.; Carlini, C.R.; A Guimarães, J. Intraspecific variation in the venoms of the South American rattlesnake (Crotalus durissus terrificus). Comp. Biochem. Physiol. C Toxicol. Pharmacol. 2000, 127, 23–36. [Google Scholar] [CrossRef]
  28. Hatakeyama, D.M.; Tasima, L.J.; Galizio, N.d.C.; Serino-Silva, C.; Rodrigues, C.F.B.; Stuginski, D.R.; Sant’Anna, S.S.; Grego, K.F.; Tashima, A.K.; Nishiduka, E.S.; et al. From birth to adulthood: An analysis of the Brazilian lancehead (Bothrops moojeni) venom at different life stages. PLoS ONE 2021, 16, e0253050. [Google Scholar] [CrossRef]
  29. Amorim, F.G.; Costa, T.R.; Baiwir, D.; De Pauw, E.; Quinton, L.; Sampaio, S.V. Proteopeptidomic, Functional and Immunoreactivity Characterization of Bothrops moojeni Snake Venom: Influence of Snake Gender on Venom Composition. Toxins 2018, 10, 177. [Google Scholar] [CrossRef]
  30. Hogan, M.P.; Holding, M.L.; Nystrom, G.S.; Colston, T.J.; Bartlett, D.A.; Mason, A.J.; Ellsworth, S.A.; Rautsaw, R.M.; Lawrence, K.C.; Strickland, J.L.; et al. The genetic regulatory architecture and epigenomic basis for age-related changes in rattlesnake venom. Proc. Natl. Acad. Sci. USA 2024, 121, e2313440121. [Google Scholar] [CrossRef]
  31. Chen, Y.-H.; Wang, Y.-M.; Hseu, M.-J.; Tsai, I.-H. Molecular evolution and structure-function relationships of crotoxin-like and asparagine-6-containing phospholipases A2 in pit viper venoms. Biochem. J. 2004, 381, 25–34. [Google Scholar] [CrossRef]
  32. Petrovic, N.; Grove, C.; Langton, P.E.; Misso, N.L.; Thompson, P.J. A simple assay for a human serum phospholipase A2 that is associated with high-density lipoproteins. J. Lipid Res. 2001, 42, 1706–1713. [Google Scholar] [CrossRef] [PubMed]
  33. Almeida, T.C.; Giannotti, K.C.; Silva, L.M.R.; Marques-Porto, R.; DeOcesano-Pereira, C.; Camargo, L.; Chudzinski-Tavassi, A.M.; Reid, P.; Picolo, G. Crotoxin induces cytotoxic effects in human malignant melanoma cells in both native and detoxified forms. Front. Pharmacol. 2024, 15, 1425446. [Google Scholar] [CrossRef] [PubMed]
  34. Šribar, J.; CóPič, A.; Pariš, A.; Sherman, N.E.; Gubenšek, F.; Fox, J.W.; KrizaJ, I. A high affinity acceptor for phospholipase A2 with neurotoxic activity is a calmodulin. J. Biol. Chem. 2001, 276, 12493–12496. [Google Scholar] [CrossRef] [PubMed]
  35. Ollivier-Bousquet, M.; Radvanyi, F.; Bon, C. Crotoxin, a phospholipase A2 neurotoxin from snake venom, interacts with epithelial mammary cells, is internalized and induces secretion. Mol. Cell. Endocrinol. 1991, 82, 41–50. [Google Scholar] [CrossRef]
  36. Hofmann, F.; Flockerzi, V.; Kahl, S.; Wegener, J.W. L-type CaV1.2 calcium channels: From in vitro findings to in vivo function. Physiol. Rev. 2014, 94, 303–326. [Google Scholar] [CrossRef]
  37. Neri-Castro, E.; Bénard-Valle, M.; Paniagua, D.; Boyer, L.V.; Possani, L.D.; López-Casillas, F.; Olvera, A.; Romero, C.; Zamudio, F.; Alagón, A. Neotropical Rattlesnake (Crotalus simus) Venom Pharmacokinetics in Lymph and Blood Using an Ovine Model. Toxins 2020, 12, 455. [Google Scholar] [CrossRef]
  38. Barral-Netto, M.; von Sohsten, R. Serum kinetics of crotoxin from Crotalus durissus terrificus venom in mice: Evidence for a rapid clearance. Toxicon 1991, 29, 527–531. [Google Scholar] [CrossRef][Green Version]
  39. Moreira, E.G.; Nascimento, N.; Rogero, J.R.; Vassilieff, V.S. Gabaergic-benzodiazepine system is involved in the crotoxin-induced anxiogenic effect. Pharmacol. Biochem. Behav. 2000, 65, 7–13. [Google Scholar] [CrossRef]
  40. Wolz-Richter, S.; Esser, K.-H.; Hess, A. Antinociceptive activity of crotoxin in the central nervous system: A functional Magnetic Resonance Imaging study. Toxicon 2013, 74, 44–55. [Google Scholar] [CrossRef]
  41. Degn, L.; Seebart, C.; Kaiser, I. Specific binding of crotoxin to brain synaptosomes and synaptosomal membranes. Toxicon 1991, 29, 973–988. [Google Scholar] [CrossRef]
  42. Bourinet, E.; Zamponi, G.W. Block of voltage-gated calcium channels by peptide toxins. Neuropharmacology 2017, 127, 109–115. [Google Scholar] [CrossRef]
  43. Stocker, J.W.; Nadasdi, L.; Aldrich, R.W.; Tsien, R.W. Preferential interaction of omega-conotoxins with inactivated N-type Ca2+ channels. J. Neurosci. Off. J. Soc. Neurosci. 1997, 17, 3002–3013. [Google Scholar] [CrossRef] [PubMed]
  44. Kutzsche, J.; Guzman, G.A.; Willuweit, A.; Kletke, O.; Wollert, E.; Gering, I.; Jürgens, D.; Breitkreutz, J.; Stark, H.; Beck-Sickinger, A.G.; et al. An orally available Ca(v)2.2 calcium channel inhibitor for the treatment of neuropathic pain. Br. J. Pharmacol. 2024, 181, 1734–1756. [Google Scholar] [CrossRef] [PubMed]
  45. Hseu, M.-J.; Yen, C.-H.; Tzeng, M.-C. Crocalbin: A new calcium-binding protein that is also a binding protein for crotoxin, a neurotoxic phospholipase A2. FEBS Lett. 1999, 445, 440–444. [Google Scholar] [CrossRef] [PubMed][Green Version]
  46. Zhang, P.; Lader, A.S.; Etcheverry, M.A.; Cantiello, H.F. Crotoxin potentiates L-type calcium currents and modulates the action potential of neonatal rat cardiomyocytes. Toxicon 2010, 55, 1236–1243. [Google Scholar] [CrossRef]
  47. Yang, L.; Katchman, A.; Kushner, J.; Kushnir, A.; Zakharov, S.I.; Chen, B.X.; Shuja, Z.; Subramanyam, P.; Liu, G.; Shuja, P.; et al. Cardiac CaV1.2 channels require β subunits for β-adrenergic-mediated modulation but not trafficking. J. Clin. Investig. 2019, 129, 647–658. [Google Scholar] [CrossRef]
  48. Catterall, W. Regulation of Cardiac Calcium Channels in the Fight-or-Flight Response. Curr. Mol. Pharmacol. 2015, 8, 12–21. [Google Scholar] [CrossRef]
  49. Hovey, L.; El-Din, T.M.G.; Catterall, W.A. Convergent regulation of Ca(V)1.2 channels by direct phosphorylation and by the small GTPase RAD in the cardiac fight-or-flight response. Proc. Natl. Acad. Sci. USA 2022, 119, e2208533119. [Google Scholar] [CrossRef]
  50. Liu, Z.; Vogel, H.J. Structural basis for the regulation of L-type voltage-gated calcium channels: Interactions between the N-terminal cytoplasmic domain and Ca(2+)-calmodulin. Front. Mol. Neurosci. 2012, 5, 38. [Google Scholar] [CrossRef]
  51. Ben-Johny, M.; Yue, D.T. Calmodulin regulation (calmodulation) of voltage-gated calcium channels. J. Gen. Physiol. 2014, 143, 679–692. [Google Scholar] [CrossRef]
  52. Bon, C.; Changeux, J.; Jeng, T.; Fraenkel-Conrat, H. Postsynaptic effects of crotoxin and of its isolated subunits. Eur. J. Biochem. 1979, 99, 471–481. [Google Scholar] [CrossRef]
  53. Ostrowski, M.; Porowinska, D.; Prochnicki, T.; Prevost, M.; Raynal, B.; Baron, B.; Sauguet, L.; Corringer, P.-J.; Faure, G. Neurotoxic phospholipase A2 from rattlesnake as a new ligand and new regulator of prokaryotic receptor GLIC (proton-gated ion channel from G. violaceus). Toxicon 2016, 116, 63–71. [Google Scholar] [CrossRef] [PubMed]
  54. Faure, G.; Bakouh, N.; Lourdel, S.; Odolczyk, N.; Premchandar, A.; Servel, N.; Hatton, A.; Ostrowski, M.K.; Xu, H.; Saul, F.A.; et al. Rattlesnake Phospholipase A2 Increases CFTR-Chloride Channel Current and Corrects ∆F508CFTR Dysfunction: Impact in Cystic Fibrosis. J. Mol. Biol. 2016, 428, 2898–2915. [Google Scholar] [CrossRef]
  55. Alves, V.S.; Alves-Silva, H.S.; Orts, D.J.; Ribeiro-Silva, L.; Arcisio-Miranda, M.; Oliveira, F.A. Calcium Signaling in Neurons and Glial Cells: Role of Cav1 channels. Neuroscience 2019, 421, 95–111. [Google Scholar] [CrossRef] [PubMed]
  56. Moosmang, S.; Haider, N.; Klugbauer, N.; Adelsberger, H.; Langwieser, N.; Müller, J.; Stiess, M.; Marais, E.; Schulla, V.; Lacinova, L.; et al. Role of hippocampal Cav1.2 Ca2+ channels in NMDA receptor-independent synaptic plasticity and spatial memory. J. Neurosci. Off. J. Soc. Neurosci. 2005, 25, 9883–9892. [Google Scholar] [CrossRef] [PubMed]
  57. Zamponi, G.W.; Striessnig, J.; Koschak, A.; Dolphin, A.C. The Physiology, Pathology, and Pharmacology of Voltage-Gated Calcium Channels and Their Future Therapeutic Potential. Pharmacol. Rev. 2015, 67, 821–870. [Google Scholar] [CrossRef]
  58. Tzeng, M.-C.; Yen, C.-H.; Hseu, M.-J.; Tseng, C.-C.; Tsai, M.-D.; Dupureur, C.M. Binding proteins on synaptic membranes for crotoxin and taipoxin, two phospholipases A2 with neurotoxicity. Toxicon 1995, 33, 451–457. [Google Scholar] [CrossRef]
  59. Montecucco, C.; Gutiérrez, J.M.; Lomonte, B. Cellular pathology induced by snake venom phospholipase A2 myotoxins and neurotoxins: Common aspects of their mechanisms of action. Cell. Mol. Life Sci. CMLS 2008, 65, 2897–2912. [Google Scholar] [CrossRef]
  60. Radvanyi, F.; Saliou, B.; Lembezat, M.; Bon, C. Binding of crotoxin, a presynaptic phospholipase A2 neurotoxin, to negatively charged phospholipid vesicles. J. Neurochem. 1989, 53, 1252–1260. [Google Scholar] [CrossRef]
  61. Klauber, L.M. A new species of rattlesnake from venezuela. Trans. San Diego Soc. Nat. Hist. 1941, IX, 333–336. [Google Scholar]
  62. Meng, J.; John, T.R.; Kaiser, II. Specificity and binding affinity of an anti-crotoxin combinatorial antibody selected from a phage-displayed library. Biochem. Pharmacol. 1995, 50, 1969–1977. [Google Scholar] [PubMed]
  63. Faure, G.; Choumet, V.; Bouchier, C.; Camoin, L.; Guillaume, J.; Monegier, B.; Vuilhorgne, M.; Bon, C. The origin of the diversity of crotoxin isoforms in the venom of Crotalus durissus terrificus. Eur. J. Biochem. 1994, 223, 161–164. [Google Scholar] [CrossRef] [PubMed]
  64. Fernandes, C.A.H.; Pazin, W.M.; Dreyer, T.R.; Bicev, R.N.; Cavalcante, W.L.G.; Fortes-Dias, C.L.; Ito, A.S.; Oliveira, C.L.P.; Fernandez, R.M.; Fontes, M.R.M. Biophysical studies suggest a new structural arrangement of crotoxin and provide insights into its toxic mechanism. Sci. Rep. 2017, 7, 43885. [Google Scholar] [CrossRef]
  65. Schindelin, J.; Arganda-Carreras, I.; Frise, E.; Kaynig, V.; Longair, M.; Pietzsch, T.; Preibisch, S.; Rueden, C.; Saalfeld, S.; Schmid, B.; et al. Fiji: An open-source platform for biological-image analysis. Nat. Methods 2012, 9, 676–682. [Google Scholar] [CrossRef] [PubMed]
  66. Rappsilber, J.; Mann, M.; Ishihama, Y. Protocol for micro-purification, enrichment, pre-fractionation and storage of peptides for proteomics using StageTips. Nat. Protoc. 2007, 2, 1896–1906. [Google Scholar] [CrossRef]
  67. Beck, S.; Michalski, A.; Raether, O.; Lubeck, M.; Kaspar, S.; Goedecke, N.; Baessmann, C.; Hornburg, D.; Meier, F.; Paron, I.; et al. The Impact II, a Very High-Resolution Quadrupole Time-of-Flight Instrument (QTOF) for Deep Shotgun Proteomics. Mol. Cell. Proteom. MCP 2015, 14, 2014–2029. [Google Scholar] [CrossRef]
  68. Tyanova, S.; Temu, T.; Cox, J. The MaxQuant computational platform for mass spectrometry-based shotgun proteomics. Nat. Protoc. 2016, 11, 2301–2319. [Google Scholar] [CrossRef]
  69. Perez-Riverol, Y.; Bandla, C.; Kundu, D.J.; Kamatchinathan, S.; Bai, J.; Hewapathirana, S.; John, N.S.; Prakash, A.; Walzer, M.; Wang, S.; et al. The PRIDE database at 20 years: 2025 update. Nucleic Acids. Res. 2025, 53, D543–D553. [Google Scholar] [CrossRef]
  70. Deutsch, E.W.; Bandeira, N.; Perez-Riverol, Y.; Sharma, V.; Carver, J.J.; Mendoza, L.; Kundu, D.J.; Wang, S.; Bandla, C.; Kamatchinathan, S.; et al. The ProteomeXchange consortium at 10 years: 2023 update. Nucleic Acids Res. 2023, 51, D1539–D1548. [Google Scholar] [CrossRef]
Figure 1. Purification of the basic subunit (CB) of CrTx from C. vegrandis crude venom extract. (A) Scheme of the strategy used to purify CB from the C. vegrandis crude venom extract obtained. The crude extract of C. vegrandis venom (obtained from LatoxanTM) was reconstituted in 100 mM ammonium acetate, pH 6.8, and subjected to size-exclusion chromatography (SEC) followed by cation exchange chromatography (CEX) and mass spectrometry analysis of the purified protein. (B) Elution profile from SEC (120 mL bed-volume Superdex 75 16/60) of the whole venom extract with the corresponding reducing SDS-PAGE gels of the indicated fractions. (C) Elution profile from CEX column of fractions underlying P2 (labelled in grey in panel B). CEX elution was performed with a linear NaCl gradient (red line in the CEX chromatogram). (D) Analytical SEC column (24 mL bed-volume Superdex 75 10/30) elution profile of the purified CB subunit with the corresponding reducing SDS-PAGE gel and the Western blot (WB) analysis detected with an antibody anti-CB subunit of crotoxin from C. durissus terrificus. In all gels, the numbers denote the size of molecular weight standards (MW).
Toxins 18 00036 g001
Figure 2. Mass spectrometry analysis of crotoxin CB subunit from C. vegrandis. (A) Alignment of the amino acid sequence of the crotoxin CB subunit from C. durissus terrificus (C. dur. ter.) (UniProt accession number P62022) and the cleavage peptides derived from the CB subunit from C. vegrandis (CB C. veg.) identified by mass spectrometry after digestion with Trypsin (Tryp), GluC, and LysC proteases. The asterisks denote identity between the amino acids of the peptide fragments identified by mass spectrometry after cleavage of CB C. veg. and CB C. dur. ter. sequence. The four consecutive amino acids (95–98) were not identified by the MaxQuant software (version 2.4.2.0). The dashes correspond to amino acids that were not identified after cleavage with the indicated protease. The eight variable residues among the four natural CB isoforms are labelled in red with the CBc-specific proline enclosed in a rectangle. (B) Mass determination of CB C. veg showing its ESI-MS spectra (upper panel) and deconvoluted mass spectrum (bottom panel). The chromatography profile of CB C. veg. on C8 reversed-phase chromatography is shown in the inset.
Toxins 18 00036 g002
Figure 3. Comparison of the crude venom composition from female, male and juvenile C. vegrandis. (A) SEC elution profile of the crude venom sample collected from a female specimen and SDS-PAGE gel of the indicated peak fractions eluted from the Superdex-75 column (120 mL bed volume). (B) SEC elution profile and SDS-PAGE gel of the indicated peak fractions from the crude venom sample collected from a male specimen. (C) SEC elution profile and SDS-PAGE gel of the indicated peak fractions from the crude venom sample collected from juvenile specimens. (D) Overlay of the SEC chromatograms of the three indicated samples normalized to the maximum peak amplitude. The protein band migrating at ~15 kDa contained in peak 4 in all samples (denoted with a red arrow in each gel) was excised and subjected to mass spectrometry analysis. In all gels, the numbers denote the size of molecular weight standards (MW). (E) Alignment of the amino acid sequence of the crotoxin CB subunit from C. durissus terrificus (C. dur. ter.) (UniProt accession number P62022) and the tryptic peptides obtained from the mass spectrometry analysis from the female, male and juvenile samples from C. vegrandis (C. veg.).
Toxins 18 00036 g003
Figure 4. Purified CB from C. vegrandis exhibits Ca2+-dependent phospholipase A2 (PLA2) enzymatic activity. Graph of the PLA2 activity colorimetrically measured at 425 nm at the indicated CB concentrations before (left) and after heat denaturation (right), and either in the presence of Ca2+ or Ba2+. Each data point in the graph represents the average absorbance value at 425 nm from one experiment with three replicates. Each experiment was repeated three times. Statistical comparison between samples was performed using Welch’s t-test; *** (p < 0.001).
Toxins 18 00036 g004
Figure 5. Toxicity of purified CB to tsA201 cells bathed in extracellular solution containing either Ca2+ or Ba2+. (A) Graph of the cytotoxic effect, measured colorimetrically by means of lactate dehydrogenase (LDH) activity, versus concentration of purified CB after 90 min incubation of the cells in either Ca2+- or Ba2+-containing extracellular solution. (B) Cytotoxicity of heat-denatured CB, at the indicated concentrations, to cells bathed in Ca2+- or Ba2+-containing extracellular solution. Each dot in the graph corresponds to the average percent cytotoxicity (see Materials and Methods) from one experiment with three replicates. Each experiment was repeated three times. Statistical comparison between samples was performed using Welch’s t-test; * (p < 0.05), ** (p < 0.01), *** (p < 0.001) and ns, not significant.
Toxins 18 00036 g005
Figure 6. Crotoxin B purified from C. vegrandis is internalized in HeLa cells. (A) Schematic of the experimental design for crotoxin B (CB) internalization assay. Cells were incubated on ice for 30 min, exposed to CB and incubated on ice for an additional 15 min. Then cells were transferred to 37 °C for 15 min to allow CB internalization (t = 15 min). Time zero (t = 0 min) was taken before the transfer of cells to 37 °C. After several washes, cells were fixed and fluorescently stained for CB, intracellular GADPH and DAPI nuclei marker. (B) Laser scanning confocal images of representative HeLa cells stained for CB (green), GADPH (magenta), and DAPI (blue) at t = 0 and t = 15 min (after exposure to CB at 37 °C). Each image is shown with an enlarged view of the marked square region. Scale bar, 15 µm. (C) Graph of the CB intracellular fluorescence intensity normalized to the average intensity measured at t = 0. The number of cells measured at t = 0 and t = 15 min was 13 and 22, respectively. Statistical comparison between samples was performed using Welch’s t-test; *** (p < 0.001).
Toxins 18 00036 g006
Figure 7. Time course of CaV2.2 channel inhibition by CB purified from C. vegrandis and its recovery. (A) Average time course of inhibition of CaV2.2-mediated currents by 10 µM of CB and representative ionic current traces elicited by the one voltage pulse, shown above the traces, to +10 mV from a holding potential of −80 mV repetitively applied every 2 s, in the absence (black trace) and presence (red trace) of CB. The inset shows the time course of a representative CaV2.2-expressing cell perfused at time = 0 (denoted by an arrowhead) with 10 µM of CB. Data are presented as mean ± SEM; number of recorded cells = 14. (B) Concentration dependence of the steady-state CaV2.2-current inhibition (mean ± SEM) by CB at 0.4, 2.0 and 10.0 µM; number of recorded cells = 5, 6 and 9, respectively. (C) Representative current traces and time course of CaV2.2 channel block and its relief. CB blockade and its relief were monitored by recording the current response elicited by the one voltage step. The cell was subjected to continuous perfusion with control solution (Ctrl) containing 10 µM of CB (①). After achieving a steady-state blockade (②), the cell was moved to the control solution perfusion line to wash out the toxin (③). The inset shows the average time course of the relief from the block of CaV2.2 channels. Data are presented as mean ± SEM; number of recorded cells = 5. Ba2+ was used as the charge carrier.
Toxins 18 00036 g007
Figure 8. CB purified from C. vegrandis inhibits currents through CaV2.2 N-type calcium channel without altering the voltage dependence of activation of the channel. (A) Representative ionic current traces elicited by the voltage pulse protocol shown above, consisting of voltages from −40 to +60 mV in 5 mV increments from a holding potential of −80 mV, obtained from tsA201 cells expressing CaV2.2 channel before (black) and after (red) perfusion with 10 µM CB. (B) Plots of ionic current (I) versus voltage obtained from cells before (black data points) and after (red data points) exposure to 10 µM CB. (C) Plots of the fraction of activated channels versus voltage obtained from cells in panel (B). Ba2+ was used as the charge carrier. Data points represent mean ± SEM; number of recorded cells = 9.
Toxins 18 00036 g008
Figure 9. CB purified from C. vegrandis potently blocks CaV1.2 L-type calcium channels. (A) Average time course of inhibition of CaV1.2-mediated currents by 10 µM of CB and representative current traces elicited by the one voltage pulse (shown above the current traces) in the absence (black trace) and presence (red trace) of CB. The inset shows the time course of a representative cell expressing CaV1.2 channel complexes. Perfusion with 10 µM of CB started at time = 0. Data are presented as mean ± SEM; number of recorded cells = 14. (B) Graph of the inhibition of CaV1.2-mediated currents by 0.4, 2.0 and 10.0 µM of CB. Data are presented as mean ± SEM; number of recorded cells = 5 for each concentration. (C) Representative ionic current traces through CaV1.2 channel complexes before (black data points) and after (red data points) perfusion with 10 µM CB. The voltage pulse protocol is shown above the current traces. (D) Plots of ionic current and fraction of activated channels versus voltage for cells either exposed (red data points) or not (black data points) to 10 µM of CB. Ba2+ was used as the charge carrier. Data are presented as mean ± SEM; number of recorded cells = 5.
Toxins 18 00036 g009
Figure 10. Model for the action and biological outcome of CB purified from C. vegrandis. CB from C. vegrandis (represented in red) interacts directly with CaV channels assembled at the plasma membrane (PM). Calcium entry through CaV calcium channels result in a transient increase in the intracellular Ca2+ concentration (black arrow) that initiates several cellular events such as synaptic transmission, hormone secretion and muscle contraction. CB blocks CaV channels, preventing calcium influx into the cell and inhibiting Ca2+-signalling processes mediated by the channel (red X). The mechanism of CB internalization and interactions with intracellular targets are not yet fully understood.
Toxins 18 00036 g010
Disclaimer/Publisher’s Note: The statements, opinions and data contained in all publications are solely those of the individual author(s) and contributor(s) and not of MDPI and/or the editor(s). MDPI and/or the editor(s) disclaim responsibility for any injury to people or property resulting from any ideas, methods, instructions or products referred to in the content.