Survey of Microcystin-Producing Cyanobacteria in French Lakes of Various Trophic Status Using Environmental and Cyanobacterial Parameters and an Active Mussel Biomonitoring

 , , , and
Abstract
:
1. Introduction
2. Results
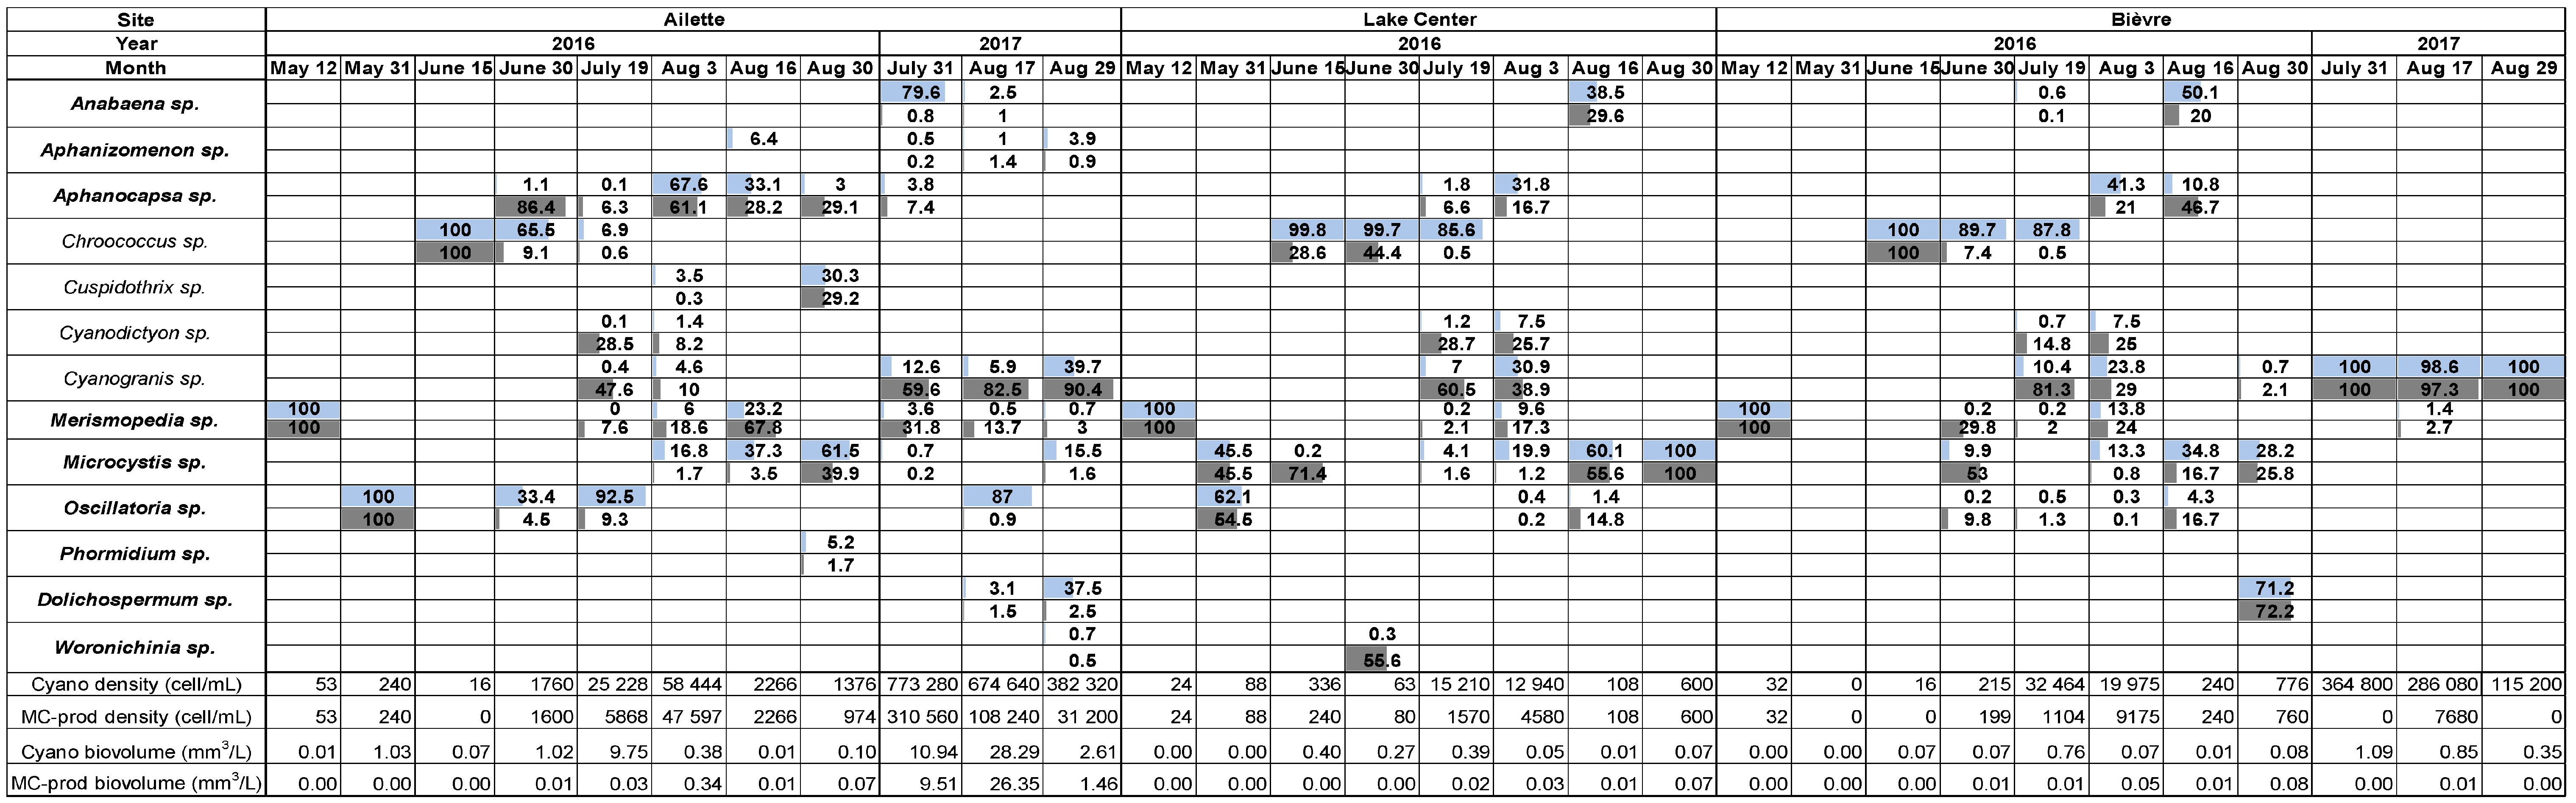
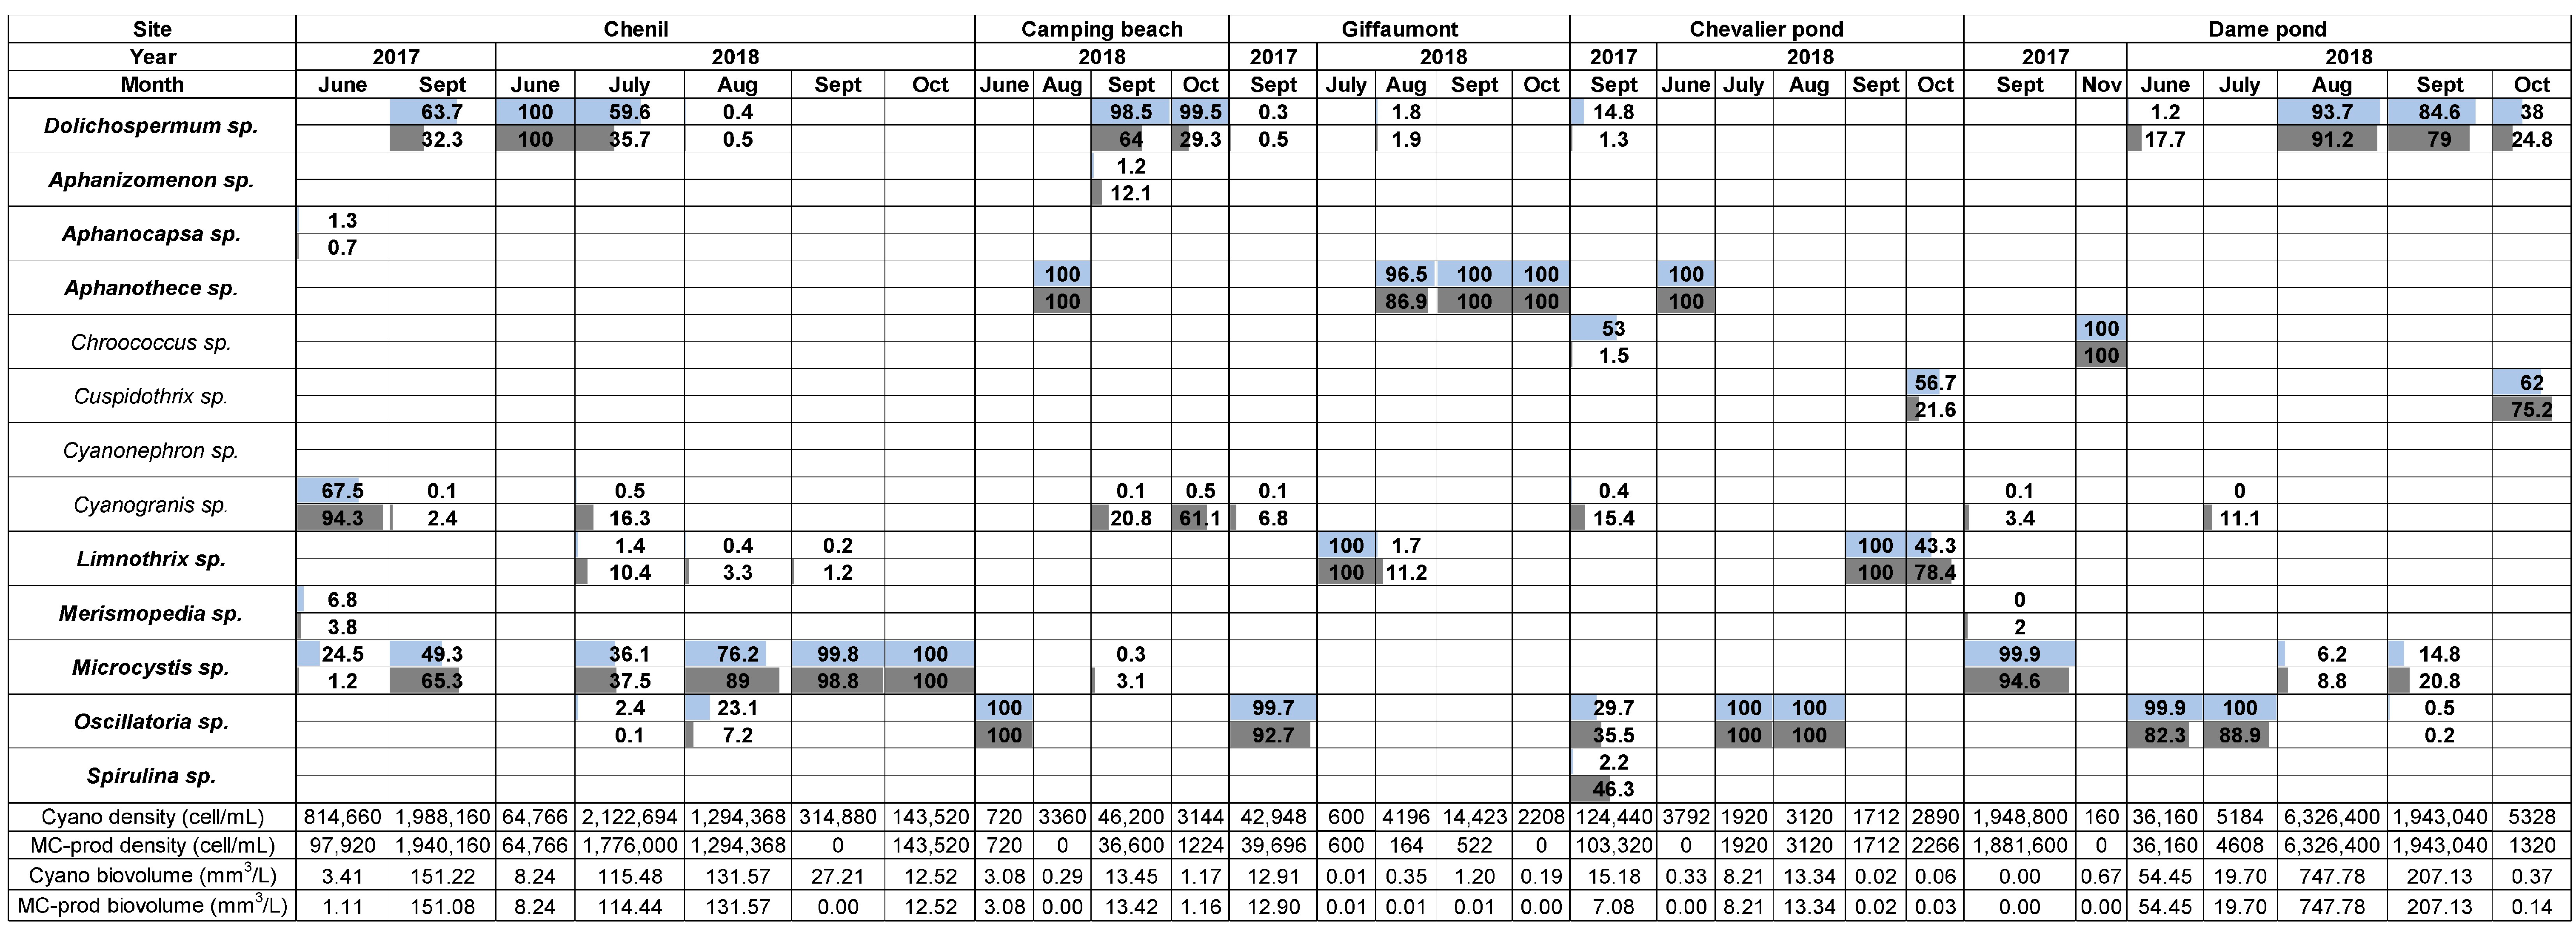
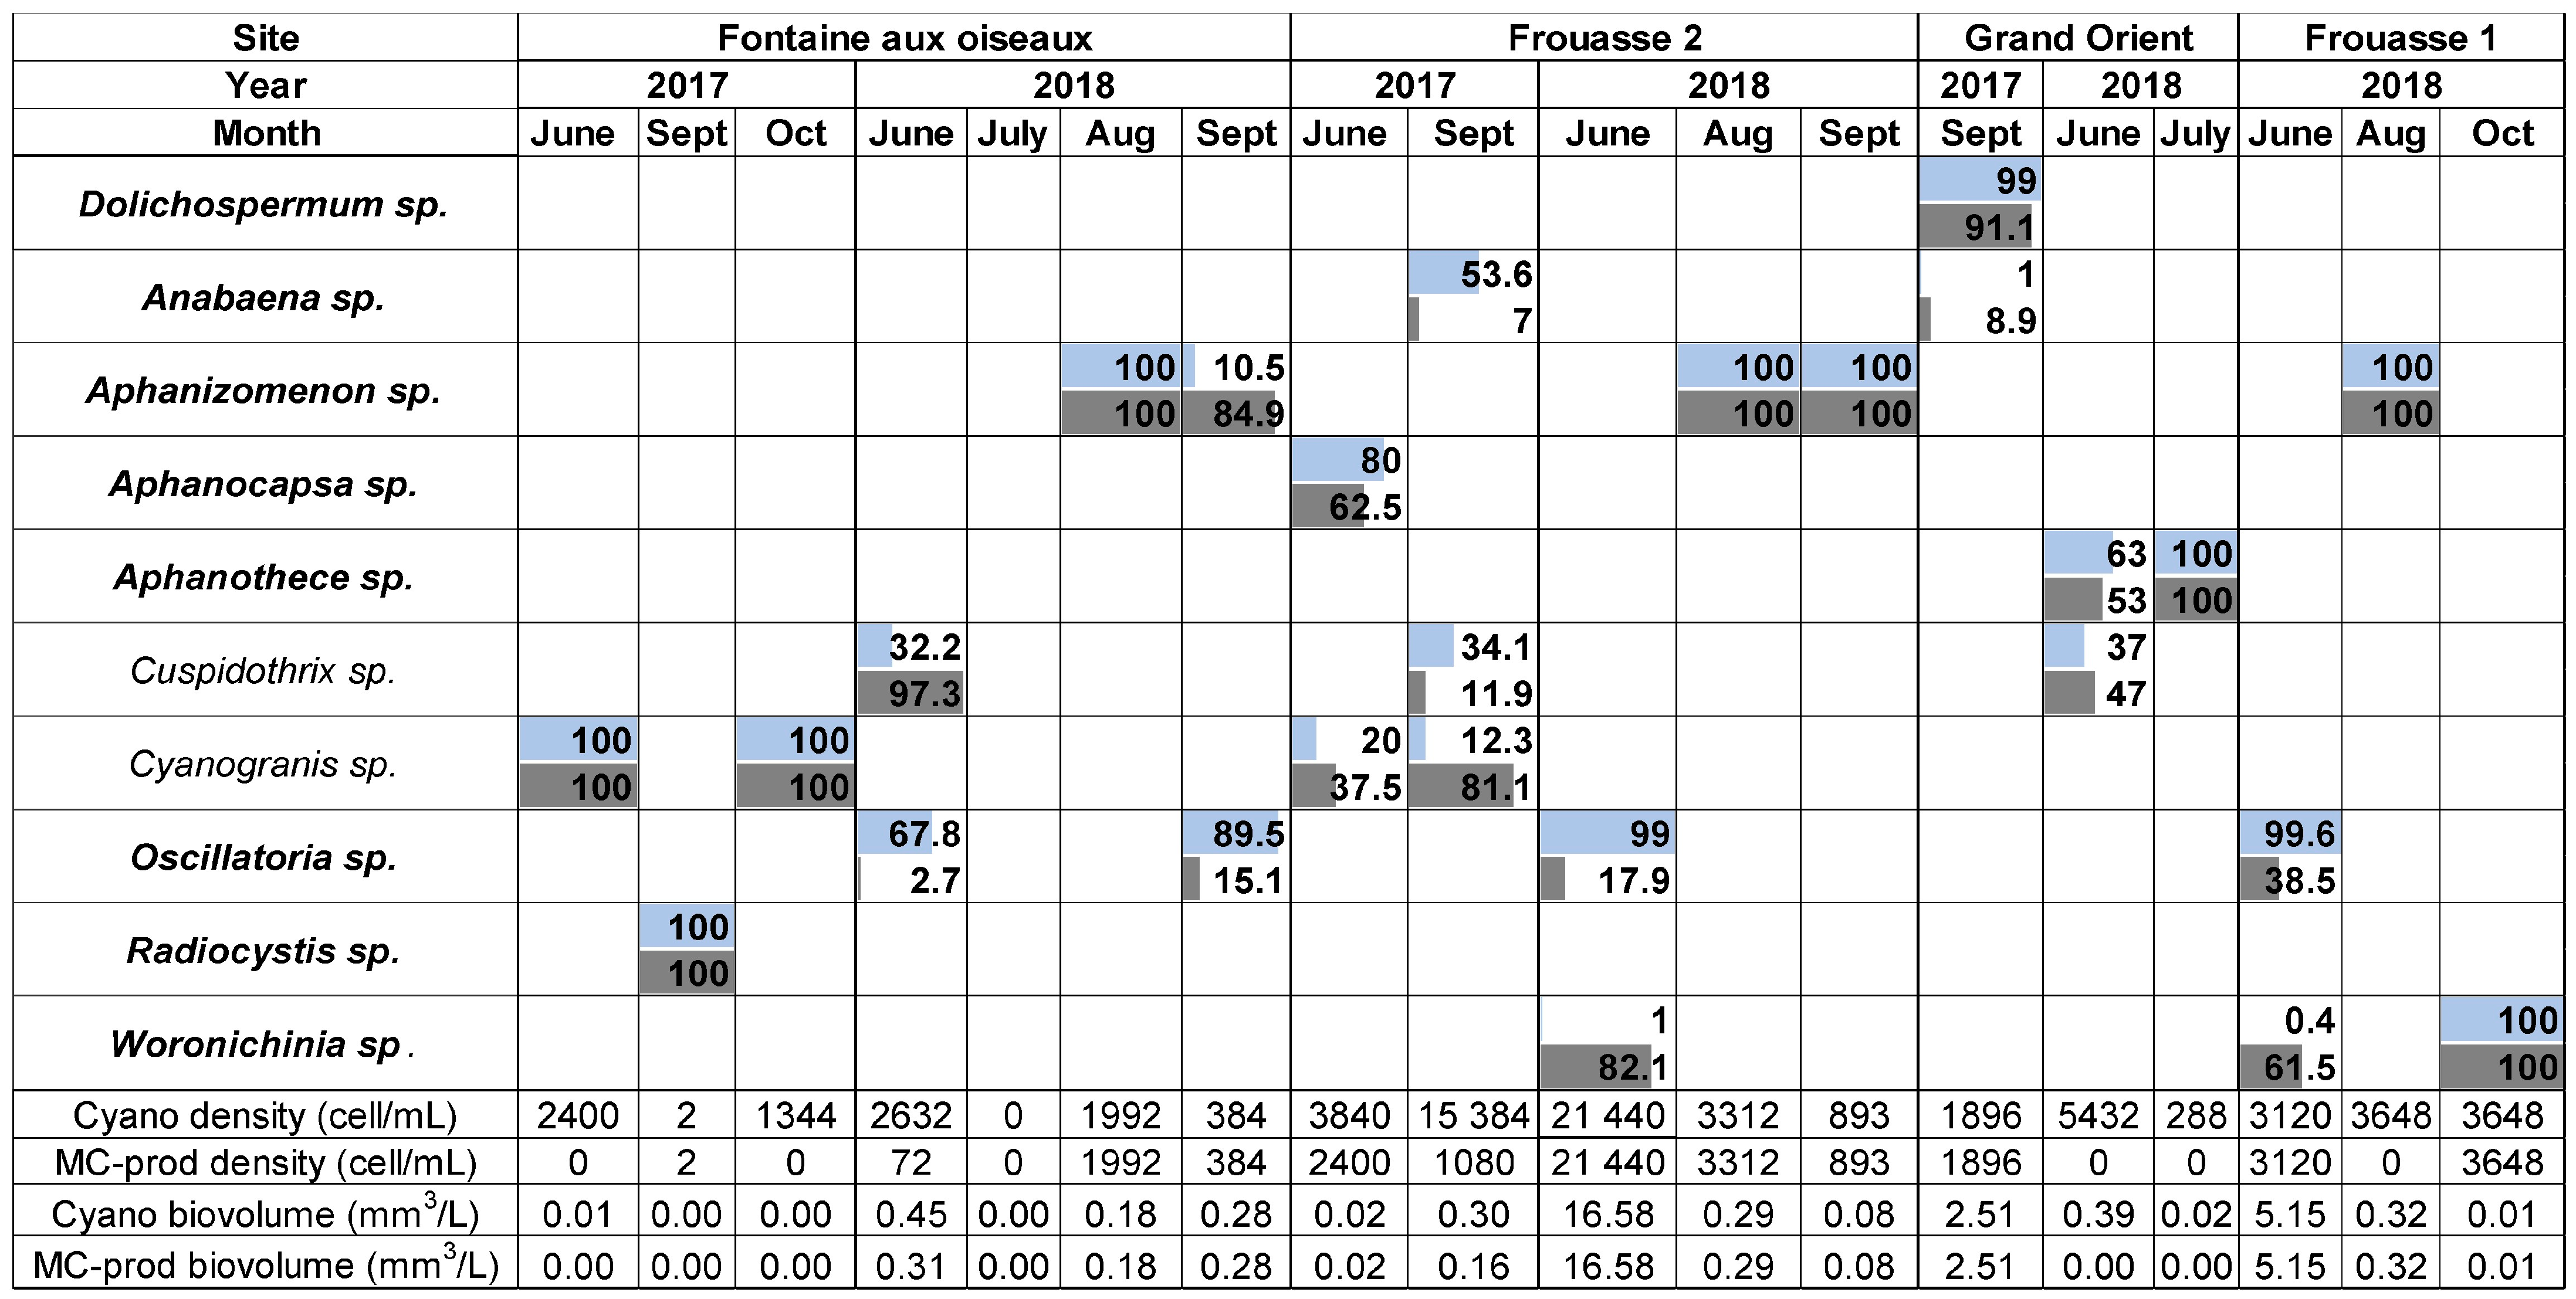
2.1. Cyanobacterial Community Composition, Densities, and Biovolumes
2.1.1. Ailette Lake
2.1.2. Der Lake
2.1.3. Temple Lake
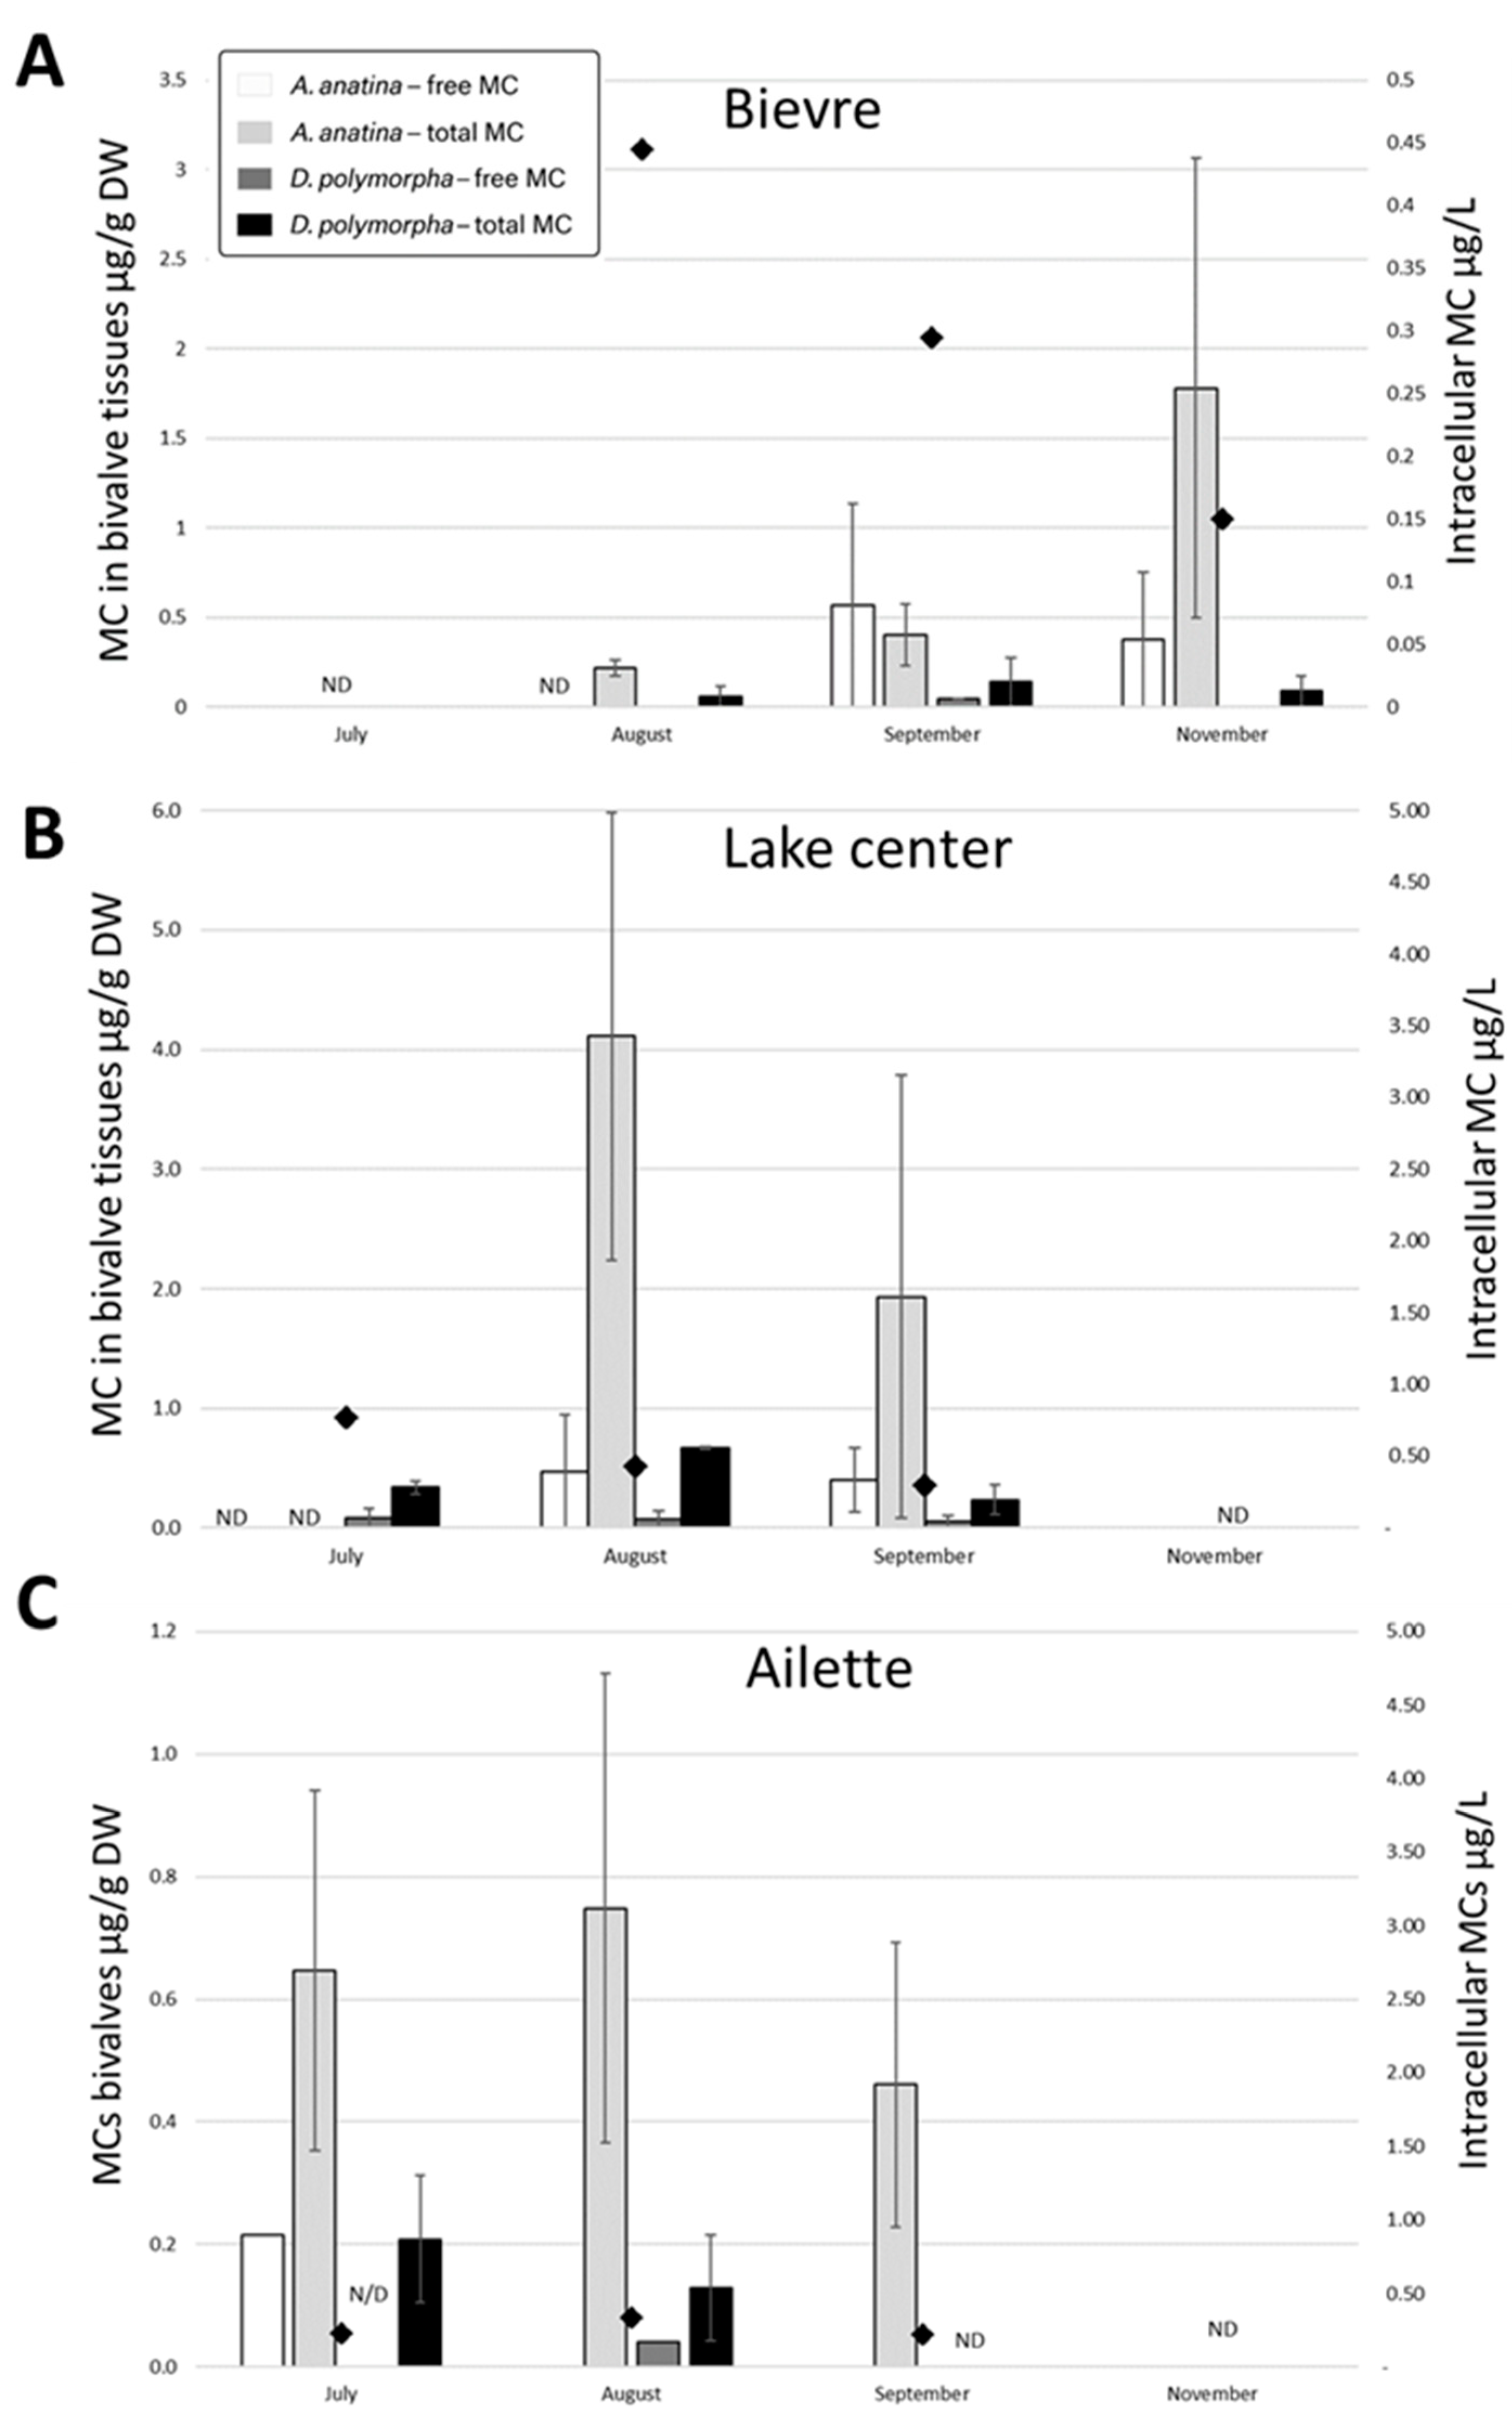
2.2. MC Measurement in Cyanobacterial Biomass and in Bivalve Tissues
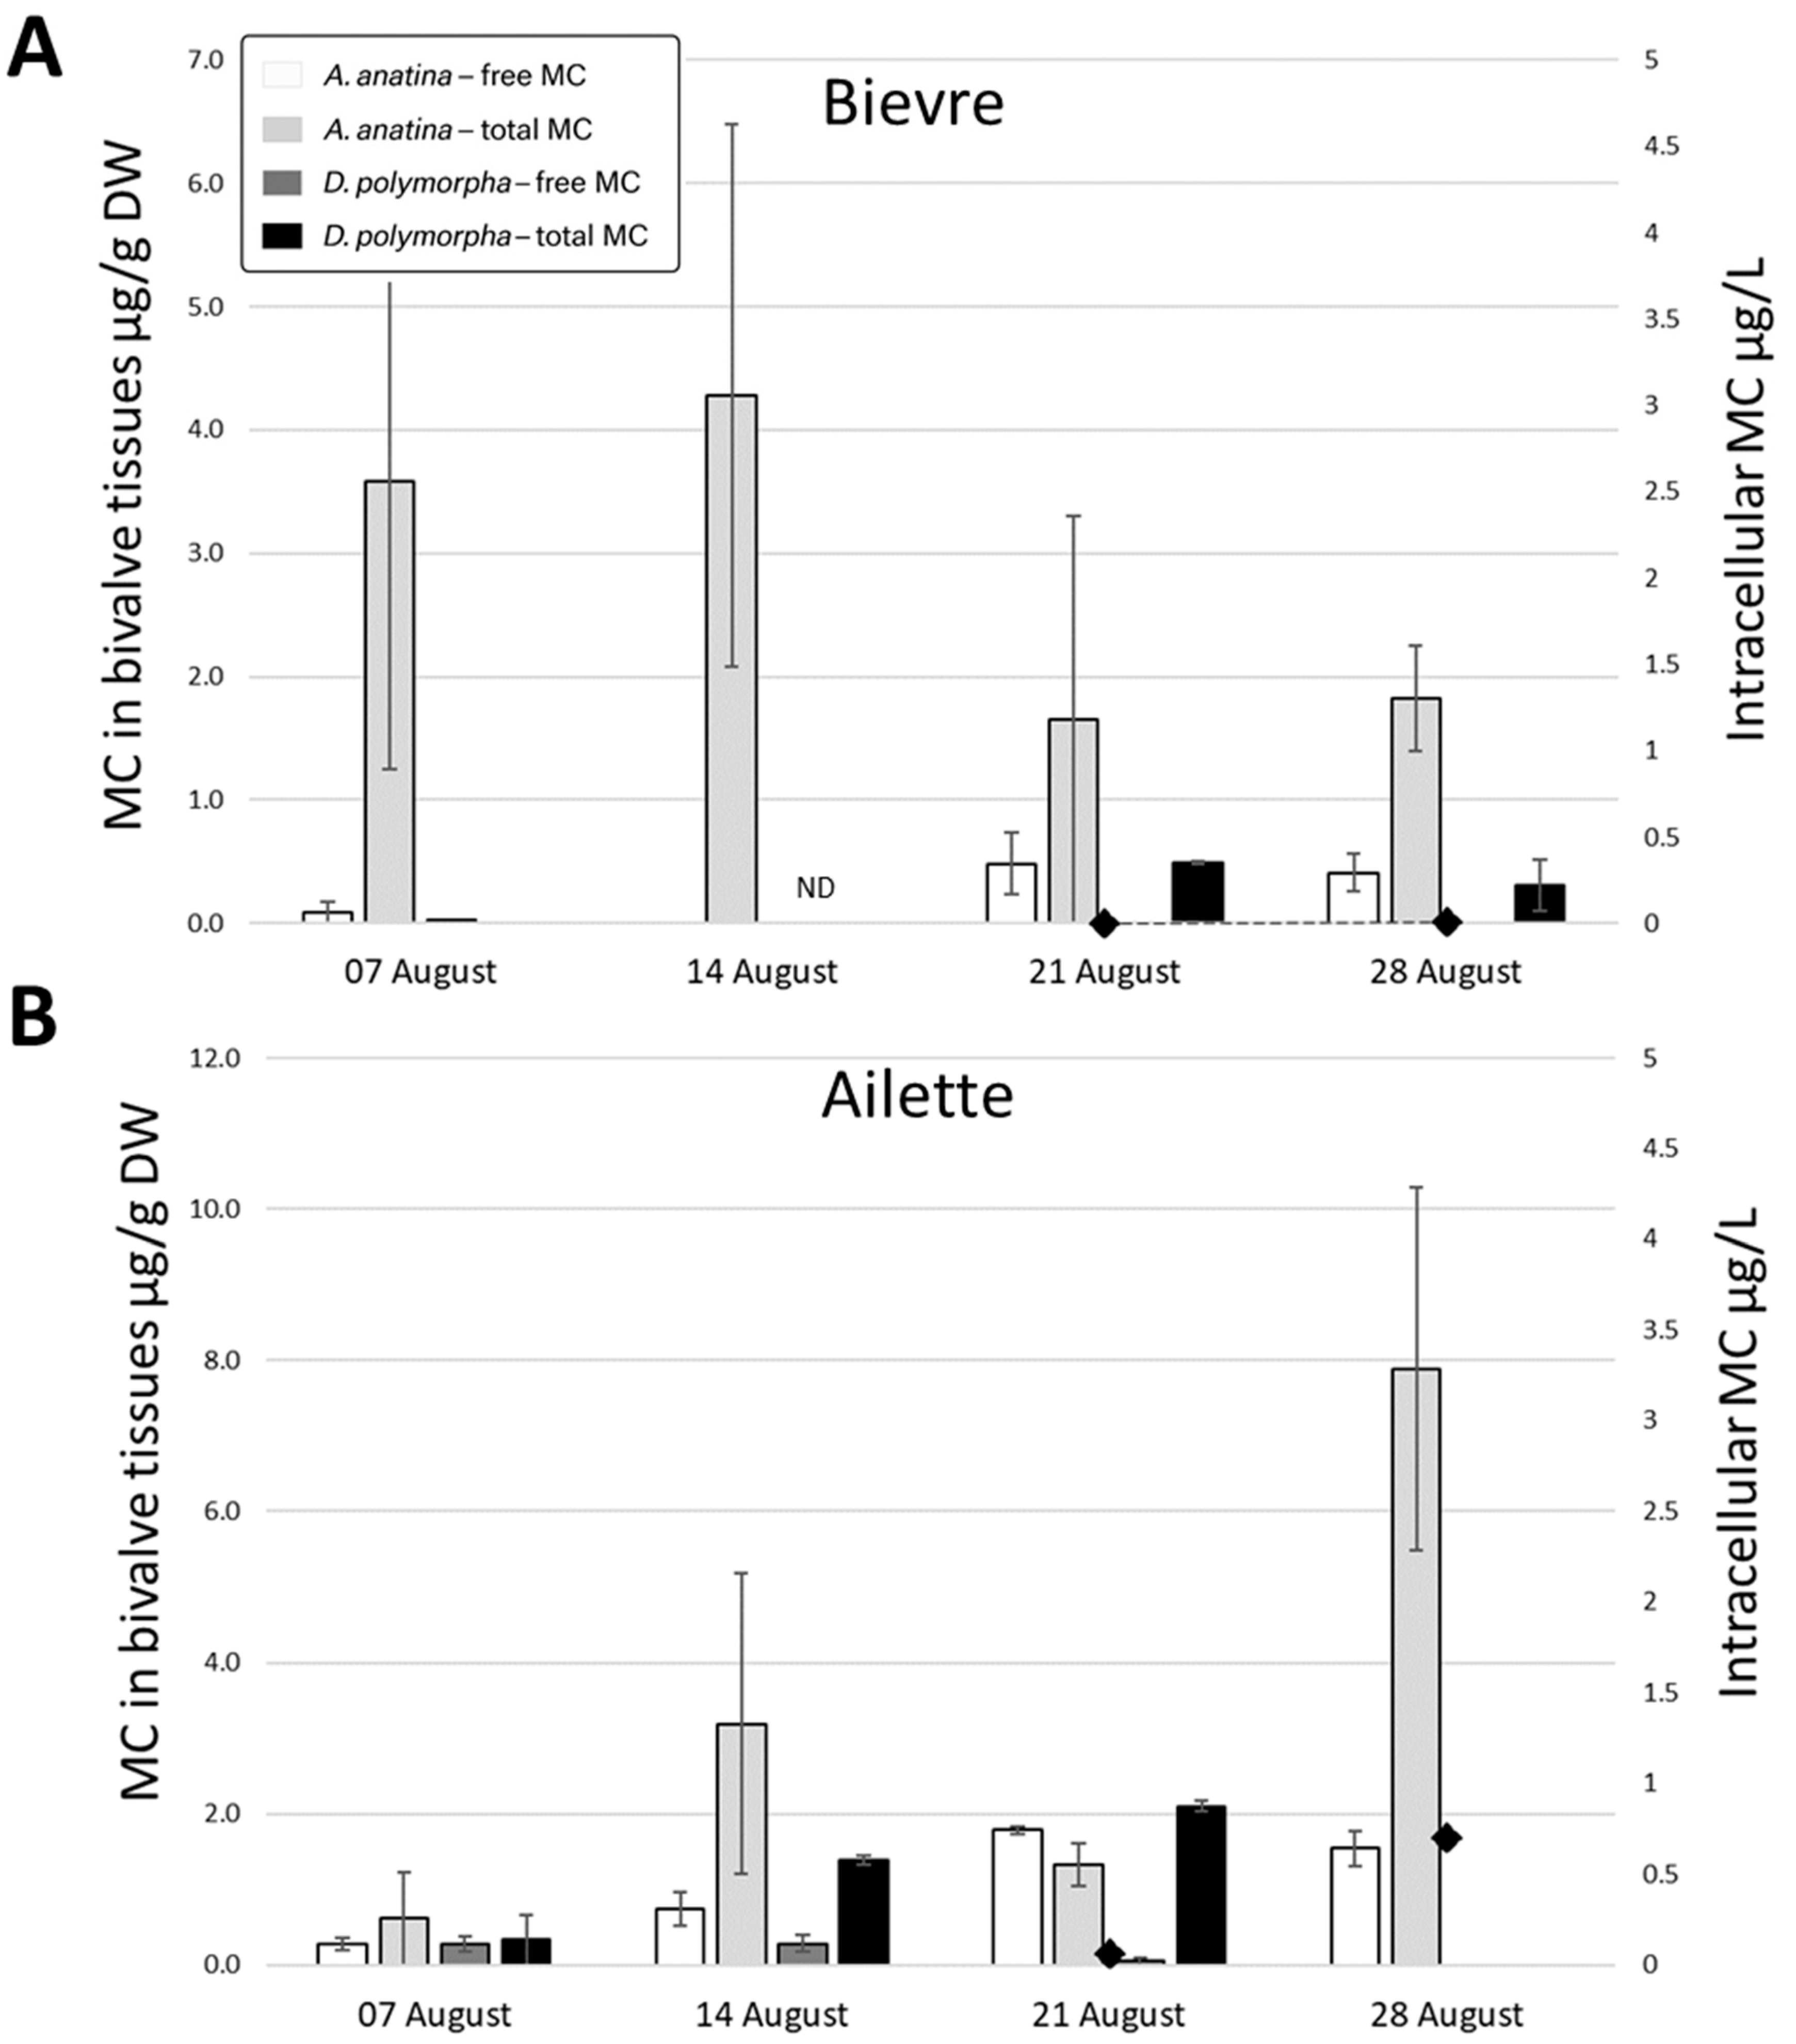
2.2.1. Ailette Lake
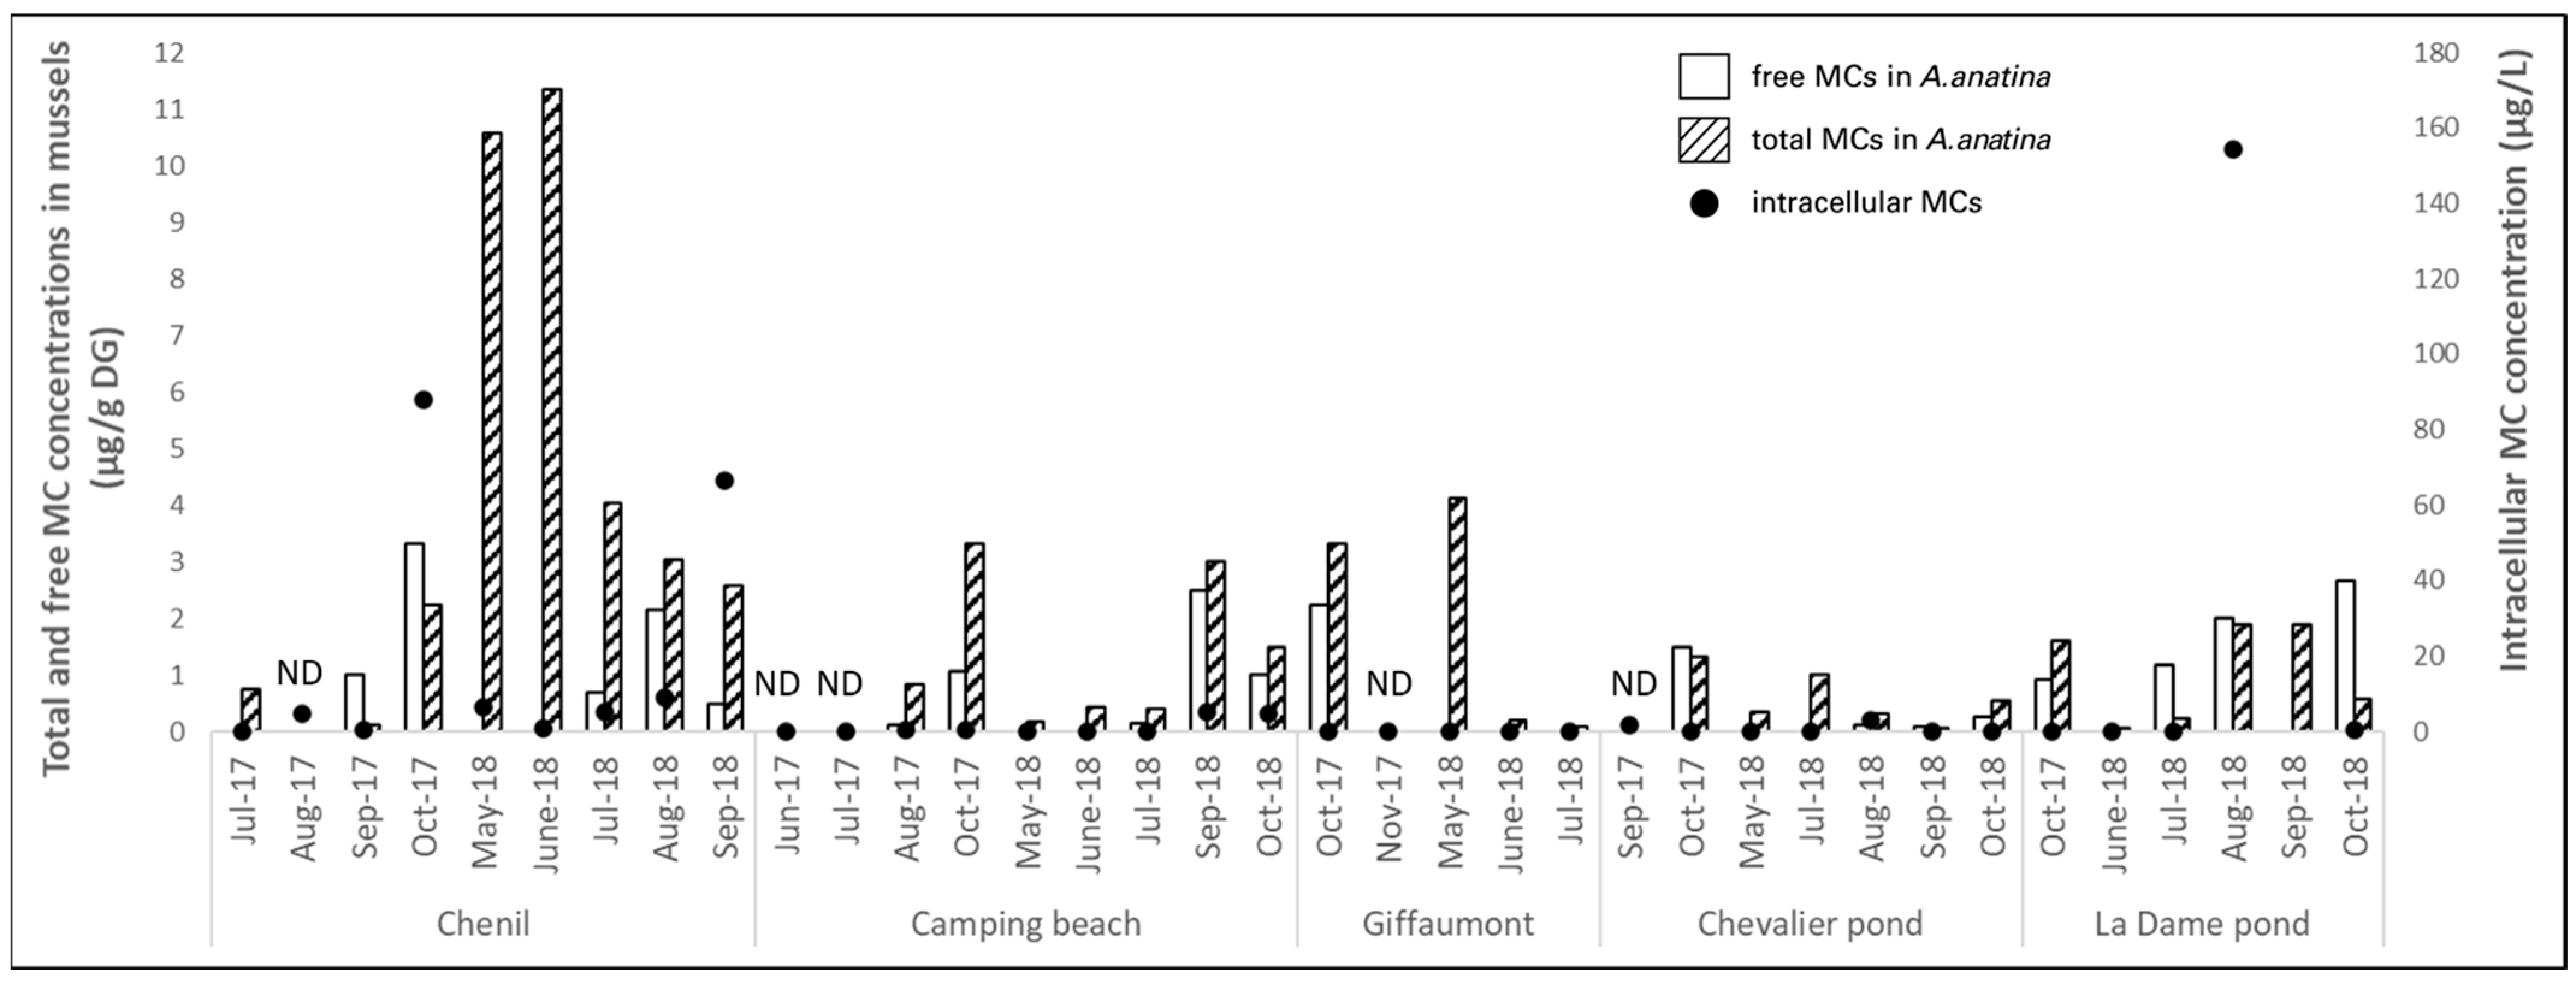
2.2.2. Der Lake
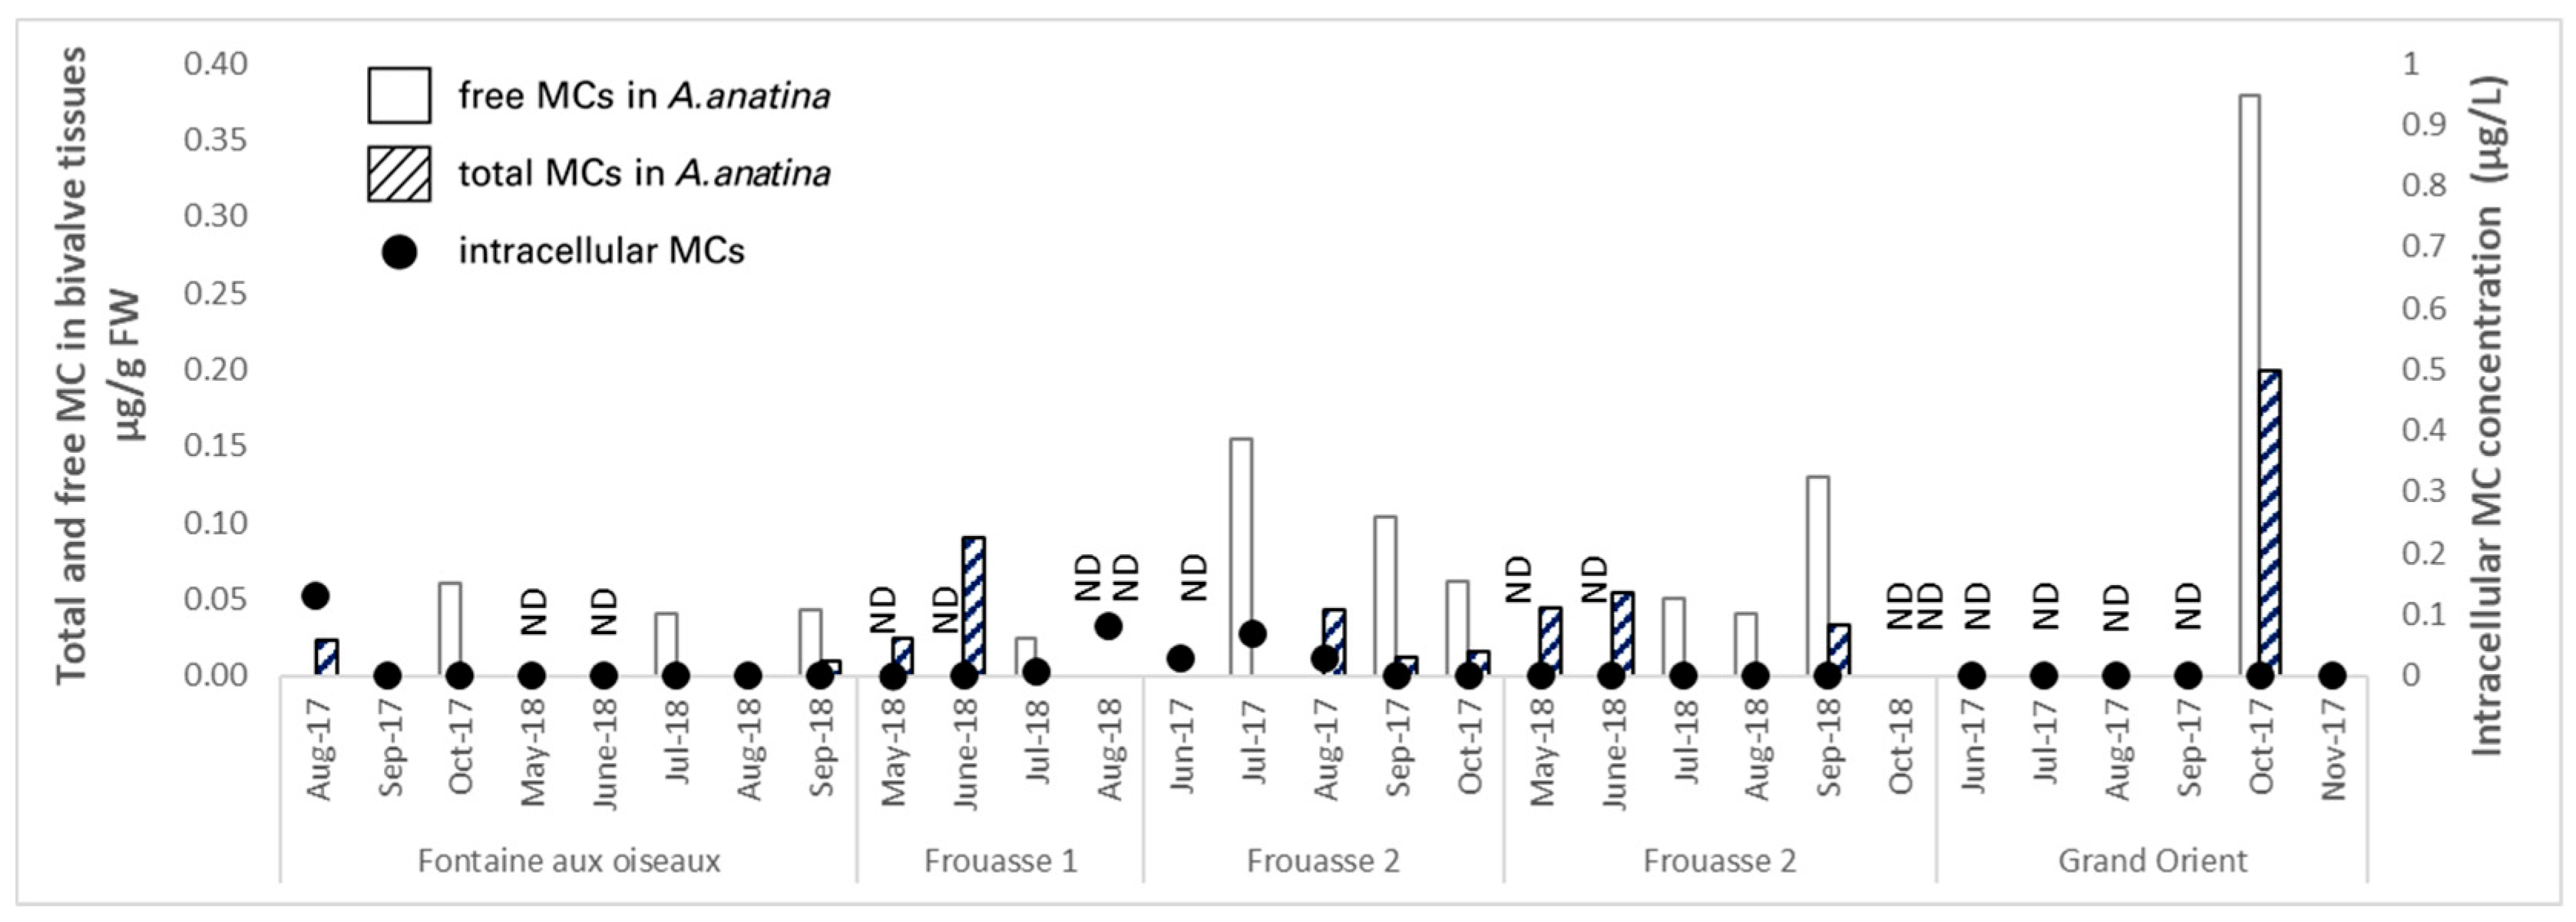
2.2.3. Temple Lake
2.3. Correlations Between Environmental Parameters, MC Concentrations in Water and in Mussels, and Water Contamination by Cyanobacteria
2.3.1. Ailette Lake
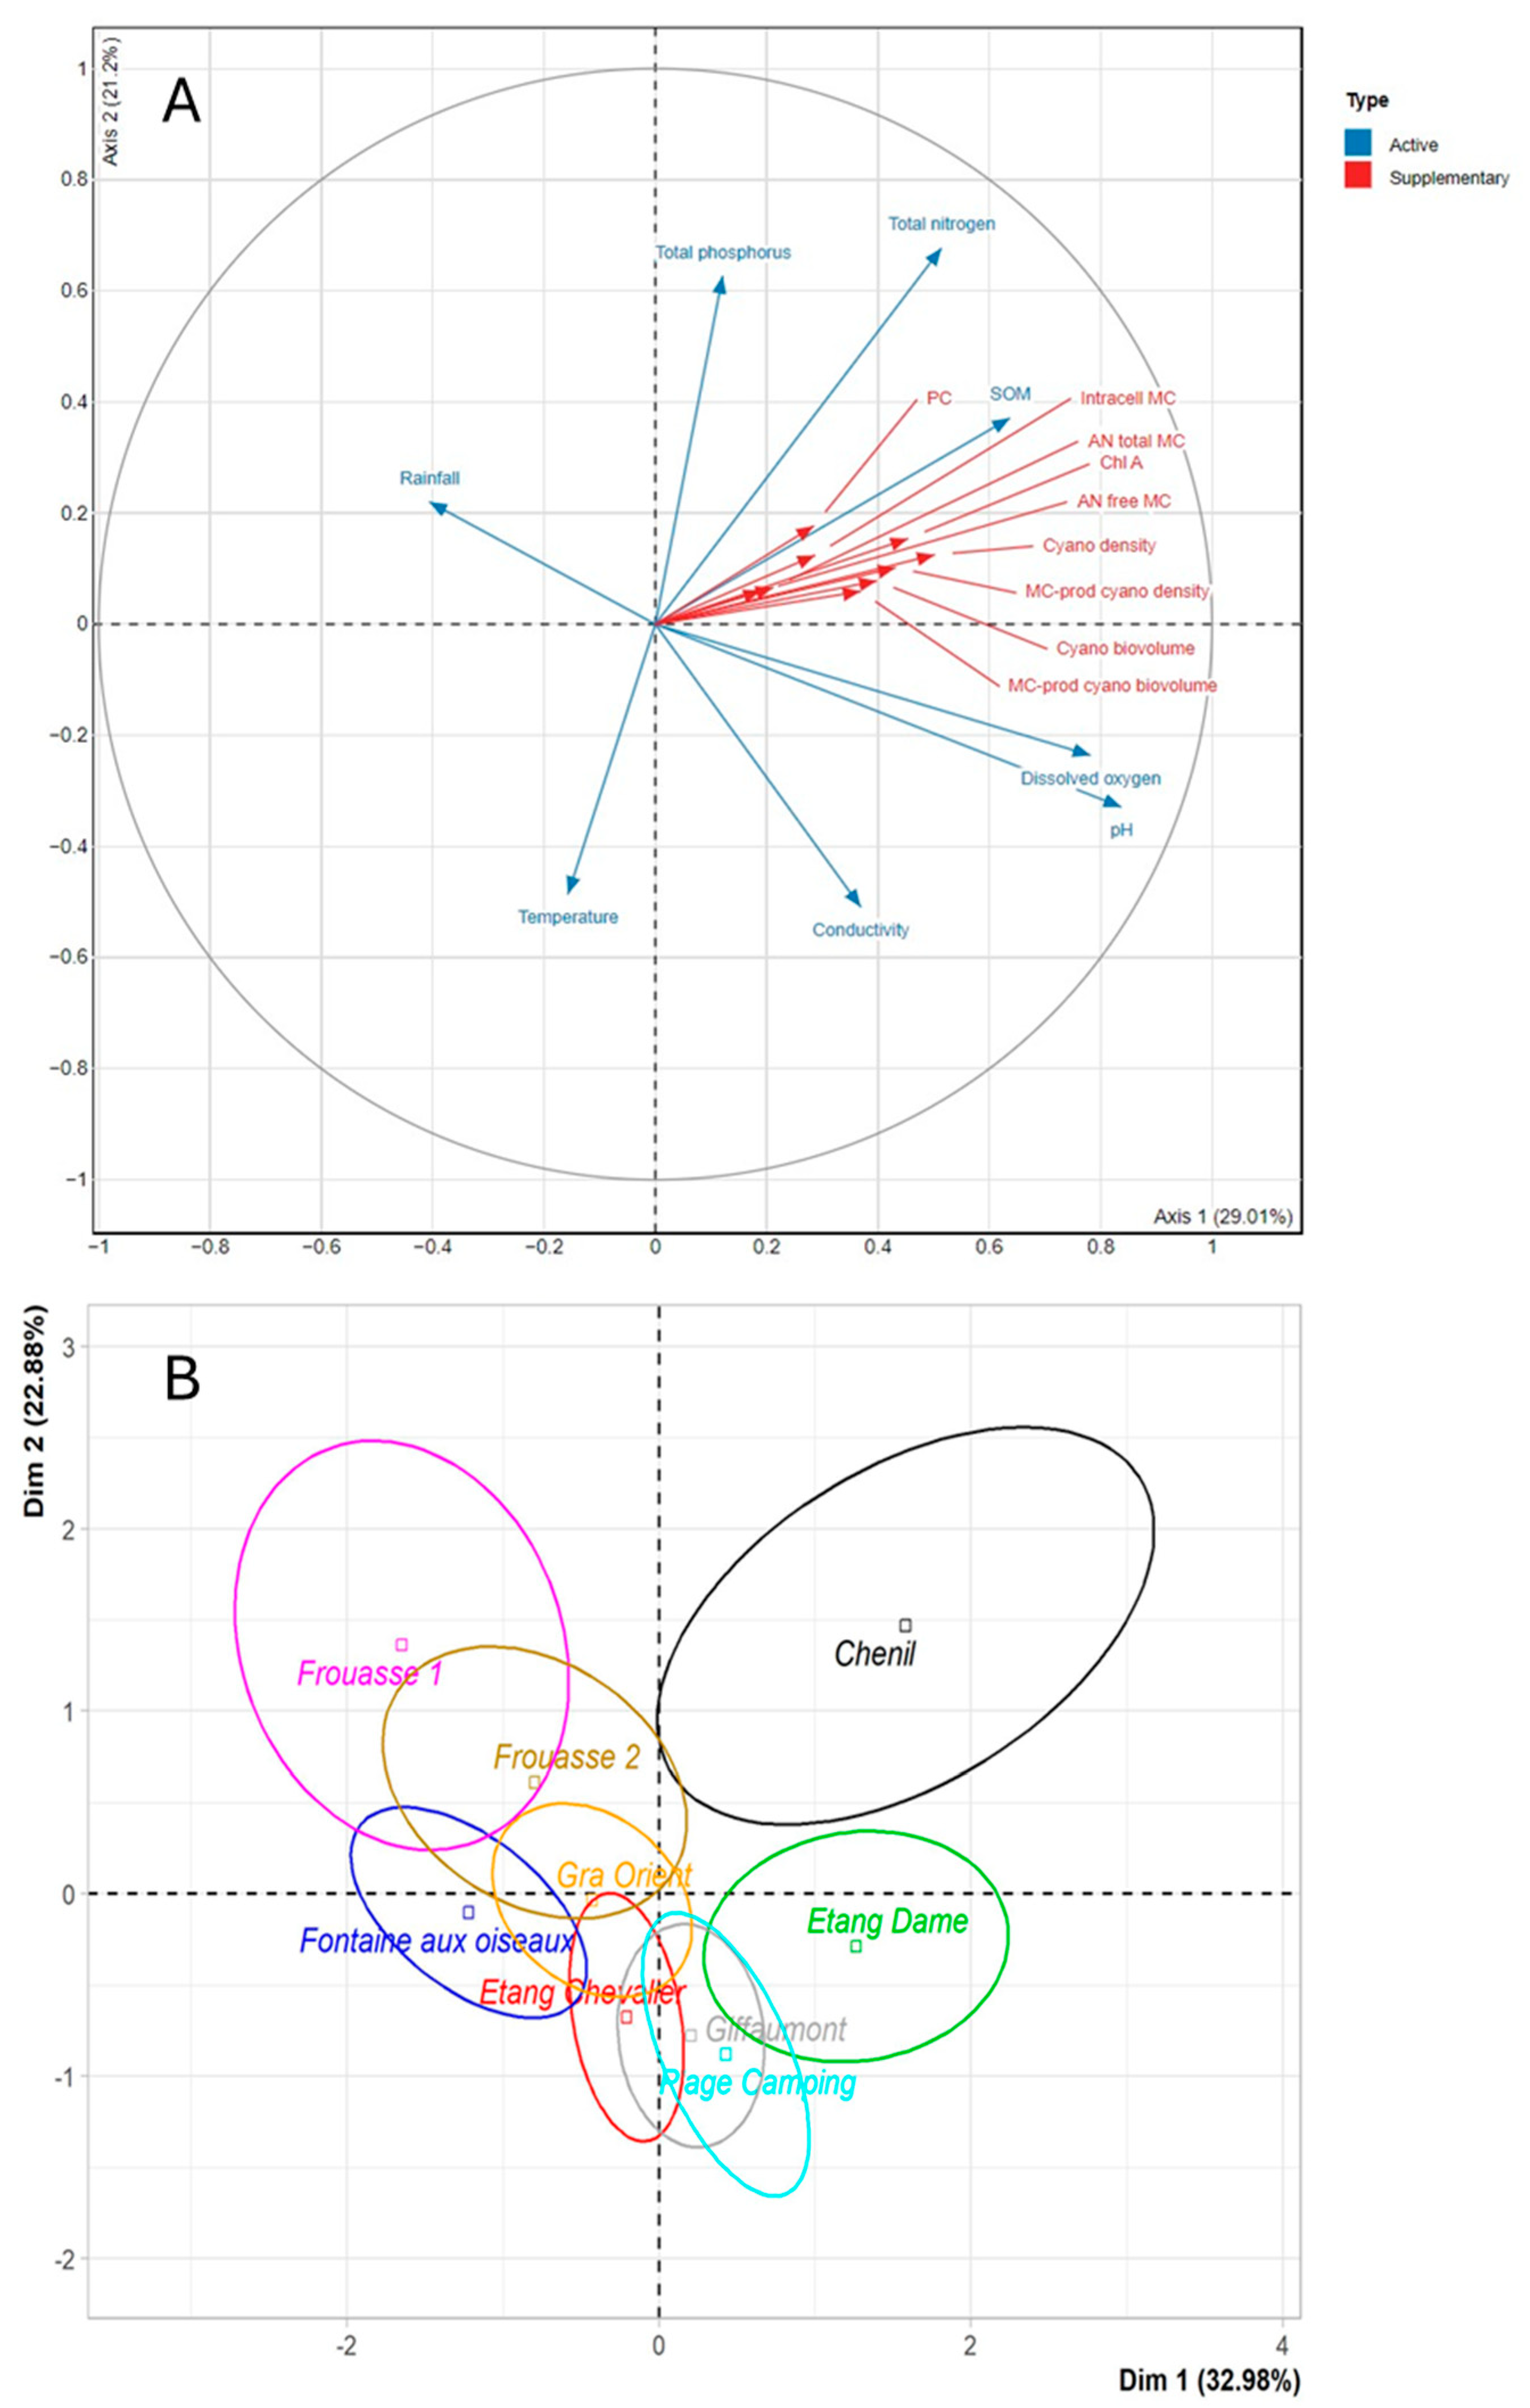
2.3.2. Der and Temple Lake
3. Discussion
3.1. Environmental and Cyanobacterial Parameters
3.2. Information Provided by Mussel Tissues
- -
- It provides a more accurate understanding of overall lake contamination by MCs. Unlike instantaneous water quality measurements, bivalves offer temporal integration of contamination, enabling more reliable trend detection. Their ability to filter large volumes of water makes them highly sensitive to low MC concentrations, particularly when contamination is sporadic or localized, as demonstrated in this study.
- -
- It offers insight into the potential transfer of MCs to higher trophic levels, including terrestrial food webs, since bivalves represent a food resource for many animals.
- -
- It provides an indirect indication of contamination in aquatic products consumed by humans. Indeed, monitoring MCs in fish remains rare and challenging due to the difficulty of collecting sufficient individuals from target species for a single analysis. In contrast, total MC quantification has been successfully performed in mussel tissues but may be more difficult in fish muscle matrices, despite the potential toxicity of protein-bound MCs for consumers [10]. Further studies could then be conducted to establish the relationship between mussel and some fish contamination by free and total MCs during cyanobacterial blooms. In addition to environmental monitoring, the use of freshwater bivalves as bioindicators must also consider their physiological responses to toxic cyanobacteria. Indeed, MC-producing cyanobacteria can negatively affect bivalve growth, condition, and overall health, especially under prolonged or repeated exposure. These sublethal effects, recently reviewed [63], highlight the dual role of mussels as both sentinels and sensitive organisms exposed to cyanotoxins, reinforcing the relevance of integrating biological responses in future biomonitoring strategies.
4. Conclusions
5. Materials and Methods
5.1. Biological Materials
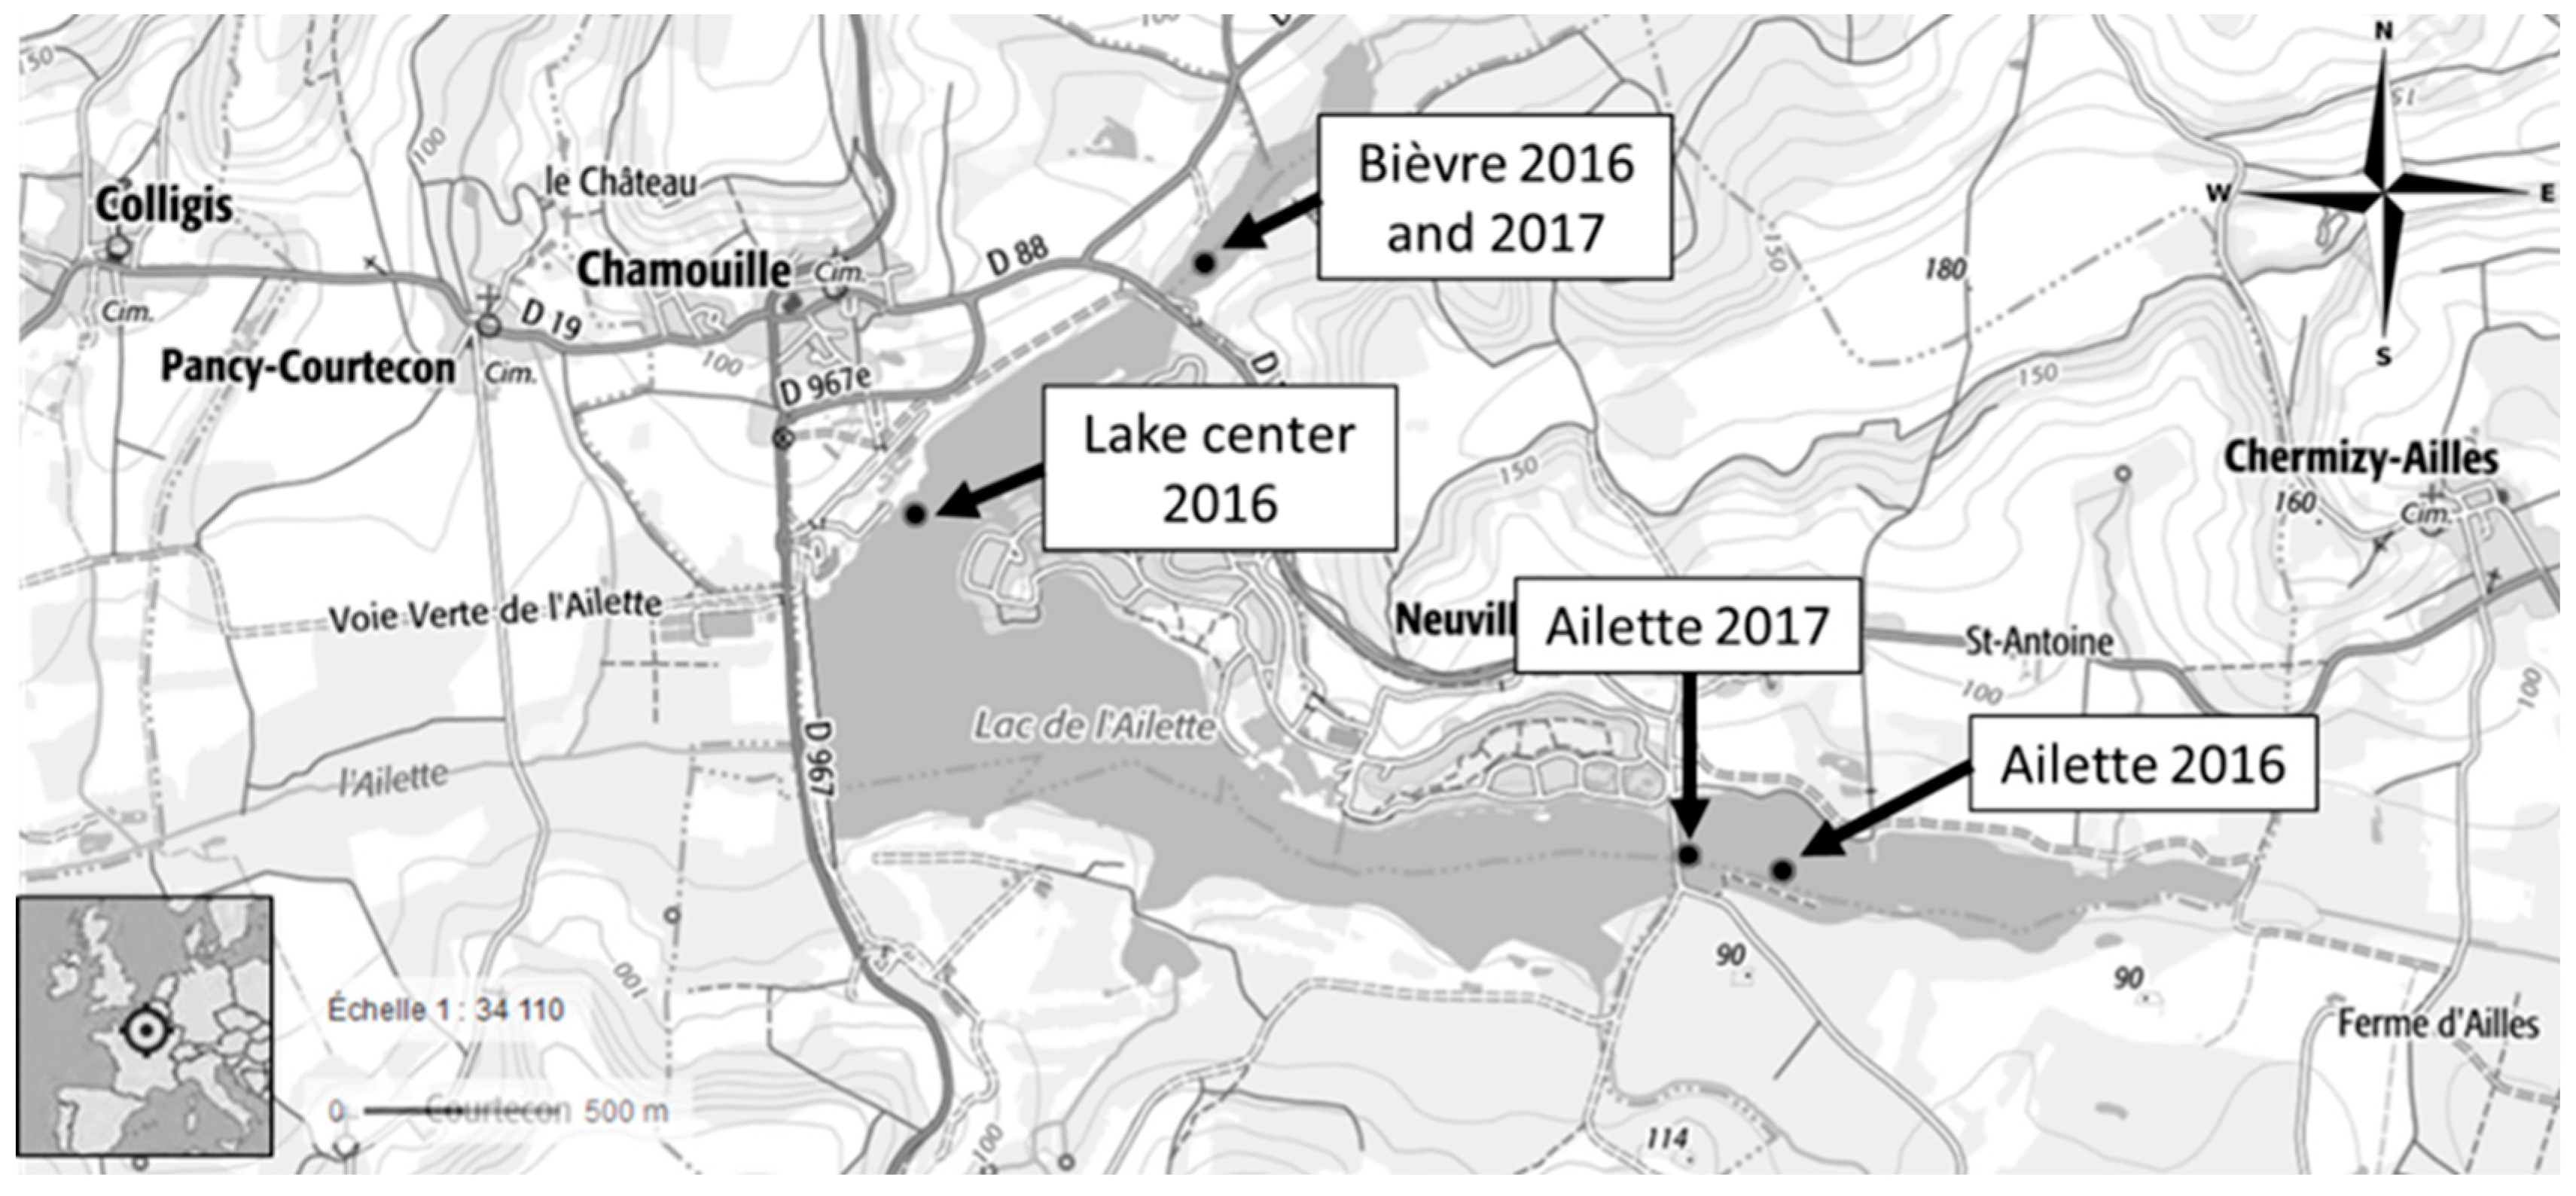
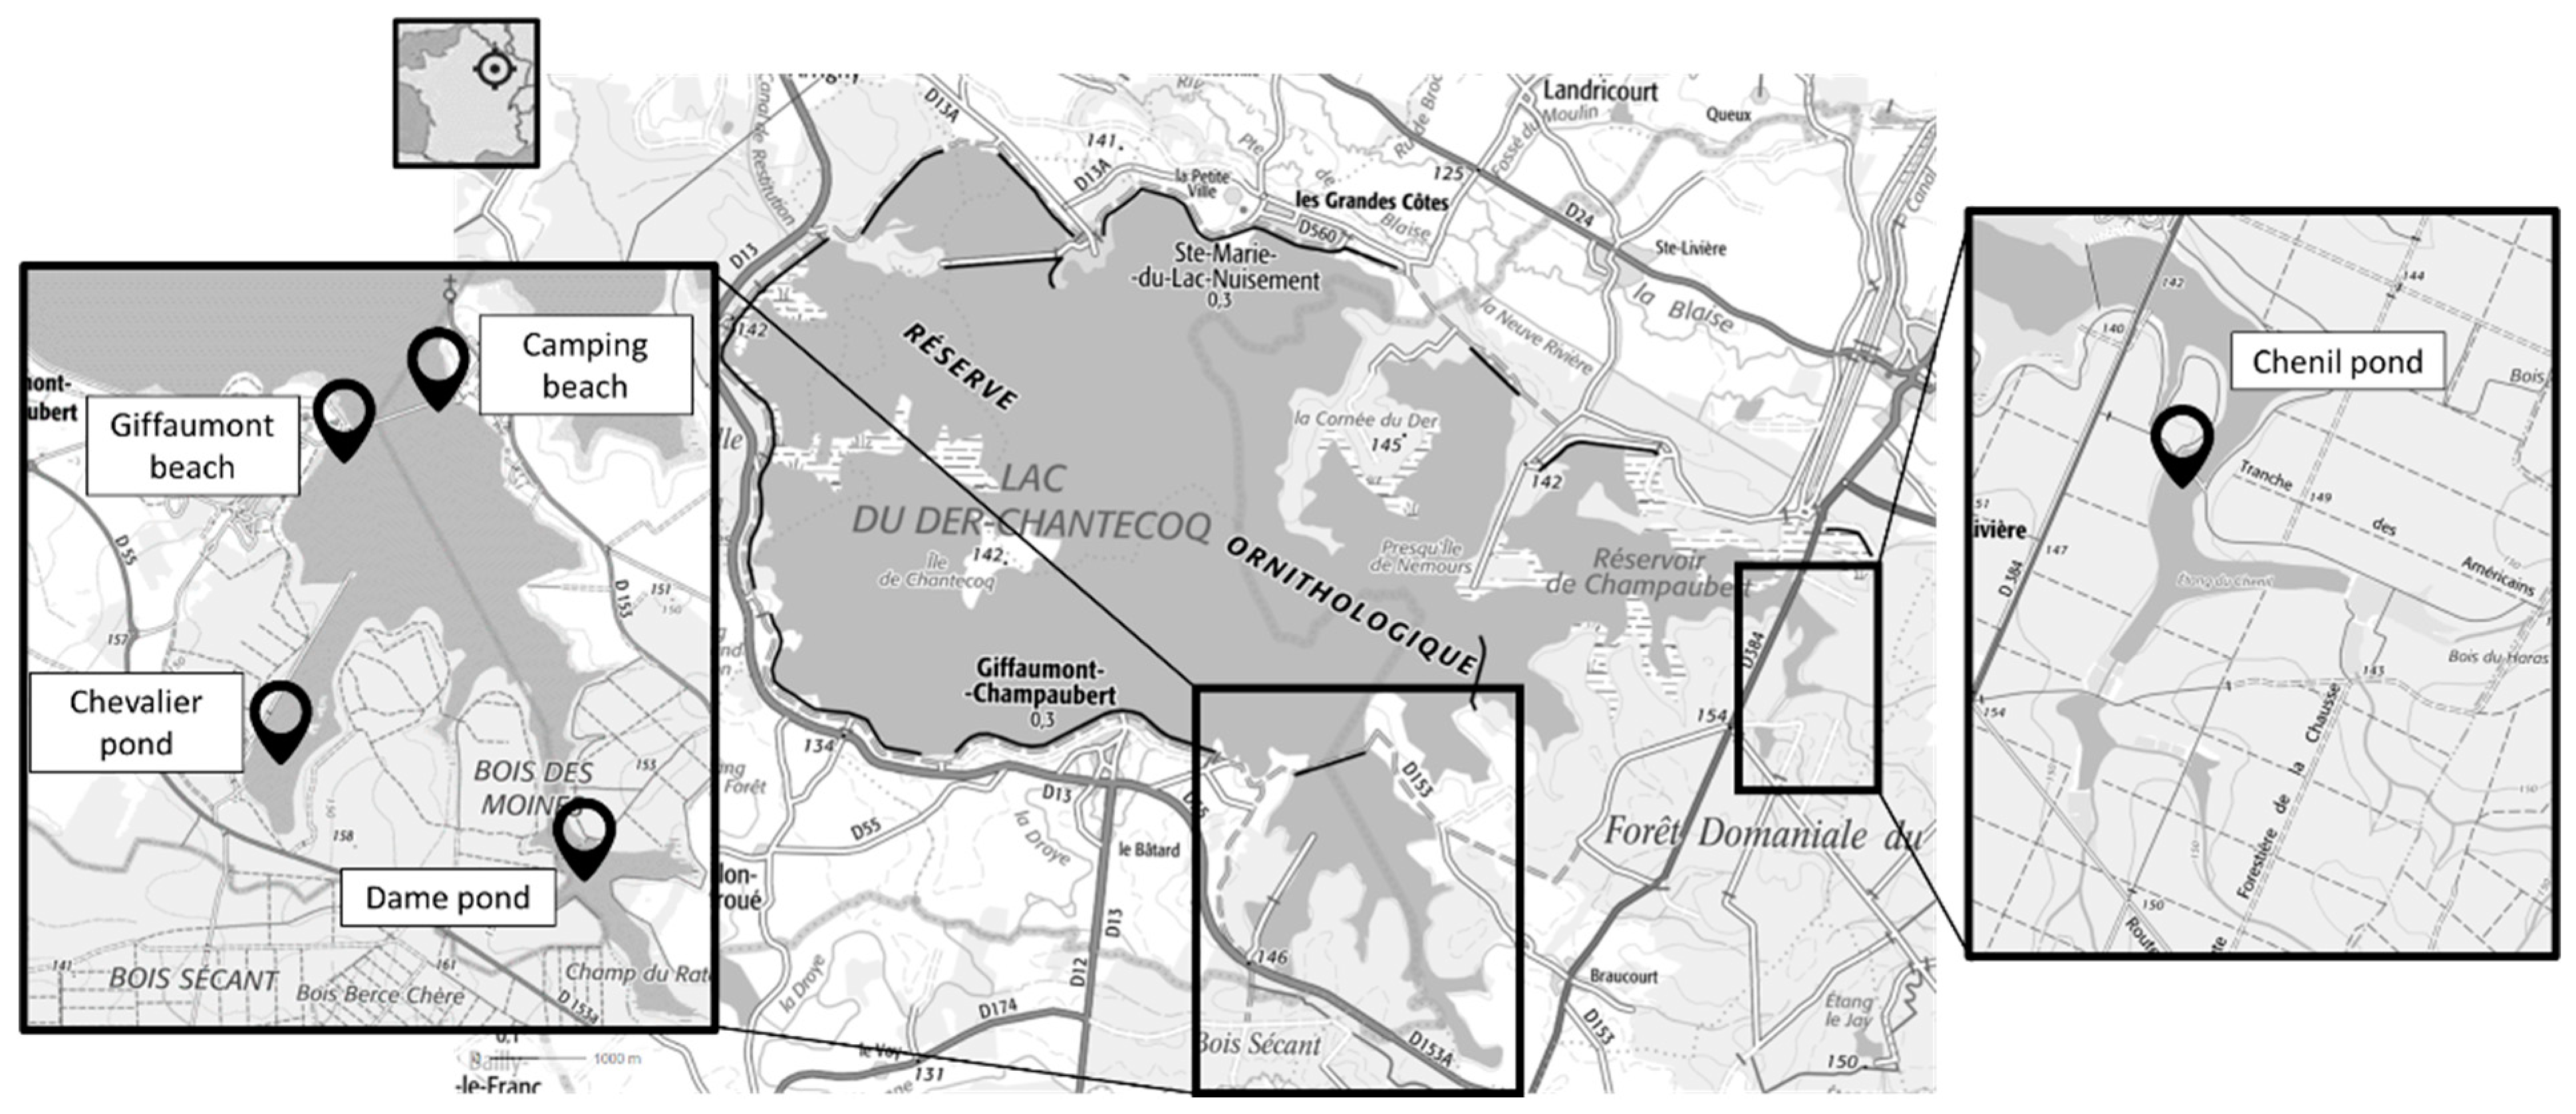
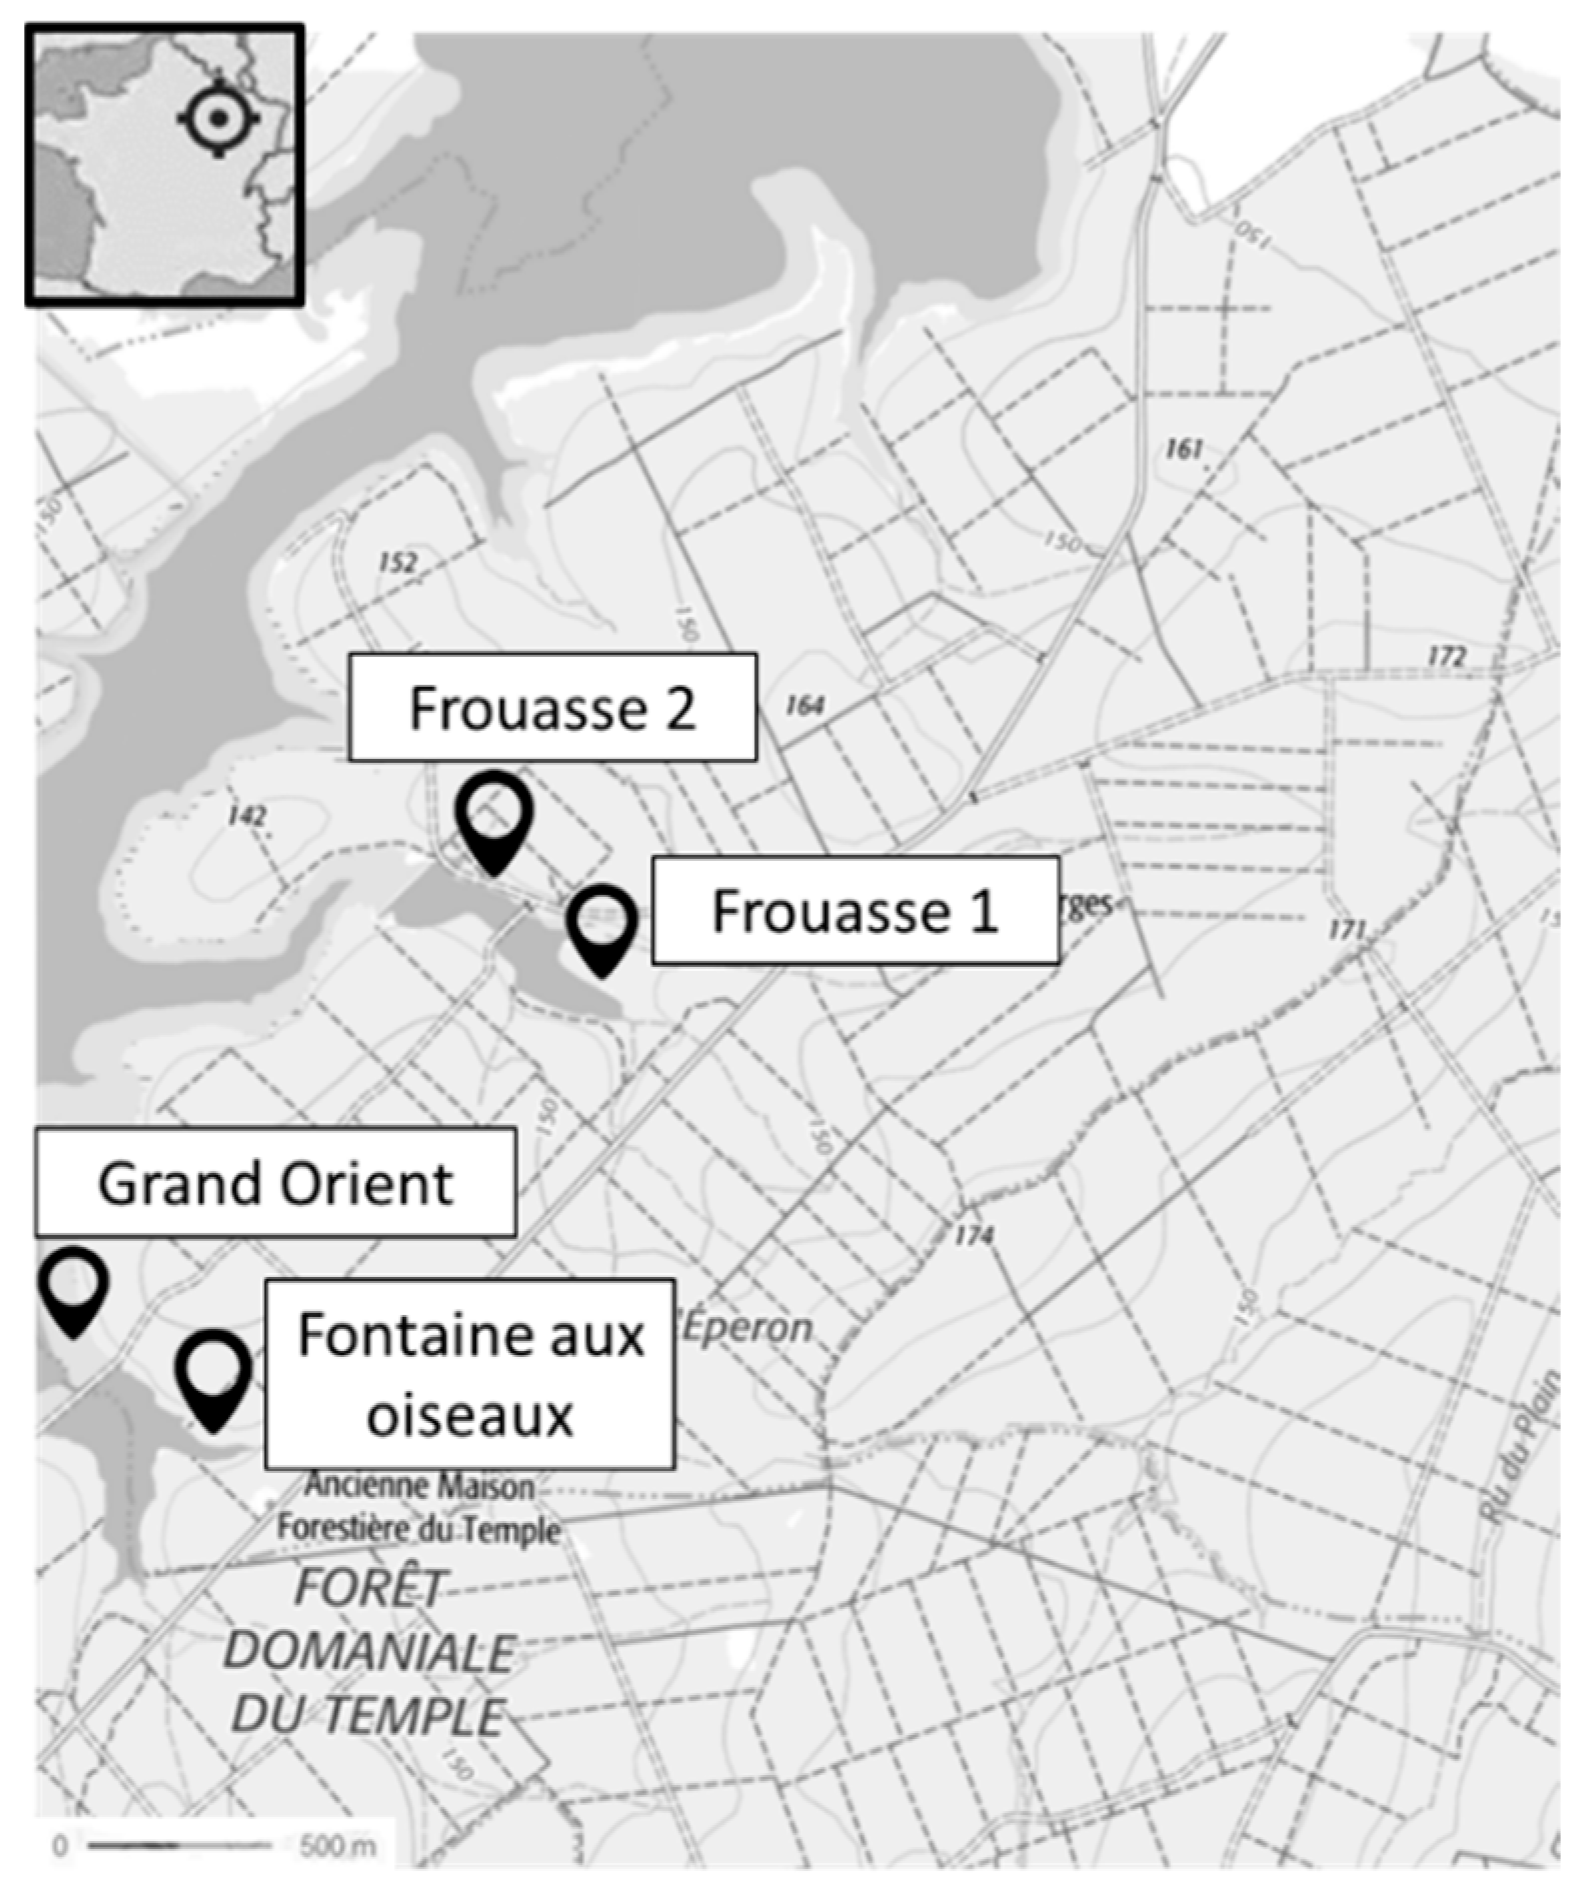
5.2. Site Characterization and Caging
- Ailette
- Lake Der-Chantecoq
- Lake Temple
5.3. Analysis of Water Samples and Bivalve Tissues
5.3.1. Measurement of Free and Total MCs in Phytoplankton Biomass and Bivalves
5.3.2. Identification and Quantification of Cyanobacteria
5.4. Statistics
Supplementary Materials
Author Contributions
Funding
Institutional Review Board Statement
Informed Consent Statement
Data Availability Statement
Acknowledgments
Conflicts of Interest
References
- Chorus, I.; Welker, M. Toxic Cyanobacteria in Water; CRC Press: Boca Raton, FL, USA, 2021. [Google Scholar]
- Erratt, K.J.; Creed, I.F.; Lobb, D.A.; Smol, J.P.; Trick, C.G. Climate change amplifies the risk of potentially toxigenic cyanobacteria. Glob. Chang. Biol. 2023, 29, 5240–5249. [Google Scholar] [CrossRef] [PubMed]
- Svirčev, Z.; Lalić, D.; Bojadžija Savić, G.; Tokodi, N.; Drobac Backović, D.; Chen, L.; Meriluoto, J.; Codd, G.A. Global geographical and historical overview of cyanotoxin distribution and cyanobacterial poisonings. Arch. Toxicol. 2019, 93, 2429–2481. [Google Scholar] [CrossRef] [PubMed]
- Wood, R. Acute animal and human poisonings from cyanotoxin exposure—A review of the literature. Environ. Int. 2016, 91, 276–282. [Google Scholar] [CrossRef]
- Meriluoto, J.; Spoof, L.; Codd, G.A. Handbook of Cyanobacterial Monitoring and Cyanotoxin Analysis; John Wiley & Sons, Ltd.: Chichester, UK, 2016. [Google Scholar] [CrossRef]
- Campos, A.; Vasconcelos, V. Molecular Mechanisms of Microcystin Toxicity in Animal Cells. Int. J. Mol. Sci. 2010, 11, 268–287. [Google Scholar] [CrossRef] [PubMed]
- Kondo, F.; Ikai, Y.; Oka, H.; Okumura, M.; Ishikawa, N.; Harada, K.; Matsuura, K.; Murata, H.; Suzuki, M. Formation, Characterization, and Toxicity of the Glutathione and Cysteine Conjugates of Toxic Heptapeptide Microcystins. Chem. Res. Toxicol. 1992, 5, 591–596. [Google Scholar] [CrossRef]
- Hastie, C.J.; Borthwick, E.B.; Morrison, L.F.; Codd, G.A.; Cohen, P.T.W. Inhibition of several protein phosphatases by a non-covalently interacting microcystin and a novel cyanobacterial peptide, nostocyclin. Biochim. Biophys. Acta 2005, 1726, 187–193. [Google Scholar] [CrossRef]
- Maynes, J.T.; Luu, H.A.; Cherney, M.M.; Andersen, R.J.; Williams, D.; Holmes, C.F.B.; James, M.N.G. Crystal structures of protein phosphatase-1 bound to motuporin and dihydromicrocystin-LA: Elucidation of the mechanism of enzyme inhibition by cyanobacterial toxins. J. Mol. Biol. 2006, 356, 111–120. [Google Scholar] [CrossRef]
- Bouteiller, P.; Lance, E.; Guérin, T.; Biré, R. Analysis of Total-Forms of Cyanotoxins Microcystins in Biological Matrices: A Methodological Review. Toxins 2022, 14, 550. [Google Scholar] [CrossRef]
- Simis, S.G.H.; Peters, S.W.M.; Gons, H.J. Remote sensing of the cyanobacterial pigment phycocyanin in turbid inland water. Limnol. Oceanogr. 2005, 50, 237–245. [Google Scholar] [CrossRef]
- Brient, L.; Lengronne, M.; Bertrand, E.; Rolland, D.; Sipel, A.; Steinmann, D.; Baudin, I.; Legeas, M.; Le Rouzic, B.; Bormans, M. A phycocyanin probe as a tool for monitoring cyanobacteria in freshwater bodies. J. Environ. Monit. 2008, 10, 248–255. [Google Scholar] [CrossRef]
- Kanoshina, I.; Lips, U.; Leppänen, J.M. The influence of weather conditions (temperature and wind) on cyanobacterial bloom development in the Gulf of Finland (Baltic Sea). Harmful Algae 2003, 2, 29–41. [Google Scholar] [CrossRef]
- Kurmayer, R.; Deng, L.; Entfellner, E. Role of toxic and bioactive secondary metabolites in colonization and bloom formation by filamentous cyanobacteria Planktothrix. Harmful Algae 2016, 54, 69–86. [Google Scholar] [CrossRef]
- Kohoutek, J.; Maršálek, B.; Bláha, L. Evaluation of the novel passive sampler for cyanobacterial toxins microcystins under various conditions including field sampling. Anal. Bioanal. Chem. 2010, 397, 823–828. [Google Scholar] [CrossRef] [PubMed]
- Kudela, R.M. Passive Sampling for Freshwater and Marine Algal Toxins. Compr. Anal. Chem. 2017, 78, 379–409. [Google Scholar] [CrossRef]
- Lance, E.; Lepoutre, A.; Savar, V.; Robert, E.; Bormans, M.; Amzil, Z. In situ use of bivalves and passive samplers to reveal water contamination by microcystins along a freshwater-marine continuum in France. Water Res. 2021, 204, 117620. [Google Scholar] [CrossRef]
- Bailly, E.; Levi, Y.; Karolak, S. Calibration and field evaluation of polar organic chemical integrative sampler (POCIS) for monitoring pharmaceuticals in hospital wastewater. Environ. Pollut. 2013, 174, 100–105. [Google Scholar] [CrossRef] [PubMed]
- Baqar, M.; Sadef, Y.; Ahmad, S.R.; Mahmood, A.; Li, J.; Zhang, G. Organochlorine contaminants in freshwater mussels; occurrence, bioaccumulation pattern, spatio-temporal distribution and human health risk assessment from the tributaries of River Ravi, Pakistan. Hum. Ecol. Risk Assess. 2018, 24, 1268–1290. [Google Scholar] [CrossRef]
- Graczyk, T.K.; Conn, D.B.; Marcogliese, D.J.; Graczyk, H.; De Lafontaine, Y. Accumulation of human waterborne parasites by zebra mussels (Dreissena polymorpha) and Asian freshwater clams (Corbicula fluminea). Parasitol. Res. 2003, 89, 107–112. [Google Scholar] [CrossRef]
- Zuykov, M.; Pelletier, E.; Harper, D.A.T. Bivalve mollusks in metal pollution studies: From bioaccumulation to biomonitoring. Chemosphere 2013, 93, 201–208. [Google Scholar] [CrossRef]
- Kerambrun, E.; Rioult, D.; Delahaut, L.; Evariste, L.; Pain-Devin, S.; Auffret, M.; Geffard, A.; David, E. Variations in gene expression levels in four European zebra mussel, Dreissena polymorpha, populations in relation to metal bioaccumulation: A field study. Ecotoxicol. Environ. Saf. 2016, 134, 53–63. [Google Scholar] [CrossRef]
- Paldavičienė, A.; Zaiko, A.; Mazur-Marzec, H.; Razinkovas-Baziukas, A. Bioaccumulation of microcystins in invasive bivalves: A case study from the boreal lagoon ecosystem. Oceanologia 2015, 57, 93–101. [Google Scholar] [CrossRef]
- Preece, E.P.; Moore, B.C.; Hardy, F.J. Ecotoxicology and Environmental Safety Transfer of microcystin from freshwater lakes to Puget Sound, WA and toxin accumulation in marine mussels (Mytilus trossulus). Ecotoxicol. Environ. Saf. 2015, 122, 98–105. [Google Scholar] [CrossRef] [PubMed]
- Lauceri, R.; Austoni, M.; Caviglia, F.; Kamburska, L.; Lami, A.; Morabito, G.; Pflueger, V.; Benavides, A.M.S.; Tonolla, M.; Torzillo, G.; et al. Coupling a bio-accumulator organism and MALDI-TOF MS: An early warning detection system for microcystins in water bodies. J. Appl. Phycol. 2017, 29, 2979–2988. [Google Scholar] [CrossRef]
- Lepoutre, A.; Grilot, T.; Jean, S.; Geffard, A.; Lance, E. Free or protein-bound microcystin accumulation by freshwater bivalves as a tool to evaluate water contamination by microcystin-producing cyanobacteria? Appl. Sci. 2020, 10, 3426. [Google Scholar] [CrossRef]
- Amorim, Á.; Vasconcelos, V. Dynamics of microcystins in the mussel Mytilus galloprovincialis. Toxicon 1999, 37, 1041–1052. [Google Scholar] [CrossRef]
- Pires, L.M.D.; Karlsson, K.M.; Meriluoto, J.A.O.; Kardinaal, E.; Visser, P.M.; Siewertsen, K.; Van Donk, E.; Ibelings, B.W. Assimilation and depuration of microcystin-LR by the zebra mussel, Dreissena polymorpha. Aquat. Toxicol. 2004, 69, 385–396. [Google Scholar] [CrossRef]
- Chorus, I.; Bartram, J. Toxic Cyanobacteria in Water: A Guide to Their Public Health Consequences, Monitoring and Management; WHO: Geneva, Switzerland, 1999. [Google Scholar] [CrossRef]
- Salmaso, N.; Bernard, C.; Humbert, J.-F.; Akçaalan, R.; Albay, M.; Ballot, A.; Catherine, A.; Fastner, J.; Häggqvist, K.; Horecká, M.; et al. Basic Guide to Detection and Monitoring of Potentially Toxic Cyanobacteria. In Handbook of Cyanobacterial Monitoring and Cyanotoxin Analysis; John Wiley & Sons, Ltd.: Chichester, UK, 2017; pp. 46–69. [Google Scholar]
- Tillmanns, A.R.; Pick, F.R.; Aranda-Rodriguez, R. Sampling and analysis of microcystins: Implications for the development of standardized methods. Environ. Toxicol. 2007, 22, 132–143. [Google Scholar] [CrossRef]
- O’Neil, J.M.; Davis, T.W.; Burford, M.A.; Gobler, C.J. The rise of harmful cyanobacteria blooms: The potential roles of eutrophication and climate change. Harmful Algae 2012, 14, 313–334. [Google Scholar] [CrossRef]
- Arlinghaus, R.; Niesar, N. Nutrient digestibility of angling baits for carp, Cyprinus carpio, with implications for groundbait formulation and eutrophication control. Fish. Manag. Ecol. 2005, 12, 91–97. [Google Scholar] [CrossRef]
- Shan, K.; Song, L.; Chen, W.; Li, L.; Liu, L.; Wu, Y.; Jia, Y.; Zhou, Q.; Peng, L. Analysis of environmental drivers influencing interspecific variations and associations among bloom-forming cyanobacteria in large, shallow eutrophic lakes. Harmful Algae 2019, 84, 84–94. [Google Scholar] [CrossRef]
- Seppälä, J.; Ylöstalo, P.; Kaitala, S.; Hällfors, S.; Raateoja, M.; Maunula, P. Ship-of-opportunity based phycocyanin fluorescence monitoring of the filamentous cyanobacteria bloom dynamics in the Baltic Sea. Estuar. Coast. Shelf Sci. 2007, 73, 489–500. [Google Scholar] [CrossRef]
- Ahn, C.Y.; Chung, A.S.; Oh, H.M. Rainfall, phycocyanin, and N:P ratios related to cyanobacterial blooms in a Korean large reservoir. Hydrobiologia 2002, 474, 117–124. [Google Scholar] [CrossRef]
- Vincent, R.K.; Qin, X.; McKay, R.M.L.; Miner, J.; Czajkowski, K.; Savino, J.; Bridgeman, T. Phycocyanin detection from LANDSAT TM data for mapping cyanobacterial blooms in Lake Erie. Remote Sens. Environ. 2004, 89, 381–392. [Google Scholar] [CrossRef]
- Agha, R.; Cirés, S.; Wörmer, L.; Domínguez, J.A.; Quesada, A. Multi-scale strategies for the monitoring of freshwater cyanobacteria: Reducing the sources of uncertainty. Water Res. 2012, 46, 3043–3053. [Google Scholar] [CrossRef]
- Jasser, I.; Callieri, C. Picocyanobacteria. In Handbook of Cyanobacterial Monitoring and Cyanotoxin Analysis; John Wiley & Sons, Ltd.: Chichester, UK, 2017; pp. 19–27. [Google Scholar]
- Izydorczyk, K.; Carpentier, C.; Mrówczyński, J.; Wagenvoort, A.; Jurczak, T.; Tarczyńska, M. Establishment of an Alert Level Framework for cyanobacteria in drinking water resources by using the Algae Online Analyser for monitoring cyanobacterial chlorophyll a. Water Res. 2009, 43, 989–996. [Google Scholar] [CrossRef] [PubMed]
- Harke, M.J.; Steffen, M.M.; Gobler, C.J.; Otten, T.G.; Wilhelm, S.W.; Wood, S.A.; Paerl, H.W. A review of the global ecology, genomics, and biogeography of the toxic cyanobacterium, Microcystis spp. Harmful Algae 2016, 54, 4–20. [Google Scholar] [CrossRef]
- Martin-Laurent, F.; Pinto, E.; Wilhelm, S.; Marie, B.; Manach, L.S.; Le Manach, S.; Duval, C.; Marie, A.; Djediat, C.; Catherine, A.; et al. Global Metabolomic Characterizations of Microcystis spp. Highlights Clonal Diversity in Natural Bloom-Forming Populations and Expands Metabolite Structural Diversity. Front. Microbiol. 2019, 10, 791. [Google Scholar] [CrossRef]
- Sivonen, K. Cyanobacterial Toxins. In Encyclopedia of Microbiology; Elsevier: Amsterdam, The Netherlands, 2009; pp. 290–307. [Google Scholar]
- Welker, M.; Hoeg, S.; Steinberg, C. Hepatotoxic cyanobacteria in the shallow lake Müggelsee. In Shallow Lakes ’98; Walz, N., Nixdorf, B., Eds.; Springer Netherlands: Dordrecht, The Netherlands, 1999; pp. 263–268. ISBN 978-94-017-2986-4. [Google Scholar]
- Phillips, D.J.H.; Segar, D.A. Use of bio-indicators in monitoring conservative contaminants: Programme design imperatives. Mar. Pollut. Bull. 1986, 17, 10–17. [Google Scholar] [CrossRef]
- Swhalb, A.; Pusch, M. Horizontal and vertical movements of unionid mussels in a lowland river. J. North Am. Benthol. Soc. 2007, 26, 261–272. [Google Scholar] [CrossRef]
- Lurman, G.; Walter, J.; Hoppeler, H.H. Seasonal changes in the behaviour and respiration physiology of the freshwater duck mussel, anodonta anatina. Clin. Cancer Res. 2014, 217, 235–243. [Google Scholar] [CrossRef]
- Besse, J.P.; Geffard, O.; Coquery, M. Relevance and applicability of active biomonitoring in continental waters under the Water Framework Directive. TrAC—Trends Anal. Chem. 2012, 36, 113–127. [Google Scholar] [CrossRef]
- Palais, F.; Dedourge-Geffard, O.; Beaudon, A.; Pain-Devin, S.; Trapp, J.; Geffard, O.; Noury, P.; Gourlay-Francé, C.; Uher, E.; Mouneyrac, C.; et al. One-year monitoring of core biomarker and digestive enzyme responses in transplanted zebra mussels (Dreissena polymorpha). Ecotoxicology 2012, 21, 888–905. [Google Scholar] [CrossRef] [PubMed]
- Kerambrun, E.; Palos Ladeiro, M.; Bigot-Clivot, A.; Dedourge-Geffard, O.; Dupuis, E.; Villena, I.; Aubert, D.; Geffard, A. Zebra mussel as a new tool to show evidence of freshwater contamination by waterborne Toxoplasma gondii. J. Appl. Microbiol. 2016, 120, 498–508. [Google Scholar] [CrossRef] [PubMed]
- Ludovisi, A.; Goretti, E.; Pallottini, M.; Lucentini, L.; Pizzirani, C.; Vizzini, S.; Mancinelli, G. Stable isotope analysis reveals trophic segregation between the invasive zebra mussel Dreissena polymorpha and the native duck mussel Anodonta anatina in Lake Trasimeno (Italy). Hydrobiologia 2022, 849, 2091–2108. [Google Scholar] [CrossRef]
- Gaget, V.; Humpage, A.R.; Huang, Q.; Monis, P.; Brookes, J.D. Benthic cyanobacteria: A source of cylindrospermopsin and microcystin in Australian drinking water reservoirs. Water Res. 2017, 124, 454–464. [Google Scholar] [CrossRef]
- Quiblier, C.; Wood, S.; Echenique-Subiabre, I.; Heath, M.; Villeneuve, A.; Humbert, J.-F. A review of current knowledge on toxic benthic freshwater cyanobacteria—Ecology, toxin production and risk management. Water Res. 2013, 47, 5464–5479. [Google Scholar] [CrossRef]
- Henao, E.; Rzymski, P.; Waters, M.N. A Review on the Study of Cyanotoxins in Paleolimnological Research: Current Knowledge and Future Needs. Toxins 2019, 12, 6. [Google Scholar] [CrossRef]
- Bormans, M.; Savar, V.; Legrand, B.; Mineaud, E.; Robert, E.; Lance, E.; Amzil, Z. Cyanobacteria and cyanotoxins in estuarine water and sediment. Aquat. Ecol. 2020, 54, 625–640. [Google Scholar] [CrossRef]
- Winkel, E.T.; Davids, C. Food selection by Dreissena polymorpha Pallas (Mollusca: Bivalvia). Freshw. Biol. 1982, 12, 553–558. [Google Scholar] [CrossRef]
- Baker, P.D.; Steffensen, D.A.; Humpage, A.R.; Nicholson, B.C.; Falconer, I.R.; Lanthois, B.; Fergusson, K.M.; Saint, C.P. Preliminary evidence of toxicity associated with the benthic cyanobacterium Phormidium in South Australia. Environ. Toxicol. 2001, 16, 506–511. [Google Scholar] [CrossRef]
- Barda, I.; Kankaanpää, H.; Purina, I.; Balode, M.; Sjövall, O.; Meriluoto, J. Bioaccumulation of hepatotoxins—A considerable risk in the Latvian environment. Environ. Pollut. 2015, 196, 313–320. [Google Scholar] [CrossRef] [PubMed]
- Pham, T.L.; Shimizu, K.; Dao, T.S.; Hong-Do, L.C.; Utsumi, M. Microcystin uptake and biochemical responses in the freshwater clam Corbicula leana P. Exposed to toxic and non-toxic Microcystis aeruginosa: Evidence of tolerance to cyanotoxins. Toxicol. Rep. 2015, 2, 88–98. [Google Scholar] [CrossRef] [PubMed]
- Lance, E.; Josso, C.; Dietrich, D.; Ernst, B.; Paty, C.; Senger, F.; Bormans, M.; Gérard, C. Histopathology and microcystin distribution in Lymnaea stagnalis (Gastropoda) following toxic cyanobacterial or dissolved microcystin-LR exposure. Aquat. Toxicol. 2010, 98, 211–220. [Google Scholar] [CrossRef]
- Pflugmacher, S.; Wiegand, C.; Oberemm, A.; Beattie, K.A.; Krause, E.; Codd, G.A.; Steinberg, C.E.W. Identification of an enzymatically formed glutathione conjugate of the cyanobacterial hepatotoxin microcystin-LR: The first step of detoxication. Biochim. Biophys. Acta—Gen. Subj. 1998, 1425, 527–533. [Google Scholar] [CrossRef]
- Contardo-Jara, V.; Otterstein, S.K.B.; Downing, S.; Downing, T.G.; Pflugmacher, S. Response of antioxidant and biotransformation systems of selected freshwater mussels (Dreissena polymorpha, Anadonta cygnea, Unio tumidus, and Corbicula javanicus) to the cyanobacterial neurotoxin β-N-methylamino-L-alanine. Toxicol. Environ. Chem. 2014, 96, 451–465. [Google Scholar] [CrossRef]
- Chen, L.; Giesy, J.P.; Adamovsky, O.; Svirčev, Z.; Meriluoto, J.; Codd, G.A.; Mijovic, B.; Shi, T.; Tuo, X.; Li, S.C.; et al. Challenges of using blooms of Microcystis spp. in animal feeds: A comprehensive review of nutritional, toxicological and microbial health evaluation. Sci. Total Environ. 2021, 764, 142319. [Google Scholar] [CrossRef]
- Lepoutre, A.; Milliote, N.; Bonnard, M.; Palos-Ladeiro, M.; Rioult, D.; Bonnard, I.; Bastien, F.; Faassen, E.; Geffard, A.; Lance, E. Genotoxic and cytotoxic effects on the immune cells of the freshwater bivalve Dreissena polymorpha exposed to the environmental neurotoxin BMAA. Toxins 2018, 10, 106. [Google Scholar] [CrossRef]
Disclaimer/Publisher’s Note: The statements, opinions and data contained in all publications are solely those of the individual author(s) and contributor(s) and not of MDPI and/or the editor(s). MDPI and/or the editor(s) disclaim responsibility for any injury to people or property resulting from any ideas, methods, instructions or products referred to in the content. |
© 2025 by the authors. Licensee MDPI, Basel, Switzerland. This article is an open access article distributed under the terms and conditions of the Creative Commons Attribution (CC BY) license (https://creativecommons.org/licenses/by/4.0/).
Share and Cite
Lance, E.; Lepoutre, A.; Brient, L.; Maurin, N.; Guillon, E.; Geffard, A.; Amon-Moreau, D. Survey of Microcystin-Producing Cyanobacteria in French Lakes of Various Trophic Status Using Environmental and Cyanobacterial Parameters and an Active Mussel Biomonitoring. Toxins 2025, 17, 245. https://doi.org/10.3390/toxins17050245
Lance E, Lepoutre A, Brient L, Maurin N, Guillon E, Geffard A, Amon-Moreau D. Survey of Microcystin-Producing Cyanobacteria in French Lakes of Various Trophic Status Using Environmental and Cyanobacterial Parameters and an Active Mussel Biomonitoring. Toxins. 2025; 17(5):245. https://doi.org/10.3390/toxins17050245
Chicago/Turabian StyleLance, Emilie, Alexandra Lepoutre, Luc Brient, Nicolas Maurin, Emmanuel Guillon, Alain Geffard, and Dominique Amon-Moreau. 2025. "Survey of Microcystin-Producing Cyanobacteria in French Lakes of Various Trophic Status Using Environmental and Cyanobacterial Parameters and an Active Mussel Biomonitoring" Toxins 17, no. 5: 245. https://doi.org/10.3390/toxins17050245
APA StyleLance, E., Lepoutre, A., Brient, L., Maurin, N., Guillon, E., Geffard, A., & Amon-Moreau, D. (2025). Survey of Microcystin-Producing Cyanobacteria in French Lakes of Various Trophic Status Using Environmental and Cyanobacterial Parameters and an Active Mussel Biomonitoring. Toxins, 17(5), 245. https://doi.org/10.3390/toxins17050245