Extensive Variation in Thermal Responses and Toxin Content Among 40 Strains of the Cold-Water Diatom Pseudo-nitzschia seriata—In a Global Warming Context


Abstract
1. Introduction
2. Results
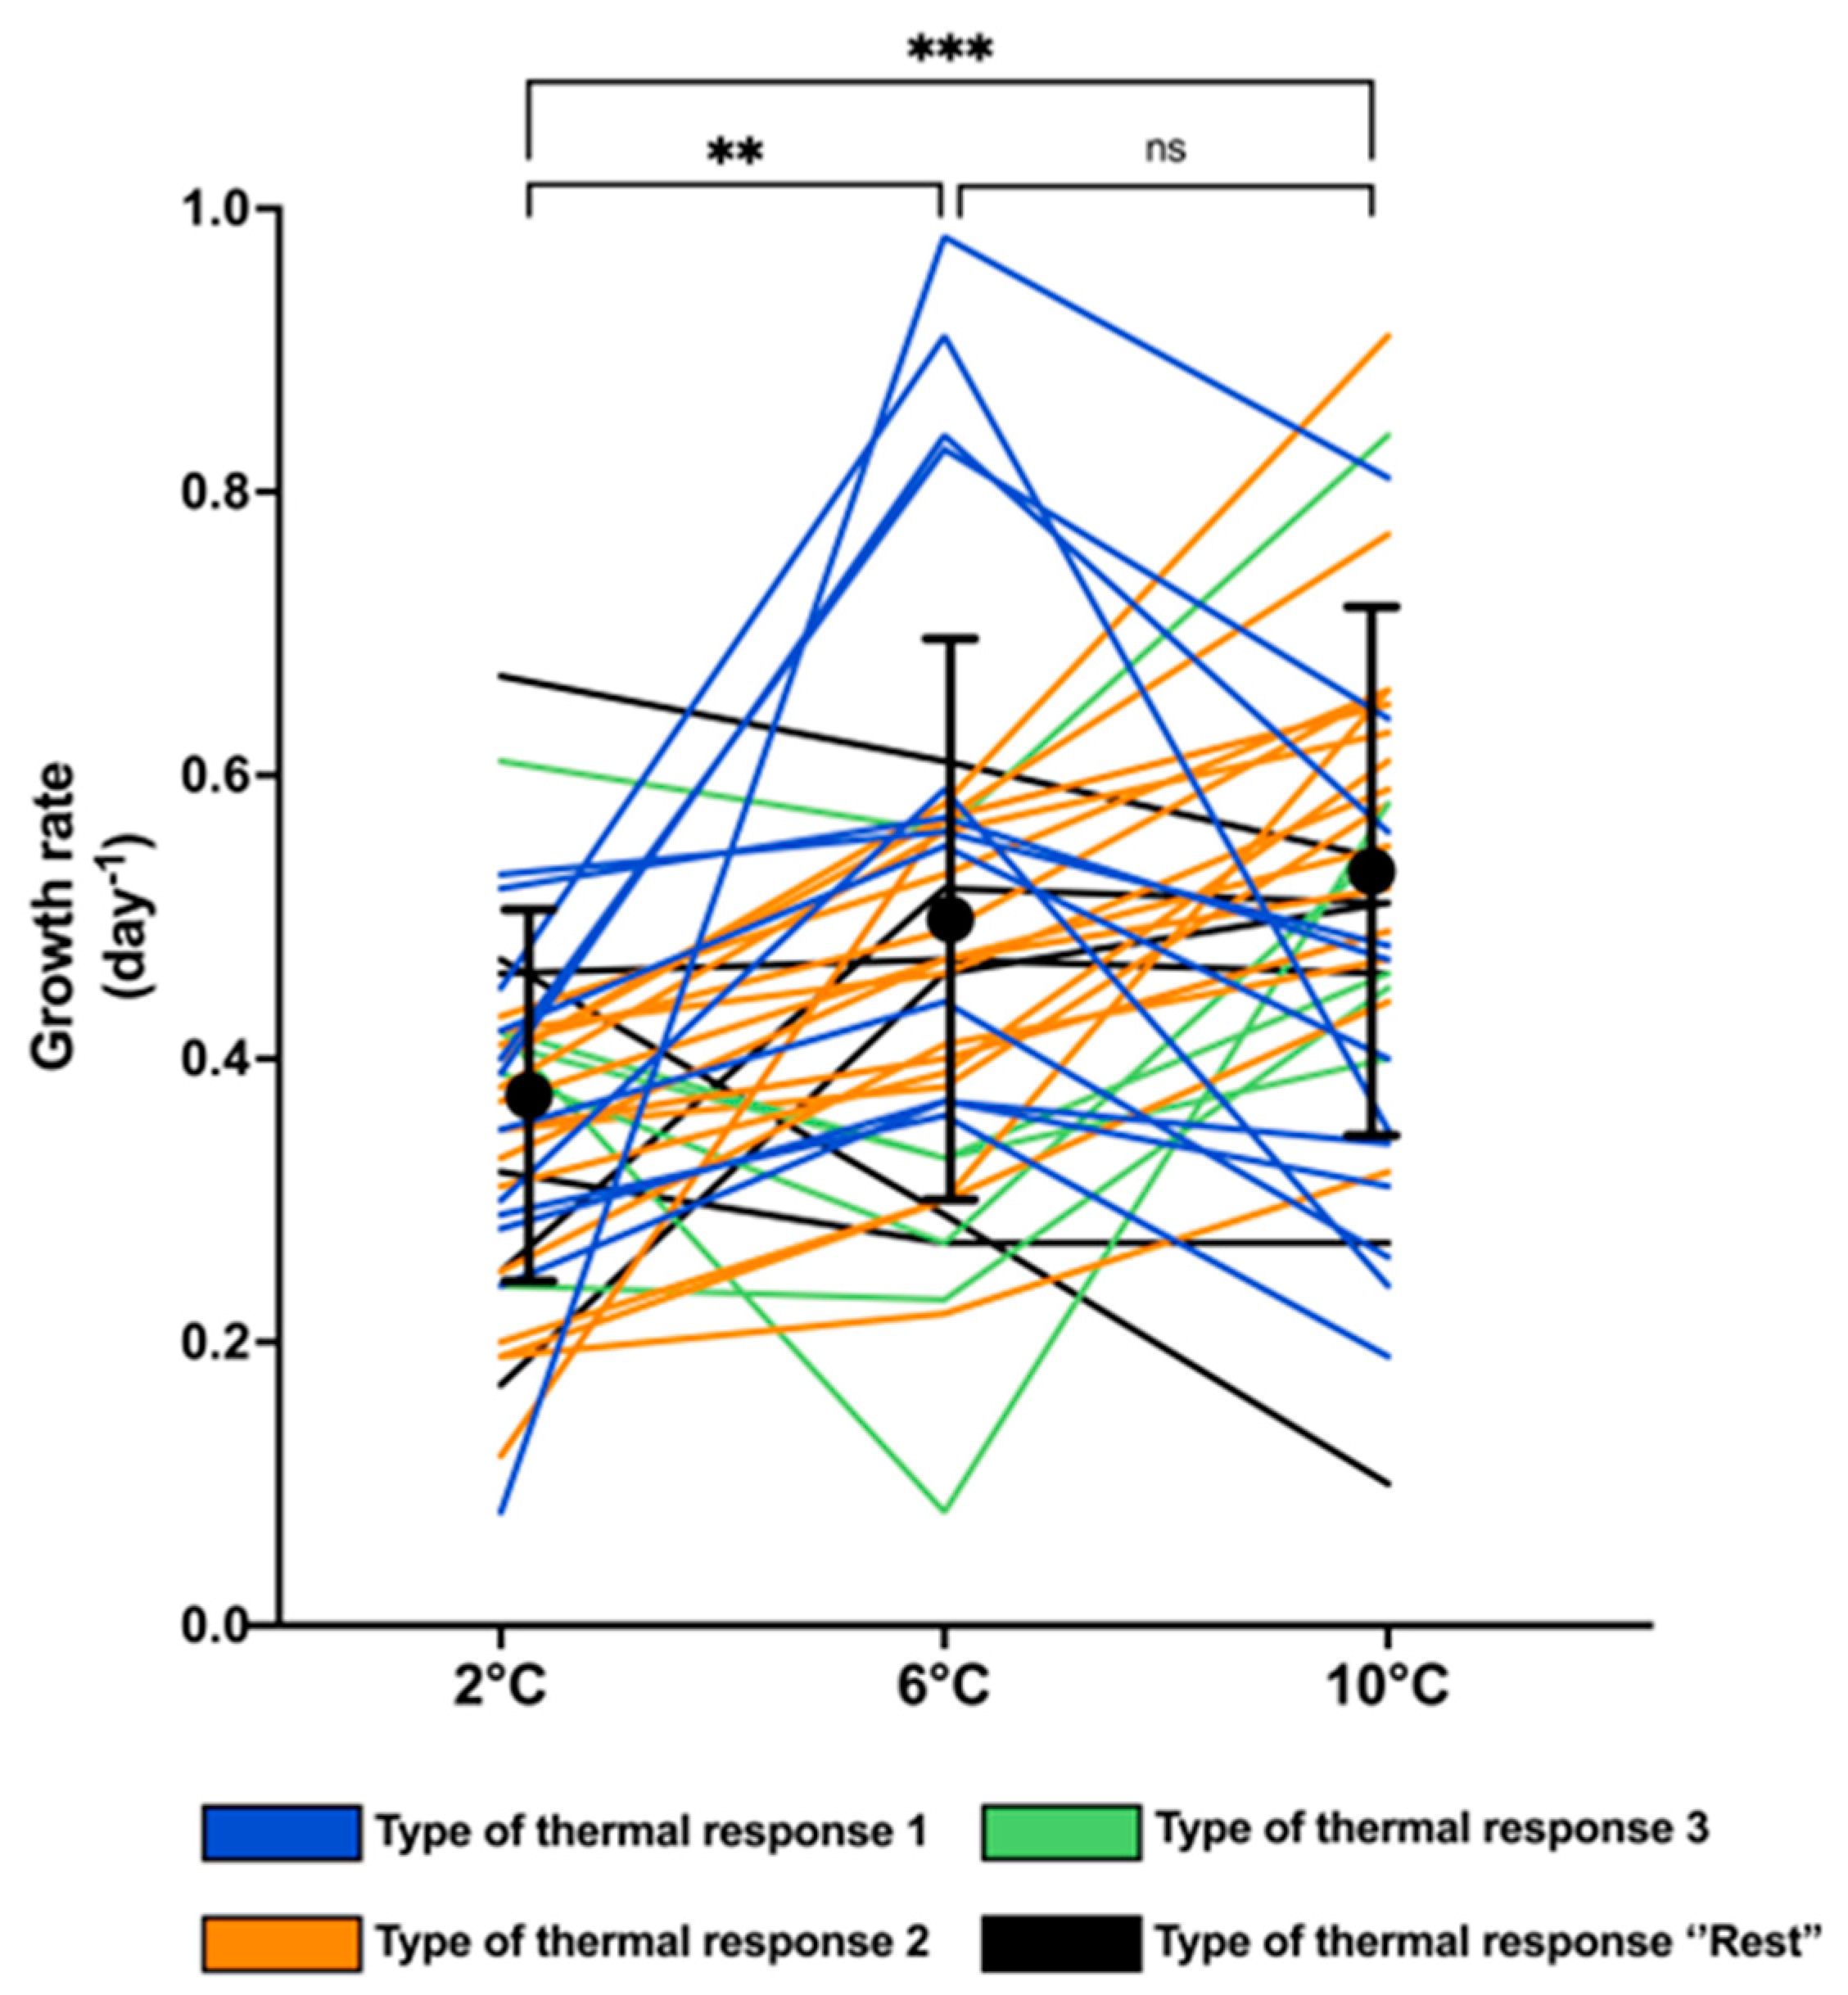
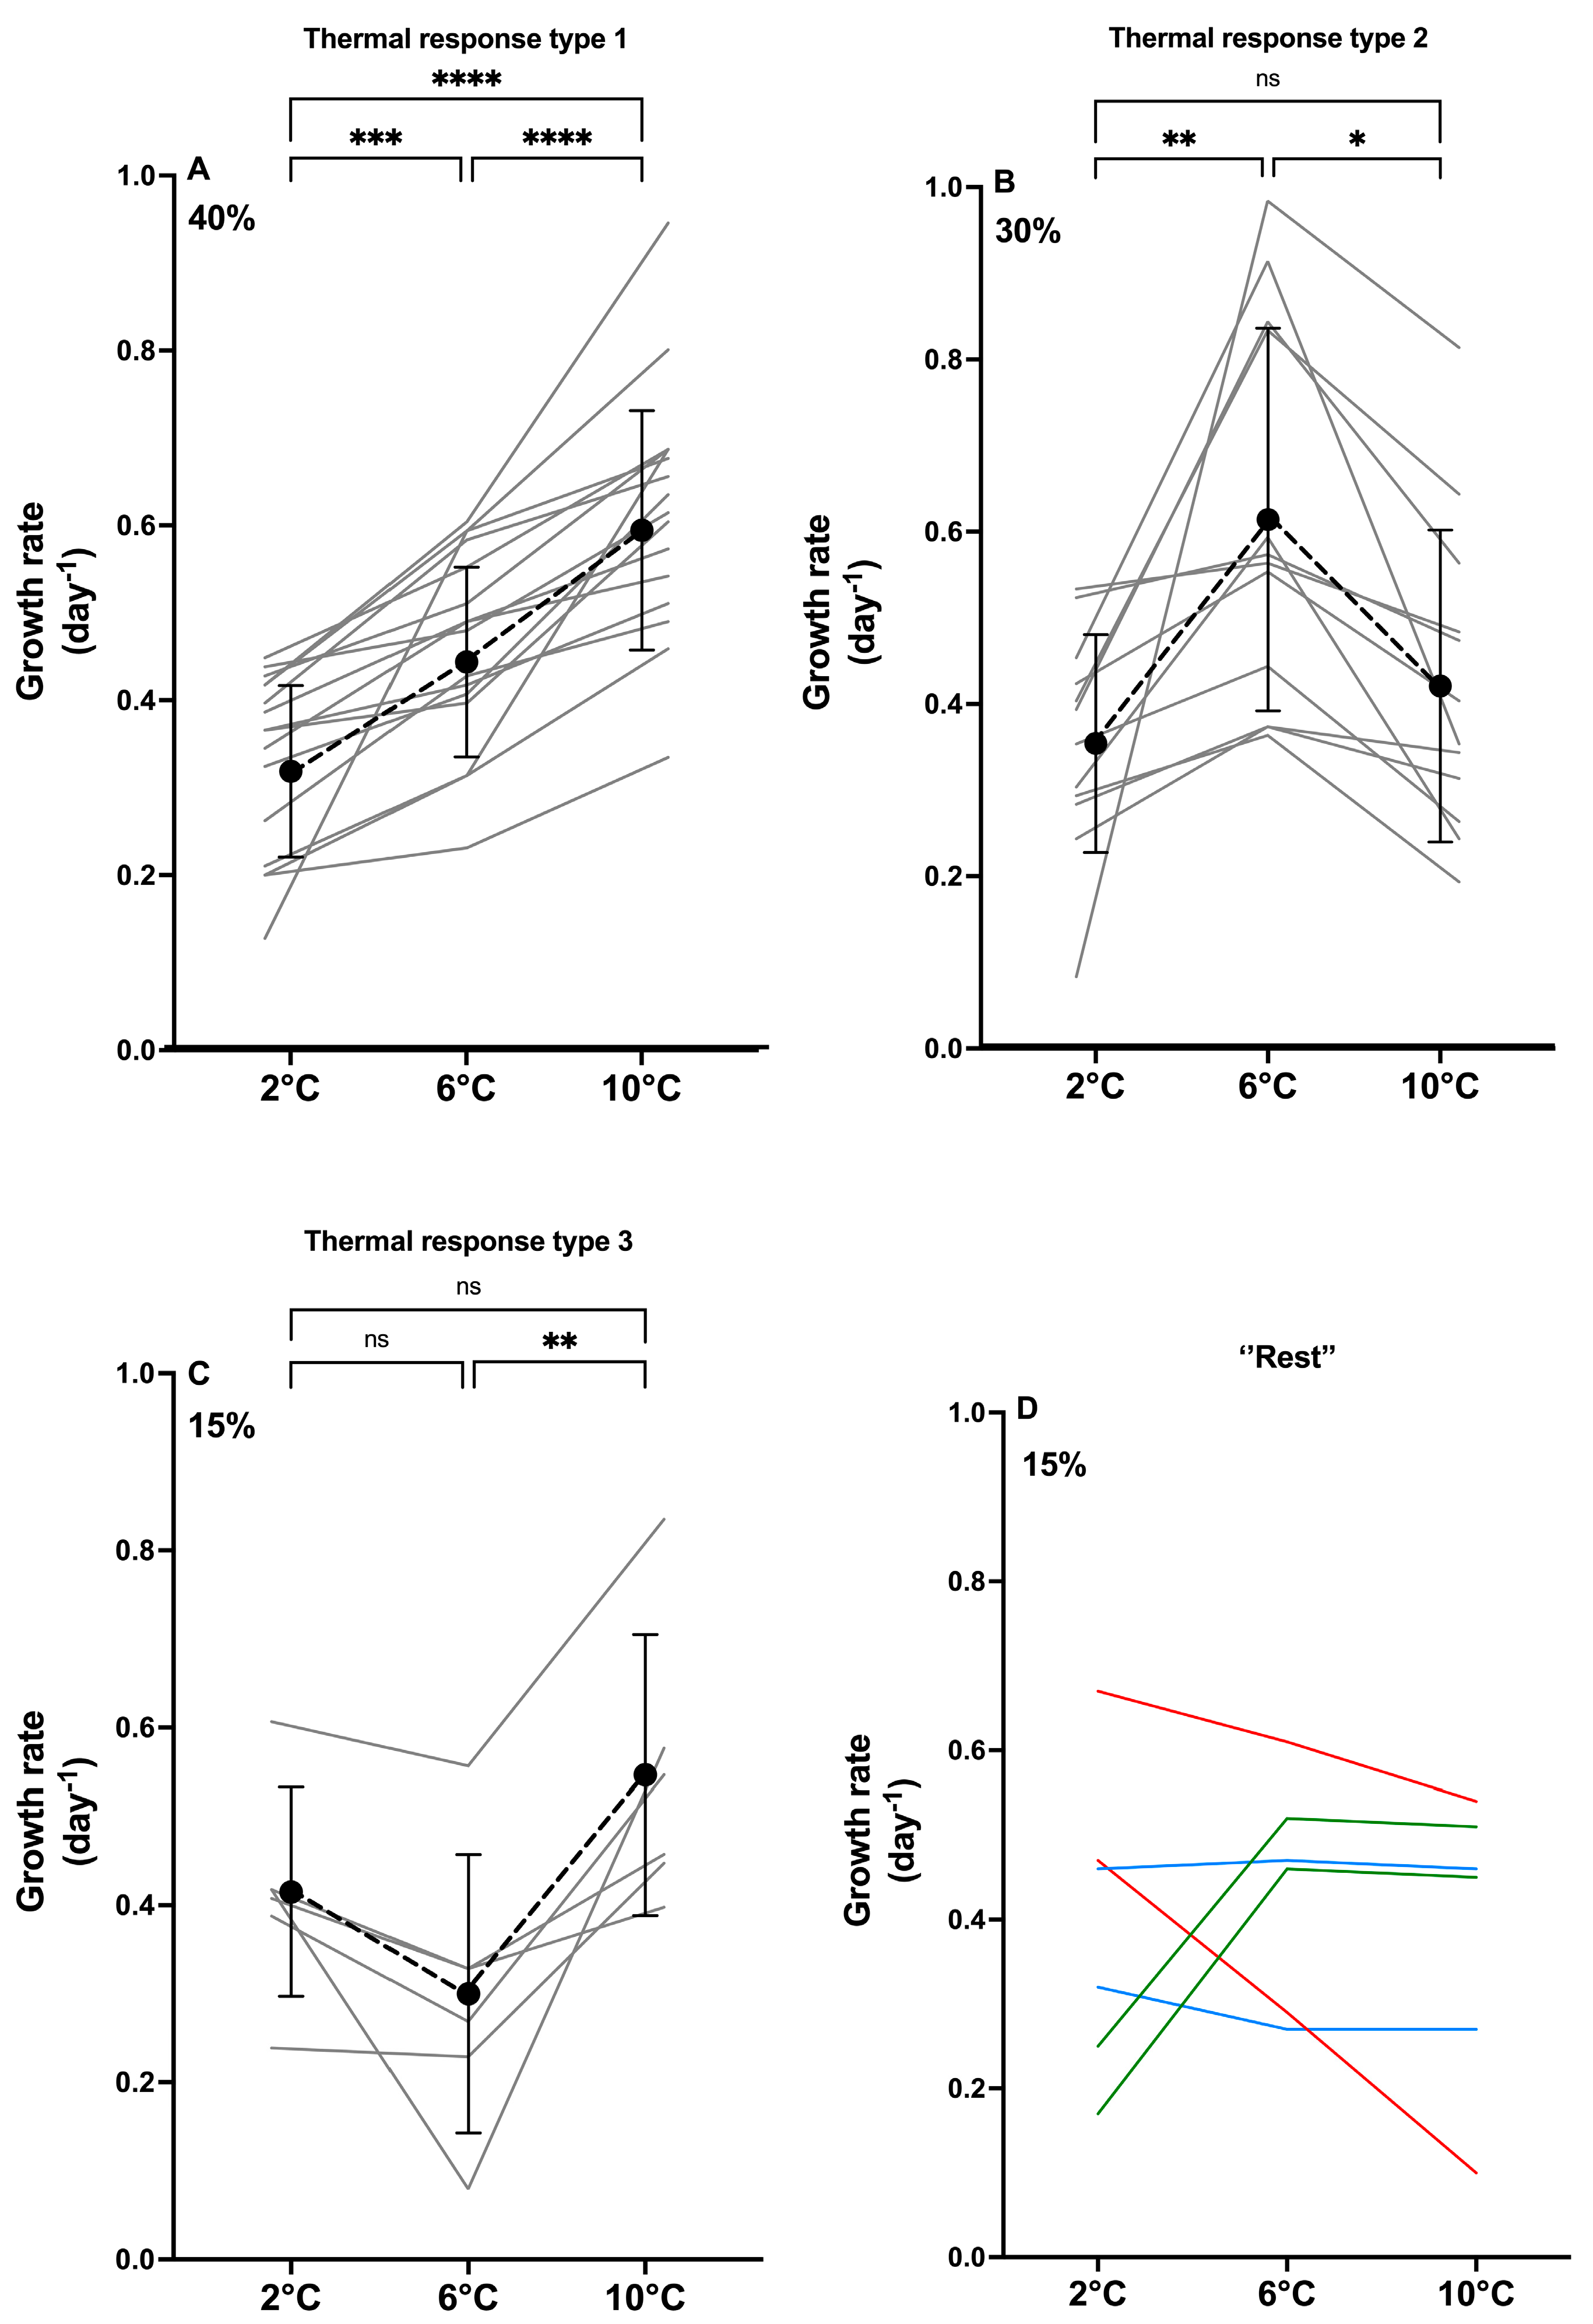
2.1. Growth Traits
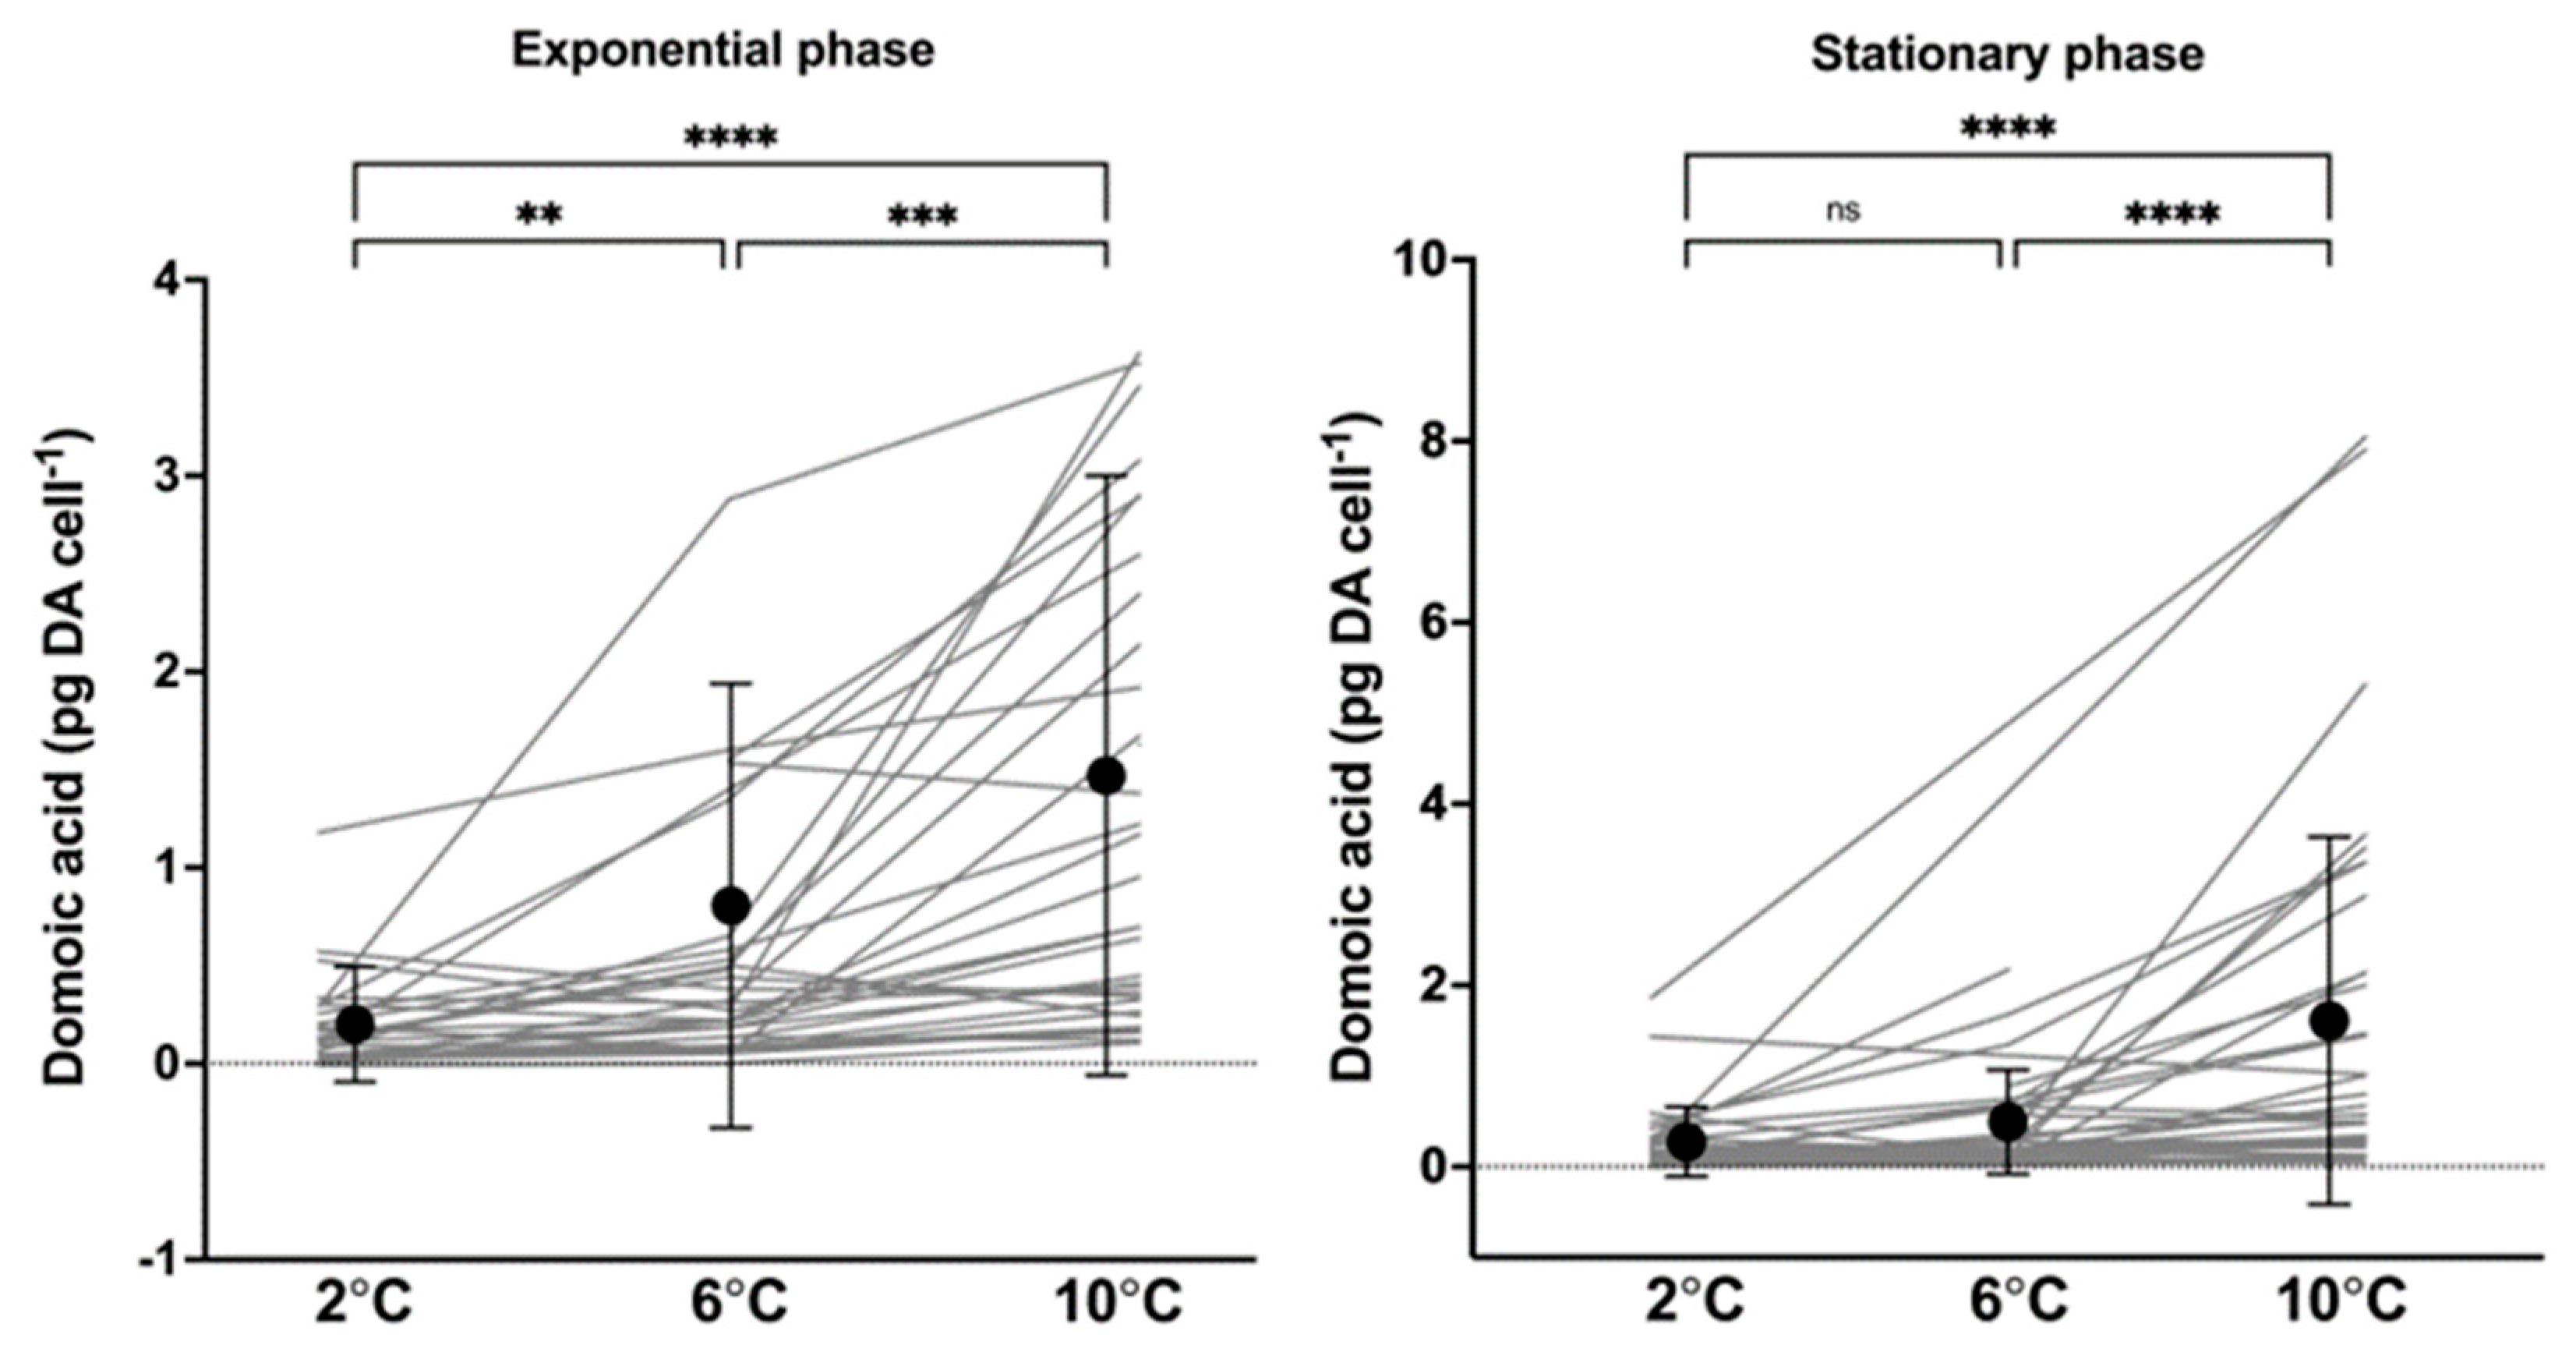
2.2. Cellular Toxin Content
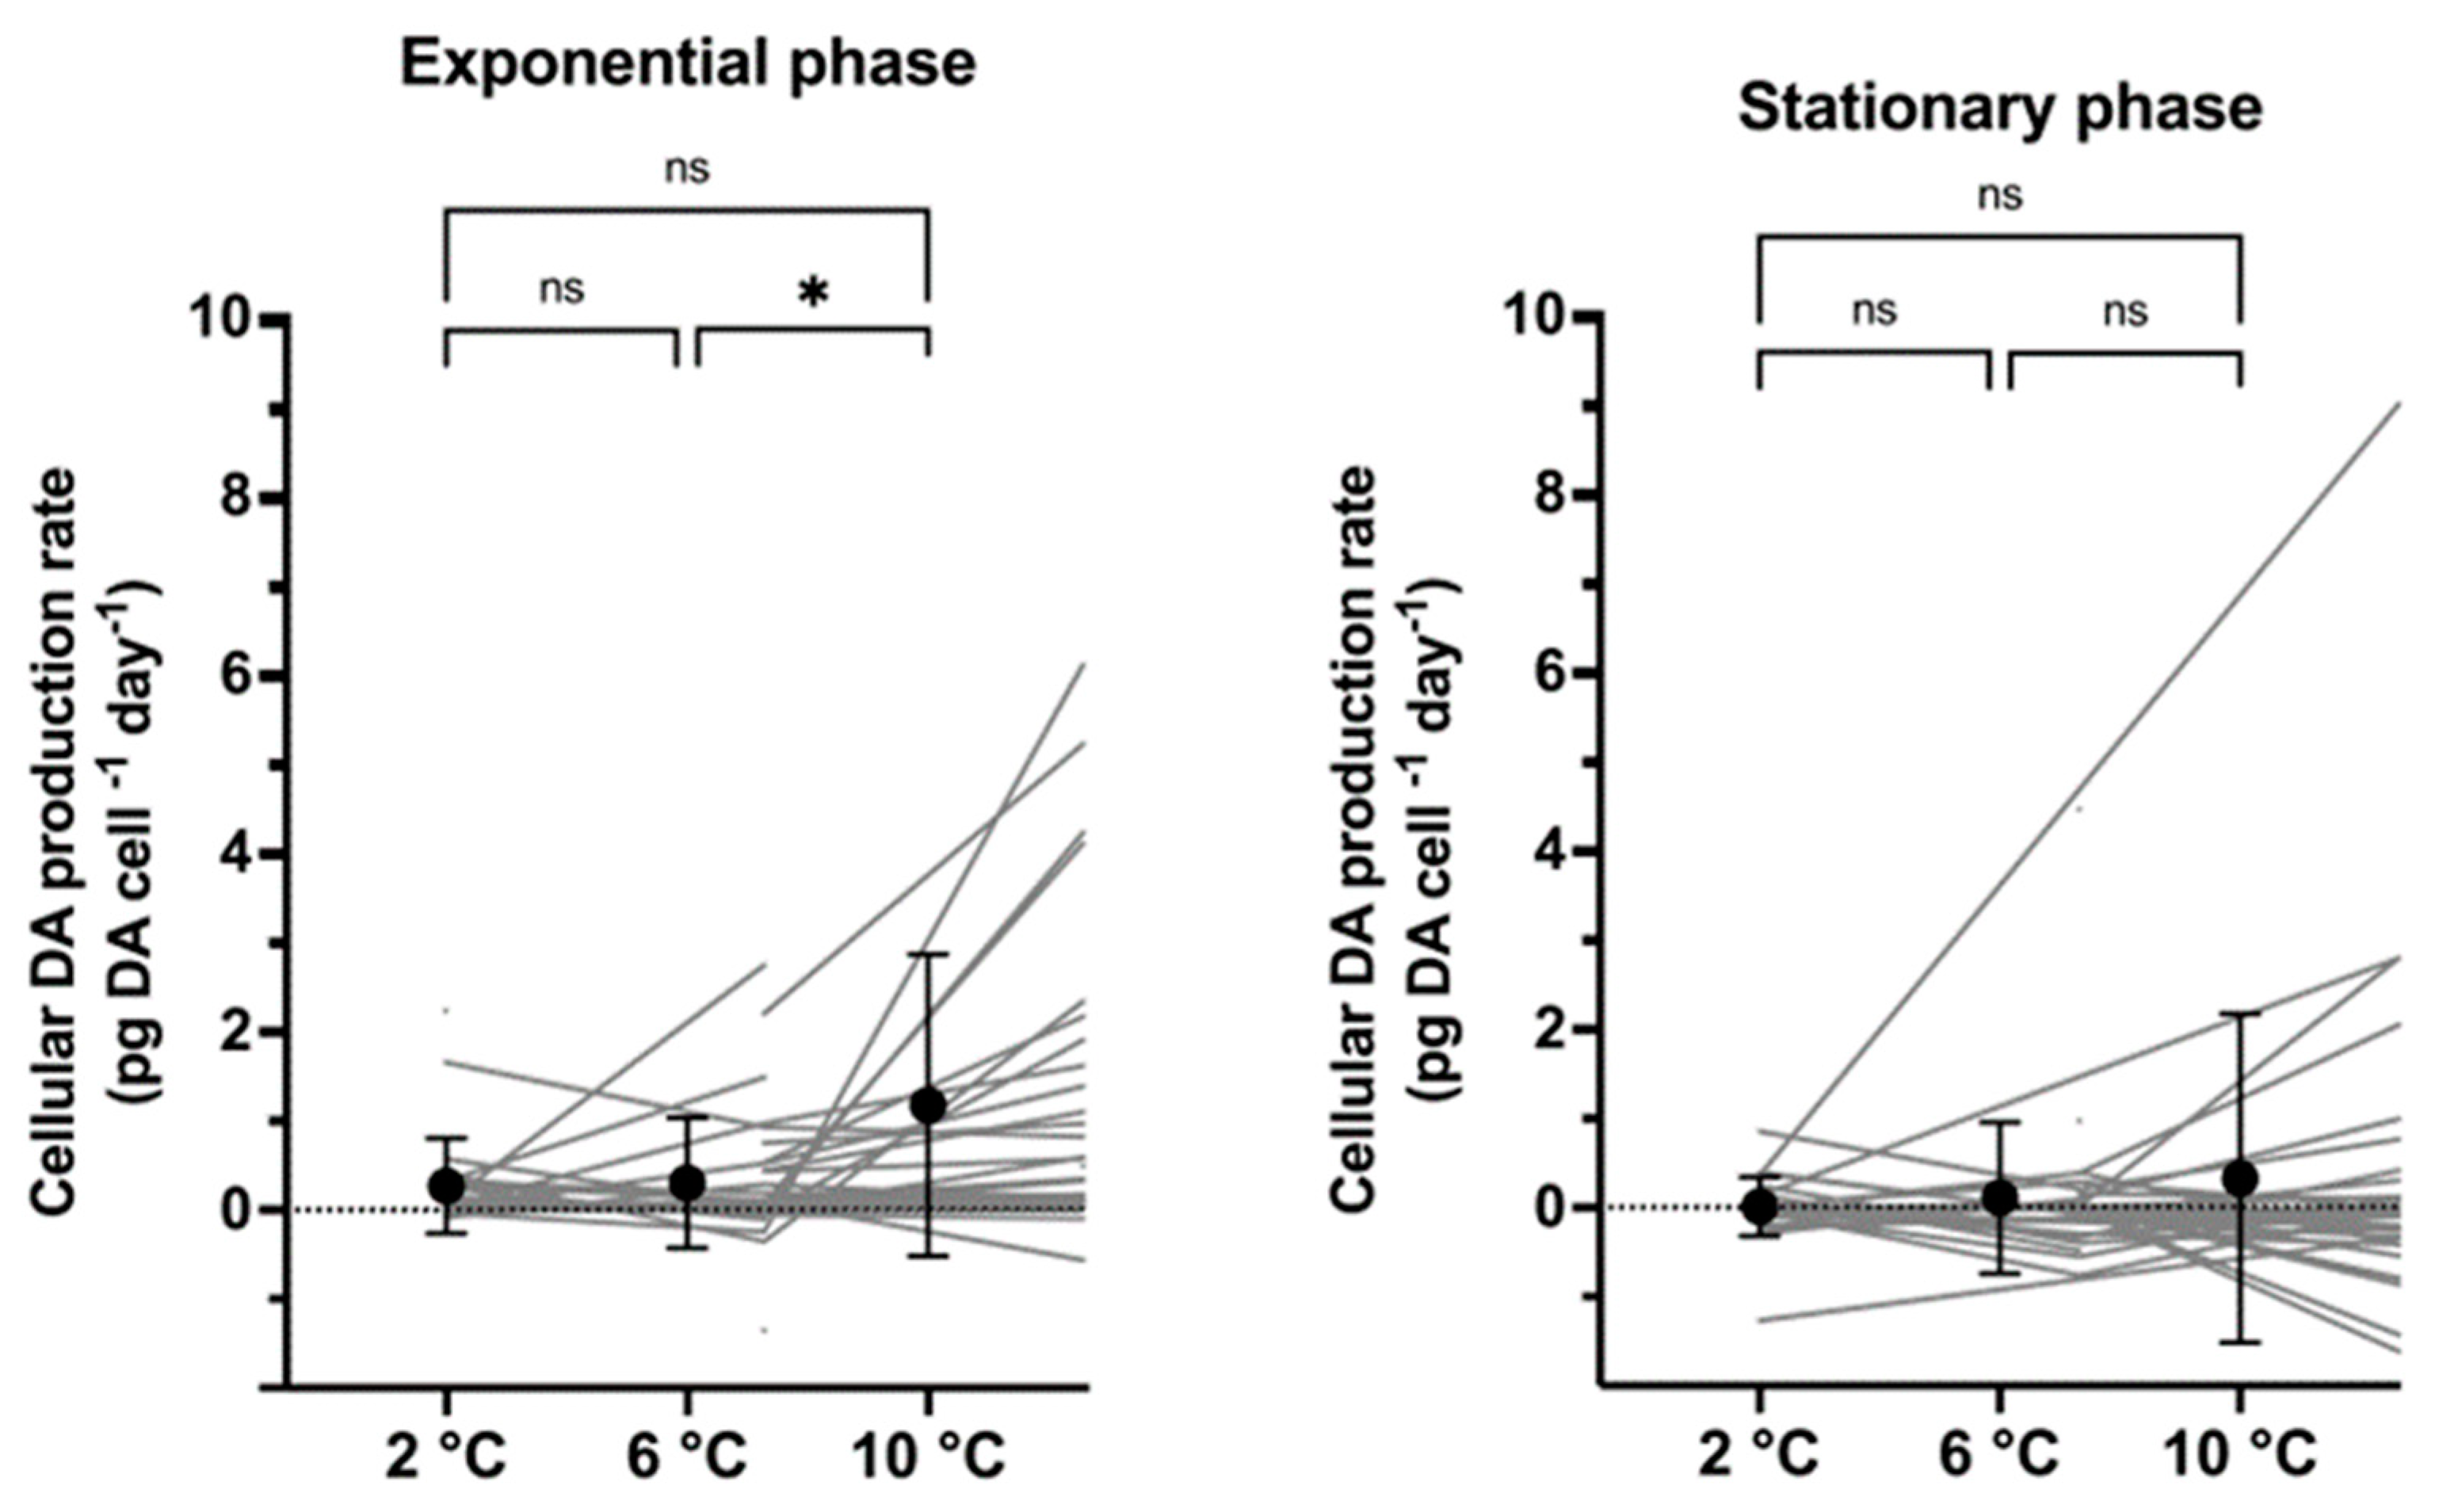
2.3. Cellular Toxin Production Rates
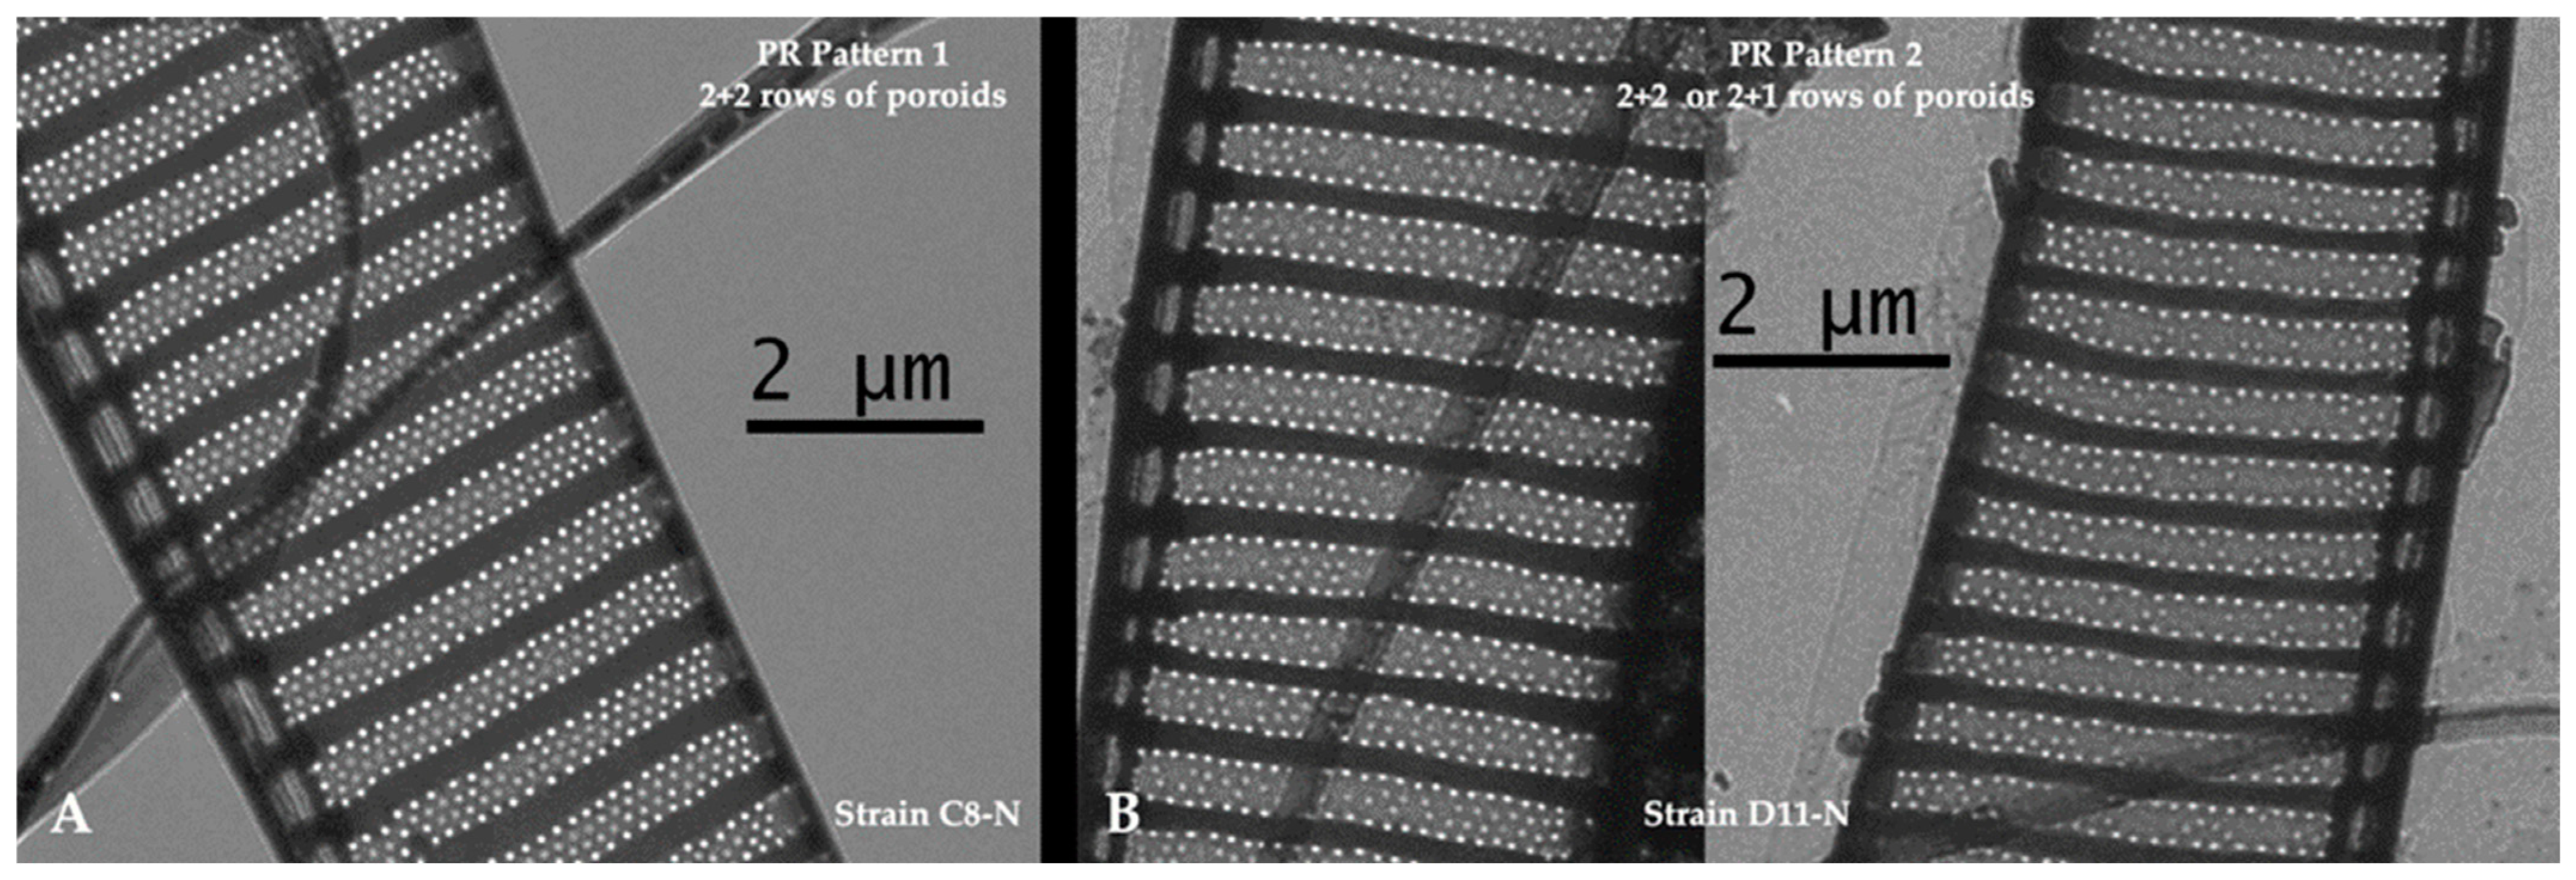
2.4. Morphological Diversity
2.5. Genetic Diversity
3. Discussion
4. Conclusions
5. Materials and Methods
5.1. The Strains: Isolation and Cultivation
5.2. Morphological Assessment and Species Identification
5.3. Experimental Set-Up
5.4. Sampling for Cell Densities
5.5. Toxin Harvesting and Analyses
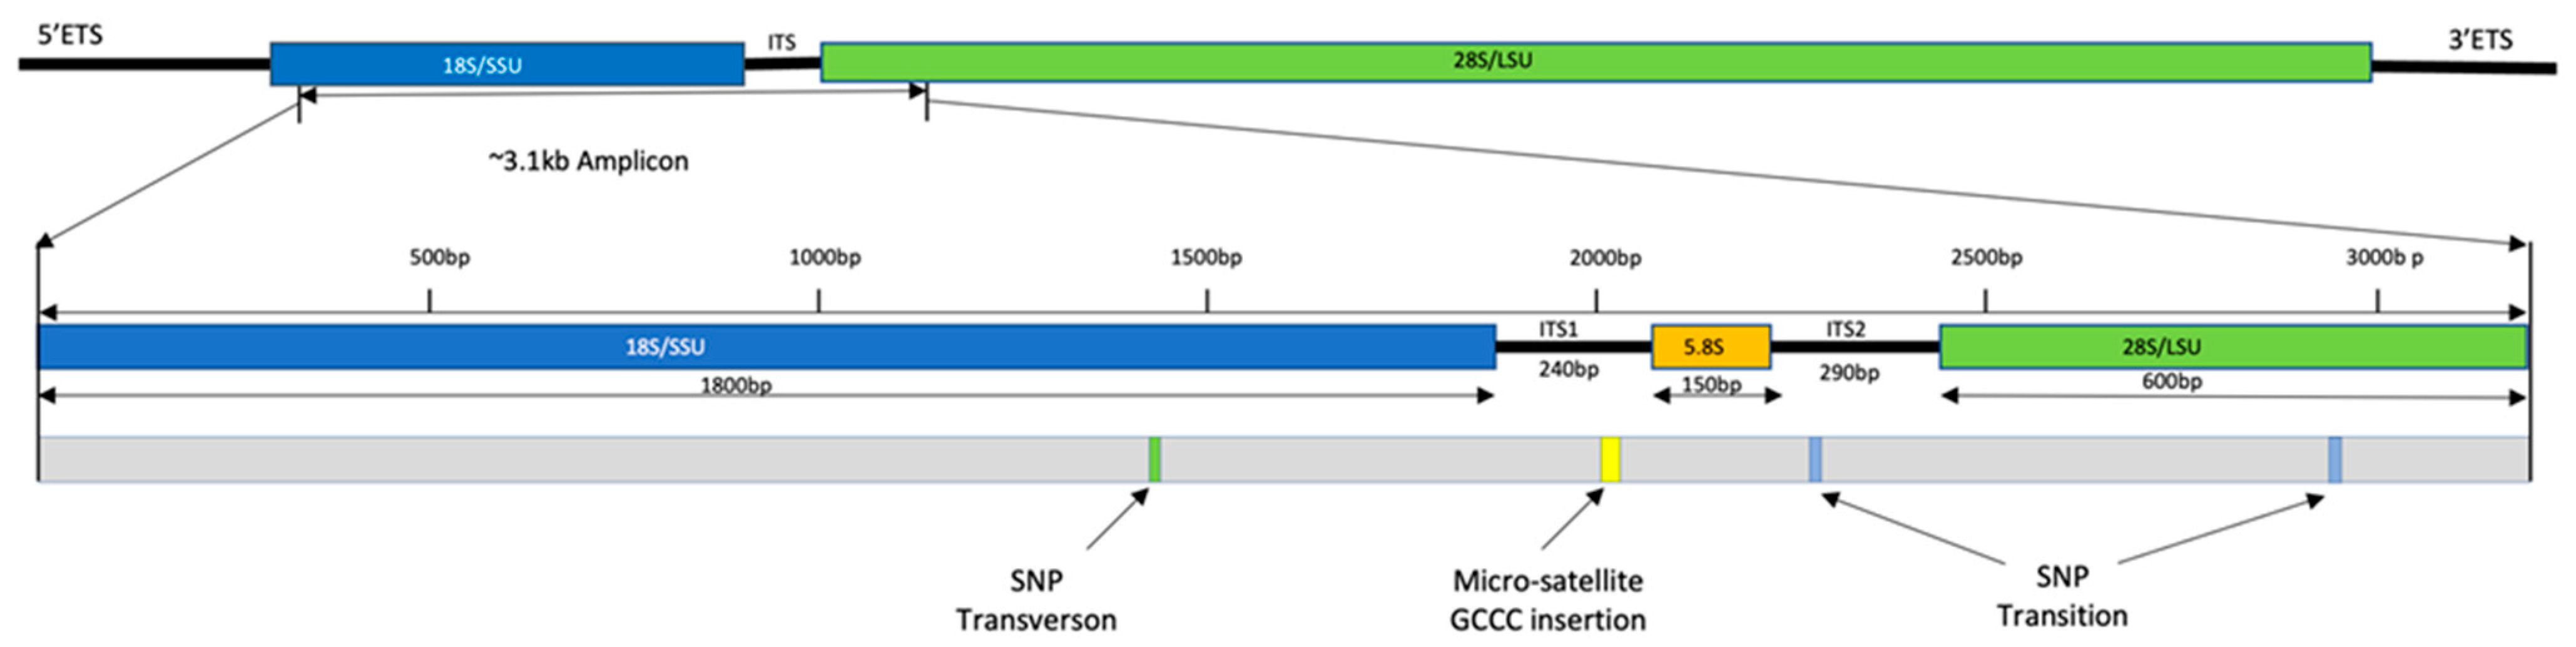
5.6. Molecular Data
5.7. Data Analyses and Statistical Analyses
Supplementary Materials
Author Contributions
Funding
Institutional Review Board Statement
Informed Consent Statement
Data Availability Statement
Conflicts of Interest
References
- Field, C.B.; Behrenfeld, M.J.; Randerson, J.T.; Falkowski, P. Primary production of the biosphere: Integrating terrestrial and ocean components. Science 1998, 281, 237–240. [Google Scholar] [CrossRef] [PubMed]
- Yool, A.; Tyrell, T. Role of diatoms in regulating the ocean’s silicon cycle. Glob. Biogeochem. Cycles 2003, 17, 1103. [Google Scholar] [CrossRef]
- Armbrust, E.V. The life of diatoms in the world’s oceans. Nature 2009, 459, 185–192. [Google Scholar] [CrossRef] [PubMed]
- Abraham, J.P.; Baringer, M.; Bindoff, N.L.; Boyer, T.; Cheng, L.J.; Church, J.A.; Conroy, J.L.; Domingues, C.M.; Fasullo, J.T.; Gilson, J.; et al. A review of global ocean temperature observations: Implications for ocean heat content estimates and climate change. Rev. Geophys. 2013, 51, 450–483. [Google Scholar] [CrossRef]
- Serreze, M.C.; Francis, J. The Arctic Amplification debate. Clim. Change 2006, 76, 241–264. [Google Scholar] [CrossRef]
- Steinacher, M.; Joos, F.; Frölicher, T.L.; Bopp, L.; Cadule, P.; Cocco, V.; Doney, S.C.; Gehlen, M.; Lindsay, K.; Moore, J.K.; et al. Projected 21st century decrease in marine productivity: A multi-model analysis. Biogeosciences 2010, 7, 979–1005. [Google Scholar] [CrossRef]
- Edwards, M.; Richardson, A.J. Impact of climate change on marine pelagic phenology and trophic mismatch. Nature 2004, 430, 881–884. [Google Scholar] [CrossRef]
- Brander, K. Impacts of climate change on fisheries. J. Mar. Syst. 2010, 79, 389–402. [Google Scholar] [CrossRef]
- Doney, S.C.; Ruckelshaus, M.; Duffy, J.E.; Barry, J.P.; Chan, F.; English, C.A.; Galindo, H.M.; Grebmeier, J.M.; Hollowed, A.B.; Knowlton, N.; et al. Climate change impacts on marine ecosystems. Annu. Rev. Mar. Sci. 2012, 4, 11–37. [Google Scholar] [CrossRef]
- Oliver, E.C.J.; Burrows, M.T.; Donat, M.G.; Sen Gupta, A.; Alexander, L.V.; Perkins-Kirkpatrick, S.E.; Benthuysen, J.A.; Hobday, A.J.; Holbrook, N.J.; Moore, P.J.; et al. Projected Marine Heatwaves in the 21st Century and the Potential for Ecological Impact. Front. Mar. Sci. 2019, 6, 734. [Google Scholar] [CrossRef]
- Cavole, L.M.; Demko, A.M.; Diner, R.E.; Giddings, A.; Koester, I.; Pagniello, C.M.L.S.; Paulsen, M.-L.; Ramirez-Valdez, A.; Schwenck, S.M.; Yen, N.K.; et al. Biological impacts of the 2013–2015 warm-water anomaly in the Northeast Pacific: Winners, losers, and the future. Oceanography 2016, 29, 273–285. [Google Scholar] [CrossRef]
- Smale, D.A.; Wernberg, T.; Oliver, E.C.J.; Thomsen, M.; Harvey, B.P.; Straub, S.C.; Burrows, M.T.; Alexander, L.V.; Benthuysen, J.A.; Donat, M.G.; et al. Marine heatwaves threaten global biodiversity and the provision of ecosystem services. Nat. Clim. Change 2019, 9, 306–312. [Google Scholar] [CrossRef]
- McCabe, R.M.; Hickey, B.M.; Kudela, R.M.; Lefebvre, K.A.; Adams, N.G.; Bill, B.D.; Gulland, F.M.; Thomson, R.E.; Cochlan, W.P.; Trainer, V.L. An unprecedented coastwide toxic algal bloom linked to anomalous ocean conditions. Geophys. Res. Lett. 2016, 43, 10366–10376. [Google Scholar] [CrossRef]
- Ryan, J.P.; Kudela, R.M.; Birch, J.M.; Blum, M.; Bowers, H.A.; Chavez, F.P.; Doucette, G.J.; Hayashi, K.; Marin III, R.; Mikulski, C.M.; et al. Causality of an extreme harmful algal bloom in Monterey Bay, California, during the 2014–2016 northeast Pacific warm anomaly. Geophysical. Res. Lett. 2017, 44, 5571–5579. [Google Scholar] [CrossRef]
- Cardinale, B.J.; Srivastava, D.S.; Duffy, J.E.; Wright, J.P.; Downing, A.L.; Sankaran, M.; Jouseau, C. Effects of biodiversity on the functioning of trophic groups and ecosystems. Nature 2006, 443, 989–992. [Google Scholar] [CrossRef]
- Ptacnik, R.; Solmini, A.G.; Andersen, T.; Tamminen, T.; Brettum, P.; Lepisto, L.; Willén, E.; Rekolainen, S. Diversity predicts stability and resource use efficiency in natural phytoplankton communities. Proc. Natl. Acad. Sci. USA 2008, 105, 5134–5138. [Google Scholar] [CrossRef]
- Barrett, R.D.H.; Schluter, D. Adaptation from standing genetic variation. Trends Ecol. Evol. 2008, 23, 38–44. [Google Scholar] [CrossRef]
- Alpermann, T.J.; Tillmann, U.; Beszteri, B.; Cembella, A.D.; John, U. Phenotypic variation and genotypic diversity in a planktonic population of the toxigenic marine dinoflagellate Alexandrium tamarense (Dinophyceae). J. Phycol. 2010, 46, 18–32. [Google Scholar] [CrossRef]
- Godhe, A.; Rynearson, T. The role of intraspecific variation on the ecological and evolutionary success of diatoms in changing environments. Philos. Trans. R. Soc. B Biol. Sci. 2017, 372, 20160399. [Google Scholar] [CrossRef] [PubMed]
- Kooistra, W.H.C.F.; Sarno, D.; Balzano, S.; Gu, H.; Andersen, R.A.; Zingone, A. Global diversity and biogeography of Skeletonema species (Bacillariophyta). Protist 2008, 159, 17–193. [Google Scholar] [CrossRef] [PubMed]
- Lim, H.C.; Lim, P.T.; Teng, S.T.; Bates, S.S.; Leaw, C.P. Genetic structure of Pseudo-nitzschia pungens (Bacillariophyceae) populations: Implications of a global diversification of the diatom. Harmful Algae 2014, 37, 142–152. [Google Scholar] [CrossRef]
- Rynearson, T.A.; Armbrust, E.V. DNA fingerprinting reveals extensive genetic diversity in a field population of the centric diatom Ditylum brightwellii. Limnol. Oceanogr. 2000, 45, 1329–1340. [Google Scholar] [CrossRef]
- Lundholm, N.; Moestrup, Ø.; Kotaki, Y.; Hoef-Emden, K.; Scholin, C.; Miller, P. Inter- and intraspecific variation of the Pseudo-nitzschia delicatissima complex (Bacillariophyceae) illustrated by rRNA probes, morphological data and phylogenetic analyses. J. Phycol. 2006, 42, 464–481. [Google Scholar] [CrossRef]
- Rynearson, T.A.; Armbrust, E.V. Genetic differentiation among populations of the planktonic marine diatom Ditylum brightwellii (Bacillariophyceae). J. Phycol. 2004, 40, 34–43. [Google Scholar] [CrossRef]
- Willis, A.; Chuang, A.W.; Woodhouse, J.N.; Neilan, B.A.; Burford, M.A. Intraspecific variation in growth, morphology and toxin quotas for the cyanobacterium Cylindrospermopsis raciborskii. Toxicon 2016, 119, 307–310. [Google Scholar] [CrossRef]
- Xiao, M.; Willis, A.; Burford, M.A. Differences in cyanobacterial strain response to light and temperature reflect species plasticity. Harmful Algae 2017, 62, 84–93. [Google Scholar] [CrossRef]
- Brandenburg, K.M.; Wohlrab, S.; John, U.; Kremp, A.; Jerney, J.; Krock, B.; Van de Waal, D. Intraspecific trait variation and trade-offs within and across populations of a toxic dinoflagellate. Ecol. Lett. 2018, 21, 1561–1571. [Google Scholar] [CrossRef] [PubMed]
- Ajani, P.A.; Petrou, K.; Larsson, M.E.; Nielsen, D.A.; Burke, J.; Murray, S.A. Phenotypic trait variability as an indication of adaptive capacity in a cosmopolitan marine diatom. Environ. Microbiol. 2021, 23, 207–223. [Google Scholar] [CrossRef] [PubMed]
- Gallagher, J.C.; Wood, A.M.; Alberte, R.S. Ecotypic differentiation in the marine diatom Skeletonema costatum: Influence of light intensity on the photosynthetic apparatus. Mar. Biol. 1984, 82, 121–134. [Google Scholar] [CrossRef]
- Kremp, A.; Godhe, A.; Egardt, J.; Dupont, S.; Suikkanen, S.; Casabianca, A.; Penna, A. Intraspecific variability in the response of bloom-forming marine microalgae to changed climate conditions. Ecol. Evol. 2012, 2, 1195–1207. [Google Scholar] [CrossRef]
- Torres, C.; Lürling, M.; Marinho, M.M. Assessment of the effects of light availability on growth and competition between strains of Planktothrix agardhii and Microcystis aeruginosa. Microb. Ecol. 2016, 71, 802–813. [Google Scholar] [CrossRef] [PubMed]
- Bates, S.S.; Hubbard, K.A.; Lundholm, N.; Montresor, M.; Leaw, C.P. Pseudo-nitzschia, Nitzschia, and domoic acid: New research since 2011. Harmful Algae 2018, 79, 3–43. [Google Scholar] [CrossRef]
- Lundholm, N. (Ed.) Bacillariophyta, in IOC-UNESCO Taxonomic Reference List of Harmful Micro Algae. 2024. Available online: https://www.marinespecies.org/hab (accessed on 7 June 2024).
- Scholin, C.A.; Gulland, F.; Doucette, G.J.; Benson, S.; Busman, M.; Chavez, F.P.; Cordaro, J.; DeLong, R.; De Vogelaere, A.; Harvey, J. Mortality of sea lions along the central California coast linked to a toxic diatom bloom. Nature 2000, 403, 80–84. [Google Scholar] [CrossRef]
- Lefebvre, K.A.; Quakenbush, L.; Frame, E.; Huntington, K.B.; Sheffield, G.; Stimmelmayr, R.; Bryan, A.; Kendrick, P.; Ziel, H.; Goldstein, T.; et al. Prevalence of algal toxins in Alaskan marine mammals foraging in a changing arctic and subarctic environment. Harmful Algae 2016, 55, 13–24. [Google Scholar] [CrossRef]
- Gibble, C.; Kudela, R.M.; Knowles, S.; Bodenstein, B.; Lefebvre, K.A. Domoic acid and saxitoxin in seabirds in the United States between 2007 and 2018. Harmful Algae 2021, 103, 101981. [Google Scholar] [CrossRef] [PubMed]
- Moriarty, M.E.; Tinker, M.T.; Miller, M.A.; Tomoleoni, J.A.; Staedler, M.M.; Fujii, J.A.; Batac, F.I.; Dodd, E.M.; Kudela, R.M.; Zubkousky-White, V.; et al. Exposure to domoic acid is an ecological driver of cardiac disease in southern sea otters. Harmful Algae 2021, 101, 101973. [Google Scholar] [CrossRef]
- Sterling, A.R.; Kirk, R.D.; Bertin, M.J.; Rynearson, T.A.; Borkman, D.G.; Caponi, M.C.; Carney, J.; Hubbard, K.A.; King, M.A.; Maranda, L.; et al. Emerging harmful algal blooms caused by distinct seasonal assemblages of a toxic diatom. Limnol. Oceanogr. 2022, 67, 2341–2359. [Google Scholar] [CrossRef] [PubMed]
- Hardardóttir, S.; Krock, B.; Wohlrab, S.; John, U.; Nielsen, T.G.; Lundholm, N. Can domoic acid affect escape response in copepods? Harmful Algae 2018, 79, 50–52. [Google Scholar] [CrossRef]
- Olesen, A.J.; Ryderheim, F.; Krock, B.; Lundhom, N.; Kiørboe, T. Costs and benefits of predator-induced defence in a toxic diatom. Proc. R. Soc. B 2022, 289, 20212735. [Google Scholar] [CrossRef]
- Fehling, J.; Green, D.H.; Davidson, K.; Bolch, C.J.; Bates, S.S. Domoic acid production by Pseudo-nitzschia seriata (Bacillariophyceae) in Scottish waters. J. Phycol. 2004, 40, 622–630. [Google Scholar] [CrossRef]
- Hansen, L.R.; Soylu, S.Í.; Kotaki, Y.; Moestrup, Ø.; Lundholm, N. Toxin production and temperature-induced morphological variation of the diatom Pseudo-nitzschia seriata from the Arctic. Harmful Algae 2011, 10, 689–696. [Google Scholar] [CrossRef]
- Stonik, I.V.; Orlova, T.Y. Domoic acid-producing diatoms of the genus Pseudo-nitzschia H. Peragallo, 1900 (Bacillariophyta) from the North Pacific. Russ. J. Mar. Biol. 2018, 44, 347–354. [Google Scholar] [CrossRef]
- Weber, C.; Olesen, A.J.; Krock, B.; Lundholm, N. Salinity, a climate-change factor affecting growth, domoic acid and isodomoic acid C content in the diatom Pseudo-nitzschia seriata (Bacillariophyceae). Phycologia 2021, 60, 619–630. [Google Scholar] [CrossRef]
- Couture, J.-Y.; Levasseur, M.; Bonneau, E.; Desjardins, C.; Sauvé, G.; Bates, S.S.; Léger, C.; Gagnon, R.; Michaud, S. Spatial and temporal variation of domoic acid in molluscs and Pseudo-nitzschia spp. blooms in the St. Lawrence from 1998 to 2000. Can. Tech. Rep. Fish. Aquat. Sci. 2001, 2375, 31. [Google Scholar]
- Bates, S.S.; Leger, C.; White, J.M.; MacNair, N.; Ehrman, J.M.; Levasseur, M.; Couture, J.-L.; Gagnon, R.; Bonneau, E.; Michaud, S.; et al. Domoic acid production by the diatom Pseudo-nitzschia seriata causes spring closures of shellfish harvesting for the first time in the Gulf of St. Lawrence, Eastern Canada. In Proceedings of the Xth International Conference on Harmful Algae, St. Pete Beach, FL, USA, 21–25 October 2002. [Google Scholar]
- Lundholm, N.; Andersen, P.; Jørgensen, K.; Thorbjørnsen, B.R.; Cembella, A.; Krock, B. Domoic acid in Danish blue mussels due to a bloom of Pseudo-nitzschia seriata. Harmful Algae News 2005, 29, 8–10. [Google Scholar]
- Orsini, L.; Sarno, D.; Procaccini, G.; Poletti, R.; Dahlmann, J.; Montresor, M. Toxic Pseudo-nitzschia multistriata (Bacillariophyceae) from the Gulf of Naples: Morphology, toxin analysis and phylogenetic relationships with other Pseudo-nitzschia species. Eur. J. Phycol. 2002, 37, 247–257. [Google Scholar] [CrossRef]
- Stehr, C.M.; Connell, L.; Baugh, K.A.; Bill, B.D.; Adams, N.G.; Trainer, V.L. Morphological, toxicological, and genetic differences among Pseudo-nitzschia (Bacillariophyceae) species in inland embayments and outer coastal waters of Washington State, USA. J. Phycol. 2002, 38, 55–65. [Google Scholar] [CrossRef]
- Evans, K.M.; Kühn, S.F.; Hayes, P.K. High levels of genetic diversity and low levels of genetic differentiation on North Sea Pseudo-nitzschia pungens (Bacillariophyceae) populations. J. Phycol. 2005, 41, 506–514. [Google Scholar] [CrossRef]
- Li, Z.; Li, W.; Zhang, Y.; Hu, Y.; Sheward, R.; Irwin, A.J.; Finkel, Z.V. Dynamic photophysiological stress response of a model diatom to ten environmental stresses. J. Phycol. 2021, 57, 484–495. [Google Scholar] [CrossRef]
- Li, Y.; Huang, C.X.; Xu, G.S.; Lundholm, N.; Teng, S.T.; Wu, H.; Tan, Z. Pseudo-nitzschia simulans sp. nov. (Bacillariophyceae), the first domoic acid producer from Chinese waters. Harmful Algae 2017, 67, 119–130. [Google Scholar] [CrossRef]
- Thorel, M.; Fauchot, J.; Morelle, J.; Raimbault, V.; Le Roy, B.; Miossec, C.; Kientz-Bouchart, V.; Claquin, P. Interactive effects of irradiance and temperature on growth and domoic acid production of the toxic diatom Pseudo-nitzschia australis (Bacillariophyceae). Harmful Algae 2014, 39, 232–241. [Google Scholar] [CrossRef]
- Santiago-Morales, I.S.; García-Mendoza, E. Growth and domoic acid content of Pseudo-nitzschia australis isolated from northwestern Baja California, Mexico, cultures under batch conditions at different temperatures and two Si:NO3 ratios. Harmful Algae 2011, 12, 82–94. [Google Scholar] [CrossRef]
- Hasle, G.R.; Lundholm, N. Pseudo-nitzschia seriata f. obtusa (Bacillariophyceae) raised in rank based on morphological, phylogenetic and distributional data. Phycologia 2005, 44, 608–619. [Google Scholar]
- Delahaye, C.; Nicolas, J. Sequencing DNA with nanopores: Troubles and biases. PLoS ONE 2021, 16, e0257521. [Google Scholar] [CrossRef]
- Sjöqvist, C.O.; Kremp, A. Genetic diversity affects ecological performance and stress response of marine diatom populations. ISME J. 2016, 10, 2755–2766. [Google Scholar] [CrossRef]
- Brand, L.E. Genetic-variability and spatial patterns of genetic differentiation in the reproductive rates of the marine coccolithophores Emiliania huxleyi and Gephyrocapsa oceanica. Limnol. Oceanogr. 1982, 27, 236–245. [Google Scholar] [CrossRef]
- Gsell, A.S.; Domis, L.N.S.; Przytulska-Bartosiewicz, A.; Mooij, W.M.; Donk, E.; Ibelings, B.W. Genotype-by-temperature interactions may help to maintain clonal diversity in Asterionella formosa (Bacillariophyceae). J. Phycol. 2012, 48, 1197–1208. [Google Scholar] [CrossRef]
- Ryderheim, F.; Kiørboe, T. Intraspecific genetic diversity and coexistience in phytoplankton populations. Limnol. Oceanogr. 2024, 69, 1450–1463. [Google Scholar] [CrossRef]
- Ribeiro, S.; Berge, T.; Lundholm, N.; Ellegaard, M. Hundred years of environmental change and phytoplankton ecophysiological variability archived in coastal sediments. PLoS ONE 2013, 8, e61184. [Google Scholar] [CrossRef] [PubMed]
- Lundholm, N.; Ribeiro, S.; Godhe, A.; Nielsen, L.R.; Ellegaard, M. Exploring the impact of multidecadal environmental changes on the population genetic structure of a marine primary producer. Ecol. Evol. 2017, 7, 3132–3142. [Google Scholar] [CrossRef] [PubMed]
- Boero, F.; Belmonte, G.; Fanelli, G.; Piraino, S.; Rubino, F. The continuity of living matter and the discontinuities of its constituents: Do plankton and benthos really exist? Trends Ecol. Evol. 1996, 11, 177–180. [Google Scholar] [CrossRef] [PubMed]
- Ellegaard, M.; Godhe, A.; Ribeiro, S. Time capsule in natural sediment archives—Tracking phytoplankton population genetic diversity and adaptation over multidecadal timescales in the face of environmental change. Evol. Appl. 2018, 11, 11–16. [Google Scholar] [CrossRef]
- Lundholm, N.; Clarke, A.; Ellegaard, M. A 100-year record of changing Pseudo-nitzschia species in a sill-fjord in Denmark related to nitrogen loading and temperature. Harmful Algae 2010, 9, 449–457. [Google Scholar] [CrossRef]
- Wilson, A.E.; Wilson, W.A.; Hay, M.E. Intraspecific variation in growth and morphology of the bloom-forming cyanobacterium Microcystis aeruginosa. Appl. Environ. Microbiol. 2006, 72, 7386–7389. [Google Scholar] [CrossRef]
- Hare, C.E.; Leblanc, K.; DiTullio, G.R.; Kudela, R.M.; Zhang, Y.; Lee, P.A.; Riseman, S.; Hutchins, D.A. Consequences of increased temperature and CO2 for phytoplankton community structure in the Bering Sea. Mar. Ecol. Prog. Ser. 2007, 352, 9–16. [Google Scholar] [CrossRef]
- Montagnes, D.J.S.; Franklin, D.J. Effect of temperature on diatom volume, growth rate, and carbon and nitrogen content: Reconsidering some paradigms. Limnol. Oceanogr. 2008, 46, 2008–2018. [Google Scholar] [CrossRef]
- Pancic, M.; Hansen, P.J.; Tammilehto, A.; Lundholm, N. Resilience to temperature and pH changes in a future climate change scenario in six strains of the polar diatom Fragilariopsis cylindrus. Biogeosciences 2015, 12, 4235–4244. [Google Scholar] [CrossRef]
- Wolf, K.K.E.; Hoppe, C.J.M.; Rost, B. Resilience by diversity: Large intraspecific differences in climate change reponses of an Arctic diatom. Limnol. Oceanogr. 2017, 63, 397–411. [Google Scholar] [CrossRef]
- Svenning, J.B.; Dalheim, L.; Eilertsen, H.C.; Vasskog, T. Temperature dependent growth rate, lipid content and fatty acid composition of the marine cold-water diatom Porosira glacialis. Algal Res. 2019, 37, 11–16. [Google Scholar] [CrossRef]
- Stapleford, L.S.; Smith, R.E.H. The interactive effect of temperature and silicon limitation on the psychrophilic ice diatom Pseudo-nitzschia seriata. Polar Biol. 1996, 16, 589–594. [Google Scholar] [CrossRef]
- Smith, R.E.H.; Stapleford, L.C.; Ridings, R.S. The acclimated response of growth, photosynthesis, composition, and carbon balance to temperature in the psychrophilic ice diatom Nitzschia seriata. J. Phycol. 1994, 30, 8–16. [Google Scholar] [CrossRef]
- Wells, M.L.; Karlson, B.; Wulff, A.; Kudela, R.; Trick, C.; Asnaghi, V.; Berdalet, E.; Cochlan, W.; Davidson, K.; De Rijcke, M.; et al. Future HAB science: Directions and challenges in a changing climate. Harmful Algae 2020, 91, 101632. [Google Scholar] [CrossRef]
- Angilletta, M.J. Estimating and comparing thermal performance curves. J. Therm. Biol. 2006, 31, 541–545. [Google Scholar] [CrossRef]
- Coello-Camba, A.; Agusti, S. Thermal thresholds of phytoplankton growth in polar waters and their consequences for a warming Polar Ocean. Front. Mar. Sci. 2017, 4, 168. [Google Scholar] [CrossRef]
- Lakeman, M.B.; von Dassow, P.; Cattolico, R.A. The strain concept in phytoplankton ecology. Harmful Algae 2009, 8, 746–758. [Google Scholar] [CrossRef]
- Tesson, S.V.M.; Montresor, M.; Procaccini, G.; Kooistra, W.H.C.F. Temporal changes in population structure of a marine planktonic diatom. PLoS ONE 2014, 9, e114984. [Google Scholar] [CrossRef]
- Rodríguez-Valera, F. Environmental genomics, the bigger picture? FEMS Microbiol. Lett. 2004, 231, 153–158. [Google Scholar] [CrossRef] [PubMed]
- Evans, K.M.; Bates, S.S.; Medlin, L.K.; Hayes, P.K. Microsatellite marker development and genetic variation in the toxic marine diatom Pseudo-nitzschia multiseries (Bacillariophyceae). J. Phycol. 2004, 40, 911–920. [Google Scholar] [CrossRef]
- Stewart, J.E. Bacterial involvement in determining domoic acid levels in Pseudo-nitzschia multiseries cultures. Aquat. Microb. Ecol. 2008, 50, 135–144. [Google Scholar] [CrossRef]
- Mafra, L.L., Jr.; Bricelj, V.M.; Ouellette, C.; Léger, C.; Bates, S.S. Mechanisms contributing to low domoic acid uptake by oysters feeding on Pseudo-nitzschia cells. I. Filtration and pseudofeces production. Aquat. Biol. 2009, 6, 201–212. [Google Scholar] [CrossRef]
- Bates, S.S.; Hiltz, M.F.; Léger, C. Domoic acid toxicity of large new cells of Pseudo-nitzschia multiseries resulting from sexual reproduction. In Proceedings of the Sixth Canadian Workshop on Harmful Marine Algae, St. Andrews, NB, Canada, 27–29 May 1999. [Google Scholar]
- Lundholm, N.; Krock, B.; John, U.; Skov, J.; Cheng, J.; Pancic, M.; Wohlrab, S.; Rigby, K.; Nielsen, T.G.; Selander, E.; et al. Induction of domoic acid production in diatoms—Types of grazers and diatoms are important. Harmful Algae 2018, 79, 64–73. [Google Scholar] [CrossRef] [PubMed]
- Zhu, Z.; Qu, P.; Fu, F.; Tennenbaum, N.; Tatters, A.O.; Hutchins, D.A. Understanding the blob bloom: Warming increase toxicity and abundance of the harmful bloom diatom Pseudo-nitzschia in California coastal waters. Harmful Algae 2017, 67, 36–43. [Google Scholar] [CrossRef] [PubMed]
- Cochlan, W.P.; Bill, B.D.; Cailipan, A.B.; Trainer, V.L. Domoic acid production by Pseudo-nitzschia australis: Re-evaluating the role of macronutrient limitation on toxigenicity. Harmful Algae 2023, 125, 102431. [Google Scholar] [CrossRef] [PubMed]
- Lelong, A.; Hégaret, H.; Soudant, P.; Bates, S.S. Pseudo-nitzschia (Bacillariophyceae) species, domoic acid and amnesic shellfish poisoning: Revisiting previous paradigms. Phycologia 2012, 51, 168–216. [Google Scholar] [CrossRef]
- Moschandreou, K.K.; Baxevanis, A.D.; Katikou, P.; Papaefthimiou, D.; Nikolaidis, G.; Abatzopoulos, T.J. Inter- and intra-specific diversity of Pseudo-nitzschia (Bacillariophyceae) in the northeastern Mediterranean. Eur. J. Phycol. 2012, 47, 321–339. [Google Scholar] [CrossRef]
- Accoroni, S.; Giulietti, S.; Romagnoli, T.; Siracusa, M.; Bacchiocchi, S.; Totti, C. Morphological variability of Pseudo-nitzschia pungens Clade I (Bacillariophyceae) in the Northwestern Adriatic Sea. Plants 2020, 9, 1420. [Google Scholar] [CrossRef]
- Lundholm, N.; Daugbjerg, N.; Moestrup, Ø. Phylogeny of the Bacillariaceae with emphasis on the genus Pseudo-nitzschia (Bacillariophyceae) based on partial LSU rDNA. Eur. J. Phycol. 2002, 37, 115–134. [Google Scholar] [CrossRef]
- D’Alelio, D.; Amato, A.; Kooistra, W.H.; Procaccini, G.; Casotti, R.; Montresor, M. Internal transcribed spacer polymorphism in Pseudo-nitzschia multistriata (Bacillariophyceae) in the Gulf of Naples: Recent divergence or intraspecific hybridization? Protist 2009, 160, 9–20. [Google Scholar] [CrossRef]
- Kim, J.H.; Ajani, P.; Murray, S.A.; Kim, J.H.; Lim, H.C.; Teng, S.T.; Lim, P.T.; Han, M.-S.; Park, B.S. Sexual reproduction and genetic polymorphism within the cosmopolitan marine diatom Pseudo-nitzschia pungens. Sci. Rep. 2020, 10, 10653. [Google Scholar] [CrossRef]
- Adams, N.G.; Schwenke, P.; Smith, G.J.; Trainer, V.L. Microsatellite markers for population genetic applications in the domoic acid-producing diatom Pseudo-nitzschia australis Frenguelli (Bacillariophyceae). Protist 2017, 168, 197–205. [Google Scholar] [CrossRef]
- Sugie, K.; Fujiwara, A.; Nishino, S.; Kameyama, S.; Harada, N. Impacts of temperature, CO2, and salinity on phytoplankton community composition in the Western Arctic Ocean. Front. Mar. Sci. 2020, 6, 821. [Google Scholar] [CrossRef]
- Xu, D.; Zheng, G.; Brennan, G.; Wang, Z.; Jiang, T.; Sun, K.; Fan, X.; Bowler, C.; Zhang, X.; Zhang, Y.; et al. Plastic responses lead to increased neurotoxin production in the diatom Pseudo-nitzschia under ocean warming and acidification. ISME J. 2023, 17, 525–536. [Google Scholar] [CrossRef] [PubMed]
- Hattich, G.S.I.; Jokinen, S.; Sildever, S.; Gareis, M.; Heikkinen, J.; Junghardt, N.; Segovia, M.; Machado, M.; Sjöqvist, C. Temperature optima of a natural diatom population increases as global warming proceed. Nat. Clim. Change 2024, 14, 518–525. [Google Scholar] [CrossRef]
- Hallegraeff, G.M.; Anderson, D.M.; Belin, C.; Bottein, M.-Y.D.; Bresnan, E.; Chinain, M.; Enevoldsen, H.; Iwataki, M.; Karlson, B.; McKenzie, C.H.; et al. Perceived global increase in algal blooms is attributable to intensified monitoring and emerging bloom impacts. Commun. Earth Environ. 2021, 2, 117. [Google Scholar] [CrossRef]
- Rolton, A.; Rhodes, L.; Hutson, K.S.; Biessy, L.; Bui, T.; MacKenzie, L.; Symonds, J.E.; Smith, K.F. Effects of harmful algal blooms on fish and shellfish species: A case study of New Zealand in a changing environment. Toxins 2022, 14, 341. [Google Scholar] [CrossRef]
- Shahmohamadloo, R.S.; Frenken, T.; Rudman, S.M.; van West, P.; Ibelings, B.W.; Trainer, V.L. Diseases and disorders in fish due to harmful algal blooms. In Climate Change on Diseases and Disorders of Finfish in Cage Culture; CAB International: Wallingford, UK, 2023; pp. 387–429. [Google Scholar]
- Shartau, R.B.; Turcotte, L.D.M.; Bradshaw, J.C.; Ross, A.R.S.; Surridge, B.D.; Nemcek, N.; Johnson, S.C. Dissolved algal toxins along the southern coast of British Columbia Canada. Toxins 2023, 15, 395. [Google Scholar] [CrossRef]
- Whyte, C.; Swan, S.C.; Turner, A.D.; Hatfield, R.G.; Mitchell, E.; Lafferty, S.; Morrell, N.; Rowland-Pilgrim, S.; Davidson, K. The presence of Pseudo-nitzschia australis in North Atlantic aquaculture sites, implications for monitoring amnesic shellfish toxins. Toxins 2023, 15, 554. [Google Scholar] [CrossRef]
- Anderson, D.M.; Fensin, E.; Gobler, C.J.; Hoeglund, A.E.; Hubbard, K.A.; Kulis, D.M.; Landsberg, J.H.; Lefebvre, K.A.; Provoost, P.; Richlen, M.L.; et al. Marine harmful algal blooms (HABs) in the United States: History, current status and furture trends. Harmful Algae 2021, 102, 101975. [Google Scholar] [CrossRef]
- Shahmohamadloo, R.S.; Rudman, S.M.; Clare, C.I.; Westrick, J.A.; Wang, X.; De Meester, L.; Fryxell, J.M. Intraspecific diversity is critical to population-level risk assessments. Sci. Rep. 2024, 14, 25883. [Google Scholar] [CrossRef]
- Guillard, R.R.L.; Hargraves, P.E. Strichochrysis immobilis is a diatom, not a chrysophyte. Phycologia 1993, 32, 234–236. [Google Scholar] [CrossRef]
- Ayache, N.; Hervé, F.; Lundholm, N.; Amzil, Z.; Caruana, A.M.N. Acclimation of the marine diatom Pseudo-nitzschia australis to different salinity conditions: Effects on growth, photosynthetic activity, and domoic acid content. J. Phycol. 2020, 56, 97–109. [Google Scholar] [CrossRef] [PubMed]
- Masson-Delmotte, V.; Zhai, P.; Pirani, A.; Connors, S.L.; Péan, C.; Berger, S.; Caud, N.; Chen, Y.; Goldfarb, L.; Gomis, M.I.; et al. (Eds.) Climate Change 2021: The Physical Science Basis. Contribution of Working Group I to the Sixth Assessment Report of the Intergovernmental Panel on Climate Change; IPCC, Cambridge University Press: Cambridge, UK, 2021. [Google Scholar]
- Krock, B.; Tillmann, U.; John, U.; Cembella, A. LC-MS-MS aboard ship: Tandem mass spectrometry in the search for phycotoxins and novel toxigenic plankton from the North Sea. Anal. Bioanal. Chem. 2008, 392, 797–803. [Google Scholar] [CrossRef]
- Hatfield, R.G.; Batista, F.M.; Bean, T.P.; Fonseca, V.G.; Santos, A.; Turner, A.D.; Lewis, A.; Dean, K.J.; Martinez-Urtaza, J. The application of nanopore sequencing technology to the study of dinoflagellates: A proof of concept study for rapid sequence-based discrimination of potentially harmful algae. Front. Microbiol. 2020, 11, 844. [Google Scholar] [CrossRef] [PubMed]
- Sahlin, K.; Lim, M.C.W.; Prost, S. NGSpeciesID: DNA barcode and amplicon consensus generation from long-read sequencing data. Ecol. Evol. 2021, 11, 1392–1398. [Google Scholar] [CrossRef]
- Hatfield, R.G.; Ryder, D.; Tidy, A.M.; Hartnell, D.M.; Dean, K.J.; Batista, F.M. Combining nanopore sequencing with recombinase polymerase amplification enables identification of dinoflagellates from the Alexandrium genus, providing a rapid, field deployable tool. Toxins 2023, 15, 372. [Google Scholar] [CrossRef]
- Robinson, J.T.; Thorvaldsdóttir, H.; Winckler, W.; Guttman, M.; Lander, E.S.; Getz, G.; Mesirov, J.P. Integrative genomics viewer. Nat. Biotechnol. 2011, 29, 24–26. [Google Scholar] [CrossRef]
- Clausen, P.T.L.C.; Aarestrup, F.M.; Lund, O. Rapid and precise alignment of raw reads against redundant databases with KMA. BMC Bioinform. 2018, 19, 307. [Google Scholar] [CrossRef] [PubMed]
- Shabardina, V.; Kischka, T.; Manske, F.; Grundmann, N.; Frith, M.C.; Suzuki, Y.; Makalowski, W. NanoPipe—A web server for nanopore MinION sequencing data analysis. GigaScience 2019, 8, giy169. [Google Scholar] [CrossRef]
- Gruber, A.R.; Lorenz, R.; Bernhart, S.H.; Neuböck, R.; Hofacker, I.L. The Vienna RNA Websuite. Nucleic Acid Res. 2008, 36, W70–W74. [Google Scholar] [CrossRef]
- Tong, M.; Kulis, D.M.; Fux, E.; Smith, J.L.; Hess, P.; Zhou, Q.; Anderson, D.M. The effects of growth phase and light intensity on toxin production by Dinophysis acuminata from the northeastern United States. Harmful Algae 2011, 10, 254–264. [Google Scholar] [CrossRef]
Disclaimer/Publisher’s Note: The statements, opinions and data contained in all publications are solely those of the individual author(s) and contributor(s) and not of MDPI and/or the editor(s). MDPI and/or the editor(s) disclaim responsibility for any injury to people or property resulting from any ideas, methods, instructions or products referred to in the content. |
© 2025 by the authors. Licensee MDPI, Basel, Switzerland. This article is an open access article distributed under the terms and conditions of the Creative Commons Attribution (CC BY) license (https://creativecommons.org/licenses/by/4.0/).
Share and Cite
Weber, C.; Olesen, A.J.; Hatfield, R.G.; Krock, B.; Lundholm, N. Extensive Variation in Thermal Responses and Toxin Content Among 40 Strains of the Cold-Water Diatom Pseudo-nitzschia seriata—In a Global Warming Context. Toxins 2025, 17, 235. https://doi.org/10.3390/toxins17050235
Weber C, Olesen AJ, Hatfield RG, Krock B, Lundholm N. Extensive Variation in Thermal Responses and Toxin Content Among 40 Strains of the Cold-Water Diatom Pseudo-nitzschia seriata—In a Global Warming Context. Toxins. 2025; 17(5):235. https://doi.org/10.3390/toxins17050235
Chicago/Turabian StyleWeber, Caroline, Anna Junker Olesen, Robert G. Hatfield, Bernd Krock, and Nina Lundholm. 2025. "Extensive Variation in Thermal Responses and Toxin Content Among 40 Strains of the Cold-Water Diatom Pseudo-nitzschia seriata—In a Global Warming Context" Toxins 17, no. 5: 235. https://doi.org/10.3390/toxins17050235
APA StyleWeber, C., Olesen, A. J., Hatfield, R. G., Krock, B., & Lundholm, N. (2025). Extensive Variation in Thermal Responses and Toxin Content Among 40 Strains of the Cold-Water Diatom Pseudo-nitzschia seriata—In a Global Warming Context. Toxins, 17(5), 235. https://doi.org/10.3390/toxins17050235