Cytotoxic Effects of Major and Emerging Mycotoxins on HepaRG Cells and Transcriptomic Response after Exposure of Spheroids to Enniatins B and B1

 , ,
, ,  and
and 
Abstract
1. Introduction
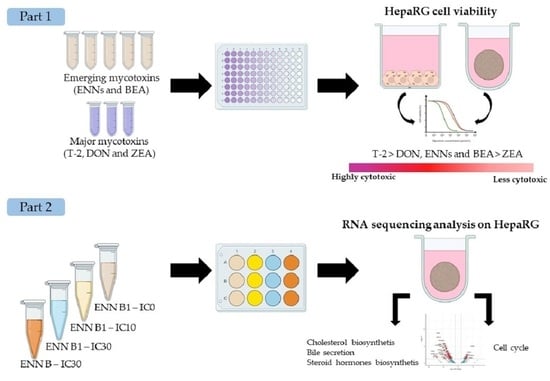
2. Results
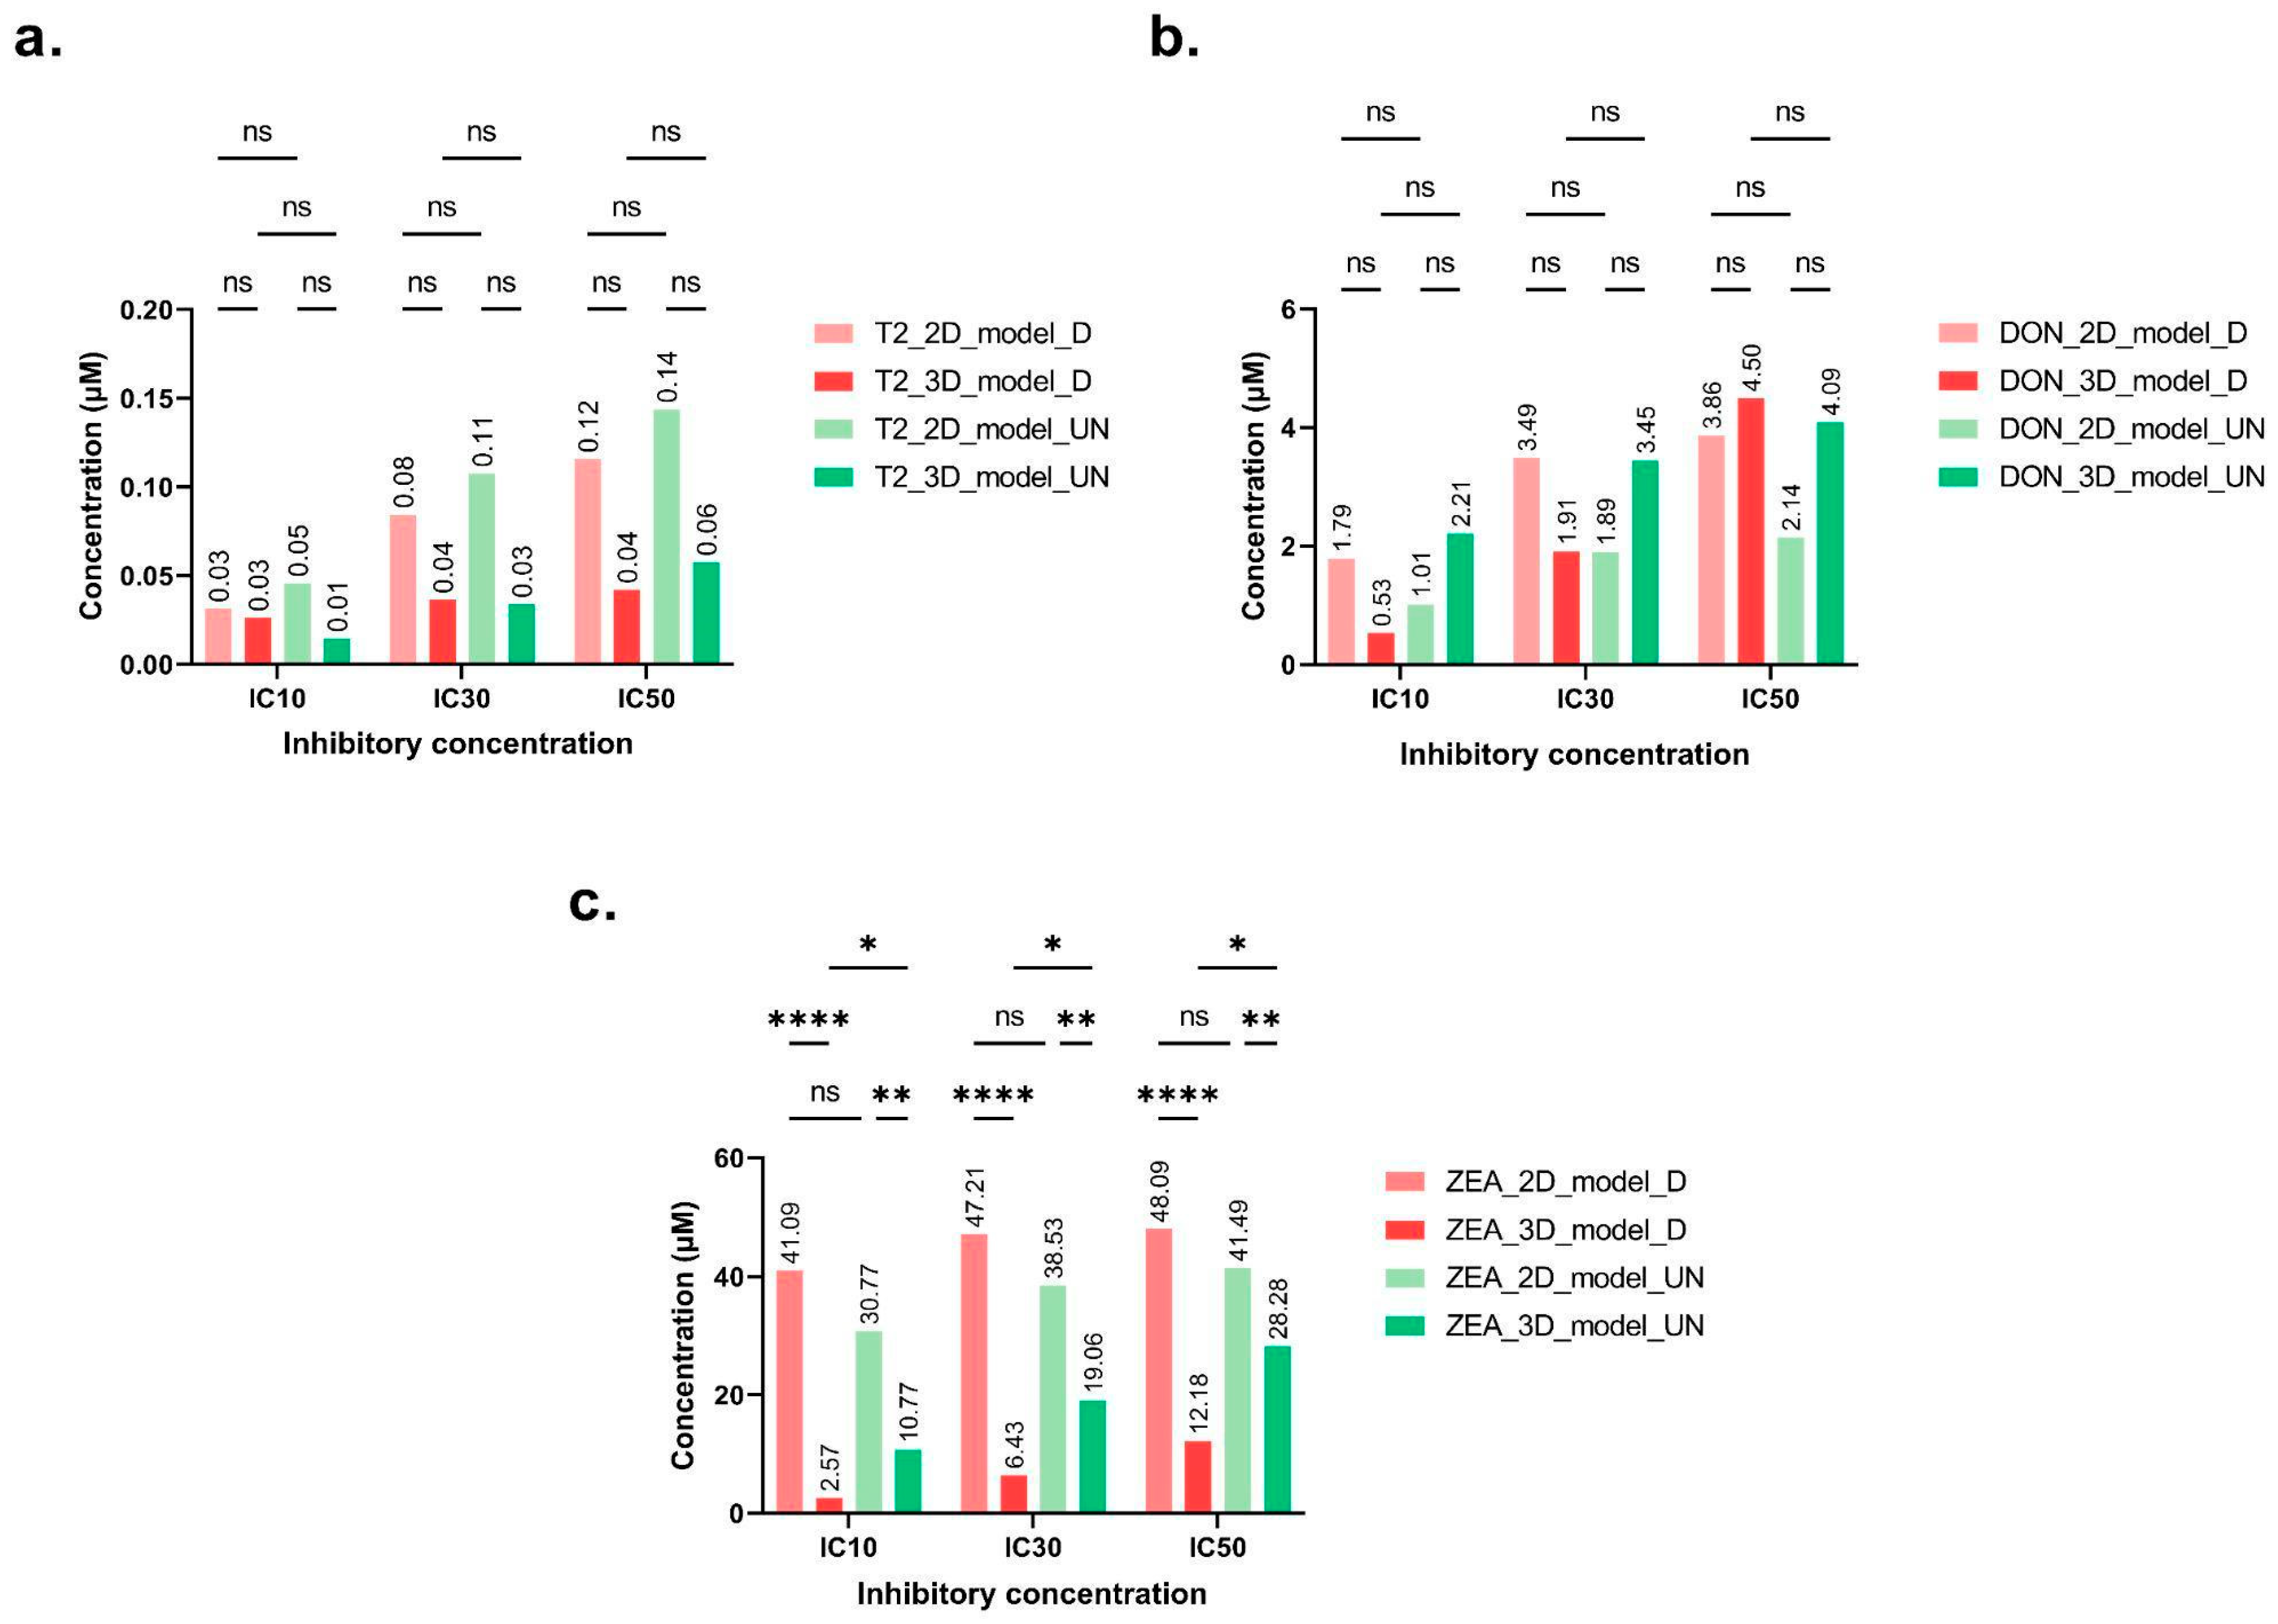
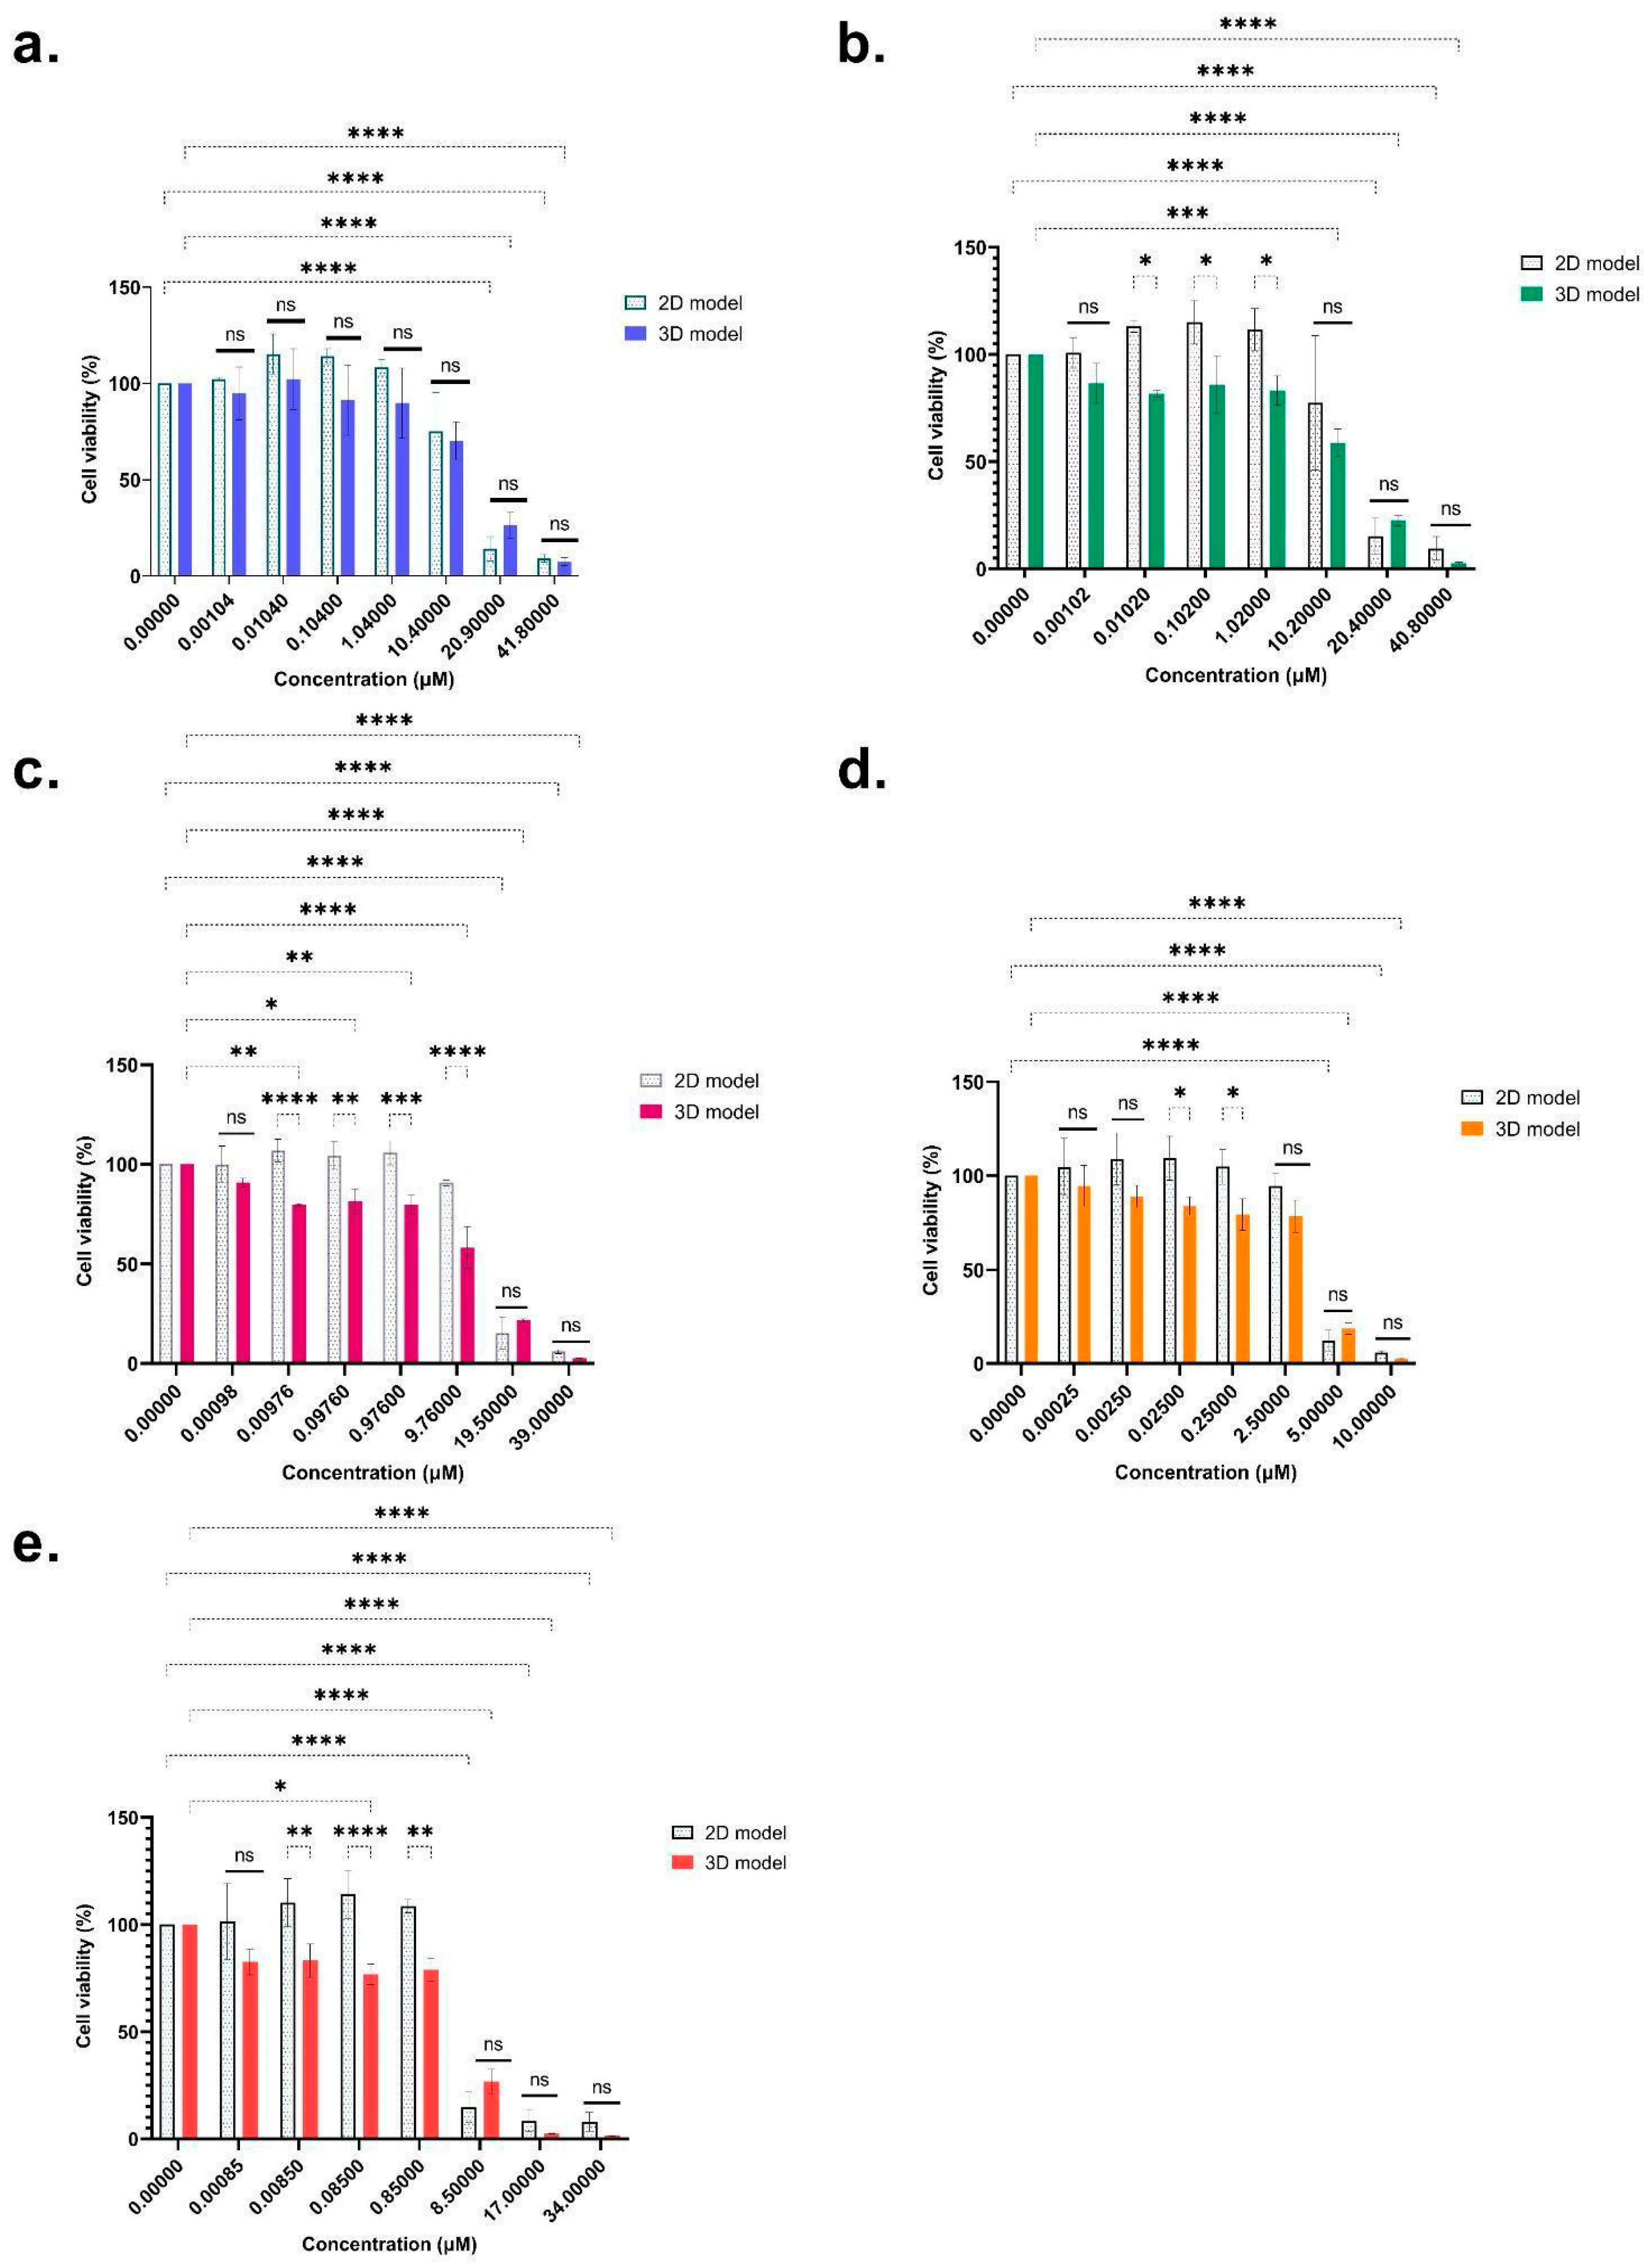
2.1. Cytotoxicity of Regulated Mycotoxins
2.2. Cytotoxicity of ENNs and BEA Mycotoxins
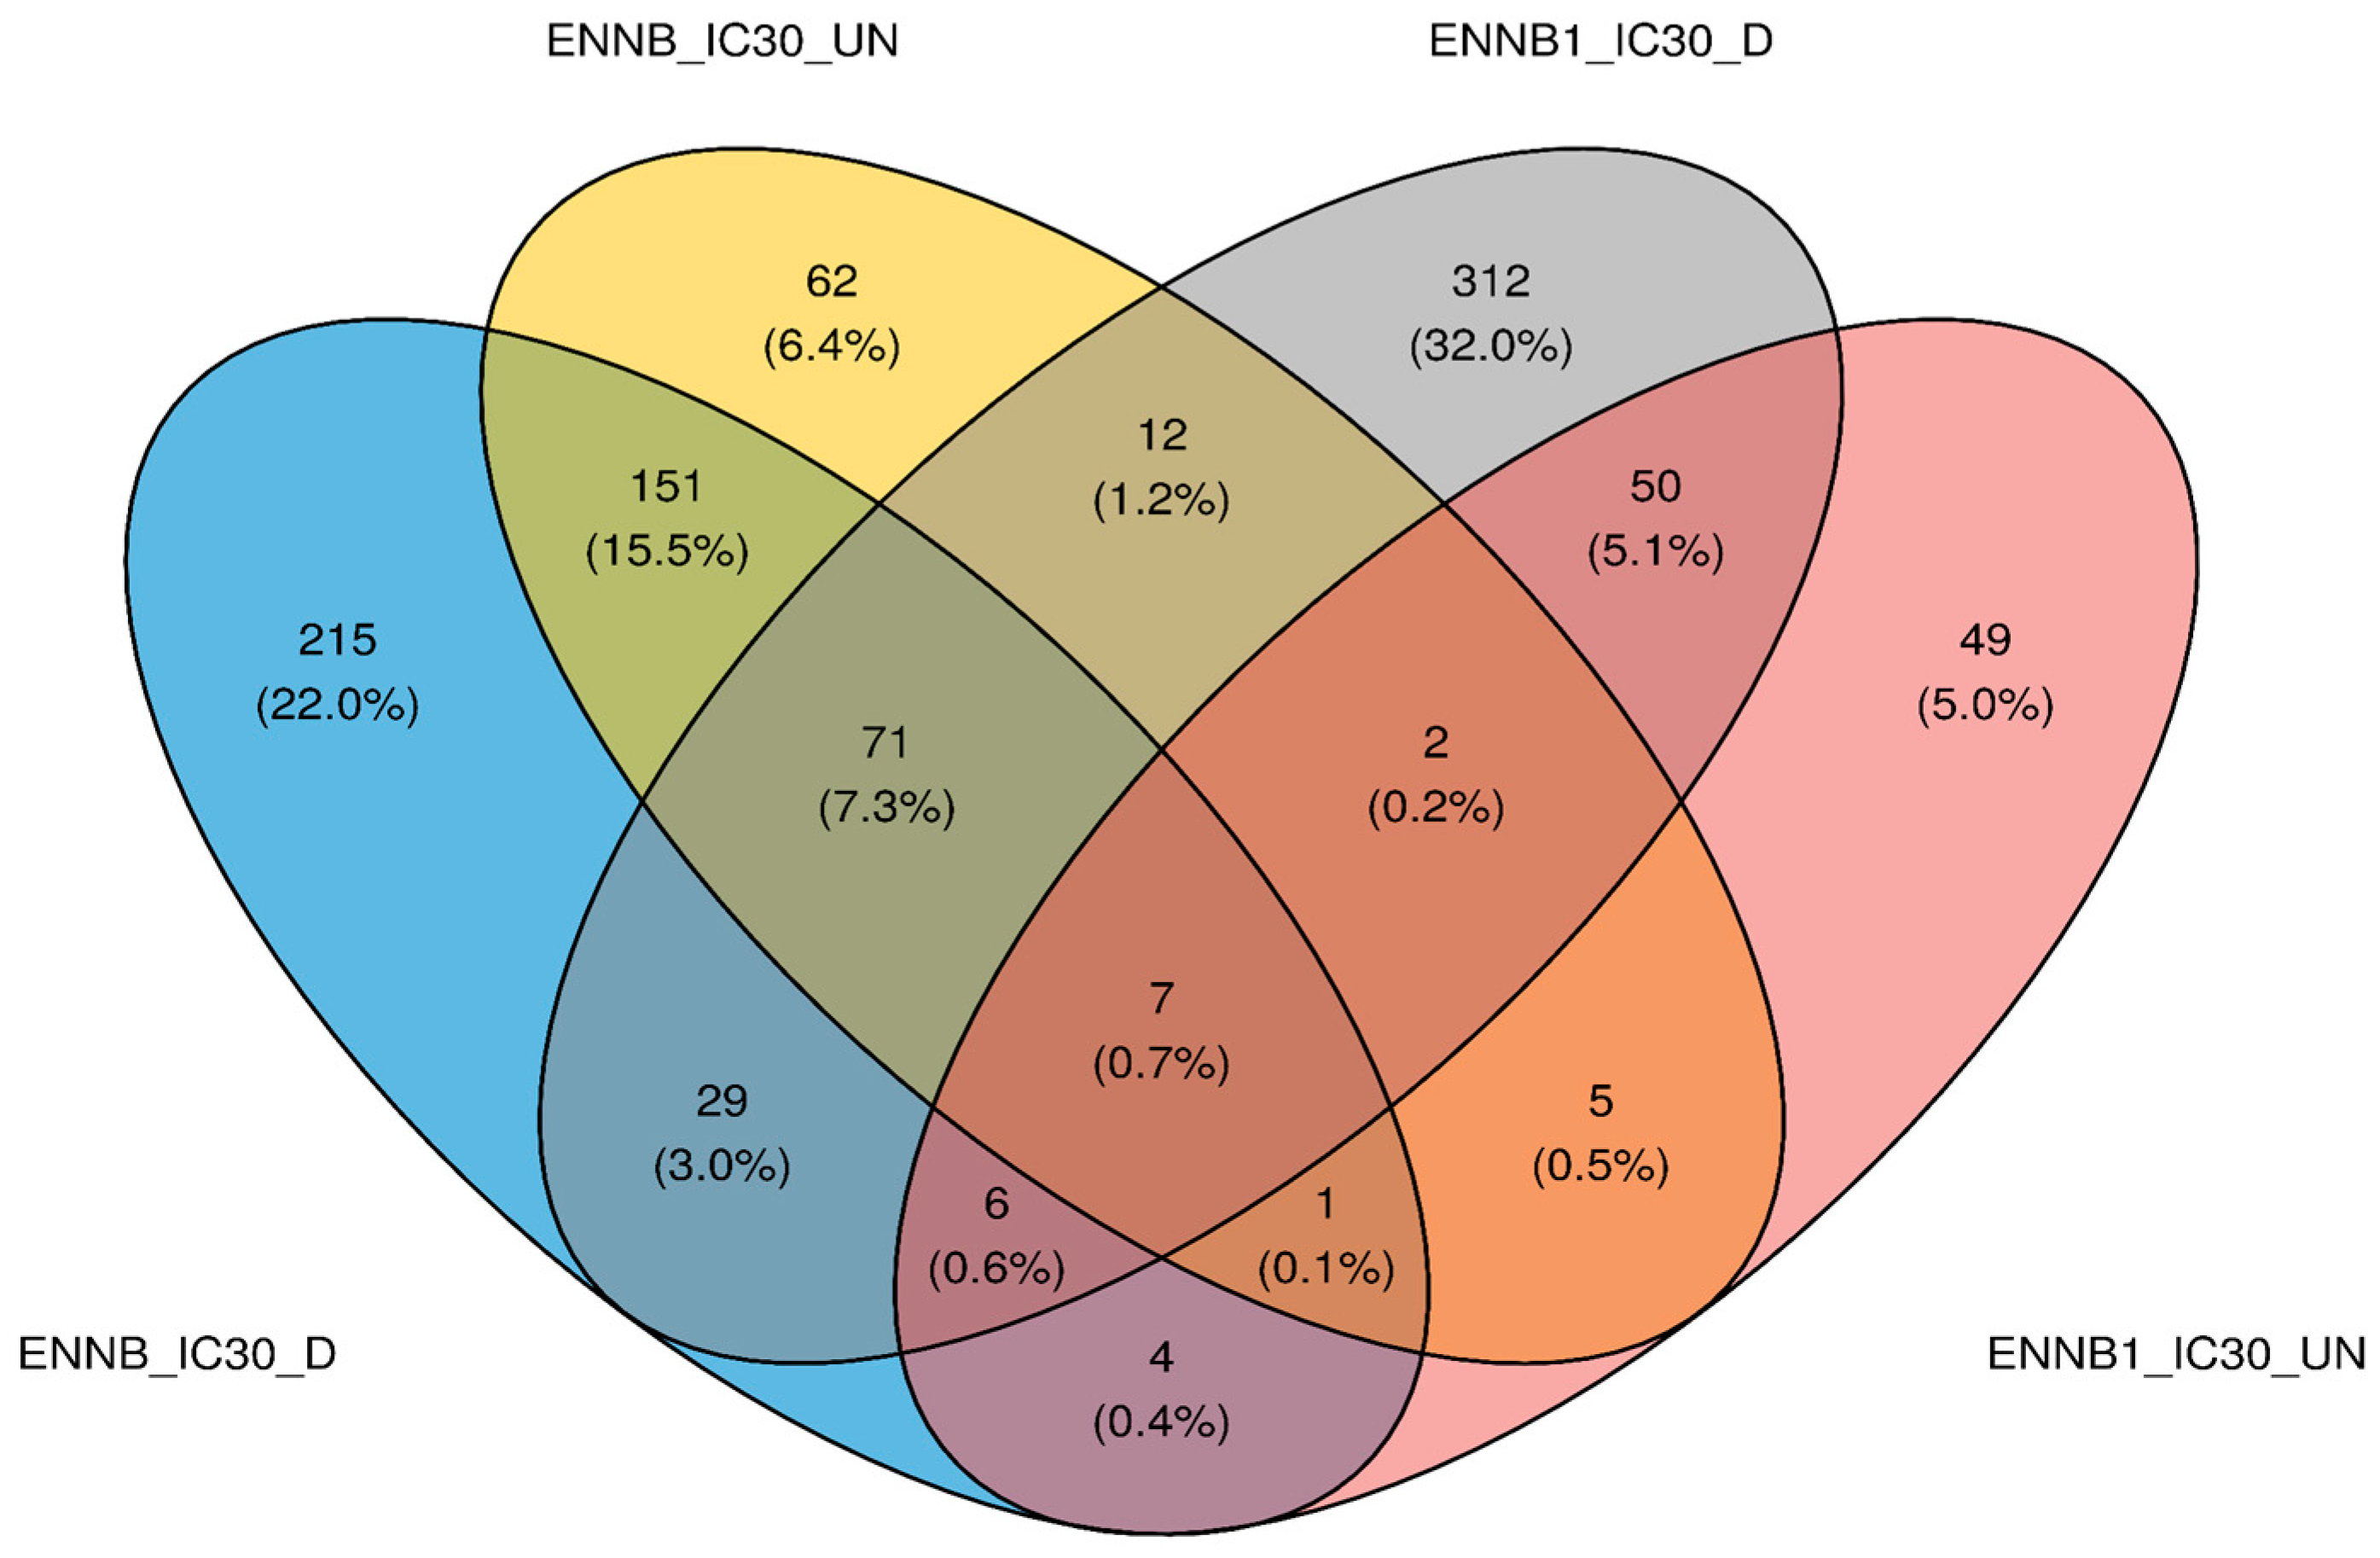
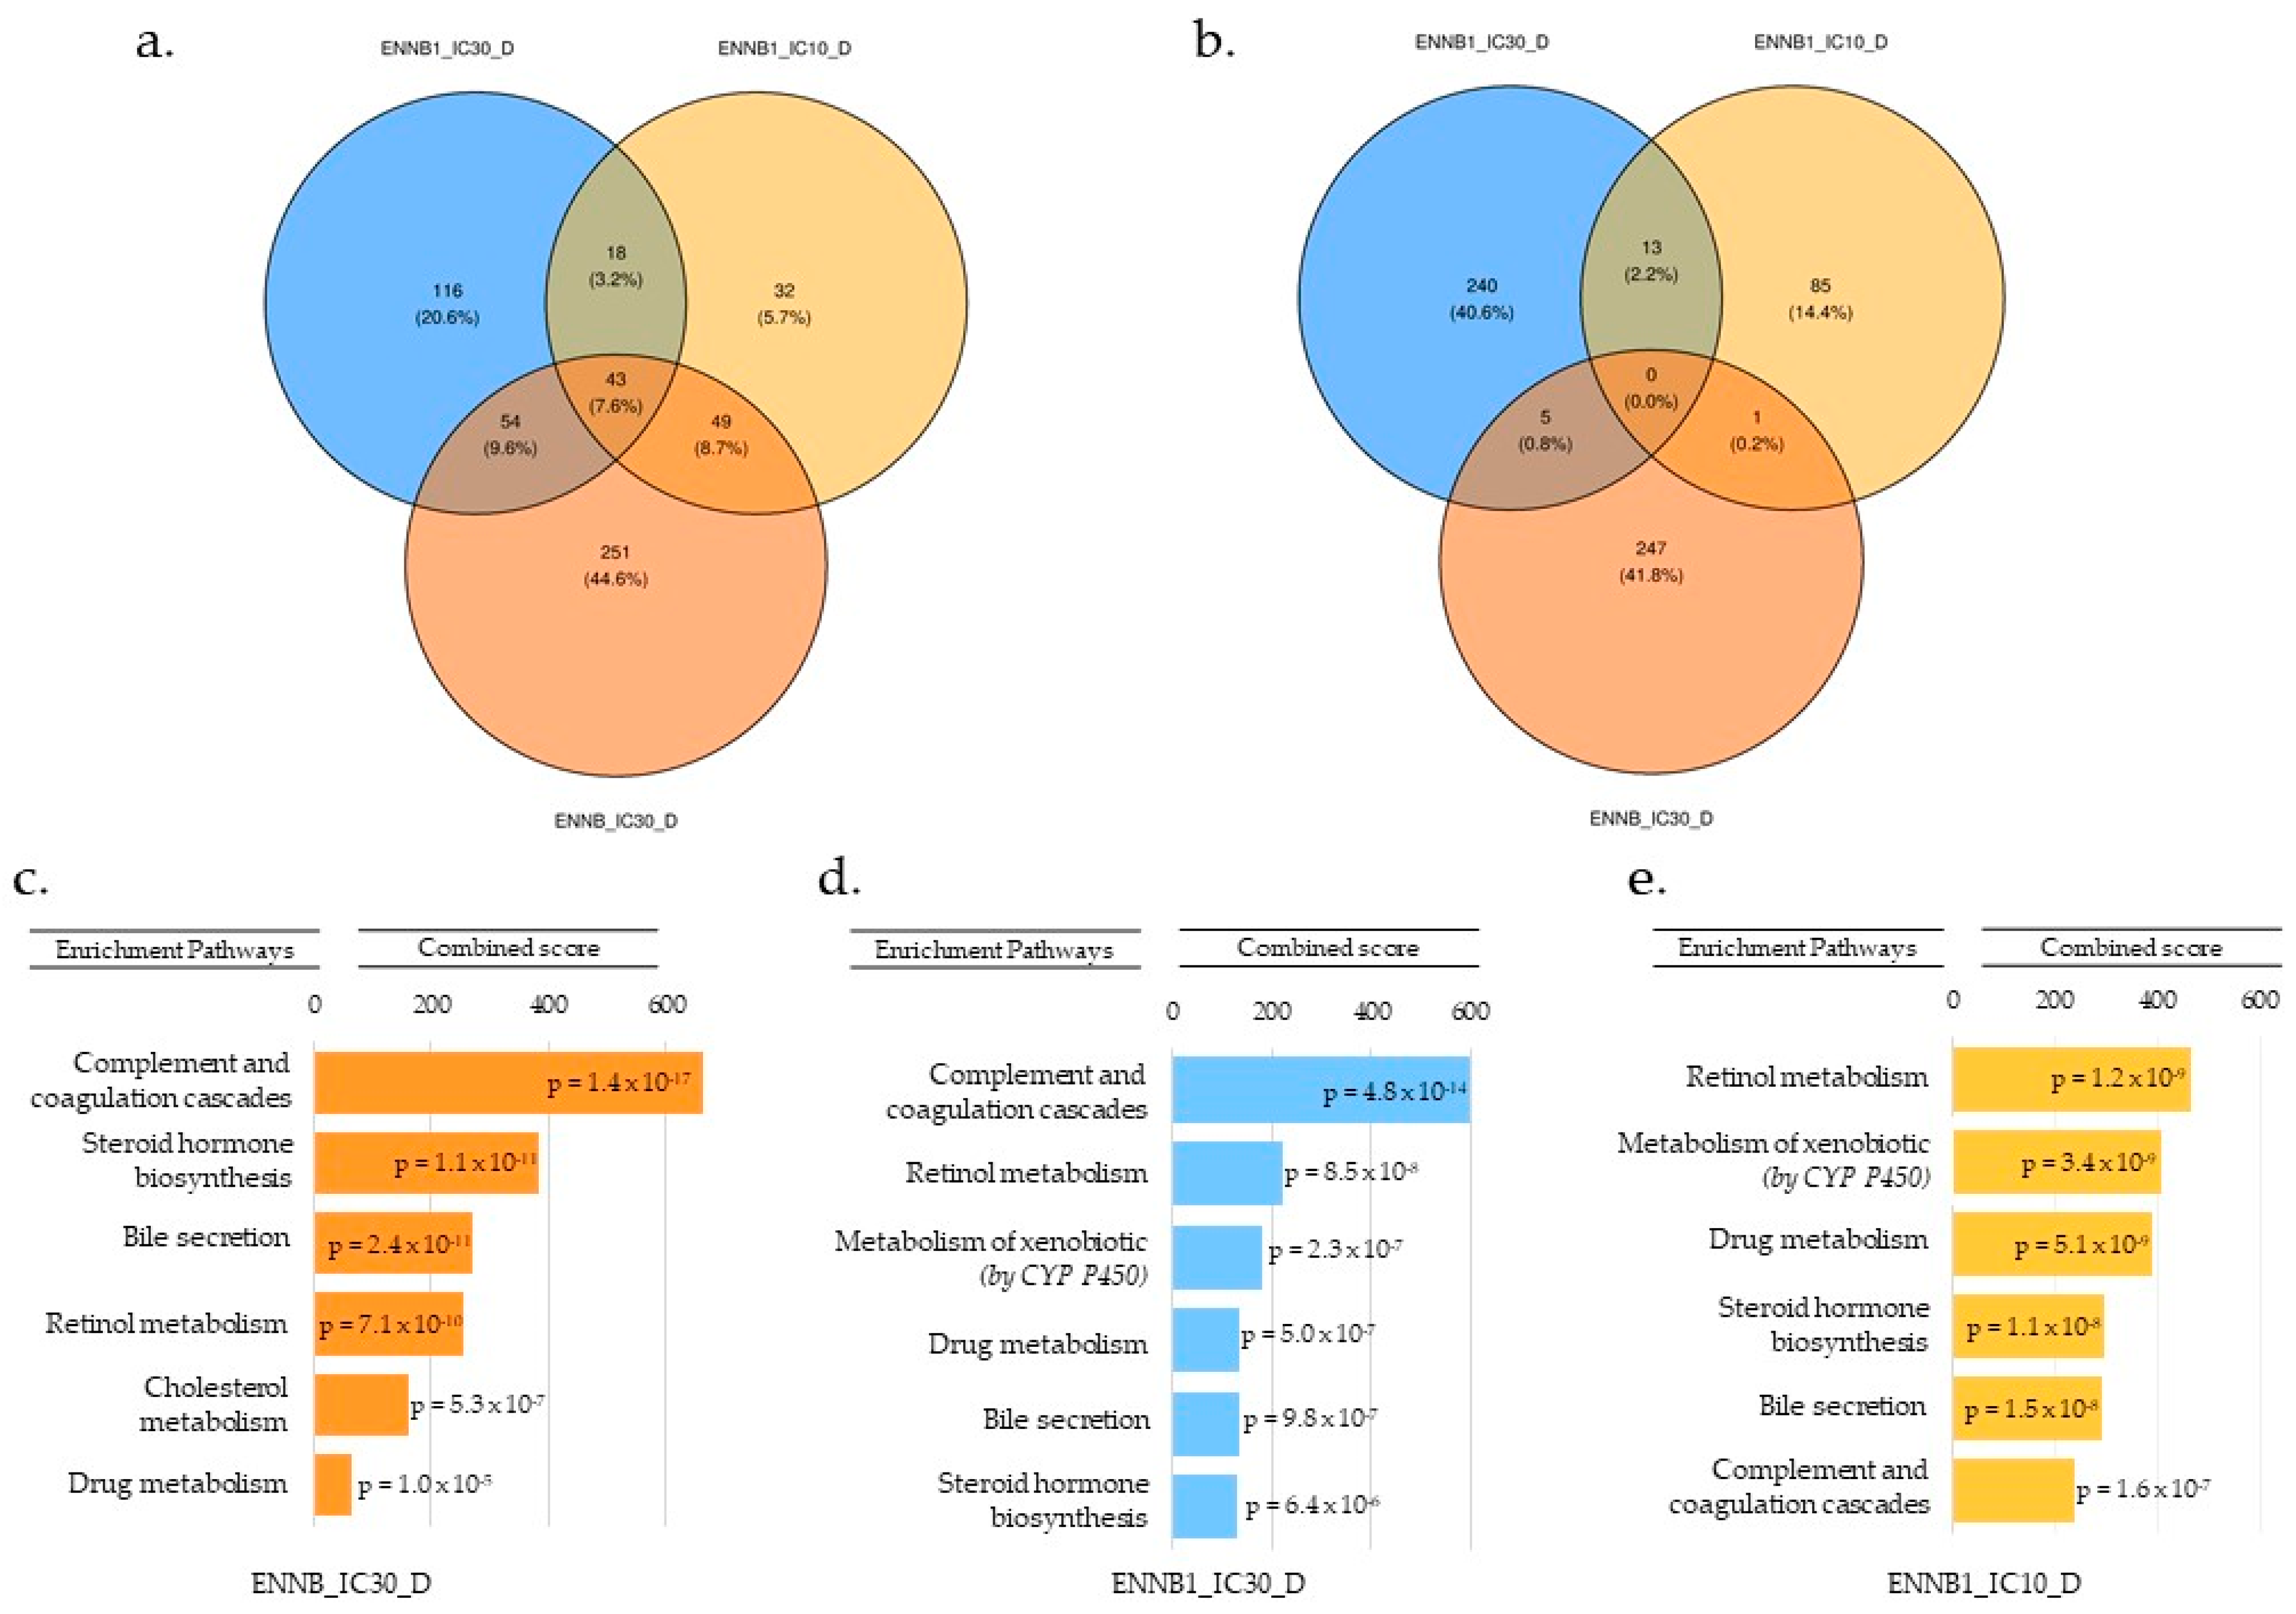
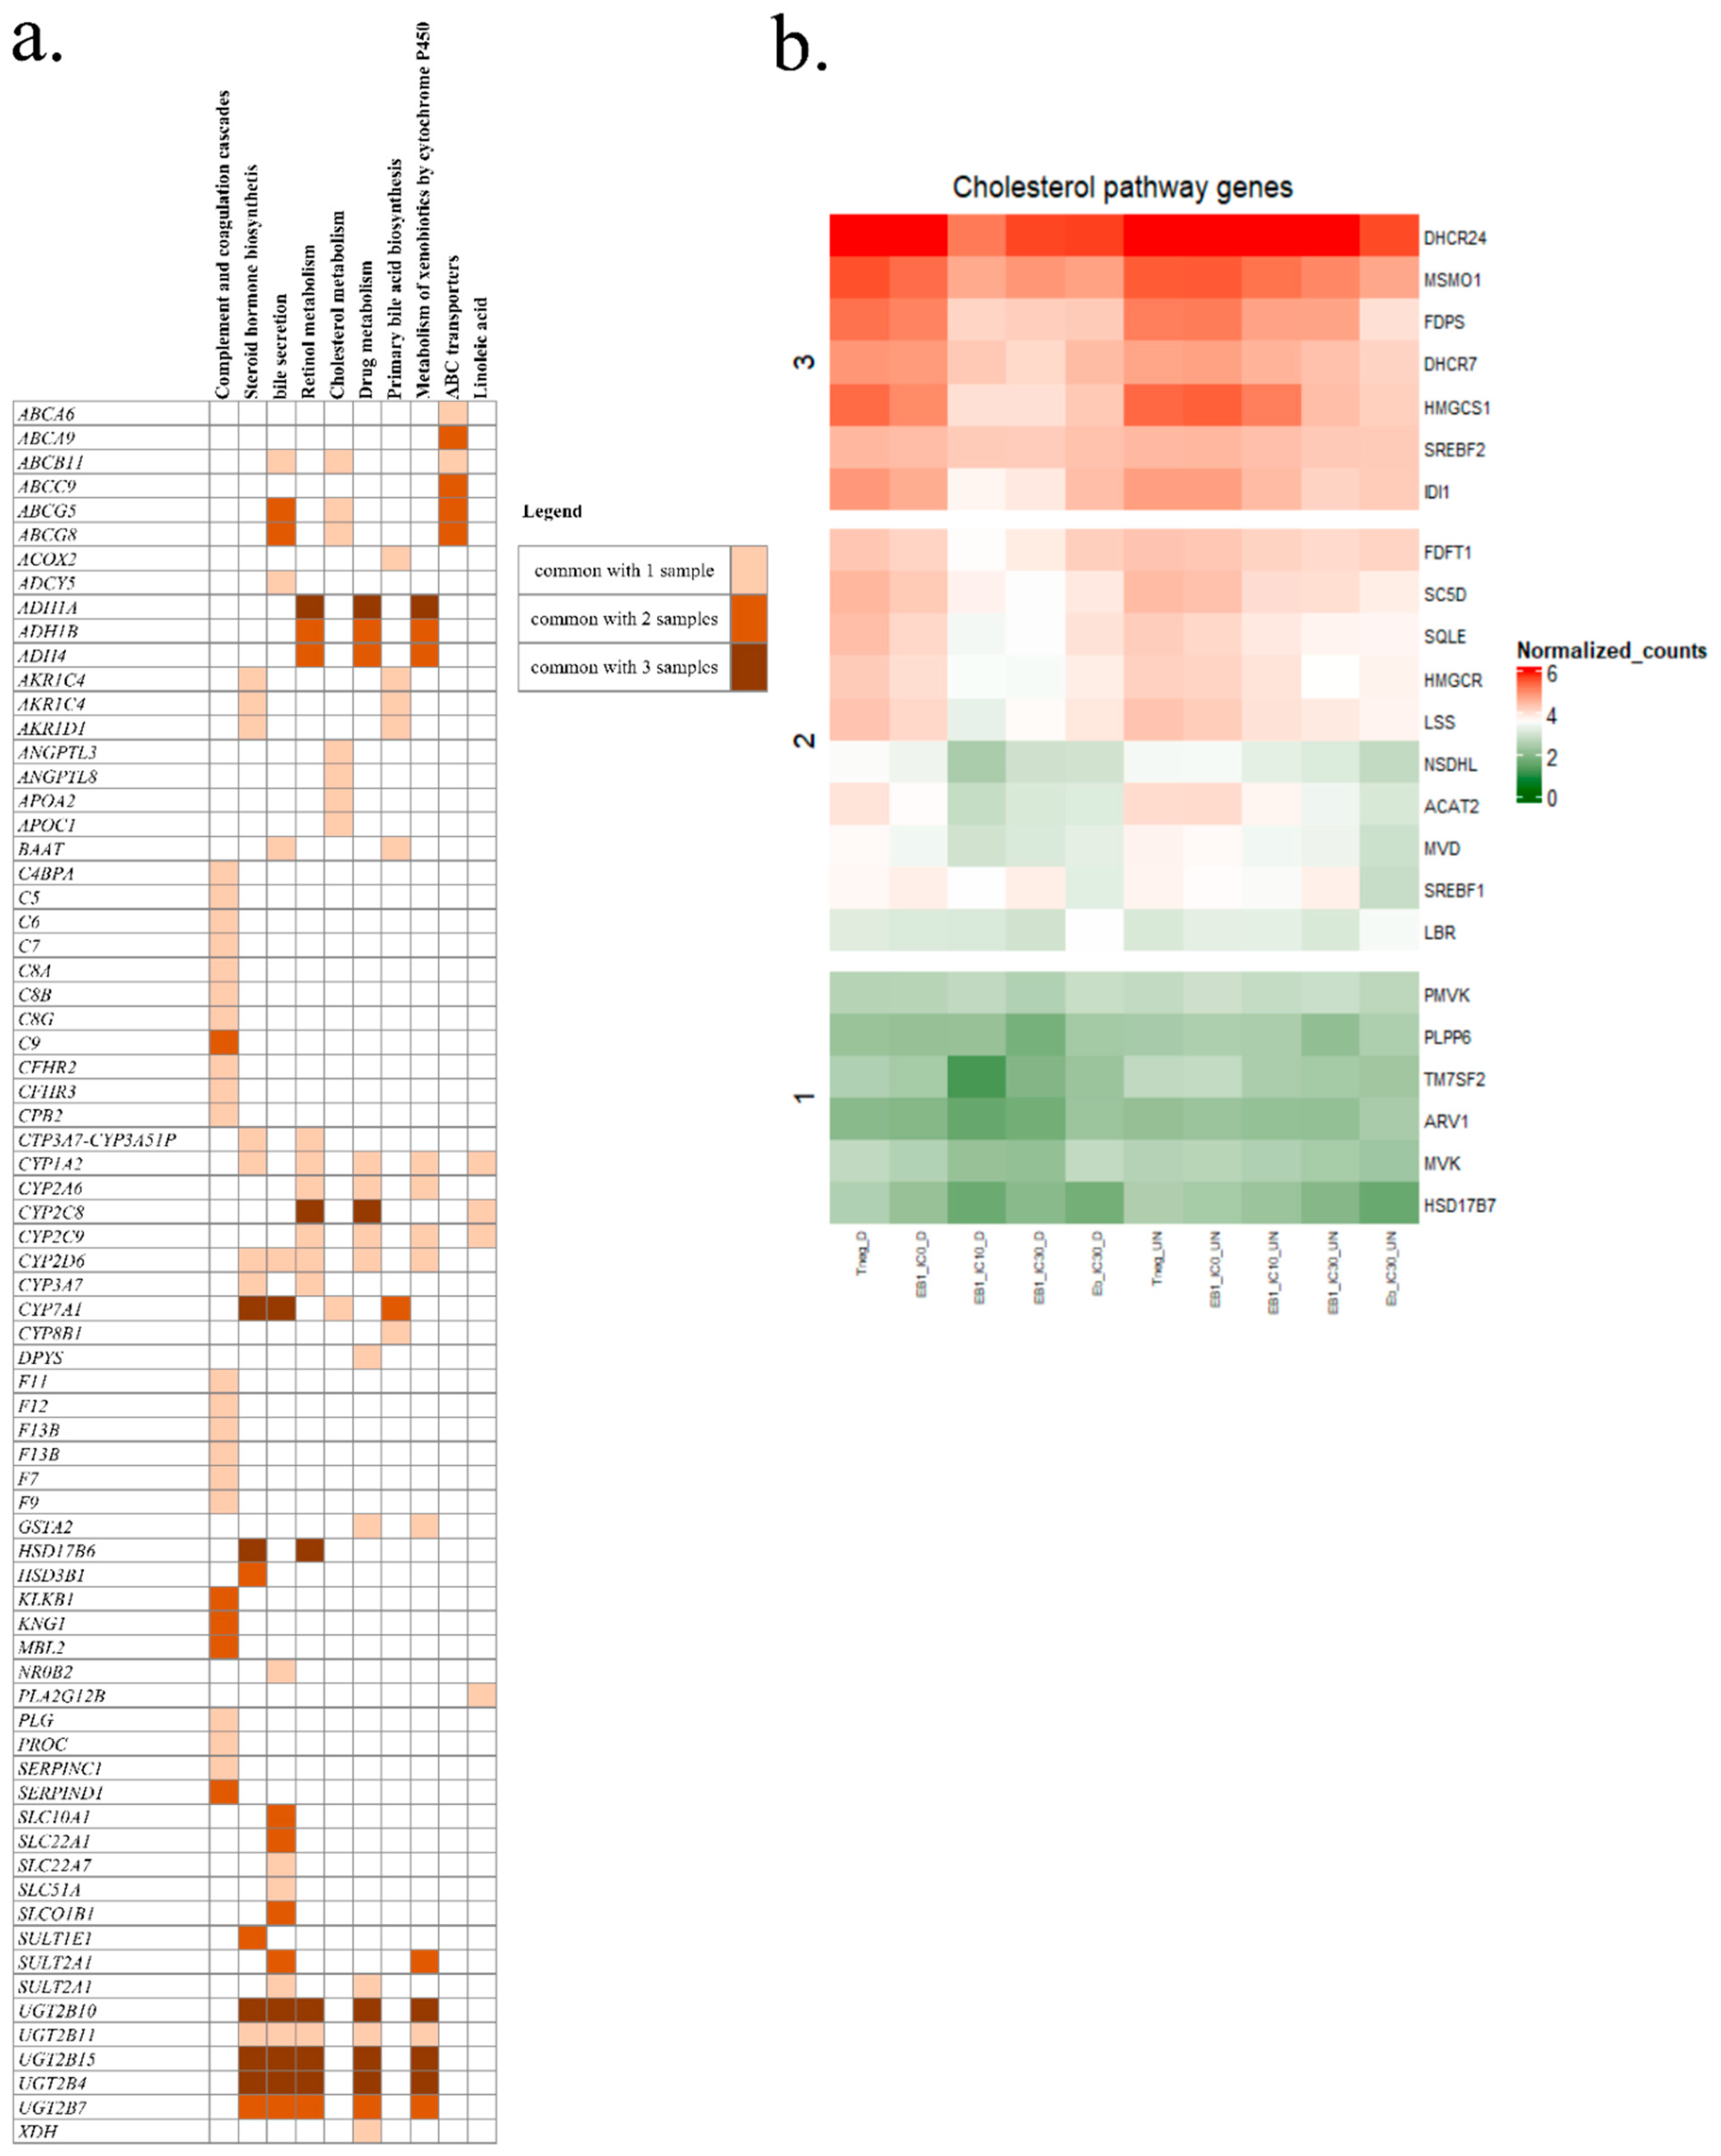
2.3. RNA-Seq Analysis
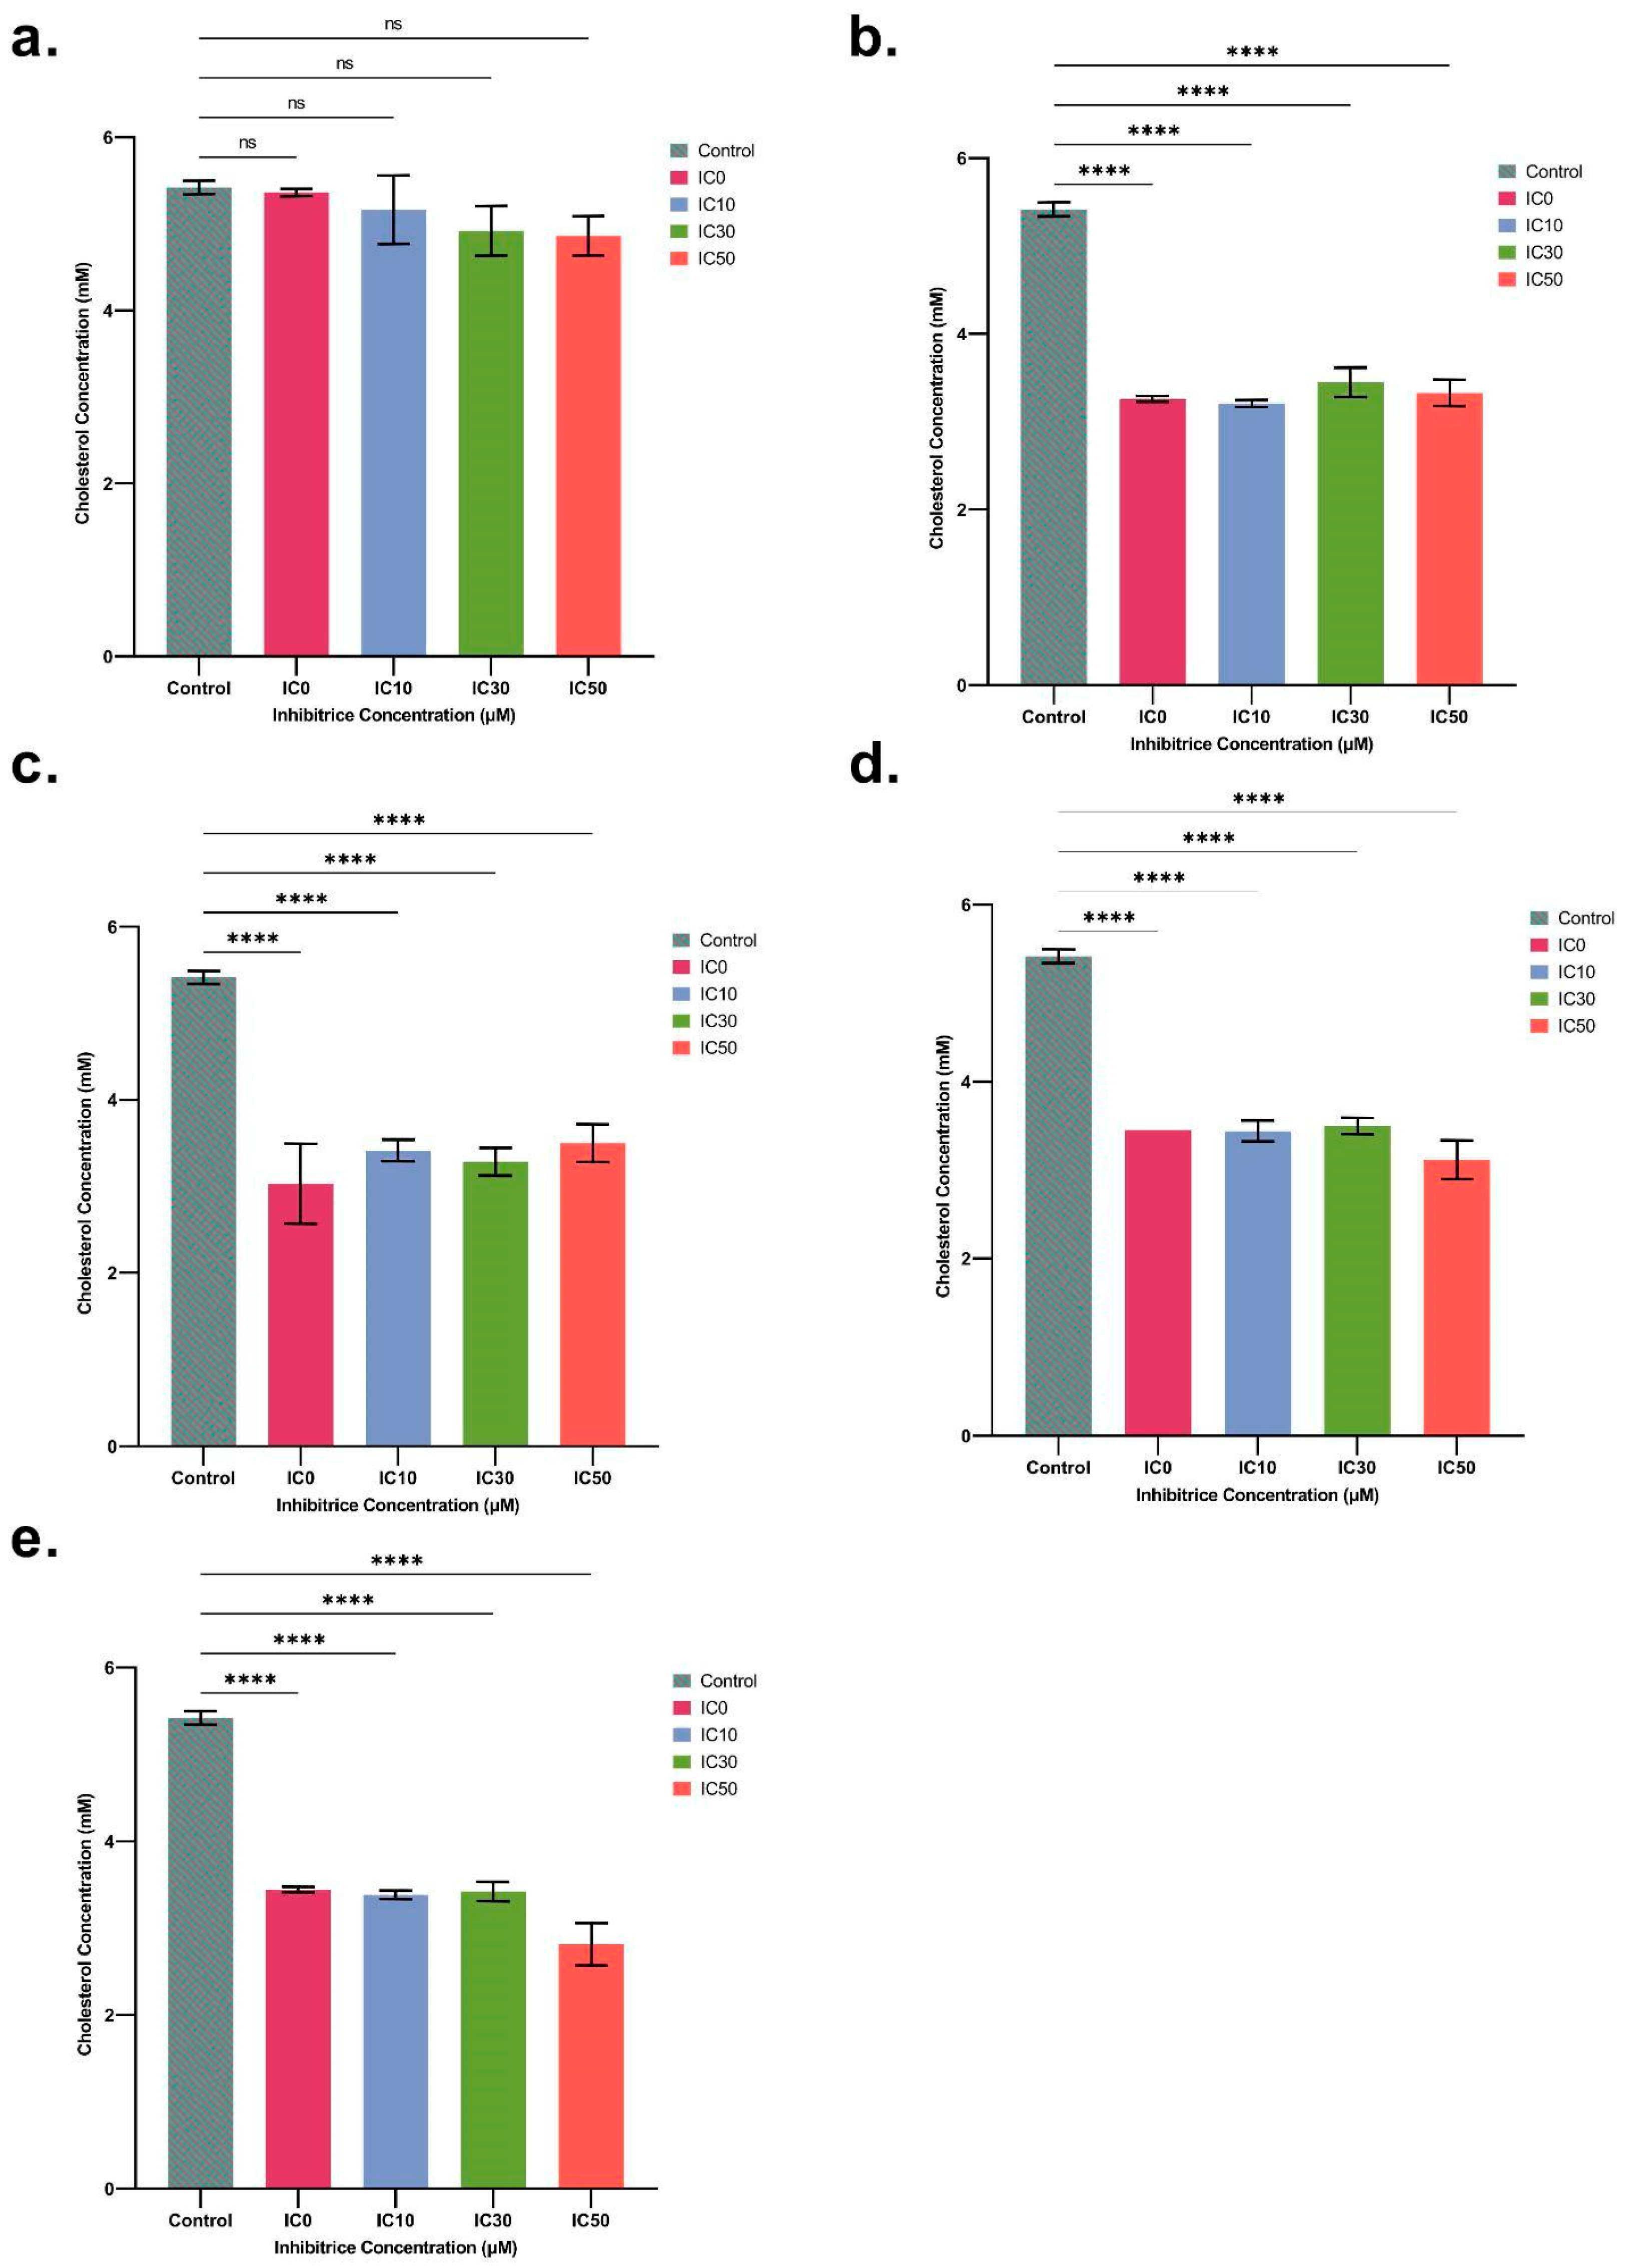
2.4. Quantification of Cholesterol and Cholesterol Esters in Spheroids
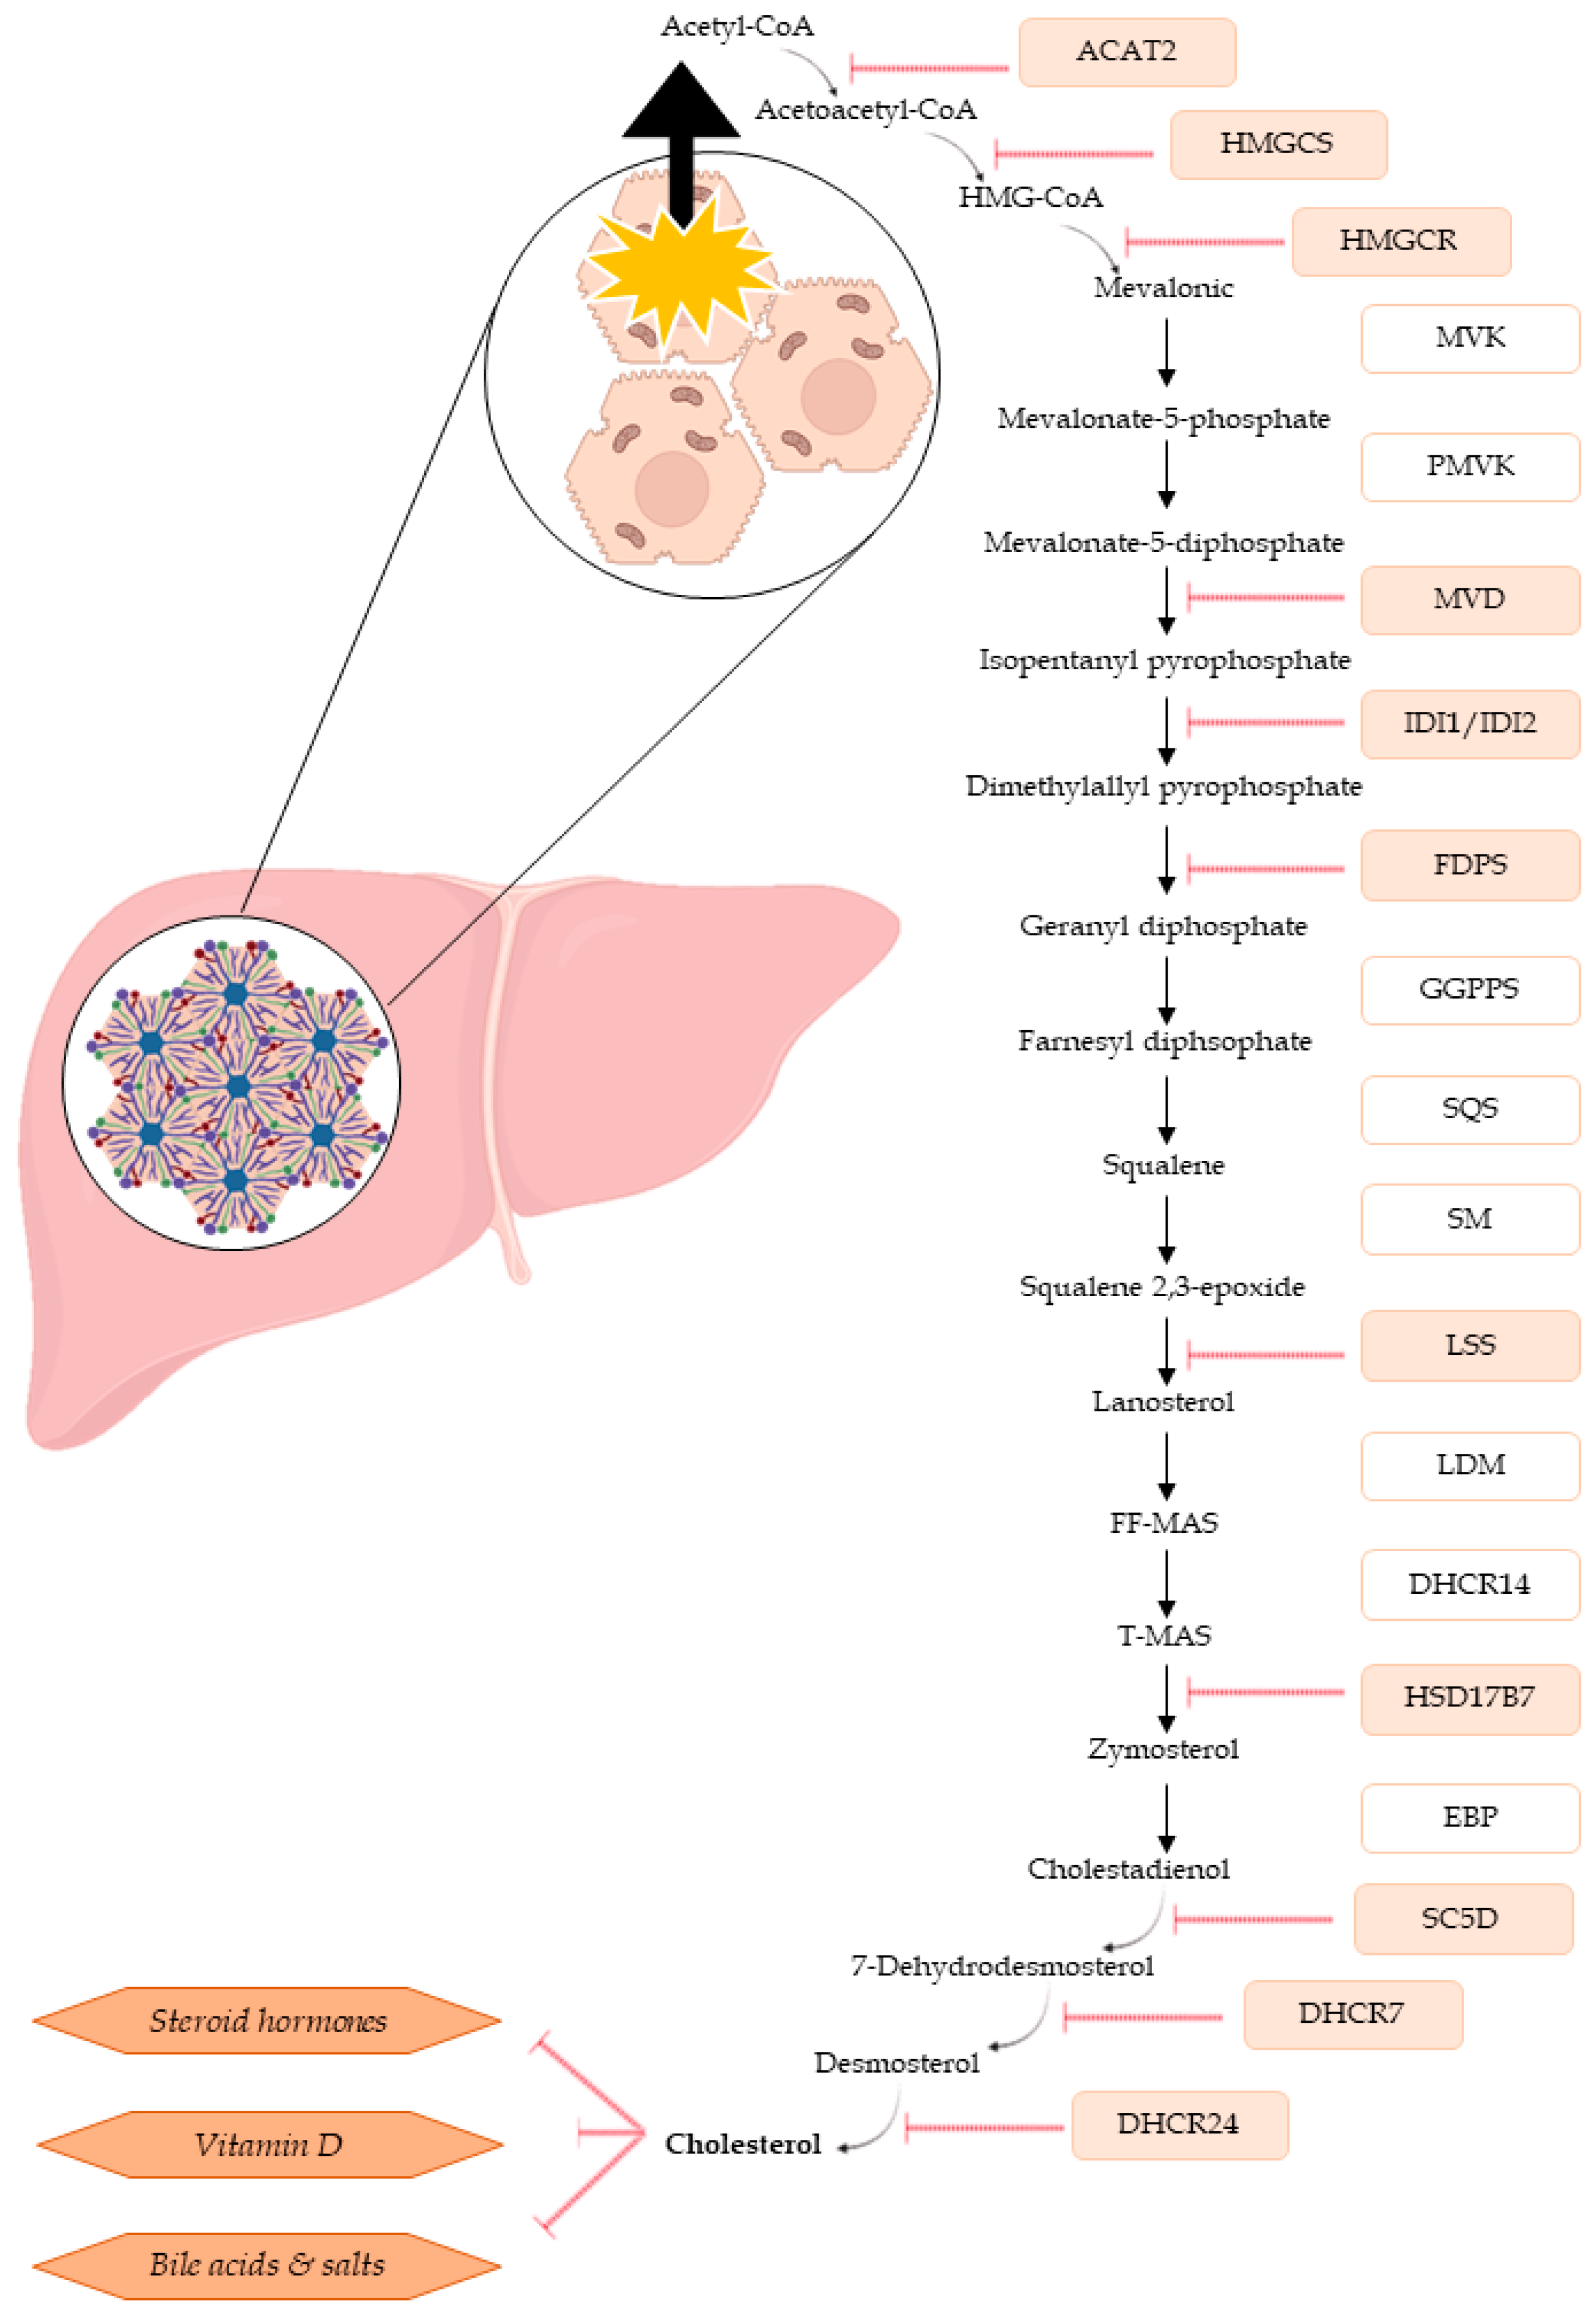
3. Discussion
4. Conclusions
5. Materials and Methods
5.1. Chemicals and Reagents
5.2. Cell Culture Conditions
5.3. HepaRG 2D and 3D Models
5.4. MTS Cytotoxicity Assay on 2D Model
5.5. 3D Cell Viability Assay
5.6. Cholesterol Quantification in Spheroids
5.7. RNA Extraction from Spheroids
5.8. RNA Sequencing (RNA-Seq) Analysis
5.8.1. Differential Gene Expression
5.8.2. Pathway Enrichment Analysis
5.8.3. Visualization of Differential Expression Analysis
5.9. Statistical Analyses
Supplementary Materials
Author Contributions
Funding
Institutional Review Board Statement
Informed Consent Statement
Data Availability Statement
Acknowledgments
Conflicts of Interest
References
- Zander, P.; Amjath-Babu, T.S.; Preissel, S.; Reckling, M.; Bues, A.; Schläfke, N.; Kuhlman, T.; Bachinger, J.; Uthes, S.; Stoddard, F.; et al. Grain Legume Decline and Potential Recovery in European Agriculture: A Review. Agron. Sustain. Dev. 2016, 36, 26. [Google Scholar] [CrossRef]
- FAOSTAT. Available online: https://www.fao.org/faostat/fr/#rankings/countries_by_commodity (accessed on 1 December 2023).
- Marin, D.E.; Pistol, G.C.; Bulgaru, C.V.; Taranu, I. Cytotoxic and Inflammatory Effects of Individual and Combined Exposure of HepG2 Cells to Zearalenone and Its Metabolites. Naunyn Schmiedebergs Arch. Pharmacol. 2019, 392, 937–947. [Google Scholar] [CrossRef] [PubMed]
- Hymery, N.; Vasseur, V.; Coton, M.; Mounier, J.; Jany, J.-L.; Barbier, G.; Coton, E. Filamentous Fungi and Mycotoxins in Cheese: A Review. Compr. Rev. Food Sci. Food Saf. 2014, 13, 437–456. [Google Scholar] [CrossRef] [PubMed]
- Alshannaq, A.; Yu, J.-H. Occurrence, Toxicity, and Analysis of Major Mycotoxins in Food. Int. J. Environ. Res. Public Health 2017, 14, 632. [Google Scholar] [CrossRef] [PubMed]
- Coton, M.; Dantigny, P. Mycotoxin Migration in Moldy Foods. Curr. Opin. Food Sci. 2019, 29, 88–93. [Google Scholar] [CrossRef]
- Döll, S.; Dänicke, S.; Valenta, H. Residues of Deoxynivalenol (DON) in Pig Tissue after Feeding Mash or Pellet Diets Containing Low Concentrations. Mol. Nutr. Food Res. 2008, 52, 727–734. [Google Scholar] [CrossRef]
- Miller, J.D. Mycotoxins in Small Grains and Maize: Old Problems, New Challenges. Food Addit. Contam. Part A 2008, 25, 219–230. [Google Scholar] [CrossRef]
- Prosperini, A.; Berrada, H.; Ruiz, M.J.; Caloni, F.; Coccini, T.; Spicer, L.J.; Perego, M.C.; Lafranconi, A. A Review of the Mycotoxin Enniatin B. Front. Public Health 2017, 5, 304. [Google Scholar] [CrossRef]
- Eskola, M.; Kos, G.; Elliott, C.T.; Hajšlová, J.; Mayar, S.; Krska, R. Worldwide Contamination of Food-Crops with Mycotoxins: Validity of the Widely Cited “FAO Estimate” of 25. Crit. Rev. Food Sci. Nutr. 2020, 60, 2773–2789. [Google Scholar] [CrossRef]
- Bräse, S.; Gläser, F.; Kramer, C.S.; Lindner, S.; Linsenmeier, A.M.; Masters, K.-S.; Meister, A.C.; Ruff, B.M.; Zhong, S. Introduction. In The Chemistry of Mycotoxins; Bräse, S., Gläser, F., Kramer, C., Lindner, S., Linsenmeier, A.M., Masters, K.-S., Meister, A.C., Ruff, B.M., Zhong, S., Eds.; Progress in the Chemistry of Organic Natural Products; Springer: Vienna, Austria, 2013; p. 1. ISBN 978-3-7091-1312-7. [Google Scholar]
- Kowalska, K.; Habrowska-Górczyńska, D.E.; Piastowska-Ciesielska, A.W. Zearalenone as an Endocrine Disruptor in Humans. Environ. Toxicol. Pharmacol. 2016, 48, 141–149. [Google Scholar] [CrossRef]
- Pleadin, J.; Frece, J.; Markov, K. Mycotoxins in Food and Feed. In Advances in Food and Nutrition Research; Elsevier: Amsterdam, The Netherlands, 2019; Volume 89, pp. 297–345. ISBN 978-0-12-817171-4. [Google Scholar]
- Dai, C.; Xiao, X.; Sun, F.; Zhang, Y.; Hoyer, D.; Shen, J.; Tang, S.; Velkov, T. T-2 Toxin Neurotoxicity: Role of Oxidative Stress and Mitochondrial Dysfunction. Arch. Toxicol. 2019, 93, 3041–3056. [Google Scholar] [CrossRef] [PubMed]
- Gruber-Dorninger, C.; Novak, B.; Nagl, V.; Berthiller, F. Emerging Mycotoxins: Beyond Traditionally Determined Food Contaminants. J. Agric. Food Chem. 2017, 65, 7052–7070. [Google Scholar] [CrossRef] [PubMed]
- Mahdjoubi, C.K.; Arroyo-Manzanares, N.; Hamini-Kadar, N.; García-Campaña, A.M.; Mebrouk, K.; Gámiz-Gracia, L. Multi-Mycotoxin Occurrence and Exposure Assessment Approach in Foodstuffs from Algeria. Toxins 2020, 12, 194. [Google Scholar] [CrossRef] [PubMed]
- Mishra, S.; Srivastava, S.; Dewangan, J.; Divakar, A.; Kumar Rath, S. Global Occurrence of Deoxynivalenol in Food Commodities and Exposure Risk Assessment in Humans in the Last Decade: A Survey. Crit. Rev. Food Sci. Nutr. 2020, 60, 1346–1374. [Google Scholar] [CrossRef] [PubMed]
- DSM the Global Threat January—December 2022. Our Company | DSM. Available online: https://www.dsm.com/corporate/our-company.html (accessed on 27 June 2023).
- Juan-García, A.; Juan, C.; Tolosa, J.; Ruiz, M.-J. Effects of Deoxynivalenol, 3-Acetyl-Deoxynivalenol and 15-Acetyl-Deoxynivalenol on Parameters Associated with Oxidative Stress in HepG2 Cells. Mycotoxin Res. 2019, 35, 197–205. [Google Scholar] [CrossRef] [PubMed]
- Taroncher, M.; Rodríguez-Carrasco, Y.; Ruiz, M.-J. Interactions between T-2 Toxin and Its Metabolites in HepG2 Cells and in Silico Approach. Food Chem. Toxicol. 2021, 148, 111942. [Google Scholar] [CrossRef]
- Smith, M.-C.; Hymery, N.; Troadec, S.; Pawtowski, A.; Coton, E.; Madec, S. Hepatotoxicity of Fusariotoxins, Alone and in Combination, towards the HepaRG Human Hepatocyte Cell Line. Food Chem. Toxicol. 2017, 109, 439–451. [Google Scholar] [CrossRef]
- Juan-García, A.; Manyes, L.; Ruiz, M.-J.; Font, G. Involvement of Enniatins-Induced Cytotoxicity in Human HepG2 Cells. Toxicol. Lett. 2013, 218, 166–173. [Google Scholar] [CrossRef]
- Ivanova, L.; Egge-Jacobsen, W.M.; Solhaug, A.; Thoen, E.; Fæste, C.K. Lysosomes as a Possible Target of Enniatin B-Induced Toxicity in Caco-2 Cells. Chem. Res. Toxicol. 2012, 25, 1662–1674. [Google Scholar] [CrossRef]
- Prosperini, A.; Juan-García, A.; Font, G.; Ruiz, M.J. Reactive Oxygen Species Involvement in Apoptosis and Mitochondrial Damage in Caco-2 Cells Induced by Enniatins A, A1, B and B1. Toxicol. Lett. 2013, 222, 36–44. [Google Scholar] [CrossRef]
- Kalayou, S.; Ndossi, D.; Frizzell, C.; Groseth, P.K.; Connolly, L.; Sørlie, M.; Verhaegen, S.; Ropstad, E. An Investigation of the Endocrine Disrupting Potential of Enniatin B Using In Vitro Bioassays. Toxicol. Lett. 2015, 233, 84–94. [Google Scholar] [CrossRef] [PubMed]
- Ricklin, D.; Hajishengallis, G.; Yang, K.; Lambris, J.D. Complement—A Key System for Immune Surveillance and Homeostasis. Nat. Immunol. 2010, 11, 785–797. [Google Scholar] [CrossRef]
- Desta, Z.; Flockhart, D.A. Chapter 18—Pharmacogenetics of Drug Metabolism. In Clinical and Translational Science, 2nd ed.; Robertson, D., Williams, G.H., Eds.; Academic Press: Cambridge, MA, USA, 2017; pp. 327–345. ISBN 978-0-12-802101-9. [Google Scholar]
- Chiang, J.Y.L.; Ferrell, J.M. Up to Date on Cholesterol 7 Alpha-Hydroxylase (CYP7A1) in Bile Acid Synthesis. Liver Res. 2020, 4, 47. [Google Scholar] [CrossRef] [PubMed]
- Backman, J.T.; Filppula, A.M.; Niemi, M.; Neuvonen, P.J. Role of Cytochrome P450 2C8 in Drug Metabolism and Interactions. Pharmacol. Rev. 2016, 68, 168–241. [Google Scholar] [CrossRef] [PubMed]
- Liu, J.; Carlson, H.A.; Scott, E.E. The Structure and Characterization of Human Cytochrome P450 8B1 Supports Future Drug Design for Nonalcoholic Fatty Liver Disease and Diabetes. J. Biol. Chem. 2022, 298, 102344. [Google Scholar] [CrossRef]
- Vergnes, L.; Phan, J.; Stolz, A.; Reue, K. A Cluster of Eight Hydroxysteroid Dehydrogenase Genes Belonging to the Aldo-Keto Reductase Supergene Family on Mouse Chromosome 13. J. Lipid Res. 2003, 44, 503–511. [Google Scholar] [CrossRef]
- Zhu, Y.-S.; Imperato-McGinley, J.L. 4.02—Disorders of Sex Development in Males: Molecular Genetics, Epigenetics, Gender Identity, and Cognition. In Hormones, Brain and Behavior, 3rd ed.; Pfaff, D.W., Joëls, M., Eds.; Academic Press: Oxford, UK, 2017; pp. 59–103. ISBN 978-0-12-803608-2. [Google Scholar]
- Olleik, H.; Nicoletti, C.; Lafond, M.; Courvoisier-Dezord, E.; Xue, P.; Hijazi, A.; Baydoun, E.; Perrier, J.; Maresca, M. Comparative Structure-Activity Analysis of the Antimicrobial Activity, Cytotoxicity, and Mechanism of Action of the Fungal Cyclohexadepsipeptides Enniatins and Beauvericin. Toxins 2019, 11, 514. [Google Scholar] [CrossRef]
- Taroncher, M.; Rodríguez-Carrasco, Y.; Ruiz, M.-J. T-2 Toxin and Its Metabolites: Characterization, Cytotoxic Mechanisms and Adaptive Cellular Response in Human Hepatocarcinoma (HepG2) Cells. Food Chem. Toxicol. 2020, 145, 111654. [Google Scholar] [CrossRef]
- Ivanova, L.; Skjerve, E.; Eriksen, G.S.; Uhlig, S. Cytotoxicity of Enniatins A, A1, B, B1, B2 and B3 from Fusarium Avenaceum. Toxicon 2006, 47, 868–876. [Google Scholar] [CrossRef]
- Fernández-Blanco, C.; Elmo, L.; Waldner, T.; Ruiz, M.-J. Cytotoxic Effects Induced by Patulin, Deoxynivalenol and Toxin T2 Individually and in Combination in Hepatic Cells (HepG2). Food Chem. Toxicol. 2018, 120, 12–23. [Google Scholar] [CrossRef]
- Cetin, Y.; Bullerman, L.B. Cytotoxicity of Fusarium Mycotoxins to Mammalian Cell Cultures as Determined by the MTT Bioassay. Food Chem. Toxicol. 2005, 43, 755–764. [Google Scholar] [CrossRef]
- Zhou, H.; George, S.; Hay, C.; Lee, J.; Qian, H.; Sun, X. Individual and Combined Effects of Aflatoxin B 1, Deoxynivalenol and Zearalenone on HepG2 and RAW 264.7 Cell Lines. Food Chem. Toxicol. 2017, 103, 18–27. [Google Scholar] [CrossRef]
- Wang, H.W.; Wang, J.Q.; Zheng, B.Q.; Li, S.L.; Zhang, Y.D.; Li, F.D.; Zheng, N. Cytotoxicity Induced by Ochratoxin A, Zearalenone, and α-Zearalenol: Effects of Individual and Combined Treatment. Food Chem. Toxicol. 2014, 71, 217–224. [Google Scholar] [CrossRef]
- Meca, G.; Font, G.; Ruiz, M.J. Comparative Cytotoxicity Study of Enniatins A, A1, A2, B, B1, B4 and J3 on Caco-2 Cells, Hep-G2 and HT-29. Food Chem. Toxicol. 2011, 49, 2464–2469. [Google Scholar] [CrossRef]
- Sampaziotis, F.; Cardoso de Brito, M.; Madrigal, P.; Bertero, A.; Saeb-Parsy, K.; Soares, F.A.C.; Schrumpf, E.; Melum, E.; Karlsen, T.H.; Bradley, J.A.; et al. Cholangiocytes Derived from Human Induced Pluripotent Stem Cells for Disease Modeling and Drug Validation. Nat. Biotechnol. 2015, 33, 845–852. [Google Scholar] [CrossRef]
- Renner, H.; Becker, K.J.; Kagermeier, T.E.; Grabos, M.; Eliat, F.; Günther, P.; Schöler, H.R.; Bruder, J.M. Cell-Type-Specific High Throughput Toxicity Testing in Human Midbrain Organoids. Front. Mol. Neurosci. 2021, 14, 715054. [Google Scholar] [CrossRef]
- Akkerman, N.; Defize, L.H.K. Dawn of the Organoid Era. BioEssays 2017, 39, 1600244. [Google Scholar] [CrossRef]
- Andersson, T.B.; Kanebratt, K.P.; Kenna, J.G. The HepaRG Cell Line: A Unique In Vitro Tool for Understanding Drug Metabolism and Toxicology in Human. Expert. Opin. Drug Metab. Toxicol. 2012, 8, 909–920. [Google Scholar] [CrossRef]
- Lübberstedt, M.; Müller-Vieira, U.; Mayer, M.; Biemel, K.M.; Knöspel, F.; Knobeloch, D.; Nüssler, A.K.; Gerlach, J.C.; Zeilinger, K. HepaRG Human Hepatic Cell Line Utility as a Surrogate for Primary Human Hepatocytes in Drug Metabolism Assessment In Vitro. J. Pharmacol. Toxicol. Methods 2011, 63, 59–68. [Google Scholar] [CrossRef]
- Josse, R.; Dumont, J.; Fautrel, A.; Robin, M.-A.; Guillouzo, A. Identification of Early Target Genes of Aflatoxin B1 in Human Hepatocytes, Inter-Individual Variability and Comparison with Other Genotoxic Compounds. Toxicol. Appl. Pharmacol. 2012, 258, 176–187. [Google Scholar] [CrossRef]
- Dornetshuber, R.; Heffeter, P.; Kamyar, M.-R.; Peterbauer, T.; Berger, W.; Lemmens-Gruber, R. Enniatin Exerts P53-Dependent Cytostatic and P53-Independent Cytotoxic Activities against Human Cancer Cells. Chem. Res. Toxicol. 2007, 20, 465–473. [Google Scholar] [CrossRef]
- Manyes, L.; Escrivá, L.; Ruiz, M.J.; Juan-García, A. Beauvericin and Enniatin B Effects on a Human Lymphoblastoid Jurkat T-Cell Model. Food Chem. Toxicol. 2018, 115, 127–135. [Google Scholar] [CrossRef]
- Zhang, Z.; Zou, Z.; Dai, H.; Ye, R.; Di, X.; Li, R.; Ha, Y.; Sun, Y.; Gan, S. Key Genes Involved in Cell Cycle Arrest and DNA Damage Repair Identified in Anaplastic Thyroid Carcinoma Using Integrated Bioinformatics Analysis. Transl. Cancer Res. 2020, 9, 4188. [Google Scholar] [CrossRef]
- Tschopp, J.; Masson, D.; Stanley, K.K. Structural/Functional Similarity between Proteins Involved in Complement- and Cytotoxic T-Lymphocyte-Mediated Cytolysis. Nature 1986, 322, 831–834. [Google Scholar] [CrossRef]
- Xie, C.B.; Jane-Wit, D.; Pober, J.S. Complement Membrane Attack Complex: New Roles, Mechanisms of Action, and Therapeutic Targets. Am. J. Pathol. 2020, 190, 1138–1150. [Google Scholar] [CrossRef]
- Schiffer, L.; Barnard, L.; Baranowski, E.S.; Gilligan, L.C.; Taylor, A.E.; Arlt, W.; Shackleton, C.H.L.; Storbeck, K.-H. Human Steroid Biosynthesis, Metabolism and Excretion Are Differentially Reflected by Serum and Urine Steroid Metabolomes: A Comprehensive Review. J. Steroid Biochem. Mol. Biol. 2019, 194, 105439. [Google Scholar] [CrossRef]
- Chiminelli, I.; Spicer, L.J.; Maylem, E.R.S.; Caloni, F. In Vitro Effects of Enniatin A on Steroidogenesis and Proliferation of Bovine Granulosa Cells. Toxins 2022, 14, 714. [Google Scholar] [CrossRef]
- Cortinovis, C.; Caloni, F.; Schreiber, N.B.; Spicer, L.J. Effects of Fumonisin B1 Alone and Combined with Deoxynivalenol or Zearalenone on Porcine Granulosa Cell Proliferation and Steroid Production. Theriogenology 2014, 81, 1042–1049. [Google Scholar] [CrossRef]
- Albonico, M.; Schutz, L.F.; Caloni, F.; Cortinovis, C.; Spicer, L.J. In Vitro Effects of the Fusarium Mycotoxins Fumonisin B1 and Beauvericin on Bovine Granulosa Cell Proliferation and Steroid Production. Toxicon 2017, 128, 38–45. [Google Scholar] [CrossRef]
- Payne, A.H.; Hales, D.B. Overview of Steroidogenic Enzymes in the Pathway from Cholesterol to Active Steroid Hormones. Endocr. Rev. 2004, 25, 947–970. [Google Scholar] [CrossRef]
- Chiang, J.Y. Regulation of Bile Acid Synthesis. Front. Biosci. 1998, 3, d176–d193. [Google Scholar] [CrossRef]
- Chiang, J.Y.L. Bile Acids: Regulation of Synthesis. J. Lipid Res. 2009, 50, 1955–1966. [Google Scholar] [CrossRef]
- Porter, F.D.; Herman, G.E. Malformation Syndromes Caused by Disorders of Cholesterol Synthesis. J. Lipid Res. 2011, 52, 6–34. [Google Scholar] [CrossRef]
- Gunness, P.; Mueller, D.; Shevchenko, V.; Heinzle, E.; Ingelman-Sundberg, M.; Noor, F. 3D Organotypic Cultures of Human HepaRG Cells: A Tool for In Vitro Toxicity Studies. Toxicol. Sci. 2013, 133, 67–78. [Google Scholar] [CrossRef]
- Chen, S.; Zhou, Y.; Chen, Y.; Gu, J. Fastp: An Ultra-Fast All-in-One FASTQ Preprocessor. Bioinformatics 2018, 34, i884–i890. [Google Scholar] [CrossRef]
- Dobin, A.; Davis, C.A.; Schlesinger, F.; Drenkow, J.; Zaleski, C.; Jha, S.; Batut, P.; Chaisson, M.; Gingeras, T.R. STAR: Ultrafast Universal RNA-Seq Aligner. Bioinformatics 2013, 29, 15–21. [Google Scholar] [CrossRef]
- Home—Sentieon | Enable Precision Data for Precision Medicine. Available online: https://www.sentieon.com/ (accessed on 27 June 2023).
- Liao, Y.; Smyth, G.K.; Shi, W. featureCounts: An Efficient General Purpose Program for Assigning Sequence Reads to Genomic Features. Bioinformatics 2014, 30, 923–930. [Google Scholar] [CrossRef]
- Robinson, M.D.; McCarthy, D.J.; Smyth, G.K. edgeR: A Bioconductor Package for Differential Expression Analysis of Digital Gene Expression Data. Bioinformatics 2010, 26, 139–140. [Google Scholar] [CrossRef]
- Kuleshov, M.V.; Jones, M.R.; Rouillard, A.D.; Fernandez, N.F.; Duan, Q.; Wang, Z.; Koplev, S.; Jenkins, S.L.; Jagodnik, K.M.; Lachmann, A.; et al. Enrichr: A Comprehensive Gene Set Enrichment Analysis Web Server 2016 Update. Nucleic Acids Res. 2016, 44, W90–W97. [Google Scholar] [CrossRef]
- Mootha, V.K.; Lindgren, C.M.; Eriksson, K.-F.; Subramanian, A.; Sihag, S.; Lehar, J.; Puigserver, P.; Carlsson, E.; Ridderstråle, M.; Laurila, E.; et al. PGC-1α-Responsive Genes Involved in Oxidative Phosphorylation Are Coordinately Downregulated in Human Diabetes. Nat. Genet. 2003, 34, 267–273. [Google Scholar] [CrossRef]
- Subramanian, A.; Tamayo, P.; Mootha, V.K.; Mukherjee, S.; Ebert, B.L.; Gillette, M.A.; Paulovich, A.; Pomeroy, S.L.; Golub, T.R.; Lander, E.S.; et al. Gene Set Enrichment Analysis: A Knowledge-Based Approach for Interpreting Genome-Wide Expression Profiles. Proc. Natl. Acad. Sci. USA 2005, 102, 15545–15550. [Google Scholar] [CrossRef] [PubMed]
- Zhao, T.; Wang, Z. GraphBio: A Shiny Web App to Easily Perform Popular Visualization Analysis for Omics Data. Front. Genet. 2022, 13, 957317. [Google Scholar] [CrossRef] [PubMed]

| Inhibitory Concentration | IC10 (μM) | IC30 (μM) | IC50 (μM) | |||
|---|---|---|---|---|---|---|
| Model | 2D | 3D | 2D | 3D | 2D | 3D |
| T-2 | ns | ns | ns | |||
| 0.031 | 0.026 | 0.084 | 0.036 | 0.11 | 0.042 | |
| DON | ns | ns | ns | |||
| 1.78 | 0.53 | 3.48 | 1.90 | 3.86 | 4.49 | |
| ZEA | ns | <0.0001 | <0.0001 | |||
| 41.09 | 2.56 | 47.21 | 6.43 | 48.09 | 12.17 | |
| ENN B | ns | ns | ns | |||
| 9.25 ± 2.02 | 7.25 ± 4.92 | 11.06 ± 2.15 | 10.39 ± 2.33 | 11.96 ± 2.20 | 15.17 ± 1.03 | |
| ENN B1 | ns | ns | ns | |||
| 6.19 ± 4.51 | 4.55 ± 2.38 | 7.83 ± 4.72 | 7.46 ± 1.74 | 8.61 ± 4.66 | 14.58 ± 0.108 | |
| ENN A | ns | ns | ns | |||
| 7.88 ± 3.48 | 5.18 ± 2.75 | 9.76 ± 4.27 | 7.06 ± 2.43 | 10.93 ± 4.80 | 13.89 ± 0.76 | |
| ENN A1 | ns | ns | ns | |||
| 2.64 ± 0.18 | 2.29 ± 0.72 | 3.12 ± 0.19 | 2.98 ± 0.41 | 3.36 ± 0.21 | 3.86 ± 0.36 | |
| BEA | ns | ns | ns | |||
| 3.30 ± 1.6 | 3.72 ± 2.56 | 4.14 ± 1.55 | 4.05 ± 1.65 | 4.54 ± 1.73 | 6.71 ± 1.54 | |
Disclaimer/Publisher’s Note: The statements, opinions and data contained in all publications are solely those of the individual author(s) and contributor(s) and not of MDPI and/or the editor(s). MDPI and/or the editor(s) disclaim responsibility for any injury to people or property resulting from any ideas, methods, instructions or products referred to in the content. |
© 2024 by the authors. Licensee MDPI, Basel, Switzerland. This article is an open access article distributed under the terms and conditions of the Creative Commons Attribution (CC BY) license (https://creativecommons.org/licenses/by/4.0/).
Share and Cite
Coulet, F.; Coton, M.; Iperi, C.; Belinger Podevin, M.; Coton, E.; Hymery, N. Cytotoxic Effects of Major and Emerging Mycotoxins on HepaRG Cells and Transcriptomic Response after Exposure of Spheroids to Enniatins B and B1. Toxins 2024, 16, 54. https://doi.org/10.3390/toxins16010054
Coulet F, Coton M, Iperi C, Belinger Podevin M, Coton E, Hymery N. Cytotoxic Effects of Major and Emerging Mycotoxins on HepaRG Cells and Transcriptomic Response after Exposure of Spheroids to Enniatins B and B1. Toxins. 2024; 16(1):54. https://doi.org/10.3390/toxins16010054
Chicago/Turabian StyleCoulet, France, Monika Coton, Cristian Iperi, Marine Belinger Podevin, Emmanuel Coton, and Nolwenn Hymery. 2024. "Cytotoxic Effects of Major and Emerging Mycotoxins on HepaRG Cells and Transcriptomic Response after Exposure of Spheroids to Enniatins B and B1" Toxins 16, no. 1: 54. https://doi.org/10.3390/toxins16010054
APA StyleCoulet, F., Coton, M., Iperi, C., Belinger Podevin, M., Coton, E., & Hymery, N. (2024). Cytotoxic Effects of Major and Emerging Mycotoxins on HepaRG Cells and Transcriptomic Response after Exposure of Spheroids to Enniatins B and B1. Toxins, 16(1), 54. https://doi.org/10.3390/toxins16010054