Article

Multilevel Comparison of Indian Naja Venoms and Their Cross-Reactivity with Indian Polyvalent Antivenoms

1
Molecular Toxinology Laboratory, Department of Molecular Biology and Biotechnology, Tezpur University, Tezpur 784028, Assam, India
2
CSIR-Centre for Cellular and Molecular Biology, Laboratory for Conservation of Endangered Species, Hyderabad 500048, Telangana, India
3
Society for Nature Conservation, Research and Community Engagement (CONCERN), Nalikul, Hooghly 712407, West Bengal, India
4
Captive and Field Herpetology, Anglesey LL65 1YU, UK
5
Snake Research Institute, Gujarat Forest Department, Government of Gujarat, Valsad 396050, Gujarat, India
6
State Institute of Health and Family Welfare, Shimla 171009, Himachal Pradesh, India
7
Department of Zoology, Mizoram University, Aizawl 796004, Mizoram, India
8
The Liana Trust, Hunsur 571189, Karnataka, India
9
Molecular Ecology and Evolution @ Bangor (MEEB), School of Natural Sciences, Bangor University, Gwynedd LL57 2UW, UK
*
Authors to whom correspondence should be addressed.
These authors contributed equally to this work.
Current address: ICMR-Regional Medical Research Centre, Dibrugarh 786001, Assam, India.
Toxins 2023, 15(4), 258; https://doi.org/10.3390/toxins15040258
Submission received: 3 March 2023 / Revised: 21 March 2023 / Accepted: 26 March 2023 / Published: 1 April 2023
(This article belongs to the Special Issue Proteomic Analysis and Functional Characterization of Venom)

Abstract

:
Snake envenoming is caused by many biological species, rather than a single infectious agent, each with a multiplicity of toxins in their venom. Hence, developing effective treatments is challenging, especially in biodiverse and biogeographically complex countries such as India. The present study represents the first genus-wide proteomics analysis of venom composition across Naja species (N. naja, N. oxiana, and N. kaouthia) found in mainland India. Venom proteomes were consistent between individuals from the same localities in terms of the toxin families present, but not in the relative abundance of those in the venom. There appears to be more compositional variation among N. naja from different locations than among N. kaouthia. Immunoblotting and in vitro neutralization assays indicated cross-reactivity with Indian polyvalent antivenom, in which antibodies raised against N. naja are present. However, we observed ineffective neutralization of PLA2 activities of N. naja venoms from locations distant from the source of immunizing venoms. Antivenom immunoprofiling by antivenomics revealed differential antigenicity of venoms from N. kaouthia and N. oxiana, and poor reactivity towards 3FTxs and PLA2s. Moreover, there was considerable variation between antivenoms from different manufacturers. These data indicate that improvements to antivenom manufacturing in India are highly desirable.
Key Contribution: This study represents the first genus-wide proteomics analysis of venom composition and antivenom efficacy across Naja species (N. naja, N. oxiana, and N. kaouthia) found in mainland India and examines venom variability at inter-specific, intraspecific, and individual levels.

1. Introduction

India leads the world in the annual number of snakebite deaths, with the latest available figures indicating around 56,000 deaths per year [1]. This approximates one death due to snakebite for every two due to AIDS, and mainly afflicts the most impoverished inhabitants of rural areas [2]. In addition, a much larger number of non-fatal bites lead to long-term disability and consequent economic hardship due to treatment costs and the long-term effects on the health and ability of survivors to work [3]. The size and biogeographical complexity of a country such as India, and the fact that herpetology has only recently become a popular field of study, means that the taxonomy and distribution of many species are still unclear. The presently available polyvalent antivenom is manufactured using the venom of only four species, the so-called “Big Four”: Russell’s viper (Daboia russelii), spectacled cobra (Naja naja), saw-scaled viper (Echis carinatus), and common Indian krait (Bungarus caeruleus), largely obtained from a single source, the Irula Snake Catchers’ Co-operative Society (henceforth referred to as the Irula Co-op), located south of Chennai in Chengalpattu District, Tamil Nadu. The lack of efficacy of the present polyvalent antivenom, caused by venom variation within and between species, has been well documented [4,5,6] and is a far from a trivial issue.
Among the venomous species prevalent in India, cobras are widespread and are responsible for significant morbidity and mortality [7,8,9]. All Asian cobras were once included in N. naja; however, the taxonomy of the Asian cobras was resolved in the early 1990s and N. naja was found to be restricted to India, Sri Lanka, Pakistan, Nepal, and Bangladesh [10,11,12]. There are three cobra species found in mainland India; in addition, the Andaman Islands have an endemic species Naja sagittifera, which is not considered here. The spectacled cobra Naja naja is the most commonly encountered venomous species across most of India, and the most widely distributed, found in all parts of India except the northeastern states. Despite being one of the Big Four species, there are still concerns about the effectiveness of antivenom in parts of India distant from the primary source of venom used in the manufacture of antivenom. Although typical neurotoxic symptoms of cobra bite are displayed, the extent of local necrosis varies, and in some cases, coagulopathy has been reported [13,14]. However, there is considerable evidence of variation in venom components in N. naja from different regions of India from proteomic, biochemical, pharmacological, and pathophysiological studies [15,16,17,18,19,20].
The monocled cobra, Naja kaouthia, co-occurs with N. naja in the northern Gangetic plain at least as far as western Uttar Pradesh, with an isolated record from Sonipat, Haryana [12]. The species is common in West Bengal and replaces N. naja altogether in the “Seven Sister” states (Arunachal Pradesh, most of Assam, Meghalaya, Manipur, Mizoram, Nagaland, and Tripura) of northeastern India, which are connected to the remainder of India by a narrow corridor separating Bangladesh from Bhutan and Nepal. Faunistically, these northeastern states are very distinct from the rest of India, sharing more species with the Indo-Malayan biogeographical region. This has serious consequences when it comes to snakebites, as none of the Big Four species included in currently available Indian antivenoms are found here (barring a small area of western Assam). Faiz et al. (2017) reported severe neurotoxicity as well as local blistering and necrosis resulting from bites by N. kaouthia in Chittagong Division, Bangladesh, similar to sequelae reported from bites by this species in Thailand [21,22]. Geographical variation in venom composition and activity has been reported from Southeast Asian populations of N. kaouthia from Malaysia, Thailand, and Vietnam [23,24,25]. However, although these are currently considered conspecific with the Indian populations, genetic evidence [26] and unpublished data suggest species-level differences between them. Deka et al. [27] recently reported on venom variation of this species from Assam and Bangladesh, whereas Das et al. [28] documented an LD50 of 0.148 mg/kg for N. kaouthia venom from Assam and showed that Indian polyvalent antivenom neutralized some tested biochemical and biological activities under in vitro conditions, albeit at high venom to antivenom ratios (1:100). Senji Laxmi et al. (2019) added data from Arunachal Pradesh and West Bengal, indicating that West Bengal venom displayed higher toxicity (0.18–0.28, mean 0.24 mg/kg) whereas Arunachal Pradesh venom displayed lower toxicity (1.14–1.33, mean 1.23 mg/kg) than venom from the previously described localities [29].
The Central Asian or Caspian cobra, Naja oxiana, was known from the literature to occur in the mountainous northwest of India, although at least some records resulted from misidentification of the black morph of Naja naja, which lacks the typical spectacle hood mark as an adult [11,12]. The first photographic and genetic confirmation of the occurrence of this species in India, from Chamba District in Himachal Pradesh, was provided recently [30]. Although the number of bites caused by this species is not known, they are unlikely to be high as the human population density in their Indian range is low. Nevertheless, the authors are aware of a case from Chamba District which required the victim to be given ventilatory support. A clinical report of the bite of this species from Afghanistan reports pain, erythema, edema, and coagulopathy that resolved on the administration of Favirept Polyvalent Snake Antivenin [31], and based on experiments on rabbits, Angaji et al. concluded that the venom of Iranian N. oxiana had acute effects on cardiac tissue during the first few hours following snake bite [32]. Latifi et al. reported the yield and LD50 of venom of the Caspian cobra from northern Iran to be variable between males and females, with males yielding more venom but with lower toxicity [33].
A large number of proteomic studies have been carried out by different laboratories using different methods, hence difficulty arises when the comparison between venom proteomes across Naja needs to be made [15,16]. We have addressed venom variation in Indian cobras at three levels: within-locality among individuals, within-species among localities, and within-locality among species. The former is rarely addressed since venom is often pooled from a number of individuals when milking, despite inter-individual variation being well documented in a number of species [34]. In order to rationalize snakebite treatment in the biogeographically distinct Greater and Lesser Himalayan regions, we further investigated the efficacy (cross-reactivity) of the available Indian antivenoms against species not currently included in their production.

2. Results

2.1. Sampling

Two samples of N. naja and one of N. oxiana from Himachal Pradesh, three N. naja and one N. kaouthia from West Bengal, one N. kaouthia from Mizoram, Assam and Arunachal Pradesh, and two N. naja from Maharashtra were analyzed (Figure 1). Adult males were used for comparison to guard against possible sexual dimorphism and ontogenetic variation [35,36]; however, the sex of the individual from Assam was not known.

2.2. Comparative Analysis of HPLC Profiles Reveals Variation

Within-locality among individuals: The HPLC protein profiles of adult N. naja individuals from the same localities of West Bengal and Maharashtra were found to be identical in terms of protein peaks eluted, but remarkable differences in the relative absorbance of the peaks were observed (Figure 2A). However, individual N. naja venoms sourced from Chamba District of Himachal Pradesh presented similar profiles under identical chromatographic conditions.
Within-species among localities: The chromatograms of N. naja venom samples from three different locations (Himachal Pradesh, Maharashtra, West Bengal) exhibited considerable differences in peak intensities and the number of protein peaks (Figure 2A). For example, the abundance of protein peaks eluting in the initial 40 min (solvent gradient 20–23%) was greatly enhanced in the N. naja sample from Himachal Pradesh. On the other hand, the HPLC pattern of the sample from West Bengal was markedly different from the other three venoms, with a greater number of protein peaks emerging between 40 and 60 min at a solvent gradient of 27–30%. Moreover, substantial differences in elution profiles were observed when compared to venom samples from the Irula Co-op from Tamil Nadu.
The venom elution profiles were much more similar among N. kaouthia samples from four different locations: Arunachal Pradesh, Mizoram, West Bengal, and Assam (Figure 2B), with the HPLC profiles of N. kaouthia venoms from Arunachal Pradesh and Mizoram appearing relatively uniform. The HPLC profiles of N. kaouthia venom samples revealed that the majority of proteins eluted before 100 min (solvent gradient 20–43%). The venom samples demonstrated larger areas of HPLC peaks eluting between a retention time of 60 and 100 min. A distinct HPLC peak eluting at a solvent gradient of 27–30% was specifically observed in the case of the Assam sample and was absent from other samples. However, it should be noted that the sex of the Assam specimen was not known, so these differences may be due to sexual dimorphism.
Among different Naja species: The venoms of all Naja species were analyzed using the same HPLC protocol previously standardized by Deka et al. [37]. Its use in proteomics analysis of venom of N. kaouthia from Assam revealed that 3FTxs and PLA2s elute within the region indicated by a dotted box in Figure 2. The chromatographic profiles of N. naja samples varied from other Naja species in terms of the number of protein peaks and their abundances within this region. The elution pattern of the N. oxiana venom sample appeared much more similar to N. kaouthia samples (Figure 2B,C). Interestingly, the unique peak observed in the case of the N. kaouthia sample from Assam (starred in Figure 2B) was also present in the N. oxiana sample.

2.3. Venom Proteomes of Different Naja Venoms

Naja naja venoms: The relative abundances of different protein families identified in the venoms of Naja naja from Maharashtra, West Bengal, Himachal Pradesh, and Tamil Nadu are shown in Figure 3. Overall estimation of relative abundances (in the percentage of total proteins) indicated three-finger toxins (3FTx: 58–91%) and phospholipase A2 enzymes (PLA2: 4–26%) as the major protein families present. Although cardiotoxins (CTx) belong to the 3FTx family, they are represented separately in Figure 4. Low abundance proteins in N. naja venoms, including cysteine-rich secretory proteins (CRISP), l-amino acid oxidases (LAAO), nerve-growth factors (NGF), nucleotidases, phosphodiesterases (PDE), acetylcholinesterase, serine proteases, and tissue plasminogens were present in the venoms at an abundance less than 1%, and are labeled as ‘Others’ in Figure 4. Detailed analysis of protein profiles of seven N. naja venoms revealed that the 3FTxs and PLA2s are made up of similar protein isoforms. In particular, each venom analyzed displayed the presence of 3FTxs similar to N. naja long neurotoxin P25668 (Supplementary Table S1). Proteomic comparisons among individuals within the same locality were performed for Naja naja venoms from Maharashtra and West Bengal. Considerable variations in the relative abundances of toxin families were seen among the individuals from both locations. In the case of individuals from Maharashtra, cardiotoxins were detected in trace amounts (<0.1%) in Sample B, in contrast to Sample A (6%) (Figure 3, sample A. In the case of West Bengal individuals, the PLA2 toxins showed variation in abundance. The Venn diagram (Figure 3) showed that individuals from Maharashtra have around 50% of peptides in common whereas in West Bengal, 20% of shared peptides were detected.
Naja kaouthia venoms: Three out of four venoms studied here were subjected to protein identification by mass spectrometry. The proteomics analysis revealed that the venom proteome of Naja kaouthia is mainly dominated by 3FTx (largely comprised of cardiotoxins), followed by PLA2, together accounting for around 96% of total venom proteins (Figure 4I–K). The percentage abundance of cardiotoxins was higher than in N. naja venoms. Nerve growth factor, CRISP, natriuretic peptide, nucleotidase, phosphodiesterase, and LAAO were detected in minor amounts (labeled as ‘Others’). Based on our analysis, 35 proteins belonging to 9 different protein families were detected in the venom sample from Mizoram. Mass spectrometry of samples from Arunachal Pradesh and West Bengal identified 34 (12 families) and 42 proteins (14 families), respectively. Acetylcholinesterase, tissue plasminogen activator, venom factor, and vespryn were detected in trace amounts only in the West Bengal venom samples, whereas we detected serine protease and Kunitz-type inhibitors only in the Arunachal Pradesh sample.
Naja oxiana venom: The venom toxin composition for Naja oxiana venom was unique among the Naja species studied. The dominant toxin families included 3FTx (85.3%) and SVMP (9.1%). Cardiotoxins were present in trace amounts (0.1%). Other low-abundance toxin families such as 5′-nucleotidases, CRISP, Cobra venom factor, L-amino acid oxidase, and phosphodiesterases were also detected.
Comparison of proteome profiles among different Naja species: A close comparison of protein profiles suggested that Naja species share a number of highly similar 3FTxs. For instance, the venoms of both N. kaouthia and N. oxiana contain peptide fragments that exhibit amino acid sequence similarity with weak neurotoxin P25679. Peptide fragments bearing sequence similarity with long neurotoxin P25668 were detected in 9 venoms out of the 11 samples analyzed. The venom proteomes of two Naja species (N. naja and N. oxiana) from Himachal Pradesh revealed comparable relative abundances of 3FTxs (86–88%). As evident from proteome profiles, N. naja and N. kaouthia venoms from West Bengal exhibited qualitative differences in venom composition, which is further supported by a previous report [38]. Higher numbers of unique peptides were observed for N. kaouthia and N. naja from West Bengal (Figure 5). We observed 17% shared peptides across the genus (Figure 6).

2.4. Cross-Reactivity of Indian Polyvalent Antivenoms

The electrophoretic patterns of Naja samples collected from different locations were investigated (Figure 7A). Separation of venom proteins under reducing conditions revealed the presence of protein bands ranging between 10 and >40 kDa, with significant variation in protein band intensities. The SDS-PAGE profile in all venom samples revealed an abundance of protein bands in the 10–15 kDa molecular mass region. A high-intensity band at ~10 kDa was observed in all samples, whereas the intensity of the protein band at 15 kDa was highly variable between the samples. In addition, a few protein bands in the higher molecular mass region (>40 kDa) were observed.
Assessment of cross-reactivity of two Indian polyvalent antivenoms by Western blot revealed the ability of both to recognize higher molecular weight venom proteins of N. oxiana (Figure 4B,C), with lesser recognition of lower molecular weight proteins. VINS antivenom exhibited poor reactivity towards the low molecular mass protein bands. In contrast, Premium Serums displayed greater cross-reactivity towards the low molecular mass proteins of Naja venoms. Strikingly, VINS antibodies displayed extremely low reactivity towards high molecular weight proteins (≥25 kDa) of N. naja samples from locations other than that of the Irula Co-op in Tamil Nadu.
Phospholipase activity was significantly different among samples, specifically being highest in the N. naja venom from the Irula Co-op in South India, and lowest in N. oxiana from Himachal Pradesh (Figure 8A). Naja kaouthia venom from Arunachal Pradesh also showed reduced activity compared to the venom from the same species from other locations. In all cases, the phospholipase activity of N. kaouthia and N. oxiana venom was reduced to negligible levels by incubation with tested polyvalent antivenoms (Figure 8B). In contrast, PLA2 activities of N. naja venoms were not effectively neutralized by either antivenom despite being the species included in the immunizing mixture, particularly in the case of N. naja from Himachal Pradesh.

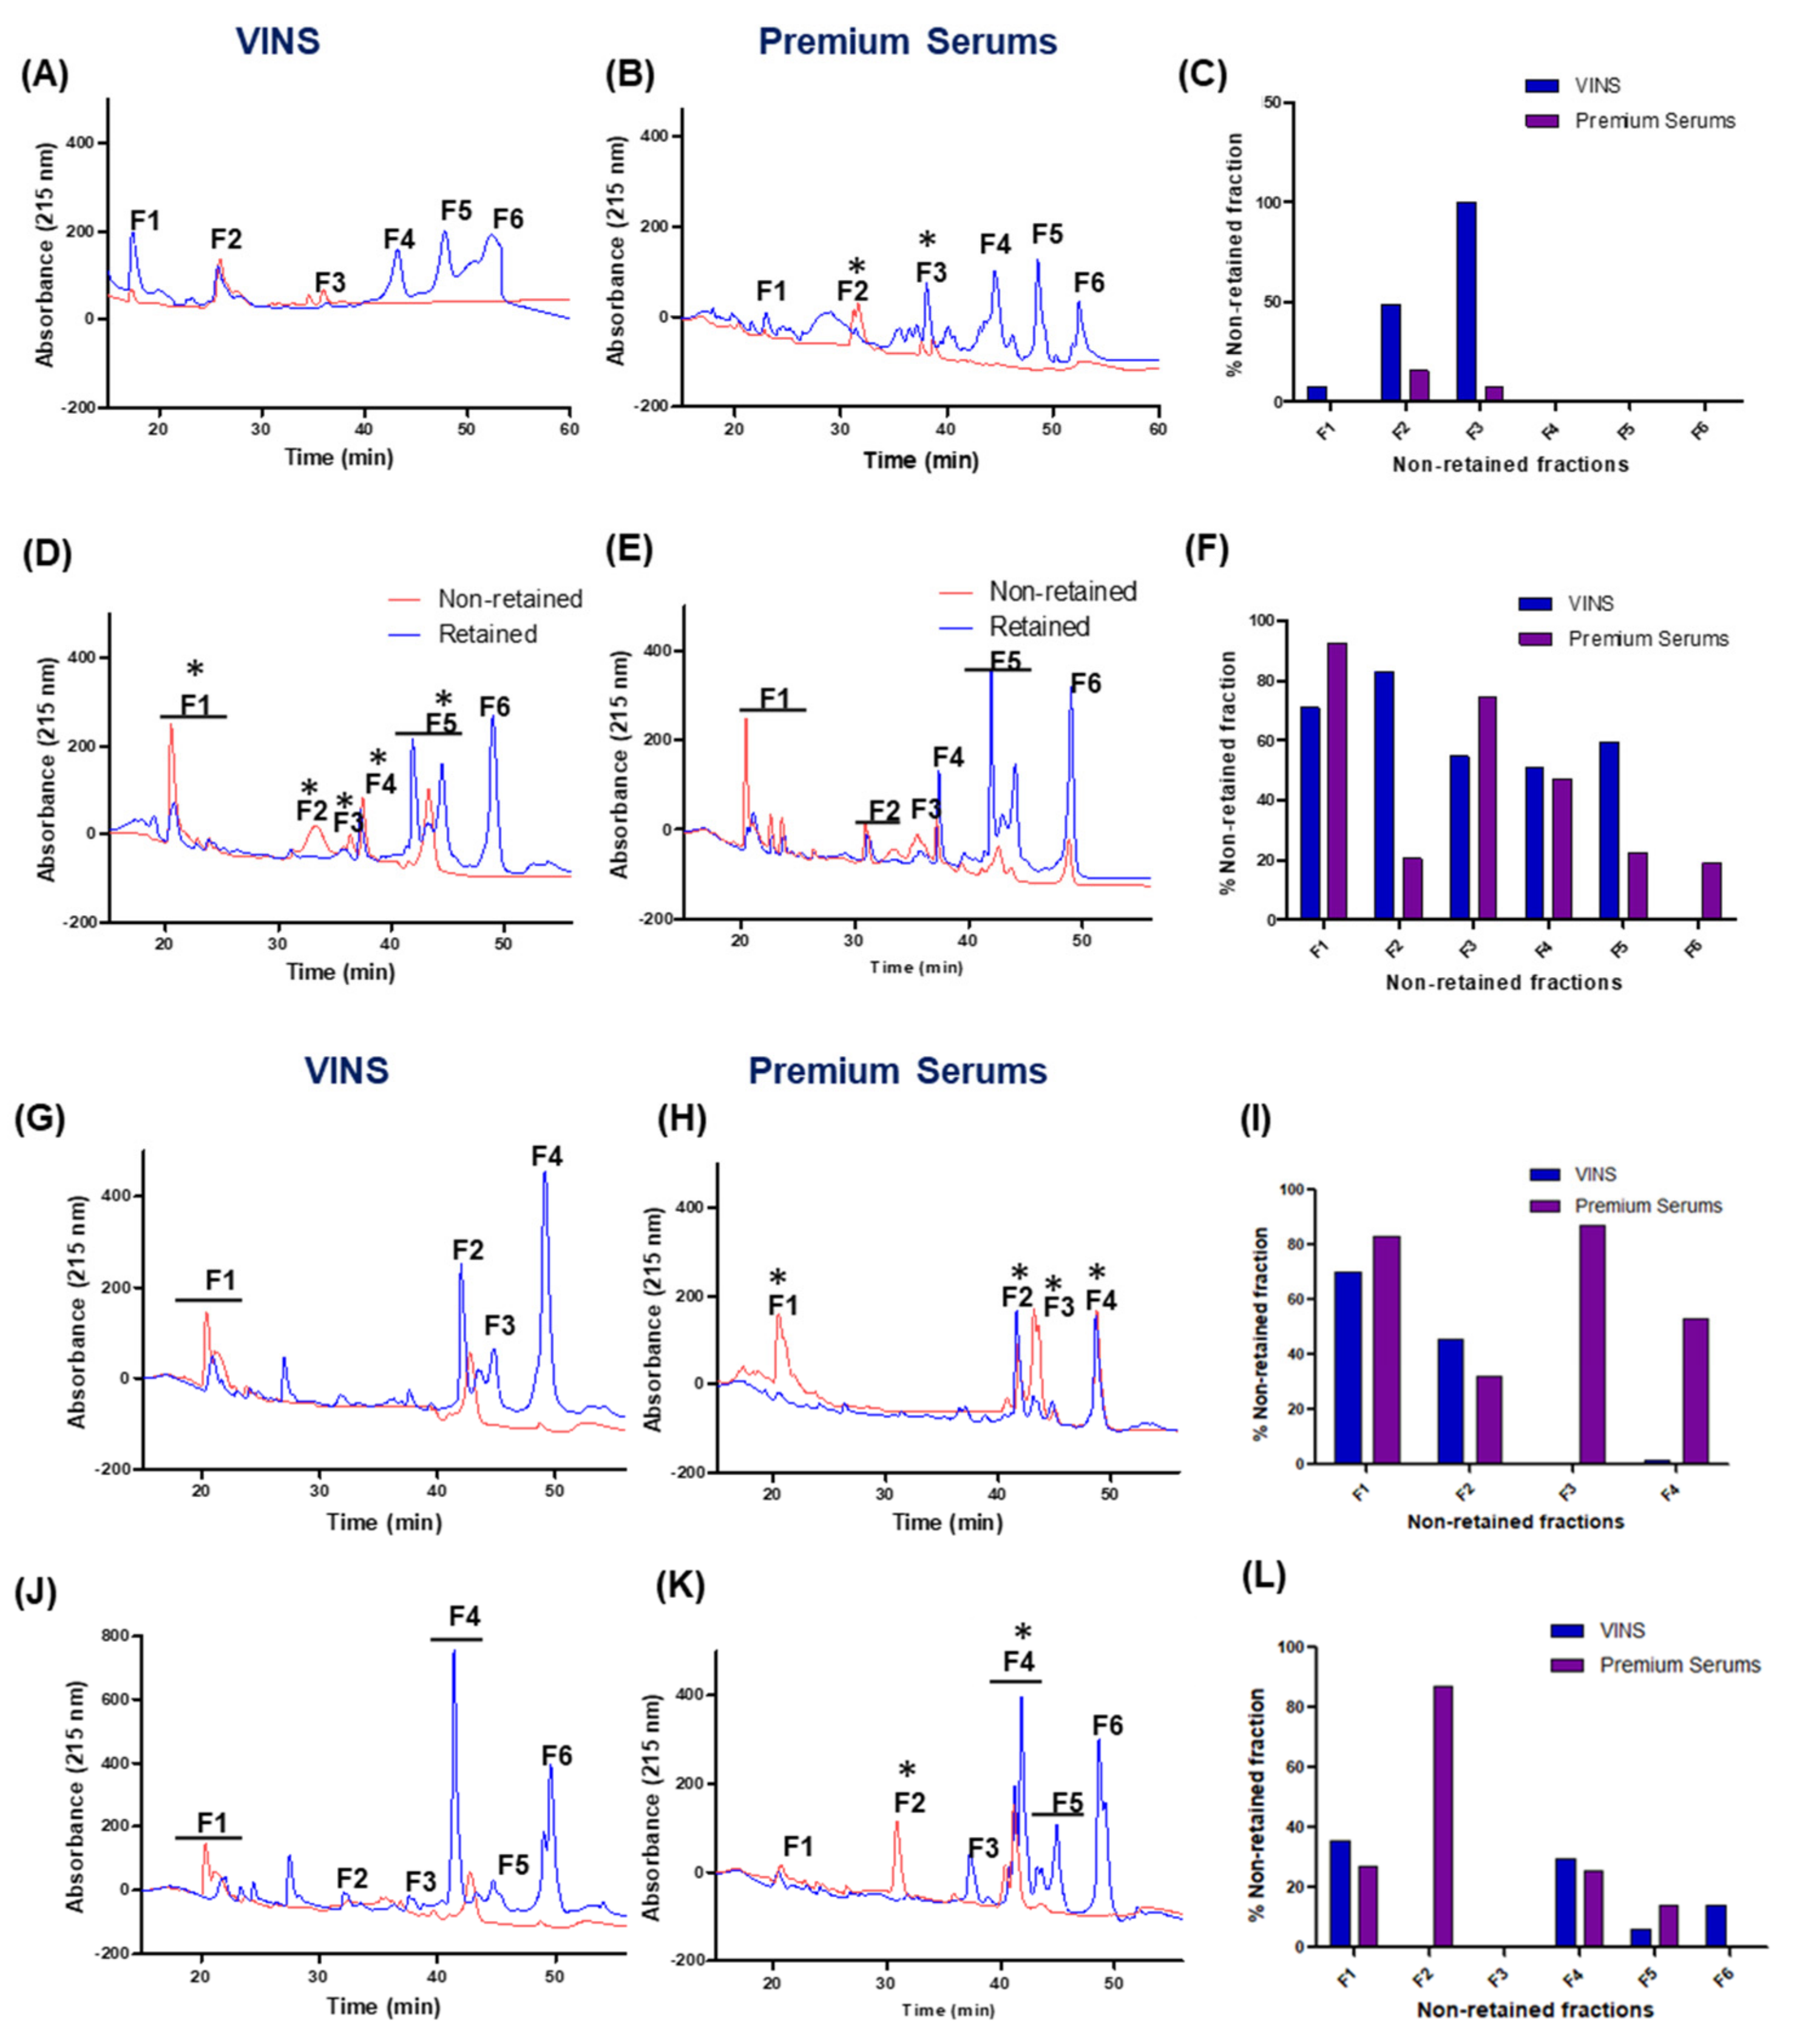
2.5. Immunoaffinity Chromatographic Profiling of Indian Polyvalent Antivenoms

An antivenomics approach was employed to investigate the immunocapturing ability of two Indian polyvalent antivenoms (VINS and Premium Serums) towards heterologous venom proteins of N. kaouthia and N. oxiana. Figure 9 depicts the outcome of antivenomic analyses of VINS PAV and Premium Serums PAV towards the venoms of N. oxiana venom (Himachal Pradesh) and N. kaouthia venoms (Arunachal Pradesh, Mizoram, West Bengal). When assessed with 75 µg of N. kaouthia and N. oxiana venoms, both the antivenoms retained the majority of venom proteins, although to a varying extent. The analysis of venom proteins retained and non-retained in the antivenom affinity columns clearly indicates that quantitative differences exist in immunorecognition capacity between VINS and Premium Serums antivenoms. For example, VINS PAV-immobilized affinity columns retained around 80% of the total input of N. oxiana venom whereas 72% of venom proteins were retained in the Premium Serums PAV-immobilized affinity column. When antivenom affinity columns were loaded with N. kaouthia venoms, higher binding affinity towards the proteins of the sample from Arunachal Pradesh was observed (77% for VINS PAV; 80% for Premium Serums PAV). The percentage of proteins immunoretained in the Premium Serums PAV affinity column was lowest (~46% of total input) for N. kaouthia venom sourced from Mizoram.
Figure 9C,F,I,L illustrate the percentage of each peak retained and non-retained by immunoaffinity columns with VINS and Premium Serums PAV. Based on the antivenomic profiles, both antivenoms possess good immunorecognition of toxins in the venom of N. oxiana (Figure 9A). However, one major peak was not retained while two were partially retained. In the case of the N. kaouthia samples, both the antivenoms retained the protein peaks only to a partial extent (Figure 9D). These antivenoms were less efficient in immunocapturing the proteins contained in peak F1.

2.6. Identification of Non-Immunoretained Proteins

Only those non-retained peaks with high protein concentrations were subjected to protein identification by mass spectrometry. Supplementary Table S2 lists proteins identified in non-retained fractions of N. oxiana and N. kaouthia venoms. Samples from Arunachal Pradesh and Mizoram had the highest number of non-retained toxins identified. For N. kaouthia venom from Arunachal Pradesh, 20 3FTxs (including 4 CTxs), as well as one protein each corresponding to PLA2, LAAO, and NGF were identified in the non-immunodepleted retained fraction (Figure 6; Supplementary Table S2). In the case of the Mizoram sample, 18 3FTxs (including 3 CTxs) and 9 PLA2s were identified, whereas 4 3FTxs (including 1 CTx) and 2 PLA2s were identified in N. kaouthia from West Bengal. For the N. oxiana sample, 10 3FTxs (including 1 CTx) were identified.

3. Discussion

Venom variability is a ubiquitous phenomenon and occurs at different taxonomic levels, including intraspecific [40]. This high degree of venom variability is the result of gene duplication and functional divergence that has led to the rapid evolution of venom proteins [41,42]. The implications of venom variation on pathological effects and management of snakebite are of serious concern and need urgent attention [18,24,43,44,45,46,47]. Thus, understanding the venom proteome is instrumental in providing useful information on unique toxins and proteins in snake venoms, and interpreting the clinical symptoms during envenomation. With advances in proteomic technologies, studies unraveling the complexity of the venom proteome have become more feasible. Cobras of the genus Naja are listed in the World Health Organization’s (WHO) category I of medically important snakes, and several proteomics studies have suggested that venom composition differs by geographical origin [48,49]. Such intraspecific venom variability is accompanied by varied envenoming effects and differential neutralization efficacy of existing antivenoms. In the present study, compositional variation has been evaluated for venoms from Indian N. naja, N. kaouthia, and N. oxiana at several levels: among Naja species, within Naja species from different geographical locations, and individual variation among specimens of the same species.
Several proteomics studies on N. naja venoms have been carried out on pooled venoms [16,39,50,51] despite the heterogeneity of venoms at an individual level being well documented in the literature and occurring in many snake species. In this study, reverse-phase HPLC protein profiles of individual N. naja specimens from the same localities were examined. Profiles exhibited similar patterns among the specimens; however, protein concentration varied between individuals from the same locations. Modahl and colleagues investigated the compositional profiles of captive N. naja populations and found similar venom composition but with slight variability in isoform concentration [52]. Huang et al. [49] reported wide differences in proteomic and glycomic profiles in adult individuals of N. atra. The researchers concluded that proteomics analysis to address inter-individual variations could be highly relevant for better antivenom production.
Accordingly, proteomics studies were carried out to explore the compositional disparity in individual N. naja specimens. In line with SDS-PAGE and RP-HPLC profiles, proteomics analysis of individual specimens exhibited noticeable differences in the expression of protein components. Unexpectedly, we observed more dramatic differences in relative abundances of protein families between N. naja individuals from West Bengal than among the specimens collected from other geographical locations. Inconsistency in the relative percentage of proteins was also observed when two different laboratories performed venom proteomics of West Bengal samples [16,29,38]. Several factors including sexual dimorphism and ontogeny might contribute to such heterogeneity of venoms but have been controlled for in this study. When the proteome profile of N. naja venom procured from the Irula Co-op (Tamil Nadu), which is largely used for the production of polyvalent antivenoms, was compared with heterologous N. naja venoms, stark differences were observed in the toxin abundance. Such differences at the intra-specific level provide a reasonable explanation for the differences in lethal potencies and variable antivenom neutralization efficacies observed [16,29,38].
The most abundant and lethal components in cobra venoms are three-finger toxins. These non-enzymatic toxins are known to induce a range of pharmacological effects including neurotoxicity, cytotoxicity, and hemostasis dysfunction. In the present study, the abundance of 3FTxs varied significantly within N. naja specimens from different geographical locations. Previous analysis of 3FTx composition of N. naja venoms sampled from Western India (Maharashtra) revealed considerable differences within a small geographical range [29,51]. In addition, a comparison of 3FTx content in West Bengal samples in this study with findings reported by others [50] suggests remarkable differences in the relative abundances. Moreover, variations in 3FTx profiles are known to be reflected in the toxicity of Naja venoms [23,53]. Accordingly, it is very likely that the marked compositional differences among populations within a small geographical range contribute to the differential reactivity observed with existing antivenoms. The observed compositional variation may also be influenced by differences in the timing of the last meal among individuals [54], and the variable expression time of each toxin during replenishment, but this requires further study.
Several high-throughput proteomics strategies have been used to characterize N. kaouthia venoms from different geographical regions of Southeast Asia [23,55]. Using multidimensional proteomics methods, Deka et al. [27] interpreted qualitative differences in venom composition in N. kaouthia samples from two geographically adjacent regions, Northeast India and Bangladesh. A recent study reported venom proteome analysis of two N. kaouthia populations from India, but a more comprehensive analysis of venoms from different populations is vital to elucidate biogeographical variation [29]. Therefore, we investigated the protein profiling of N. kaouthia venoms sourced from the eastern (West Bengal) and northeastern regions of India (Arunachal Pradesh, Mizoram). Interestingly, the proteomics data of analyzed N. kaouthia venoms revealed comparable relative abundance values for 3FTxs as well as PLA2s between N. kaouthia venoms. We observed the presence of cardiotoxins in high abundance. In contrast to our findings, Senji Laxme et al. [29] reported a greater quantity of 3FTxs in N. kaouthia venom from West Bengal than from Arunachal Pradesh. Notably, significant differences in venom composition and biochemical activities were recently reported in N. kaouthia venoms sampled at a relatively small spatial scale in Eastern India [34]. Hence, a more comprehensive study on inter-individual and intra-population venom variation in N. kaouthia is warranted to provide insights into its impact on the effectiveness of existing antivenoms.
A comparison between the proteome profiles of N. kaouthia and N. naja from the same locality in West Bengal revealed remarkable quantitative differences in venom proteins. In both venoms, unique proteins accounted for ~50% of total proteins, which is in agreement with a previous study [37]. To the best of our knowledge, this is the first study to report proteomics of N. oxiana venom of Indian origin and to compare their venom proteome with congeneric Naja species. We found N. oxiana venom to be composed of diverse pharmacologically active protein components such as 3FTxs, SVMPs, PLA2s, and several other minor components (CRISPs, venom factor, LAAOs, phosphodiesterases, etc.). A recent study investigated the proteome of Pakistani N. oxiana using a shot-gun proteomic approach [56] and reported an equal abundance of 3FTxs and SVMPs which together accounted for approximately 32% of the total venom proteome. However, our study revealed a much higher percentage of 3FTxs (~89%) than SVMPs (~7%) and a much lower percentage of PLA2s (~2% of total proteins). The notable differences observed in the relative abundances of venom proteins of N. oxiana from India and Pakistan may be due to individual variation, but may also account for differences in pathophysiological effects in envenomated victims. Comparative analysis of venoms of N. naja and N. oxiana from Himachal Pradesh displayed substantial variation in venom proteomes. A similar observation was also made in a study investigating venom proteome profiles of Pakistani N. naja and N. oxiana [57].
Even though extensive inter- and intra-specific venom variation exist, clinicians are obliged to use polyvalent antivenoms raised against venoms of the Big Four from populations inhabiting a restricted area in Tamil Nadu, collected by the Irula Co-operative Society. Large amounts of antivenom are frequently administered to snakebite victims, raising the risk of adverse reactions, increasing the cost of treating snakebites, and decreasing confidence among doctors and patients in the use of antivenom. Several reports have suggested differences in antivenom efficacy when used against snakebites in regions far from the source of immunizing venoms [9,18,34,58,59,60]. Moreover, clinical studies investigating the efficacy of Indian antivenoms in the treatment of envenoming caused by venomous species other than the Big Four have reported the ineffectiveness of heterologous polyvalent antivenoms and their potential risk in causing adverse reactions [21,61,62,63]. The evaluation of the cross-neutralization potential of antivenoms against venoms not included in the immunization mixture may help in expanding the range of existing antivenoms for clinical use. In this work, we studied the cross-neutralization potential of Indian polyvalent antivenoms against the heterologous venoms not used in immunization mixtures. Analysis of immunoblots in this study revealed that antibodies in both the antivenoms cross-reacted with high molecular mass N. kaouthia and N. oxiana venom proteins (≥25 kDa) more effectively. These are likely to belong to cysteine-rich secretory protein (CRISP) and metalloproteinase families (SVMPs). The Western blot results of Premium Serums PAV towards N. naja venom samples are in line with previous studies [16,38,51]. However, VINS polyvalent antivenom notably displayed very weak cross-reactivity towards small proteins (Mol wt. ≤ 15 kDa) from N. kaouthia venoms. The low immunogenicity of these smaller venom toxins likely prevents the production of a sufficient titer of toxin-specific antibodies [64,65]. Recombinant antibody formats have been proposed as an alternative to conventional antivenoms for effective neutralization of the weakly immunogenic venom components but have not yet been clinically deployed [66,67].
In vivo venom neutralization assays with antivenom remain the standard test for determining antivenom efficacy [68]. However, prior investigations using in vitro assays to estimate the neutralization efficacy of antivenoms are recommended to reduce the use of mice [55] and the data presented here can be used in further in vivo studies. Antivenomics profiles of Indian polyvalent antivenoms revealed differential patterns of immunorecognition towards different protein peaks when loaded with a fixed venom dose. The most remarkable observation made was that majority of unbound proteins belong to 3FTx and PLA2 families, which are major toxic components of N. kaouthia and N. oxiana venoms. Similar observations have also been made in previous studies, implicating the presence of both non-antigenic and unique proteins in the venoms [27,37,38]. The findings in our study explicitly address the correlation between protein molecular mass and immunodepletion, with the weakest depletions for low molecular mass proteins. Although both antivenoms tested performed well in neutralizing in vitro PLA2 activities of venoms from N. kaouthia and N. oxiana, they were largely ineffective towards PLA2s of N. naja. The results from the neutralization of biochemical activities of N. naja and N. kaouthia venoms corroborate well with the previous outcomes based on antivenom neutralization assays [39,51]. Although the presence of similar PLA2 isoforms was reported among the studied N. naja proteomes, significant variation in the percentage composition suggests differences in the expression of these shared PLA2 genes. Such quantitative differences could not only account for variable envenoming manifestations but may also be responsible for the poor performance of polyvalent antivenoms in the neutralization of the PLA2 activity of N. naja venoms. The proteomics data showed higher PLA2 abundance in N. kaouthia venoms, but fewer isoforms, compared to N. naja. Hence, the better neutralization of N. kaouthia could be because of lower isoform diversity in their venoms but also because the PLA2 isoforms from N. kaouthia venoms are also found in the N. naja venom from the Irula Co-op.
An immunocapturing capability of 20–25% of total proteins is often suggestive of good outcomes in in vivo neutralization assays [69]. The antivenomics data in the present study corroborates well with the results of previous invivo neutralization assays, suggesting the cross-reactivity of Indian polyvalent antivenoms towards heterologous venoms [27]. As earlier reported, Premium Serums antivenom (Batch No. 212013) displayed neutralization potency towards N. kaouthia venom from West Bengal (ED50 value, 0.156 mg/mL) while completely failing to neutralize the lethal effects of N. kaouthia venom from Arunachal Pradesh (Senji Laxme et al., 2019) [29]. Moreover, VINS polyvalent antivenom was found to be effective in neutralizing the lethal effects of N. kaouthia venom from Northeast India (ED50 value, 76.38 venom mg/antivenom g) [27]. These studies perhaps indirectly support our observation that polyvalent antivenoms partially immunorecognized venom proteins of the tested samples. Overall, our findings signify the existence of common antigenic determinants among the venoms of N. naja, N. kaouthia, and N. oxiana that potentially explain why the Indian polyvalent antivenom displayed a good immunocapturing ability of venom proteins. However, it is worth noting that the overloading of venom proteins decreases the binding affinities to the immunoaffinity column and results in the appearance of proteins in both retained and non-retained fractions [27,38,70]. The fact that 200 µg venom can exceed the immunocapturing ability of 5 mg of antivenom is concerning, even if recognition of proteins is good at lower doses. Cobras are capable of injecting large volumes of venom in a single bite; hence, it is likely that many vials of antivenom would be needed for the neutralization of toxins injected in an average bite, increasing the cost of treatment and the chances of adverse reactions such as anaphylaxis and serum sickness.
Thus, our proteomics data, in vitro neutralization, and antivenomics analyses highlight the need to redesign the immunization mixture for the manufacture of antivenom for use in India and emphasize the inclusion of adequate pools of venom from different regions and species, or development of regional antivenoms, thereby generating more effective treatment of bites. Although the present study highlights good reactivity of polyvalent antivenom towards heterologous venoms of three Naja species, despite observed proteomic differences, identification of key medically relevant toxins in the whole venom and their inclusion in immunization mixtures would serve as a valuable solution for the improvement of snakebite treatment.
From an evolutionary point of view, the huge variation in PLA2 content and activity, especially at the individual and population level in Naja naja, is noteworthy given the important role of PLA2 in causing an algesic effect and its relation to spitting behavior [71]. The proportion of PLA2 present in both N. naja and N. kaouthia in our analyses are considerably different from those in Kazandjian et al. [71] and sound a cautionary note for evolutionary inferences based on a limited sampling of variation at the individual and population level.

4. Materials and Methods

4.1. Venoms and Antivenoms

In Himachal Pradesh and Mizoram, visual encounter surveys [72] were undertaken by day and night, with effort focused on sampling areas that appeared to provide species-specific optimum habitat. These were supplemented by active searches, involving turning rocks and logs, peeling bark, digging through leaf litter, and excavating burrows and termite mounds. Elsewhere, snakes were primarily obtained from rescuers immediately after removal from a human–snake conflict situation. Snakes were retained in securely tied cotton bags until processed, which took place as soon as practical after capture. Snakes were restrained in clear plastic tubes to reduce stress and for the safety of handlers [73]. The head was allowed to protrude from the end of the tube, where it was offered a plastic-film-covered Nalgene beaker to bite. No massaging of venom glands was carried out. Snakes were released in a suitable location, as close to the site of capture as practical, after sampling. Venom was then transferred to one or more 1.5 mL polypropylene tubes and dried for storage at −20 °C until further analysis. Naja naja venom purchased from the Irula Co-op was used as a standard comparison, as this is the primary source of venom used to manufacture antivenom in India. Apart from the Irula venom, samples were not pooled and were analyzed individually. Details of venom collection are provided in Table 1. The protein concentrations of venoms were estimated according to the colorimetric method developed by Lowry [74]. Bovine serum albumin (Sigma-Aldrich, St Louis, MO, USA) was used as the protein standard for the quantification of protein in venom.
Antivenoms used in this study were manufactured by VINS Bioproducts Ltd., Hyderabad, India (Batch No 01AS15007; Expiry date: January/2019) and Premium Serums & Vaccines Pvt Ltd., Narayangaon, Maharashtra, India (Batch No. 212013; Expiry date: August/2020). One vial of each antivenom was reconstituted in 3 mL MilliQ and the amount of F(ab’)2 fragments in the polyvalent antivenoms were quantified using a Nanodrop 2000 spectrophotometer (Thermo Fisher Scientific, Waltham, MA, USA) with the protein A280 method using the IgG mass extinction coefficient. Measurements of protein concentration in antivenoms were performed three times. Table 2 displays the characteristics of Indian polyvalent antivenoms used in the present study.

4.2. Venom Protein Profiling Using Reverse-Phase HPLC

Crude venoms (2 mg) were reconstituted in ultrapure water, centrifuged to remove debris, and separated by reverse phase HPLC using Symmetry C18 column (250 × 4.6 mm, 5 μm particle size, 300 Å pore size) (Waters, Milford, MA, USA) and Thermo Scientific UltiMate 3000 high-performance gradient system equipped with a Diode-Array Detector (Thermo Fisher Scientific, Waltham, MA, USA). Elution was carried out at a flow rate of 1 mL/min using Solution A containing 0.1% (v/v) trifluoroacetic acid (TFA) and Solution B containing 0.1% TFA in 80% acetonitrile. The gradient used for the separation of venom proteins was 20–55% Solution B for 100 min and 55–80% for 20 min. Protein detection was performed spectrophotometrically at 215 nm and fractions were collected for further analysis. As a comparator, the venom sample of N. naja (Irula Co-op, Vadanemmeli, Tamil Nadu, India) was also subjected to reverse-phase HPLC using the same chromatographic conditions.

4.3. Whole Venom in-Solution Tryptic Digestion and Protein Identification by Mass Spectrometry

A total of 10 µg of venom samples were prepared for analysis by breaking the proteins into peptides using in-solution trypsin digestion following protocols adapted from Kintin and Sherman [75] and Calvete [76]. All the reagents used in this methodology were procured from Sigma Aldrich, St Louis, Missouri, USA. Fractions were reconstituted in 10 µL 6 M Urea, 50 mM Tris-HCl, pH 8.0, reduced with 0.5 µL 200 mM DTT, and alkylated with 2 µL 200 mM Iodoacetamide dissolved in 50 mM Tris-HCl, pH 8.0. Samples were then diluted with 77.5 µL Tris-HCl, pH 8.0 to reduce the concentration of Urea to 0.6 M. Subsequently, 100 ng Trypsin (Roche Diagnostics) was added to each sample and incubated at 37 °C for 12 h. Formic acid was added to stop the reaction and adjust the sample pH to between 3 and 4. Samples were desalted using C-18 Ziptips (Thermo Fisher Scientific, Waltham, MA, USA) and digested peptides were eluted in 70% ACN, 0.1% TFA. The digested peptides were loaded on a nanospray capillary column (PepMapTM RSLC C18, Thermo Fisher Scientific, Waltham, MA, USA) and subjected to sequencing by MS/MS in Q-Exactive HF mass spectrometer (Thermo Fisher Scientific, Waltham, MA, USA). The spectra were analyzed using Proteome Discoverer (Version 2.2), using the workflow described in Supplementary Figure S1, against the NCBI Taxonomy database from Elapidae (Taxonomy ID: 8602). MS/MS mass tolerance was set to 10 ppm. Carbamidomethyl cysteine was set as a fixed modification, and oxidation of methionine and deamidation of Arginine and Glutamine were set as variable modifications. Doubly and triply charged peptides were selected and matched proteins were filtered for at least 2 unique peptides. Individual venom protein family abundance was calculated based on its mean spectral intensity (MSI) relative to the total spectral intensity of all proteins detected [77].

4.4. Cross-Neutralization of Venom PLA2 by Polyvalent Antivenoms

Phospholipase A2 activities of N. kaouthia, N. naja, and N. oxiana venoms were determined with an sPLA2 assay kit (Cayman Chemical Company, Ann Arbor, MI, USA). PLA2 activity was expressed as micromoles of phosphatidylcholine hydrolyzed per min per μg per enzyme. For neutralization assay, a constant venom dose from each sample was pre-incubated with antivenoms for 1 h at 37 °C such that the venom to antivenom ratio in the reaction mixture was 1:100 (protein/protein). Following incubation, the PLA2 activity of venom samples was assessed using the method previously described [38]. Activities of crude venoms in absence of antivenoms were taken as negative controls. For the non-enzymatic control, all the reagents except for venom were added to the well. The percentage neutralization was calculated considering the activity of the venom samples in absence of antivenom as 100%. Experiments were carried out in triplicate and the results were presented as mean ± standard deviation.

4.5. Immunochemical Analysis

Briefly, 20 μg of reduced venom samples were loaded onto the gel and electrophoresis was carried out. The gels were either stained with Coomassie brilliant blue R250 (Merck, Darmstadt, Germany) or were subjected to Western blot as described previously [27]. Dilution ratios for tested antivenoms were kept constant (1:5000; v/v) to ensure a valid comparison between antivenom and venom reactivity. The membrane was washed thoroughly with TBST and probed with anti-Horse IgG alkaline phosphatase produced in rabbits (Sigma). For color development, BCIP/NBT liquid substrate (Sigma)was used. Images were documented with Chemidoc XRS imaging system (Biorad, Hercules, CA, USA).

4.6. Immunological Profiling of Polyvalent Antivenoms Using an Antivenomics Approach

The immunoaffinity column was prepared following the protocol as previously described [68,78]. For preparing affinity chromatography columns, 300 µL of CNBr activated Sepharose™ 4B matrix (GE Healthcare, Buckinghamshire, UK) was packed in a Pierce centrifuge column (Thermo Fisher Scientific, Waltham, MA, USA) [37]. The Sepharose beads were activated with 10 matrix volumes of ice-cold 1 mM HCl followed by washing with 2 matrix volumes of coupling buffer (200 mM NaHCO3 containing 500 mM NaCl, pH 8.5). Antivenoms were dialyzed against water using SnakeSkin Dialysis Tubing, 3.5K MWCO (Spectrum Laboratories, Rancho Dominguez, CA, USA). Antivenoms were then lyophilized and reconstituted in a coupling buffer. The dialyzed antivenoms were added to activated beads and the suspension was incubated overnight at 4 °C with gentle shaking. The amount of antivenom coupled to beads was quantified by measuring the concentration before and after incubation using a Nanodrop 2000 (Thermo Fisher Scientific, Waltham, MA, USA). Coupling yields were 5 mg for VINS polyvalent antivenom and 4.9 mg for Premium Serums. To block the remaining activated sites, the affinity columns were incubated with 0.1 M Tris-HCl, pH 8.5 for 4 h at room temperature. Following incubation, columns were washed alternatively with 900 µL of low pH buffer (0.1 M acetate buffer containing 0.5 M NaCl, pH 4.0) and 900 µL of high pH buffer (0.1 M Tris-HCl, pH 8.5). After repeating this procedure six times, the columns were equilibrated with five matrix volumes of binding buffer (20 mM phosphate buffer, 135 mM NaCl, pH 7.4; PBS). For the immunoaffinity assay, N. kaouthia and N. oxiana venom were incubated with the columns for 1 h at 25 °C with gentle shaking. At first, the optimal venom protein load for the immunoaffinity column was determined by incubating the affinity matrix with increasing amounts (75, 125, 200 µg) of N. kaouthia venom (Arunachal Pradesh). The abundance of bound proteins to the affinity column reached saturation at higher venom concentration (125, 200 µg) suggesting that non-specific binding of venom proteins to antibodies occurs at this concentration (Supplementary Figure S2). Therefore, the antivenomics experiment was performed with 75 µg crude Naja venom and ~5 mg antivenoms, corresponding to a venom-to-antivenom ratio (m/m) of 1:67. As a specificity control, 300 µL matrix (without antivenom) was incubated with venom. Non-retained fractions were collected with 5 matrix volumes of PBS and retained fractions were obtained with 5 matrixvolumes of 0.1 M glycine-HCl, pH 2.0, and immediately neutralized with 150 µL1 M Tris-HCl, pH 9.0.
Non-retained and retained fractions were separately desalted and concentrated by using Pierce Protein concentrators (3 kDa MWCO), reconstituted in MilliQ, and the protein concentration quantified using a Nanodrop 2000 (Thermo Fisher Scientific, Waltham, MA, USA). The concentrated fractions were reconstituted in ultrapure water and the protein contents of the fractions were quantified. Non-retained and retained fractions were separately subjected to Thermo Scientific Acclaim C18 reversed-phase column (150 × 2.1 mm, 3 μm particle size, 300 Å pore size) using a Thermo Scientific UltiMate 3000 high-performance gradient system equipped with diode detector. The chromatographic peak areas of non-retained and retained fractions were determined using Dionex Chromeleon 6.8 software (Thermo Fisher Scientific, Waltham, MA, USA). The chromatographic areas were integrated manually to determine the total percentage of venom proteins unbound to the affinity column. Relative amounts of non-retained molecules (%NRi) were calculated as 100 − [(Ri/(Ri + NRi)) × 100], where Ri corresponds to the chromatographic area of peak “i” in the chromatogram of fraction retained and eluted from affinity column [69].

4.7. Identification of Non-Retained Proteins by Tandem Mass Spectrometry

Toxins in the non-retained fractions obtained from immunoaffinity columns were subjected to proteomics analysis. Samples were prepared for analysis by breaking the proteins into peptides using in-solution trypsin digestion following the same protocol described in Section 4.3.

Supplementary Materials

The following supporting information can be downloaded at: https://www.mdpi.com/article/10.3390/toxins15040258/s1, Figure S1: Workflow for analysing spectra in Proteome Discoverer; Figure S2: Reverse Phase HPLC profile of Naja kaouthia venom and immunorecognition profile of antivenoms with increasing concentration of N. kaouthia venom Table S1: Toxins assigned to peptides sequenced from MS/MS spectra using Proteome Discoverer; Table S2: Assignment of peptide fragments belonging to various snake venom protein families obtained by mass spectrometry in each of the non-retained peaks from the antivenomics experiment.

Author Contributions

Conceptualization, A.M., R.D.; Methodology, A.D., R.D., S.B.; Formal Analysis, A.D., S.B.; Investigation, A.D., S.B.; Resources, V.S., J.B.O., O.K.B., H.T.L., G.M., W.W., S.G.; Data Curation, A.D., S.B., A.M.; Writing—Original Draft Preparation, A.M., A.D., S.B.; Writing—Review and Editing, A.D., S.B., A.M., R.D., W.W., S.G.; Visualization, A.M., A.D.; Supervision, R.D., A.M.; Project Administration, R.D., A.M.; Funding Acquisition, R.D., H.T.L., A.M., V.S., S.B. All authors have read and agreed to the published version of the manuscript.

Funding

This research was funded by European Union: PIRSES-GA-2013-612131 (to the BITES consortium led by A.M.); the Rufford Foundation: 25313-1 (V.S.); Defence Research and Development Organisation: DGTM/DFTM/GIA/19-20/0422 (to H.T.L.); Department of Science and Technology: EEQ/2021/000243 (to H.T.L.); Department of Biotechnology: BT/43/NE/TBP/2010 (to A.D. and R.D.); Department of Science and Technology: SB/EMEQ009/2014 (to A.D. and R.D.); Indian Council of Medical Research: 58/10/2015-TFV/BMS (to A.D. and R.D.).

Institutional Review Board Statement

No animal experiments or human subjects were used in this research. The snake handling and milking protocol was approved by the Ethics Committee of Bangor University, UK (no code, 15/04/2016) and Calcutta National Medical College, India. (CNMC/3, 22/08/2017).

Informed Consent Statement

Not applicable.

Data Availability Statement

All the proteome data generated using mass spectrometry in this study have been deposited in the ProteomeXchange Consortium via the PRIDE database under the accession number [PXD027361]. The data can be accessed using the Username [email protected] and Password jyLMExaR.

Acknowledgments

We would like to thank the National Biodiversity Authority of India, the Forest Departments of Himachal Pradesh, Mizoram, West Bengal, Assam, and Arunachal Pradesh for permission to carry out the sampling under permit numbers NBA/9/1673/18/22-23/2054, FFE-FB-F(10)-3/2017, A.33011/5/2011-cwlw/305, 5141/WL/4R-6/2017, WL/FG.27/tissue Collection/09 and CWL/G/13(95)/2011-12/PT.IV/ respectively. We thank the Snake Rescue and Conservation Centre (SRCC), Darusha for provision of the Bangladesh sample of Naja kaouthia venom. AD acknowledges Department of Biotechnology, Govt. of India for Senior Research Fellowship (Fellow No. DBT/2016/TU/561). RD acknowledges Indian Council of Medical Research (ICMR), Govt.of India for the grant (No. 58/10/2015-TFV/BMS) and DBT for the Twinning Project. We would also like to extend our thanks to Anatoli Togridou, Richard Southworth, Jasmine Torrez, Molla Talhauddin Ahmed, Sankha Suvra Nandy, Shyamal Kumar Ghosh, Nilanjan Muhkerjee, Sourish Kuttalam, Vanlalhrima, Lalbiakzuala, Lalrinsanga, Michael Vanlalchhuana, Lalmuansanga, H. Laltlanchhuaha, Romalsawma Hmar, Vanneihthanga Vanchhawng, Vanlalhriatzuala Sailo, Samuel Lianzela, H. Lalremruata, Denzil Lalneihsanga, Ajay Karthik, Melvin Selvan and Anweshan Patra for volunteering their help during fieldwork, and to the Head of the Department of Biotechnology, Senthil Kumar Nachimuthu, and the Head of the Department of Zoology, G. Gurusubramanian, at Mizoram University, for providing us the necessary logistical arrangement within the university campus. We thank Juan J. Calvete for advice on immuno-affinity assays.

Conflicts of Interest

The authors declare no conflict of interest. The sponsors had no role in the design, execution, interpretation, or writing of the study.

References

  1. Suraweera, W.; Warrell, D.; Whitaker, R.; Menon, G.; Rodrigues, R.; Fu, S.H.; Begum, R.; Sati, P.; Piyasena, K.; Bhatia, M.; et al. Trends in snakebite deaths in India from 2000 to 2019 in a nationally representative mortality study. Elife 2020, 9, e54076. [Google Scholar] [CrossRef] [PubMed]
  2. Warrell, D.A. Snake bite. Lancet 2010, 375, 77–88. [Google Scholar] [CrossRef]
  3. Vaiyapuri, S.; Vaiyapuri, R.; Ashokan, R.; Ramasamy, K.; Nattamaisundar, K.; Jeyaraj, A.; Chandran, V.; Gajjeraman, P.; Baksh, M.F.; Gibbins, J.; et al. Snakebite and Its Socio-Economic Impact on the Rural Population of Tamil Nadu, India. PLoS ONE 2013, 8, e80090. [Google Scholar] [CrossRef] [PubMed] [Green Version]
  4. Pore, S.M.; Ramanand, S.J.; Patil, P.T.; Gore, A.D.; Pawar, M.P.; Gaidhankar, S.L.; Ghanghas, R.R. A retrospective study of use of polyvalent anti-snake venom and risk factors for mortality from snake bite in a tertiary care setting. Indian J. Pharmacol. 2015, 47, 270–274. [Google Scholar] [PubMed] [Green Version]
  5. Maduwage, K.; Silva, A.; O’Leary, M.A.; Hodgson, W.C.; Isbister, G.K. Efficacy of Indian polyvalent snake antivenoms against Sri Lankan snake venoms: Lethality studies or clinically focussed in vitro studies. Sci. Rep. 2016, 6, 26778. [Google Scholar] [CrossRef] [Green Version]
  6. Kumar, V.; Sabitha, P. Inadequacy of Present Polyspecific Anti Snakevenom—A Study from Central Kerala. Indian J. Pediatr. 2011, 78, 1225–1228. [Google Scholar] [CrossRef]
  7. Whitaker, R. Common Indian Snakes: A Field Guide; Macmillan India: New Delhi, India, 2006. [Google Scholar]
  8. Whitaker, R.; Captain, A. Snakes of India: The Field Guide; Draco Books: Chennai, India, 2004. [Google Scholar]
  9. Warrell, D.A.; Gutiérrez, J.M.; Calvete, J.J.; Williams, D. New approaches & technologies of venomics to meet the challenge of human envenoming by snakebites in India. Indian J. Med. Res. 2013, 138, 38–59. [Google Scholar]
  10. Wüster, W. Taxonomic changes and toxinology: Systematic revisions of the asiatic cobras (Najanaja species complex). Toxicon 1996, 34, 399–406. [Google Scholar] [CrossRef]
  11. Wüster, W.; Thorpe, R.S. Asiatic Cobras: Population Systematics of the Najanaja Species Complex (Serpentes: Elapidae) in India and Central Asia. Herpetologica 1992, 48, 69–85. [Google Scholar]
  12. Wüster, W.; Thorpe, R.S. Asiatic cobras: Systematics and snakebite. Experientia 1991, 47, 205–209. [Google Scholar] [CrossRef]
  13. Theakston, R.D.G.; Phillips, R.E.; Warrell, D.A.; Galagedera, Y.; Abeysekera, D.T.D.J.; Dissanayaka, P.; De Silva, A.; Aloysius, D. Envenoming by the common krait (Bungarus caeruleus) and Sri Lankan cobra (Naja naja naja): Efficacy and complications of therapy with Haffkine antivenom. Trans. R. Soc. Trop. Med. Hyg. 1990, 84, 301–308. [Google Scholar] [CrossRef]
  14. Kularatne, S.A.M.; Budagoda, B.; Gawarammana, I.; Kularatne, W. Epidemiology, clinical profile and management issues of cobra (Naja naja) bites in Sri Lanka: First authenticated case series. Trans. R. Soc. Trop. Med. Hyg. 2009, 103, 924–930. [Google Scholar] [CrossRef]
  15. Mukherjee, A.K. Species-specific and geographical variation in venom composition of two major cobras in Indian subcontinent: Impact on polyvalent antivenom therapy. Toxicon 2020, 188, 150–158. [Google Scholar] [CrossRef]
  16. Senji Laxme, R.R.; Attarde, S.; Khochare, S.; Suranse, V.; Martin, G.; Casewell, N.R.; Whitaker, R.; Sunagar, K. Biogeographical venom variation in the Indian spectacled cobra (Naja naja) underscores the pressing need for pan-India efficacious snakebite therapy. PLoS Negl. Trop. Dis. 2021, 15, e0009150. [Google Scholar] [CrossRef]
  17. Shashidharamurthy, R.; Jagadeesha, D.; Girish, K.; Kemparaju, K. Variation in biochemical and pharmacological properties of Indian cobra (Naja naja naja) venom due to geographical distribution. Mol. Cell. Biochem. 2002, 229, 93–101. [Google Scholar] [CrossRef]
  18. Shashidharamurthy, R.; Kemparaju, K. Region-specific neutralization of Indian cobra (Naja naja) venom by polyclonal antibody raised against the eastern regional venom: A comparative study of the venoms from three different geographical distributions. Int. Immunopharmacol. 2007, 7, 61–69. [Google Scholar] [CrossRef] [PubMed]
  19. Shashidharamurthy, R.; Mahadeswaraswamy, Y.; Ragupathi, L.; Vishwanath, B.; Kemparaju, K. Systemic pathological effects induced by cobra (Naja naja) venom from geographically distinct origins of Indian peninsula. Exp. Toxicol. Pathol. 2010, 62, 587–592. [Google Scholar] [CrossRef] [Green Version]
  20. Wong, K.Y.; Tan, C.H.; Tan, K.Y.; Quraishi, N.H.; Tan, N.H. Elucidating the biogeographical variation of the venom of Naja naja (spectacled cobra) from Pakistan through a venom-decomplexing proteomic study. J. Proteom. 2018, 175, 156–173. [Google Scholar] [CrossRef]
  21. Faiz, M.A.; Ahsan, M.F.; Ghose, A.; Rahman, M.R.; Amin, R.; Hossain, M.; Tareq, M.N.; Jalil, M.A.; Kuch, U.; Theakston, R.D.; et al. Bites by the Monocled Cobra, Naja kaouthia, in Chittagong Division, Bangladesh: Epidemiology, Clinical Features of En-venoming and Management of 70 Identified Cases. Am. J. Trop. Med. Hyg. 2017, 96, 876–884. [Google Scholar] [CrossRef] [Green Version]
  22. Wongtongkam, N.; Wilde, H.; Sitthi-Amorn, C.; Ratanabanangkoon, K. A Study of Thai Cobra (Naja kaouthia) Bites in Thailand. Mil. Med. 2005, 170, 336–341. [Google Scholar] [CrossRef] [Green Version]
  23. Tan, K.Y.; Tan, C.H.; Fung, S.Y.; Tan, N.H. Venomics, lethality and neutralization of Naja kaouthia (monocled cobra) venoms from three different geographical regions of Southeast Asia. J. Proteom. 2015, 120, 105–125. [Google Scholar] [CrossRef] [PubMed]
  24. Tan, K.Y.; Tan, C.H.; Sim, S.M.; Fung, S.Y.; Tan, N.H. Geographical venom variations of the Southeast Asian monocled cobra (Naja kaouthia): Venom-induced neuromuscular depression and antivenom neutralization. Comp. Biochem. Physiol. Part C Toxicol. Pharmacol. 2016, 185–186, 77–86. [Google Scholar] [CrossRef] [PubMed]
  25. Tan, K.Y.; Tan, C.H.; Chanhome, L.; Tan, N.H. Comparative venom gland transcriptomics of Naja kaouthia(monocled cobra) from Malaysia and Thailand: Elucidating geographical venom variation and insights into sequence novelty. PeerJ 2017, 5, e3142. [Google Scholar] [CrossRef] [PubMed] [Green Version]
  26. Ratnarathorn, N.; Harnyuttanakorn, P.; Chanhome, L.; Evans, S.E.; Day, J.J. Geographical differentiation and cryptic diversity in the monocled cobra, Naja kaouthia (Elapidae), from Thailand. Zool. Scr. 2019, 48, 711–726. [Google Scholar] [CrossRef]
  27. Deka, A.; Reza, A.; Hoque, K.M.F.; Deka, K.; Saha, S.; Doley, R. Comparative analysis of Naja kaouthia venom from North-East India and Bangladesh and its cross reactivity with Indian polyvalent antivenoms. Toxicon 2019, 164, 31–43. [Google Scholar] [CrossRef]
  28. Das, D.; Urs, N.; Hiremath, V.; Vishwanath, B.S.; Doley, R. Biochemical and biological characterization of Naja kaouthia venom from North-East India and its neutralization by polyvalent antivenom. J. Venom Res. 2013, 4, 31–38. [Google Scholar]
  29. Senji Laxme, R.R.; Khochare, S.; de Souza, H.F.; Ahuja, B.; Suranse, V.; Martin, G.; Whitaker, R.; Sunagar, K. Beyond the “big four”: Venom profiling of the medically important yet neglected Indian snakes reveals disturbing antivenom deficiencies. PLoS Negl. Trop. Dis. 2019, 13, e0007899. [Google Scholar] [CrossRef] [Green Version]
  30. Santra, V.; Owens, J.B.; Graham, S.; Wüster, W.; Kuttalam, S.; Bharti, O.; Selvan, M.; Mukherjee, N.; Malhotra, A. Confirmation of Naja oxiana in Himachal Pradesh, India. Herpetol. Bull. 2019, 150, 26–28. [Google Scholar] [CrossRef]
  31. Heiner, J.D.; Bebarta, V.S.; Varney, S.M.; Bothwell, J.D.; Cronin, A.J. Clinical Effects and Antivenom Use for Snake Bite Victims Treated at Three US Hospitals in Afghanistan. Wilderness Environ. Med. 2013, 24, 412–416. [Google Scholar] [CrossRef] [Green Version]
  32. Angaji, S.; Houshmandi, A.; ZareMirakabadi, A. Acute Effects of the Iranian Snake (Naja naja oxiana) Venom on Heart. Biomacromol. J. 2016, 2, 97–101. [Google Scholar]
  33. Latifi, M. Variation in yield and lethality of venoms from Iranian snakes. Toxicon 1984, 22, 373–380. [Google Scholar] [CrossRef]
  34. Rashmi, U.; Khochare, S.; Attarde, S.; Senji Laxme, R.R.; Suranse, V.; Martin, G.; Sunagar, K. Remarkable intrapopulation venom vari-ability in the monocellate cobra (Naja kaouthia) unveils neglected aspects of India’s snakebite problem. J. Proteom. 2021, 242, 104256. [Google Scholar] [CrossRef]
  35. Chippaux, J.-P.; Williams, V.; White, J. Snake venom variability: Methods of study, results and interpretation. Toxicon 1991, 29, 1279–1303. [Google Scholar] [CrossRef]
  36. Furtado, M.F.; Travaglia-Cardoso, S.R.; Rocha, M.M. Sexual dimorphism in venom of Bothrops jararaca (Serpentes: Viperidae). Toxicon 2006, 48, 401–410. [Google Scholar] [CrossRef]
  37. Deka, A.; Gogoi, A.; Das, D.; Purkayastha, J.; Doley, R. Proteomics of Naja kaouthia venom from North East India and assessment of Indian polyvalent antivenom by third generation antivenomics. J. Proteom. 2019, 207, 103463. [Google Scholar] [CrossRef]
  38. Chanda, A.; Patra, A.; Kalita, B.; Mukherjee, A.K. Proteomics analysis to compare the venom composition between Najanaja and Naja kaouthia from the same geographical location of eastern India: Correlation with pathophysiology of envenomation and im-munological cross-reactivity towards commercial polyantivenom. Expert Rev. Proteom. 2018, 15, 949–961. [Google Scholar]
  39. Oliveros, J.C. Venny. An Interactive Tool for Comparing Lists with Venn’s Diagrams. 2007–2015. Available online: https://bioinfogp.cnb.csic.es/tools/venny/index.html (accessed on 12 January 2023).
  40. Daltry, J.C.; Ponnudurai, G.; Shin, C.K.; Tan, N.-H.; Thorpe, R.S.; Wolfgang, W. Electrophoretic profiles and biological activities: Intraspecific variation in the venom of the Malayan pit viper (Calloselasma rhodostoma). Toxicon 1996, 34, 67–79. [Google Scholar] [CrossRef]
  41. Fry, B.G.; Vidal, N.; van der Weerd, L.; Kochva, E.; Renjifo, C. Evolution and diversification of the Toxicofera reptile venom system. J. Proteom. 2009, 72, 127–136. [Google Scholar] [CrossRef]
  42. Malhotra, A. Mutation, Duplication, and More in the Evolution of Venomous Animals and Their Toxins. In Evolution of Venomous Animals and Their Toxins; Malhotra, A., Gopalakrishnakone, P., Eds.; Springer: Dordrecht, The Netherlands, 2017; pp. 33–45. [Google Scholar]
  43. Queiroz, G.P.; Pessoa, L.A.; Portaro, F.C.; Furtado, M.D.F.D.; Tambourgi, D.V. Interspecific variation in venom composition and toxicity of Brazilian snakes from Bothrops genus. Toxicon 2008, 52, 842–851. [Google Scholar] [CrossRef]
  44. Sunagar, K.; Undheim, E.A.; Scheib, H.; Gren, E.C.; Cochran, C.; Person, C.E.; Koludarov, I.; Kelln, W.; Hayes, W.K.; King, G.F.; et al. Intraspecific venom variation in the medically significant Southern Pacific Rattlesnake (Crotalus oreganus helleri): Biodis-covery, clinical and evolutionary implications. J. Proteom. 2014, 99, 68–83. [Google Scholar] [CrossRef]
  45. Alape-Giron, A.; Sanz, L.; Escolano, J.; Flores-Diaz, M.; Madrigal, M.; Sasa, M.; Calvete, J.J. Snake venomics of the lancehead pitviper Bothrop sasper: Geographic, individual, and ontogenetic variations. J. Proteome Res. 2008, 7, 3556–3571. [Google Scholar] [CrossRef] [PubMed]
  46. Mora-Obando, D.; Guerrero-Vargas, J.A.; Prieto-Sánchez, R.; Beltrán, J.; Rucavado, A.; Sasa, M.; Gutiérrez, J.M.; Ayerbe, S.; Lomonte, B. Proteomic and functional profiling of the venom of Bothrops ayerbei from Cauca, Colombia, reveals striking interspecific variation with Bothrop sasper venom. J. Proteom. 2014, 96, 159–172. [Google Scholar] [CrossRef] [PubMed]
  47. Saravia, P.; Rojas, E.; Arce, V.; Guevara, C.; López, J.C.; Chaves, E.; Velásquez, R.; Rojas, G.; Gutiérrez, J.M. Geographic and ontogenic variability in the venom of the neotropical rattlesnake Crotalus durissus: Pathophysiological and therapeutic implications. Rev. de Biol. Trop. 2002, 50, 337–346. [Google Scholar]
  48. Sintiprungrat, K.; Watcharatanyatip, K.; Senevirathne, W.; Chaisuriya, P.; Chokchaichamnankit, D.; Srisomsap, C.; Ratanabanangkoon, K. A comparative study of venomics of Naja naja from India and Sri Lanka, clinical manifestations and antivenomics of an Indian polyspecific antivenom. J. Proteom. 2016, 132, 131–143. [Google Scholar] [CrossRef] [PubMed]
  49. Huang, H.-W.; Liu, B.-S.; Chien, K.-Y.; Chiang, L.-C.; Huang, S.-Y.; Sung, W.-C.; Wu, W.-G. Cobra venom proteome and glycome determined from individual snakes of Naja atra reveal medically important dynamic range and systematic geographic variation. J. Proteom. 2015, 128, 92–104. [Google Scholar] [CrossRef]
  50. Dutta, S.; Chanda, A.; Kalita, B.; Islam, T.; Patra, A.; Mukherjee, A.K. Proteomic analysis to unravel the complex venom proteome of eastern India Naja naja: Correlation of venom composition with its biochemical and pharmacological properties. J. Proteom. 2017, 156, 29–39. [Google Scholar] [CrossRef]
  51. Chanda, A.; Kalita, B.; Patra, A.; Senevirathne, W.D.S.T.; Mukherjee, A.K. Proteomic analysis and antivenomics study of Western India Naja naja venom: Correlation between venom composition and clinical manifestations of cobra bite in this region. Expert Rev. Proteom. 2019, 16, 171–184. [Google Scholar] [CrossRef]
  52. Modahl, C.M.; Doley, R.; Kini, R.M. Venom analysis of long-term captive Pakistan cobra (Naja naja) populations. Toxicon 2010, 55, 612–618. [Google Scholar] [CrossRef]
  53. Tan, C.H.; Wong, K.Y.; Chong, H.P.; Tan, N.H.; Tan, K.Y. Proteomic insights into short neurotoxin-driven, highly neurotoxic venom of Philippine cobra (Naja philippinensis) and toxicity correlation of cobra envenomation in Asia. J. Proteom. 2019, 206, 103418. [Google Scholar] [CrossRef]
  54. Amazonas, D.R.; Freitas-De-Sousa, L.A.; Orefice, D.P.; de Sousa, L.F.; Martinez, M.G.; Mourão, R.H.V.; Chalkidis, H.M.; Camargo, P.B.; Moura-Da-Silva, A.M. Evidence for Snake Venom Plasticity in a Long-Term Study with Individual Captive Bothrops atrox. Toxins 2019, 11, 294. [Google Scholar] [CrossRef] [Green Version]
  55. Xu, N.; Zhao, H.-Y.; Yin, Y.; Shen, S.-S.; Shan, L.-L.; Chen, C.-X.; Zhang, Y.-X.; Gao, J.-F.; Ji, X. Combined venomics, antivenomics and venom gland transcriptome analysis of the monocoled cobra (Naja kaouthia) from China. J. Proteom. 2017, 159, 19–31. [Google Scholar] [CrossRef]
  56. Kazemi, E.; Nazarizadeh, M.; Fatemizadeh, F.; Khani, A.; Kaboli, M. The phylogeny, phylogeography, and diversification history of the westernmost Asian cobra (Serpentes: Elapidae: Naja oxiana) in the Trans-Caspian region. Ecol. Evol. 2021, 11, 2024–2039. [Google Scholar] [CrossRef]
  57. Manuwar, A.; Dreyer, B.; Böhmert, A.; Ullah, A.; Mughal, Z.; Akrem, A.; Ali, S.A.; Schlüter, H.; Betzel, C. Proteomic Investigations of Two Pakistani Naja Snake Venoms Species Unravel the Venom Complexity, Posttranslational Modifications, and Presence of Extracellular Vesicles. Toxins 2020, 12, 669. [Google Scholar] [CrossRef]
  58. Prasad, N.B.; Uma, B.; Bhatt, S.K.; Gowda, V.T. Comparative characterisation of Russell’s viper (Daboia/Vipera russelli) venoms from different regions of the Indian peninsula. Biochim. Biophys. Acta 1999, 1428, 121–136. [Google Scholar] [CrossRef]
  59. Sharma, M.; Gogoi, N.; Dhananjaya, B.L.; Menon, J.C.; Doley, R. Geographical variation of Indian Russell’s viper venom and neutralization of its coagulopathy by polyvalent antivenom. Toxin Rev. 2014, 33, 7–15. [Google Scholar] [CrossRef]
  60. Jayanthi, G.P.; Gowda, T.V. Geographical variation in India in the composition and lethal potency of Russell’s viper (Vipera russelli) venom. Toxicon 1988, 26, 257–264. [Google Scholar] [CrossRef]
  61. Ariaratnam, C.; Thuraisingam, V.; Kularatne, S.A.M.; Sheriff, M.; Theakston, R.; De Silva, A.; Warrell, D. Frequent and potentially fatal envenoming by hump-nosed pit vipers (Hypnale hypnale and H. nepa) in Sri Lanka: Lack of effective antivenom. Trans. R. Soc. Trop. Med. Hyg. 2008, 102, 1120–1126. [Google Scholar] [CrossRef]
  62. Joseph, J.; Simpson, I.; Menon, N.; Jose, M.; Kulkarni, K.; Raghavendra, G.; Warrell, D. First authenticated cases of life-threatening envenoming by the hump-nosed pit viper (Hypnale hypnale) in India. Trans. R. Soc. Trop. Med. Hyg. 2007, 101, 85–90. [Google Scholar] [CrossRef]
  63. Faiz, M.A.; Ghose, A.; Ahsan, M.F.; Rahman, M.R.; Amin, M.M.; Hassan, M.M.U.; Chowdhury, M.A.W.; Kuch, U.; Rocha, T.; Harris, J.B.; et al. The greater black krait (Bungarus niger), a newly recognized cause of neuro-myotoxic snake bite envenoming in Bangladesh. Brain 2010, 133, 3181–3193. [Google Scholar] [CrossRef]
  64. Sunthornandh, P.; Matangkasombut, P.; Ratanabanangkoon, K. Preparation, characterization and immunogenicity of various polymers and conjugates of elapid postsynaptic neurotoxins. Mol. Immunol. 1992, 29, 501–510. [Google Scholar] [CrossRef]
  65. Leong, P.K.; Fung, S.Y.; Tan, C.H.; Sim, S.M.; Tan, N.H. Immunological cross-reactivity and neutralization of the principal toxins of Najas umatrana and related cobra venoms by a Thai polyvalent antivenom (Neuro Polyvalent Snake Antivenom). Acta Trop. 2015, 149, 86–93. [Google Scholar] [CrossRef] [PubMed]
  66. Nazari, A.; Samianifard, M.; Rabie, H.; Mirakabadi, A.Z. Recombinant antibodies against Iranian cobra venom as a new emerging therapy by phage display technology. J. Venom. Anim. Toxins Incl. Trop. Dis. 2020, 26, e20190099. [Google Scholar] [CrossRef] [PubMed]
  67. Castro, J.M.A.; Oliveira, T.S.; Silveira, C.R.F.; Caporrino, M.C.; Rodriguez, D.; Moura-da-Silva, A.M.; Ramos, O.H.P.; Rucavado, A.; Gutiérrez, J.M.; Magalhães, G.S.; et al. A neutralizing recombinant single chain antibody, scFv, against BaP1, A PI hemorrhagic metalloproteinase from Bothrop sasper snake venom. Toxicon 2014, 87, 81–91. [Google Scholar] [CrossRef] [PubMed]
  68. World Health Organization. WHO Guidelines for the Production, Control and Regulation of Snake Antivenom Immuno-Globulins; WHO: Geneva, Switzerland, 2010. [Google Scholar]
  69. Pla, D.; Rodríguez, Y.; Calvete, J.J. Third Generation Antivenomics: Pushing the Limits of the In Vitro Preclinical Assessment of Antivenoms. Toxins 2017, 9, 158. [Google Scholar] [CrossRef] [PubMed] [Green Version]
  70. Sintiprungrat, K.; Chaisuriya, P.; Watcharatanyatip, K.; Ratanabanangkoon, K. Immunoaffinity chromatography in antivenomics studies: Various parameters that can affect the results. Toxicon 2016, 119, 129–139. [Google Scholar] [CrossRef]
  71. Kazandjian, T.D.; Petras, D.; Robinson, S.D.; van Thiel, J.; Greene, H.W.; Arbuckle, K.; Barlow, A.; Carter, D.A.; Wouters, R.M.; Whiteley, G.; et al. Convergent evolution of pain-inducing defensive venom components in spitting cobras. Science 2021, 371, 386–390. [Google Scholar] [CrossRef]
  72. McDiarmid, R.W.; Foster, M.S.; Guyer, C.; Chernoff, N.; Gibbons, J.W. Reptile Biodiversity: Standard Methods for Inventory and Monitoring; University of California Press: Berkeley, CA, USA, 2012. [Google Scholar]
  73. Johnson, R. Clinical Technique: Handling and Treating Venomous Snakes. J. Exot. Pet Med. 2011, 20, 124–130. [Google Scholar] [CrossRef]
  74. Lowry, O.H.; Rosebrough, N.J.; Farr, A.L.; Randall, R.J. Protein measurement with the Folin phenol reagent. J. Biol. Chem. 1951, 193, 265–275. [Google Scholar] [CrossRef]
  75. Kinter, M.; Sherman, N.E. Protein Sequencing and Identification Using Tandem Mass Spectrometry; John Wiley & Sons: Hoboken, NJ, USA, 2005. [Google Scholar]
  76. Calvete, J.J. Next-generation snake venomics: Protein-locus resolution through venom proteome decomplexation. Expert Rev. Proteom. 2014, 11, 315–329. [Google Scholar] [CrossRef]
  77. Tan, K.Y.; Tan, N.H.; Tan, C.H. Venom proteomics and antivenom neutralization for the Chinese eastern Russell’s viper, Daboia siamensis from Guangxi and Taiwan. Sci. Rep. 2018, 8, 8545. [Google Scholar] [CrossRef] [Green Version]
  78. Pla, D.; Gutiérrez, J.M.; Calvete, J.J. Second generation snake antivenomics: Comparing immunoaffinity and immunodepletion protocols. Toxicon 2012, 60, 688–699. [Google Scholar] [CrossRef]
Figure 1. (A) Physical map of the Indian subcontinent showing sampling locations of Naja venoms investigated in this study. (B) Photographs of three different Naja species found in India (photographs by Vishal Santra).
Toxins 15 00258 g001
Figure 2. C18 reverse-phase HPLC profiles of venoms from three different Naja species in India. The dotted areas indicate the elution region of 3FTxs and PLA2s in Naja venoms ((A): N. naja, (B): N. kaouthia, (C): N. oxiana) in this standardized chromatographic gradient. The red star identifies a peak present only in the venom from Assam (see text for further discussion).
Toxins 15 00258 g002aToxins 15 00258 g002b
Figure 3. Venn diagrams representing venom variation among individuals from the same locality were constructed using Venny 2.1. Peptides were given unique IDs for their sequences and type of modifications from MS/MS spectra.
Toxins 15 00258 g003
Figure 4. Pie charts highlighting the relative abundances of venom protein families in three different Naja species. Protein families: 3FTx, three-finger toxin; PLA2, phospholipase A2; CTx, cardiotoxins; KUN, Kunitz-type serine proteinase inhibitor-like protein; CVF, Cobra venom factor; SVMP, snake venom metalloproteinase. Toxins with relative abundances >1% were categorized into “Others” and include cysteine-rich secretory proteins (CRISP), l-amino acid oxidases (LAAO), nerve-growth factors (NGF), venom factors, nucleotidases, and phosphodiesterases (PDE), acetylcholinesterase, serine proteases, and tissue plasminogens.
Toxins 15 00258 g004
Figure 5. Venn diagrams representing the number of shared peptides (overlap) of individuals of the same species from different locations were constructed using Venny 2.1 [39]. Peptides were given unique IDs for their sequences and type of modifications from MS/MS spectra.
Toxins 15 00258 g005
Figure 6. A Venn diagram representing the number of shared peptides in different Naja species was constructed using Venny 2.1 [39]. Peptides were given unique IDs for their sequences and type of modifications from MS/MS spectra.
Toxins 15 00258 g006
Figure 7. Immunoreactivity profile of polyvalent (PAV) antivenoms towards Naja venoms. (A) Reduced venom samples were applied to 10% Tris-Tricine SDS-PAGE. Venom proteins were then transferred to a PVDF membrane and incubated with different antivenoms—(B) Premium Serums PAV and (C) VINS PAV. Lane 1–4: N. kaouthia venom samples from Assam, Arunachal Pradesh, Mizoram, and West Bengal, respectively. Lane 5: N. naja venom from the Irula Co-op; Lane 6: N. oxiana venom from Himachal Pradesh; Lane 7–9: N. naja venom samples from Himachal Pradesh, Maharashtra, and West Bengal respectively.
Toxins 15 00258 g007
Figure 8. (A) Venom PLA2 activities of Naja samples. The amount of substrate hydrolysis was quantified at 414 nm using a spectrophotometer. (B) Neutralization of venom PLA2 activity. Venom was incubated with two different polyvalent antivenoms (V: VINS; P: Premium Serums) at a venom: antivenom ratio of 1:100 (protein/protein). The percentage residual activity was calculated considering the activity of the respective crude venoms without antivenom as 100%. C indicates venom PLA2 activity in absence of antivenom. * indicates p value < 0.005.
Toxins 15 00258 g008
Figure 9. Immunorecognition profiles of VINS and Premium Serums polyvalent antivenoms using N. oxiana venom from Himachal Pradesh (A,B), and N. kaouthia venoms from Arunachal Pradesh (D,E), Mizoram (G,H), West Bengal (J,K). Panel (C,F,I,L) display a comparison of percentage of proteins remaining unbound to the two affinity columns. * indicates peaks subjected to proteomic identification by mass spectrometry.
Toxins 15 00258 g009
Table 1. Details of venom collection with location, species, and sample ID.
Sample IDSpeciesLocation
15.47Naja kaouthiaPapum Pare District, Arunachal Pradesh
16.24Naja kaouthiaAizawl District, Mizoram
17.25Naja kaouthiaHooghly District, West Bengal
18.41 (Sample A)Naja najaKangra District, Himachal Pradesh
18.43 (Sample B)Naja najaKangra District, Himachal Pradesh
15.35 (Sample A)Naja najaAhmednagar District, Maharashtra
15.37 (Sample B)Naja najaAhmednagar District, Maharashtra
15.73 (Sample A)Naja najaHooghly District, West Bengal
15.74 (Sample B)Naja najaHooghly District, West Bengal
17.24 (Sample C)Naja najaHooghly District, West Bengal
-Naja najaIrula Snake Catcher’s Cooperative, Tamil Nadu
17.v18Naja oxianaChamba District, Himachal Pradesh
Table 2. Characteristics of the Indian polyvalent antivenoms used in this study.
ManufacturerBatch No. & Expiry Active SubstanceProtein per VialNeutralization Potency per Vial (mg venom/mL Antivenom)
Premium Serums and Vaccines Pvt. Limited212013; 08/2023F(ab) 2629.95 mgNaja naja venom (0.6 mg), Daboia russelii venom (0.6 mg), Bungarus caeruleus (0.45 mg), Echis carinatus (0.45 mg)
VINS Bioproducts Limited01AS15007; 01/2019F(ab) 2487.05 mgNaja naja venom (0.6 mg), Daboia russelii venom (0.6 mg), Bungarus caeruleus (0.45 mg), Echis carinatus (0.45 mg)
Disclaimer/Publisher’s Note: The statements, opinions and data contained in all publications are solely those of the individual author(s) and contributor(s) and not of MDPI and/or the editor(s). MDPI and/or the editor(s) disclaim responsibility for any injury to people or property resulting from any ideas, methods, instructions or products referred to in the content.

