Treatment with Paracetamol Can Interfere with the Intradialytic Optical Estimation in Spent Dialysate of Uric Acid but Not of Indoxyl Sulfate

 , , ,
, , ,  , , and
Abstract
:1. Introduction
2. Results
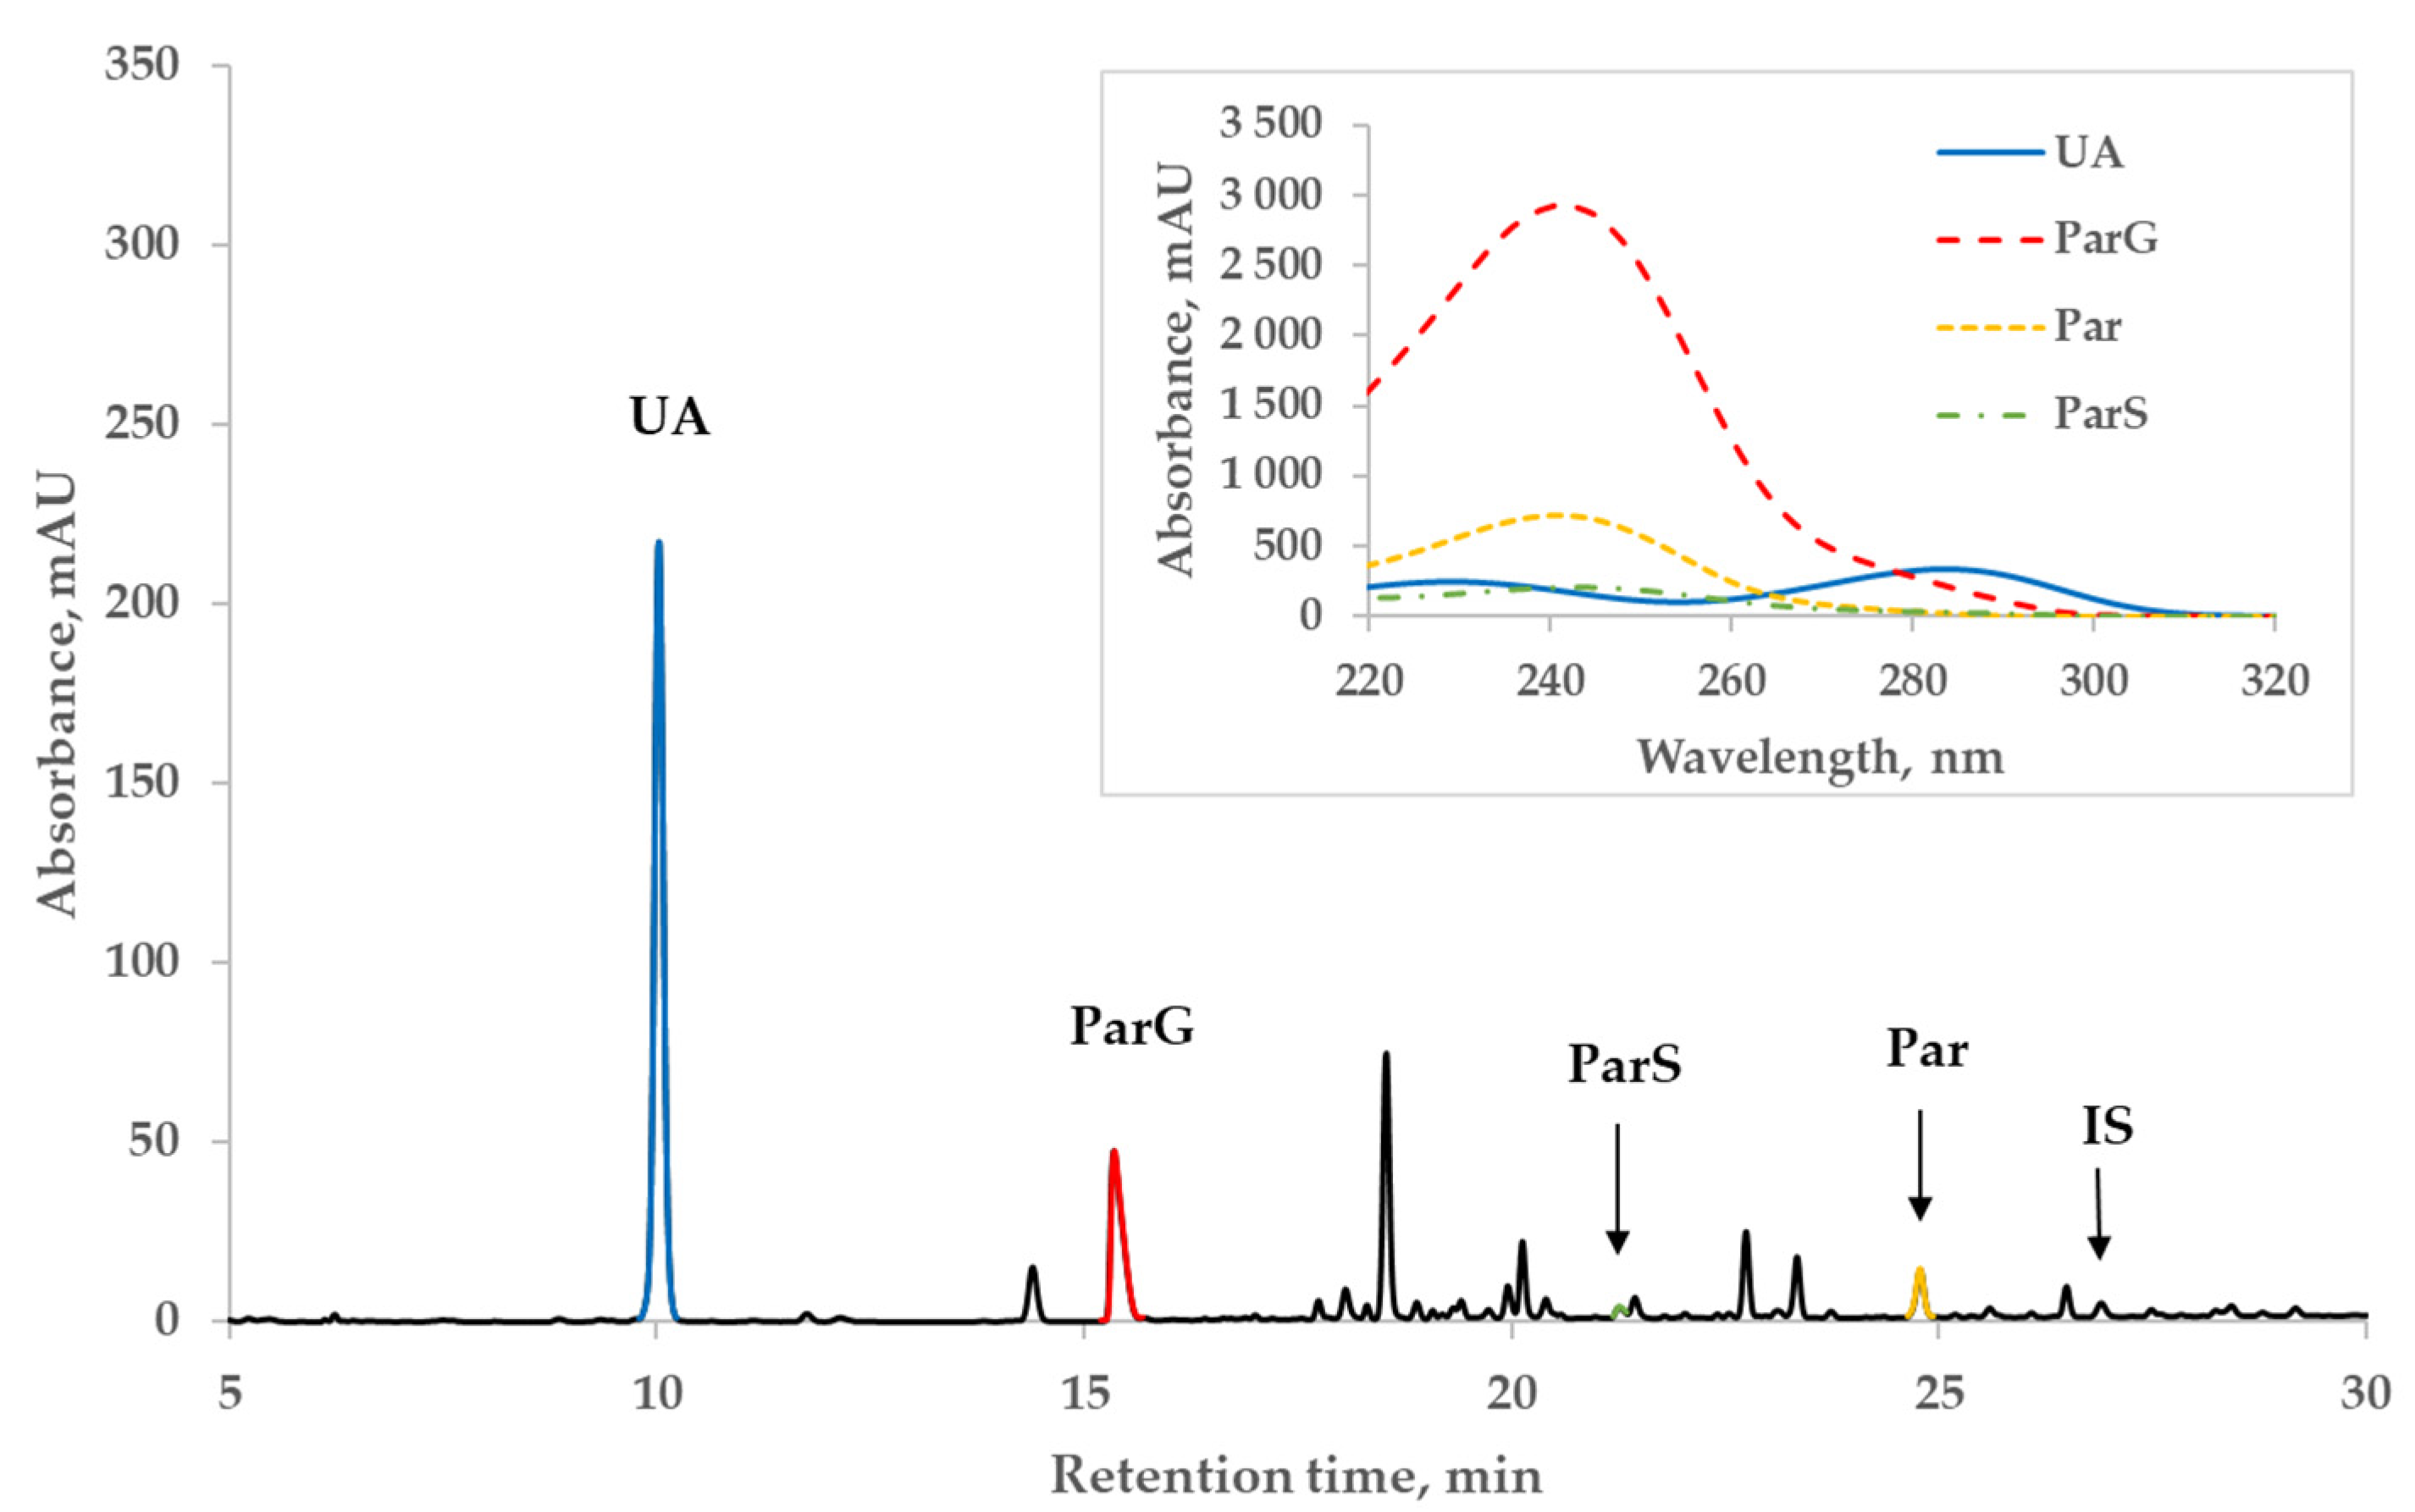
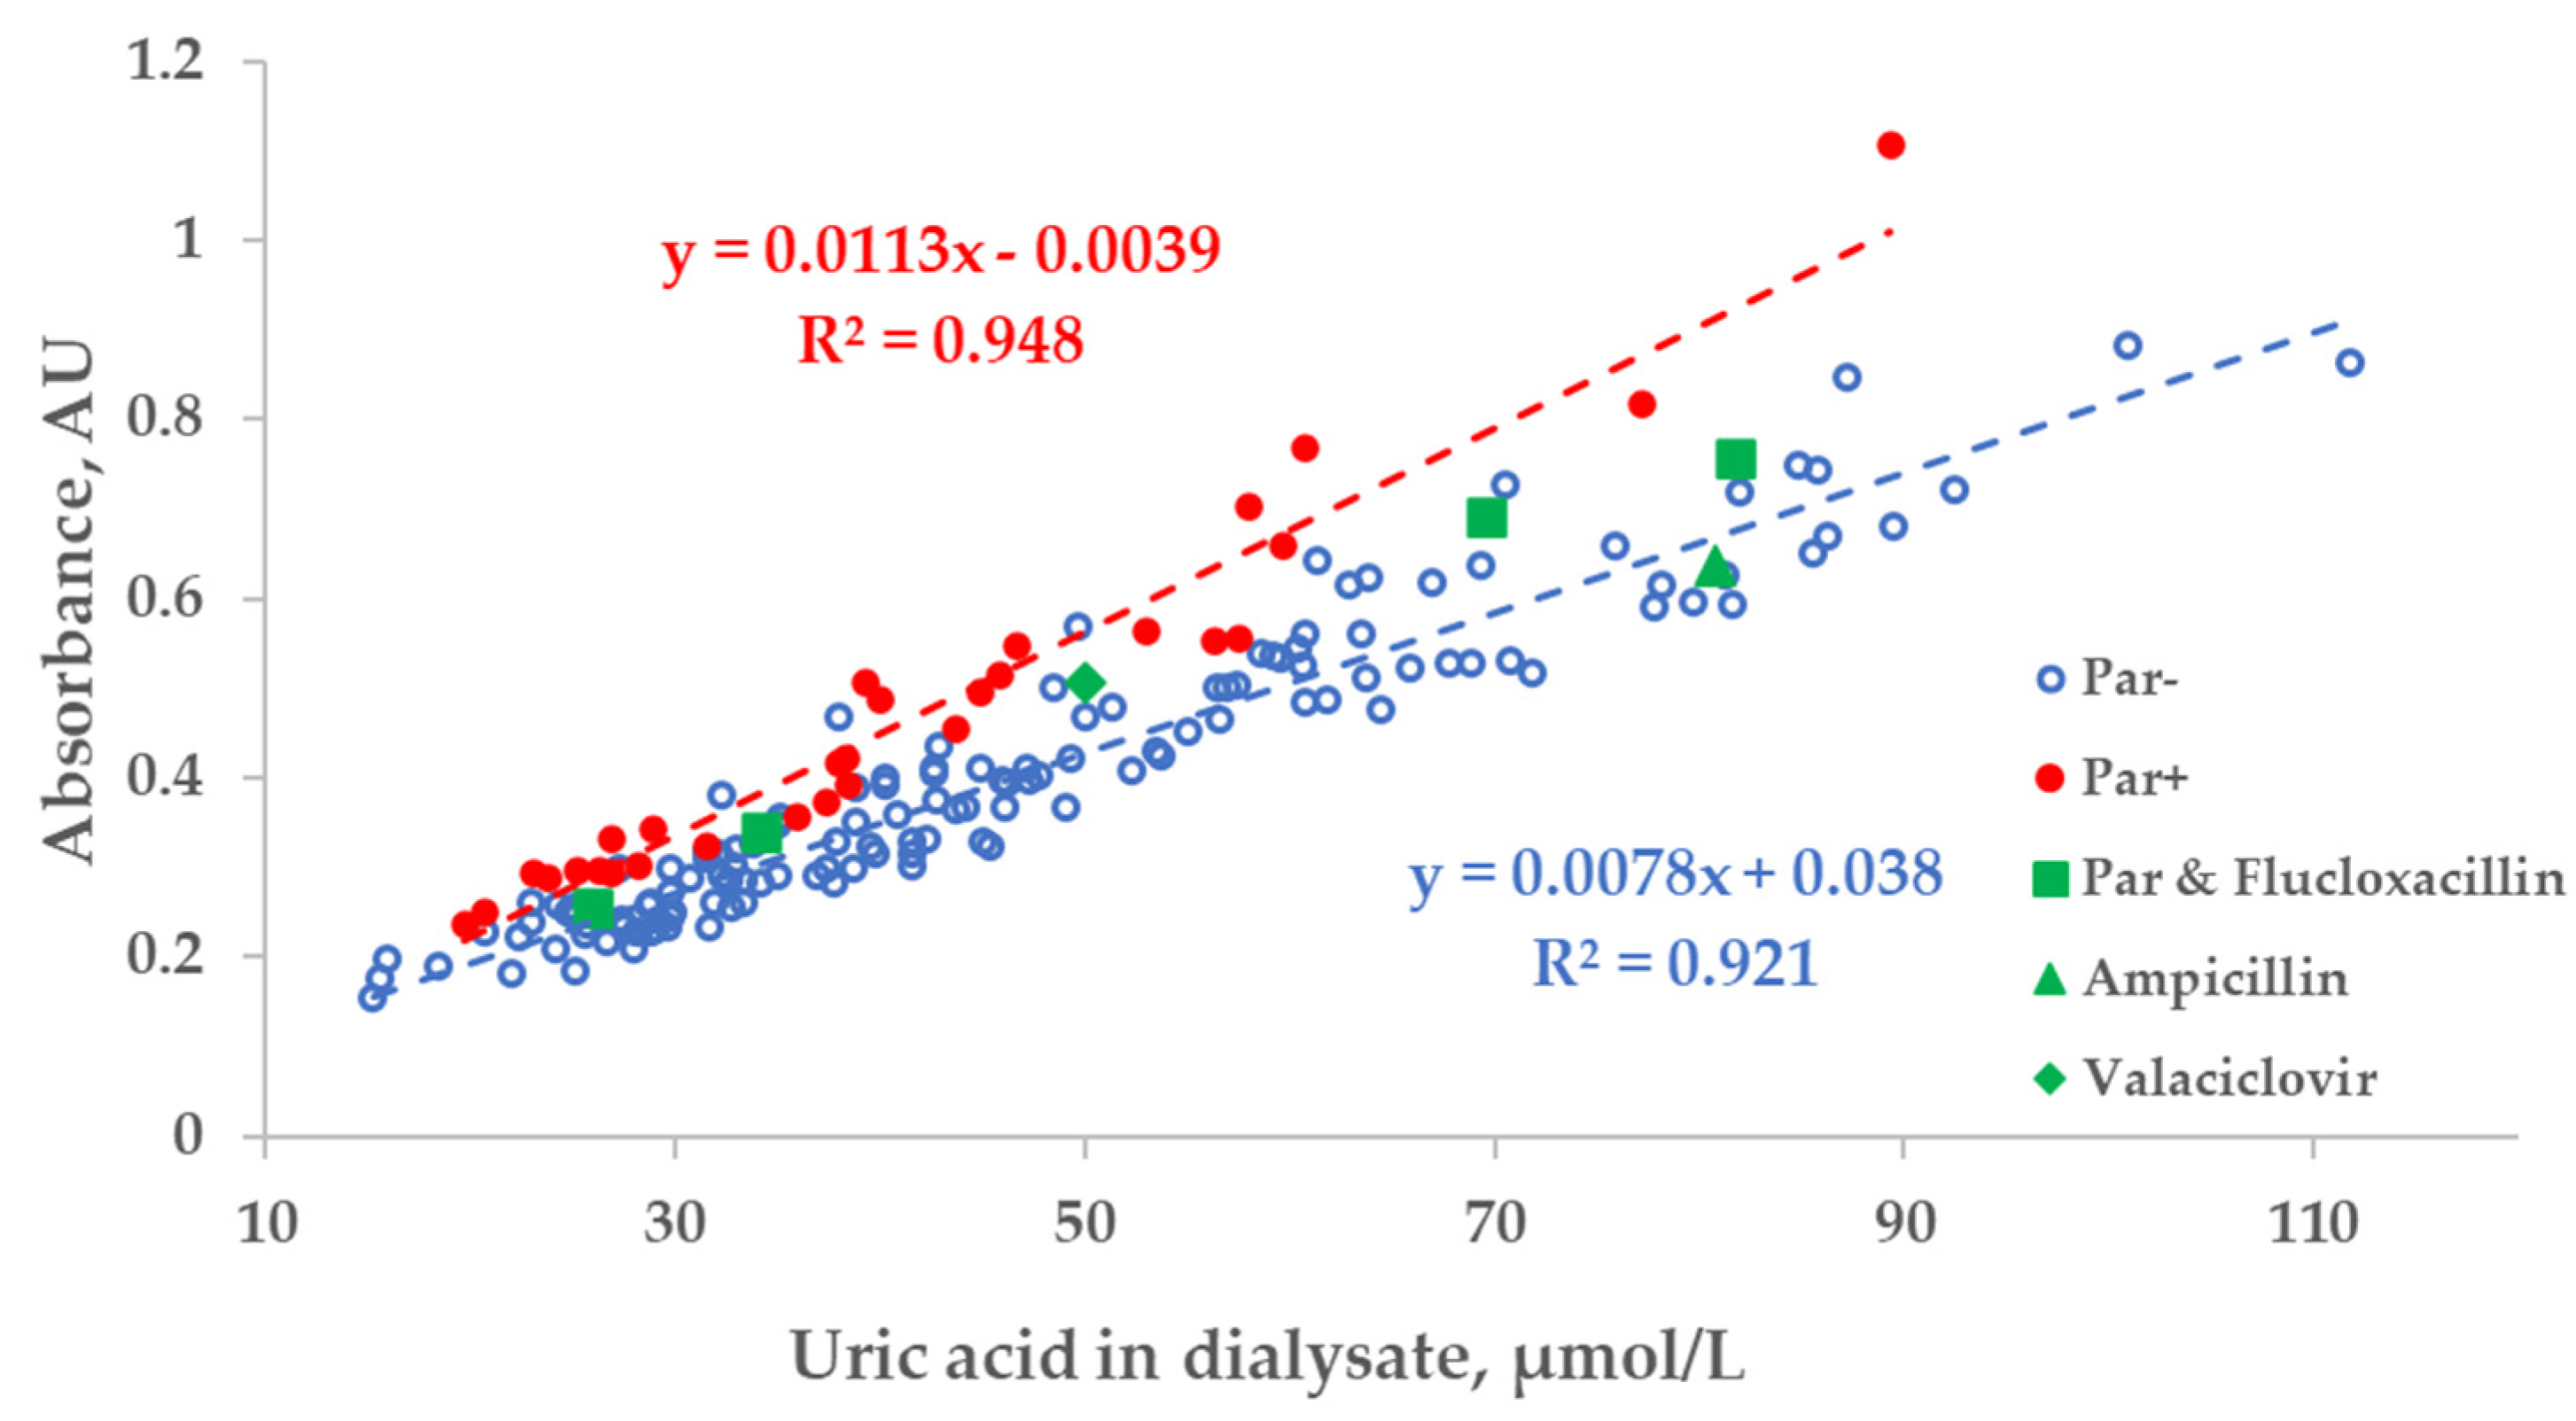
2.1. Influence of Drugs on the Correlation between Uric Acid and UV Absorbance of the Dialysate
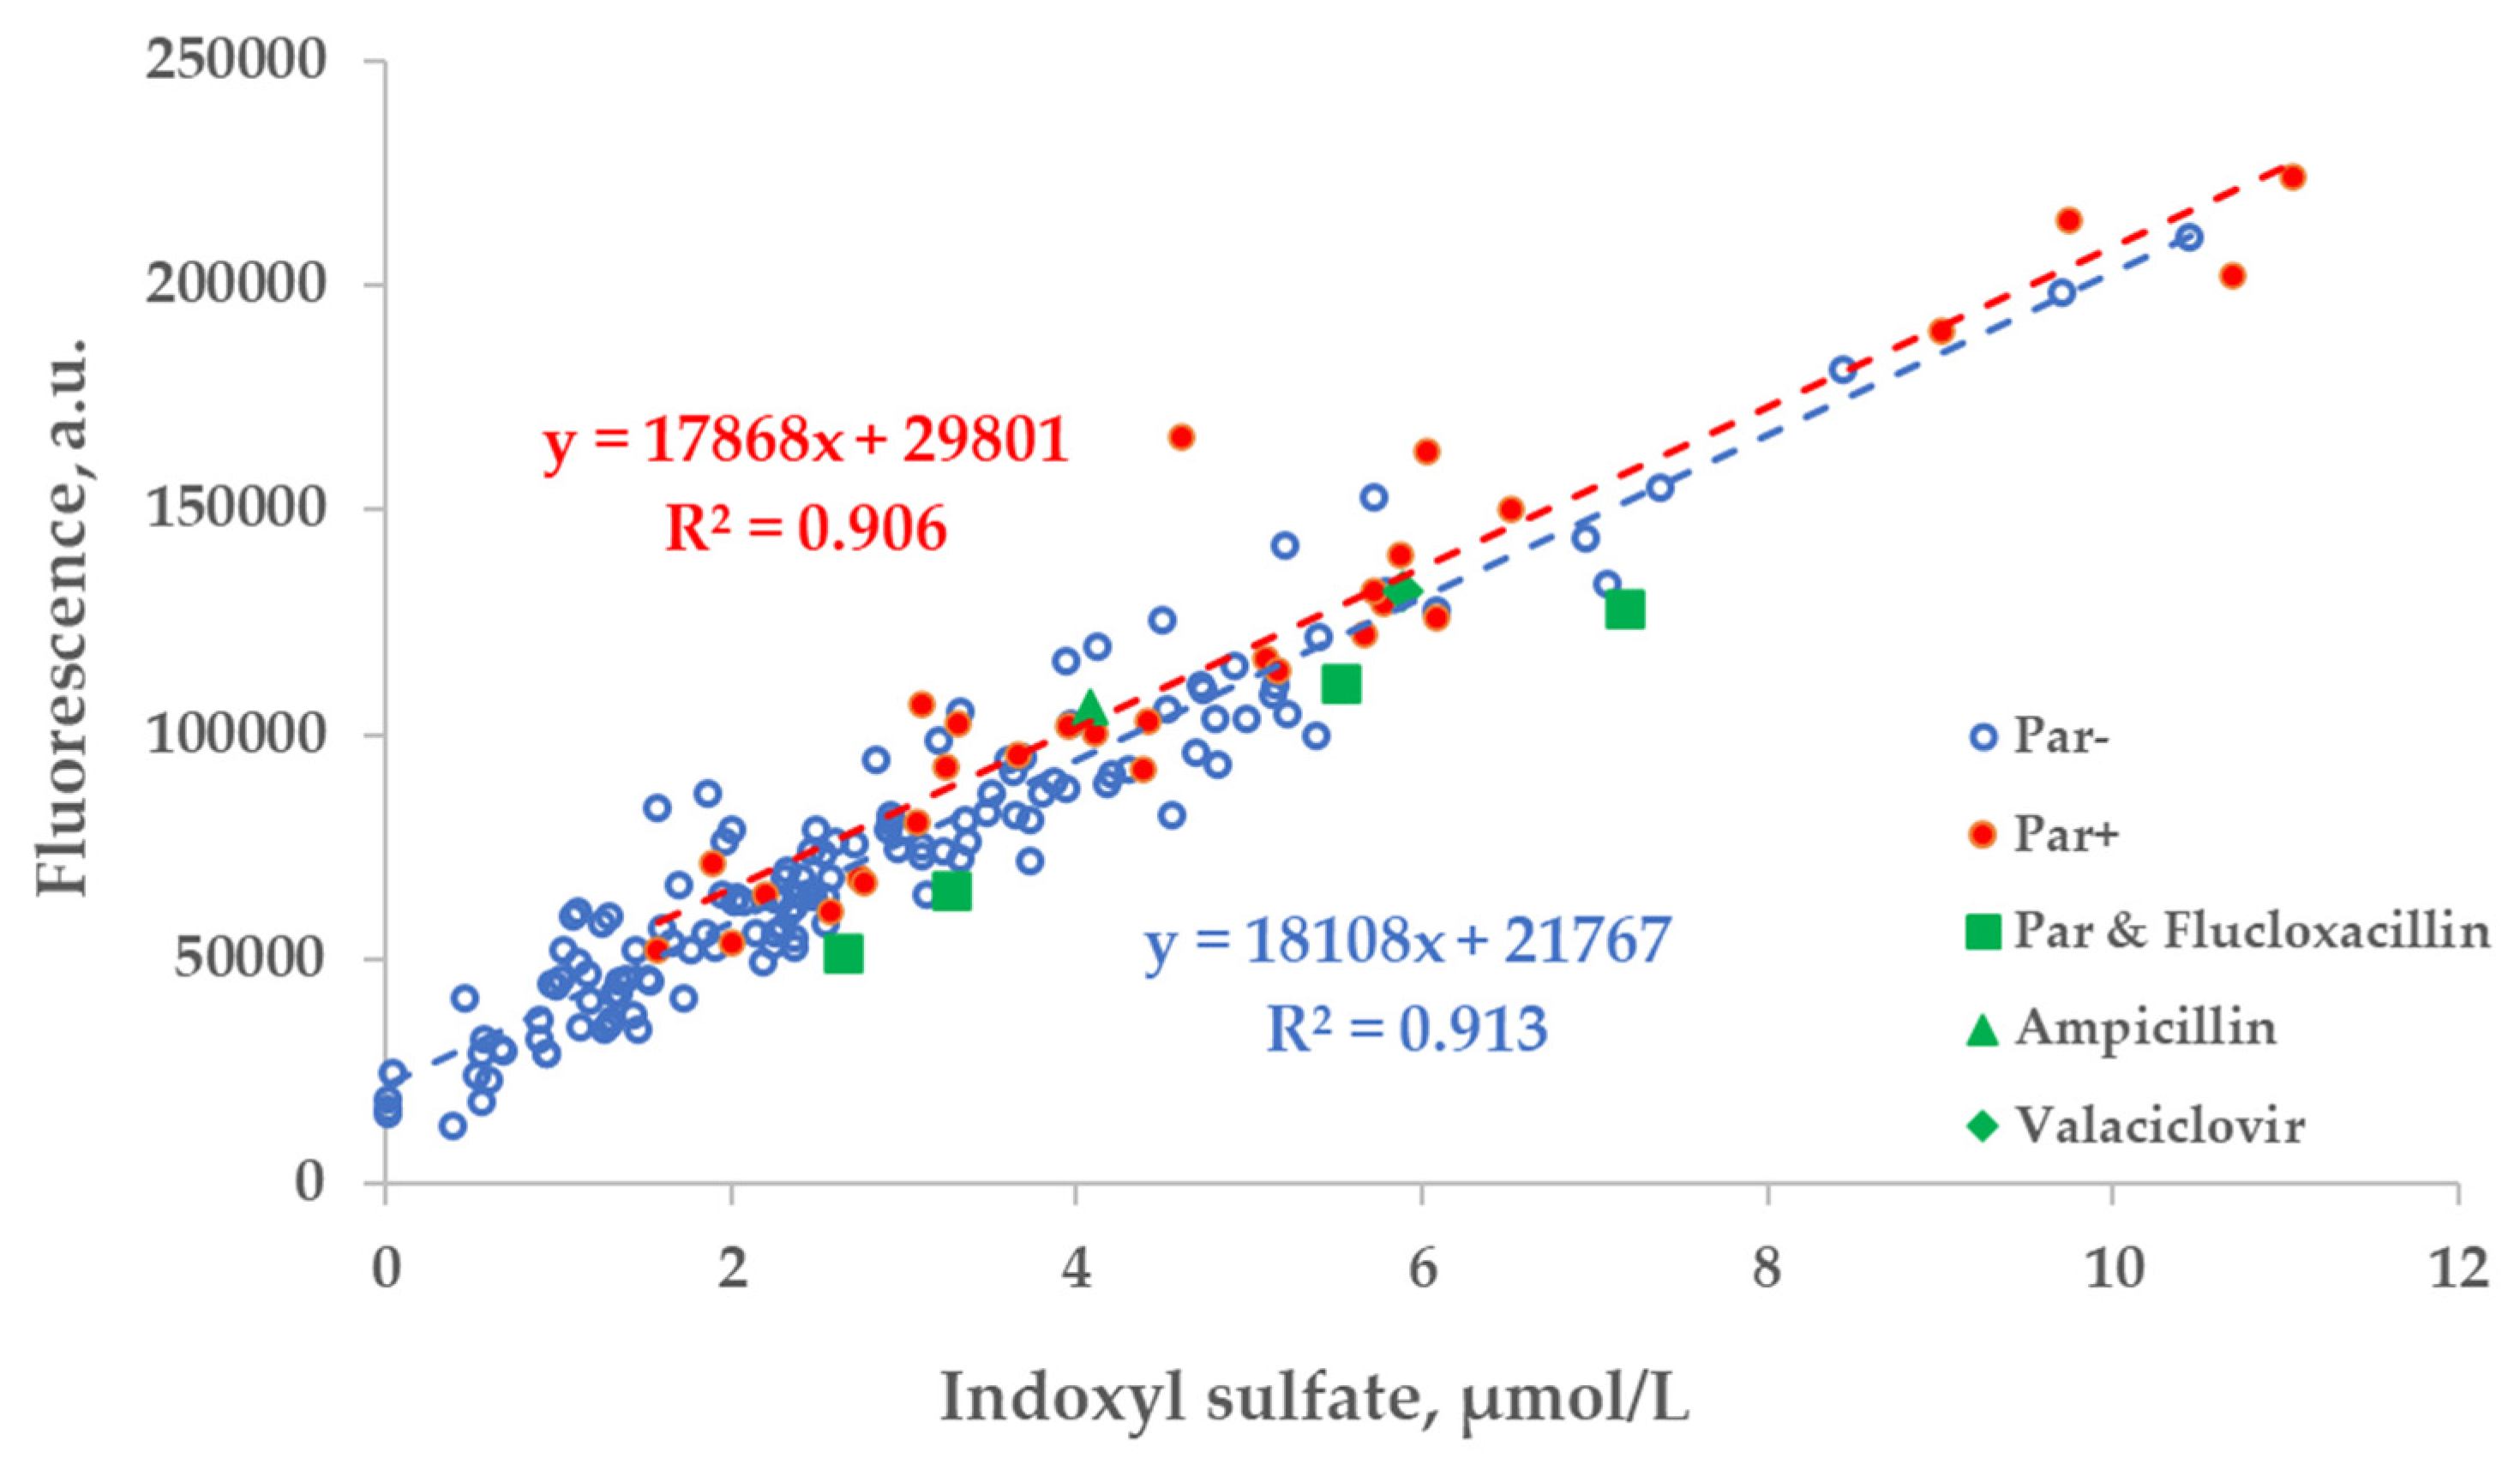
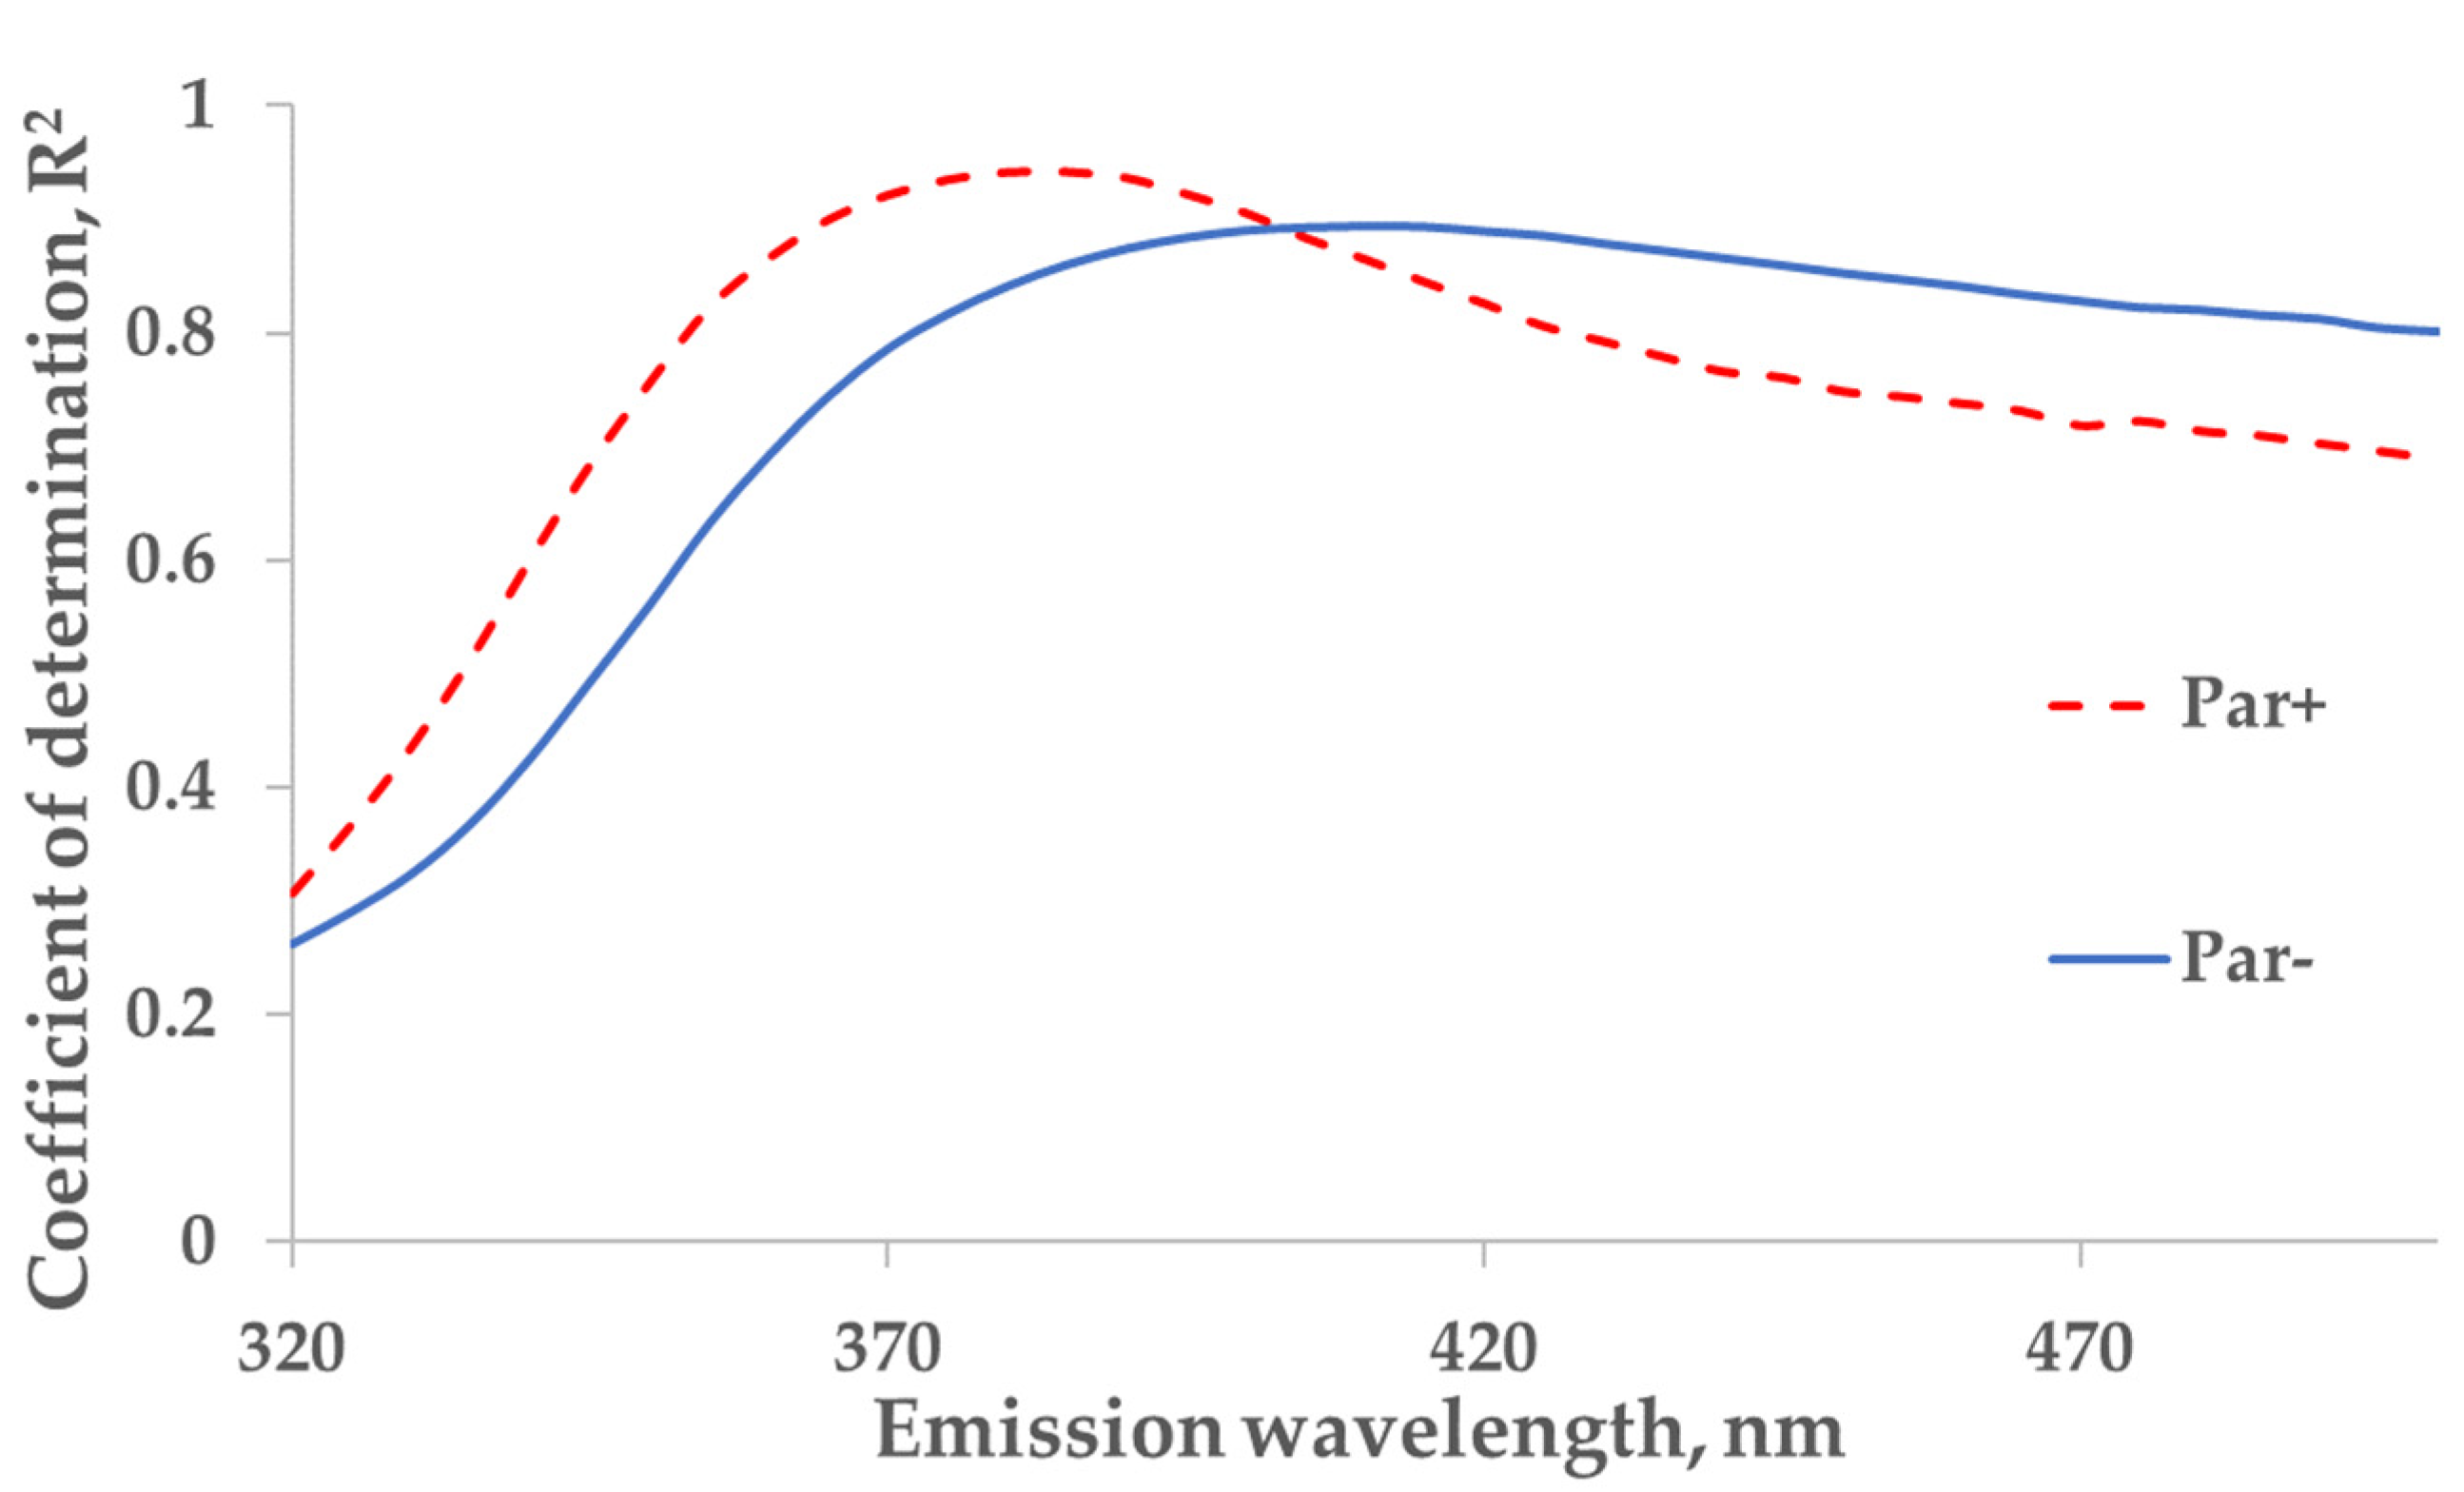
2.2. Influence of Drugs on Correlation between Indoxyl Sulfate and Fluorescence of Dialysate
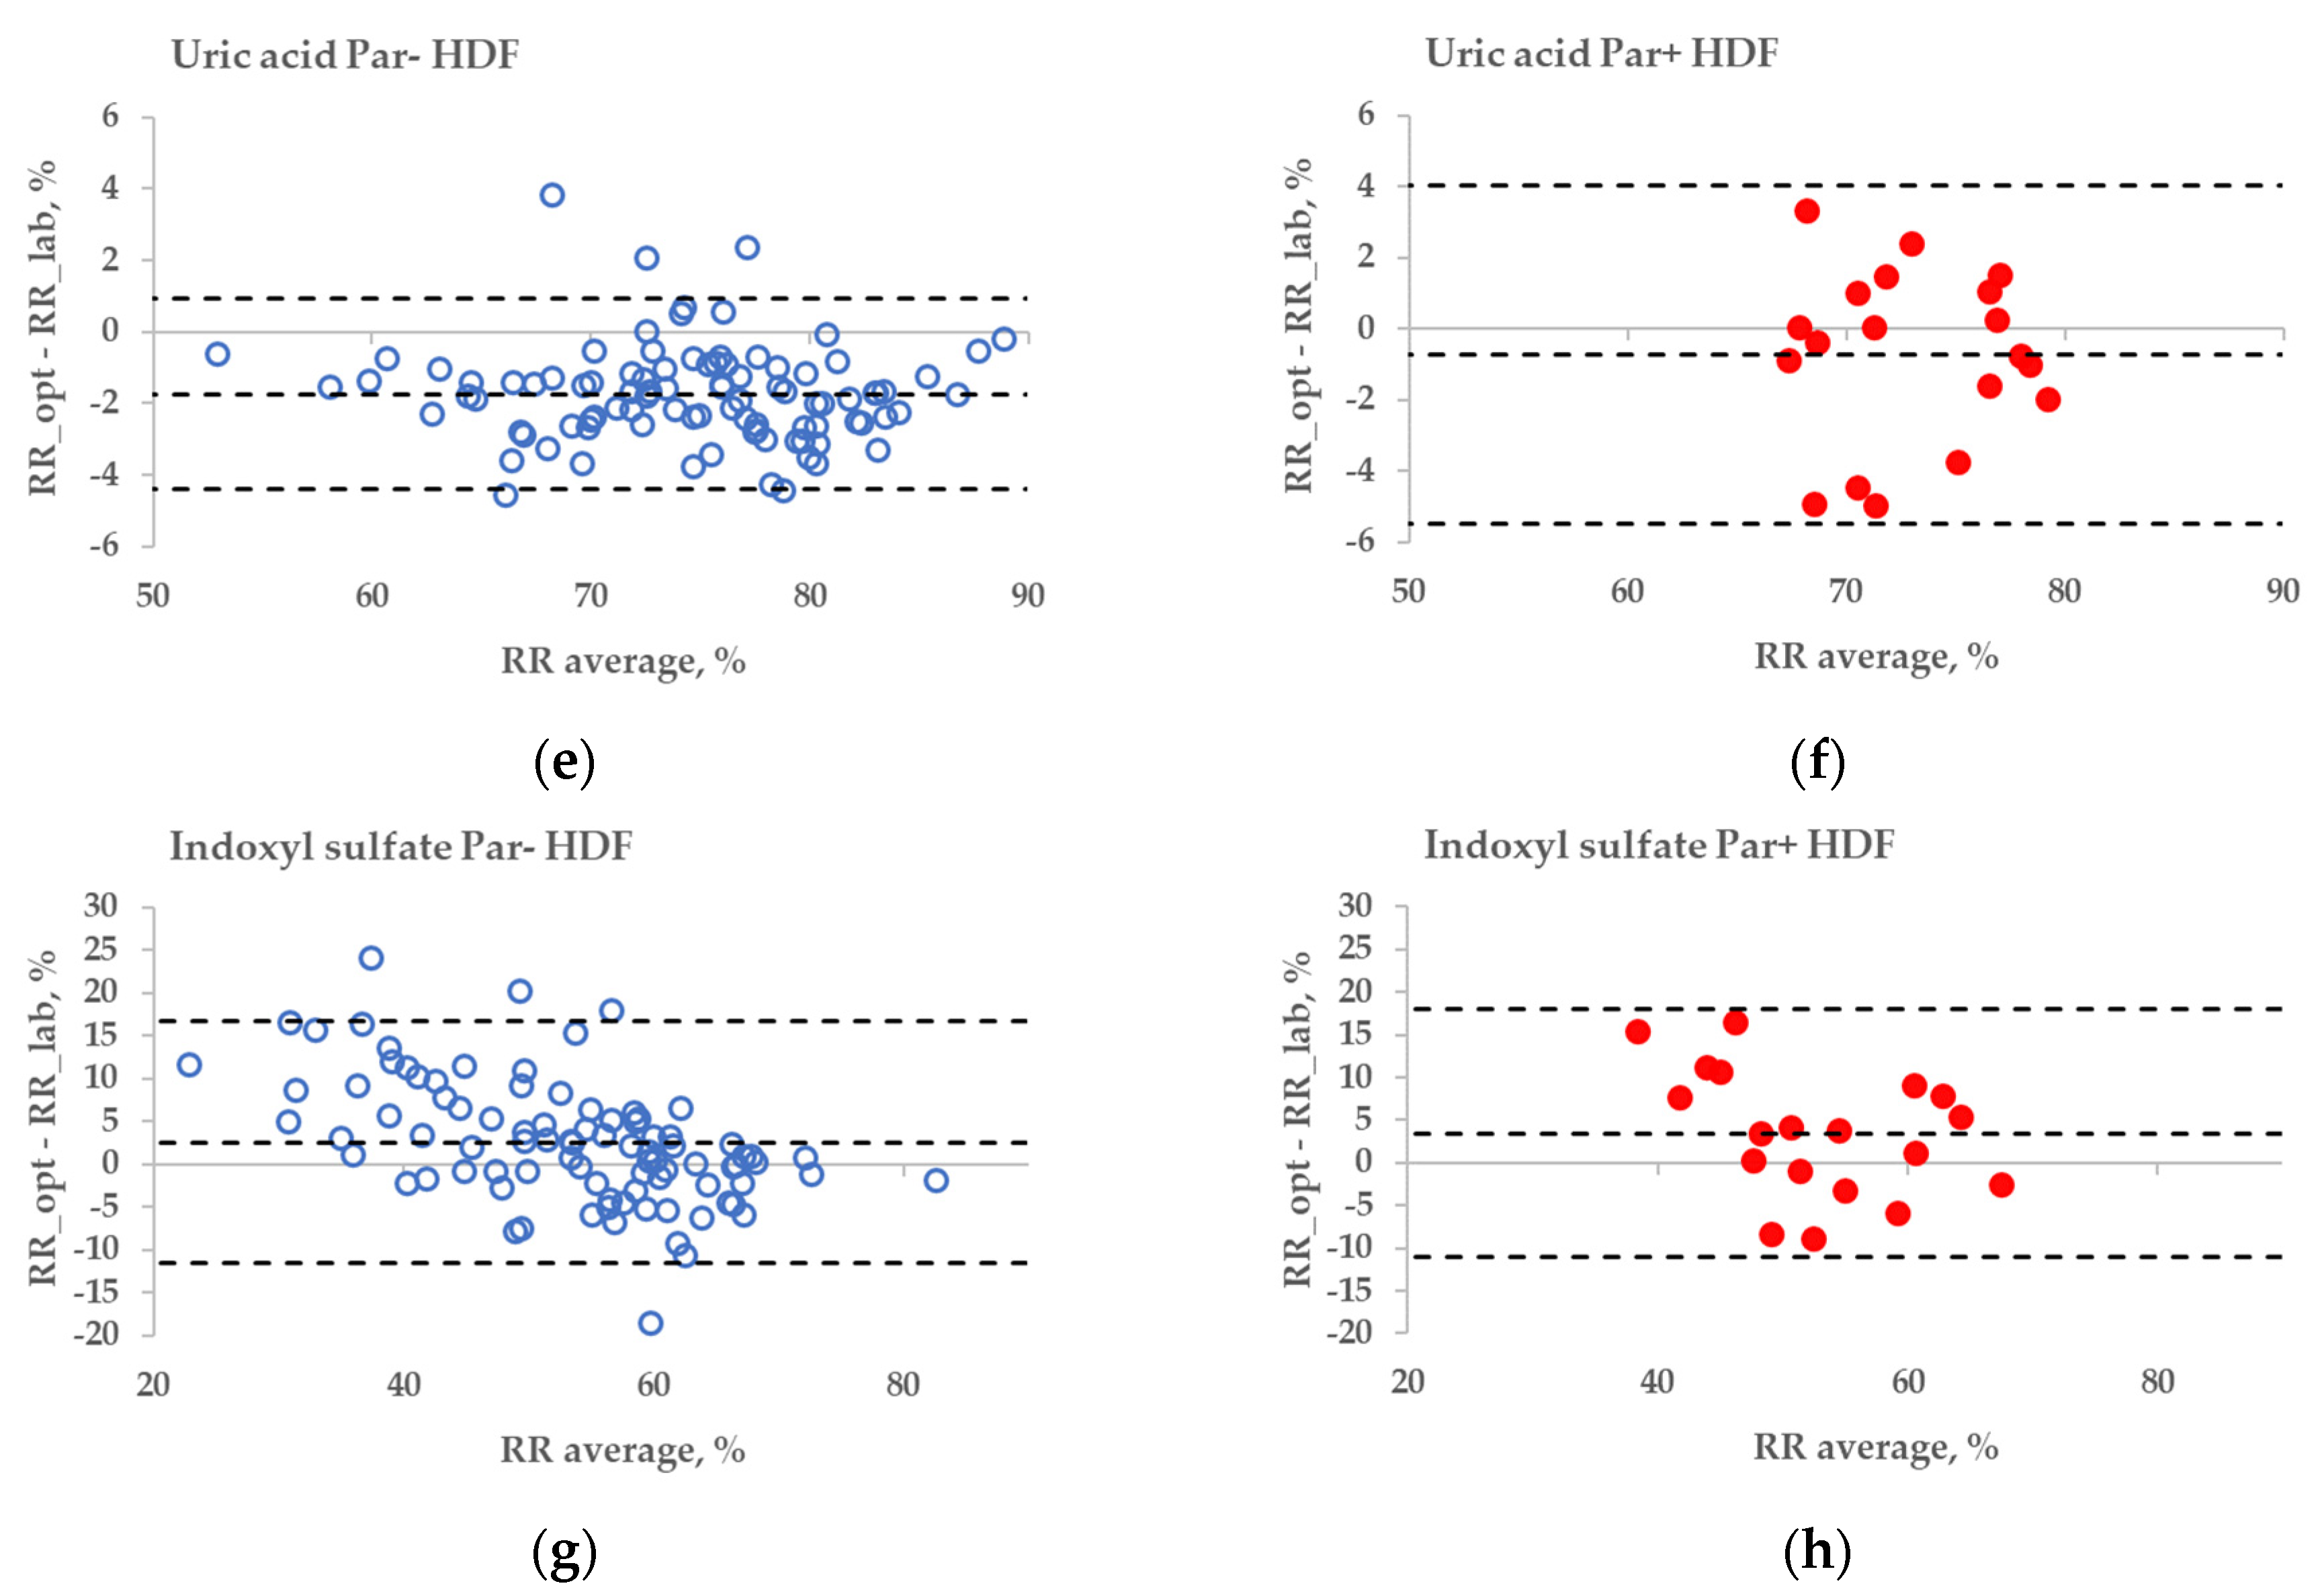
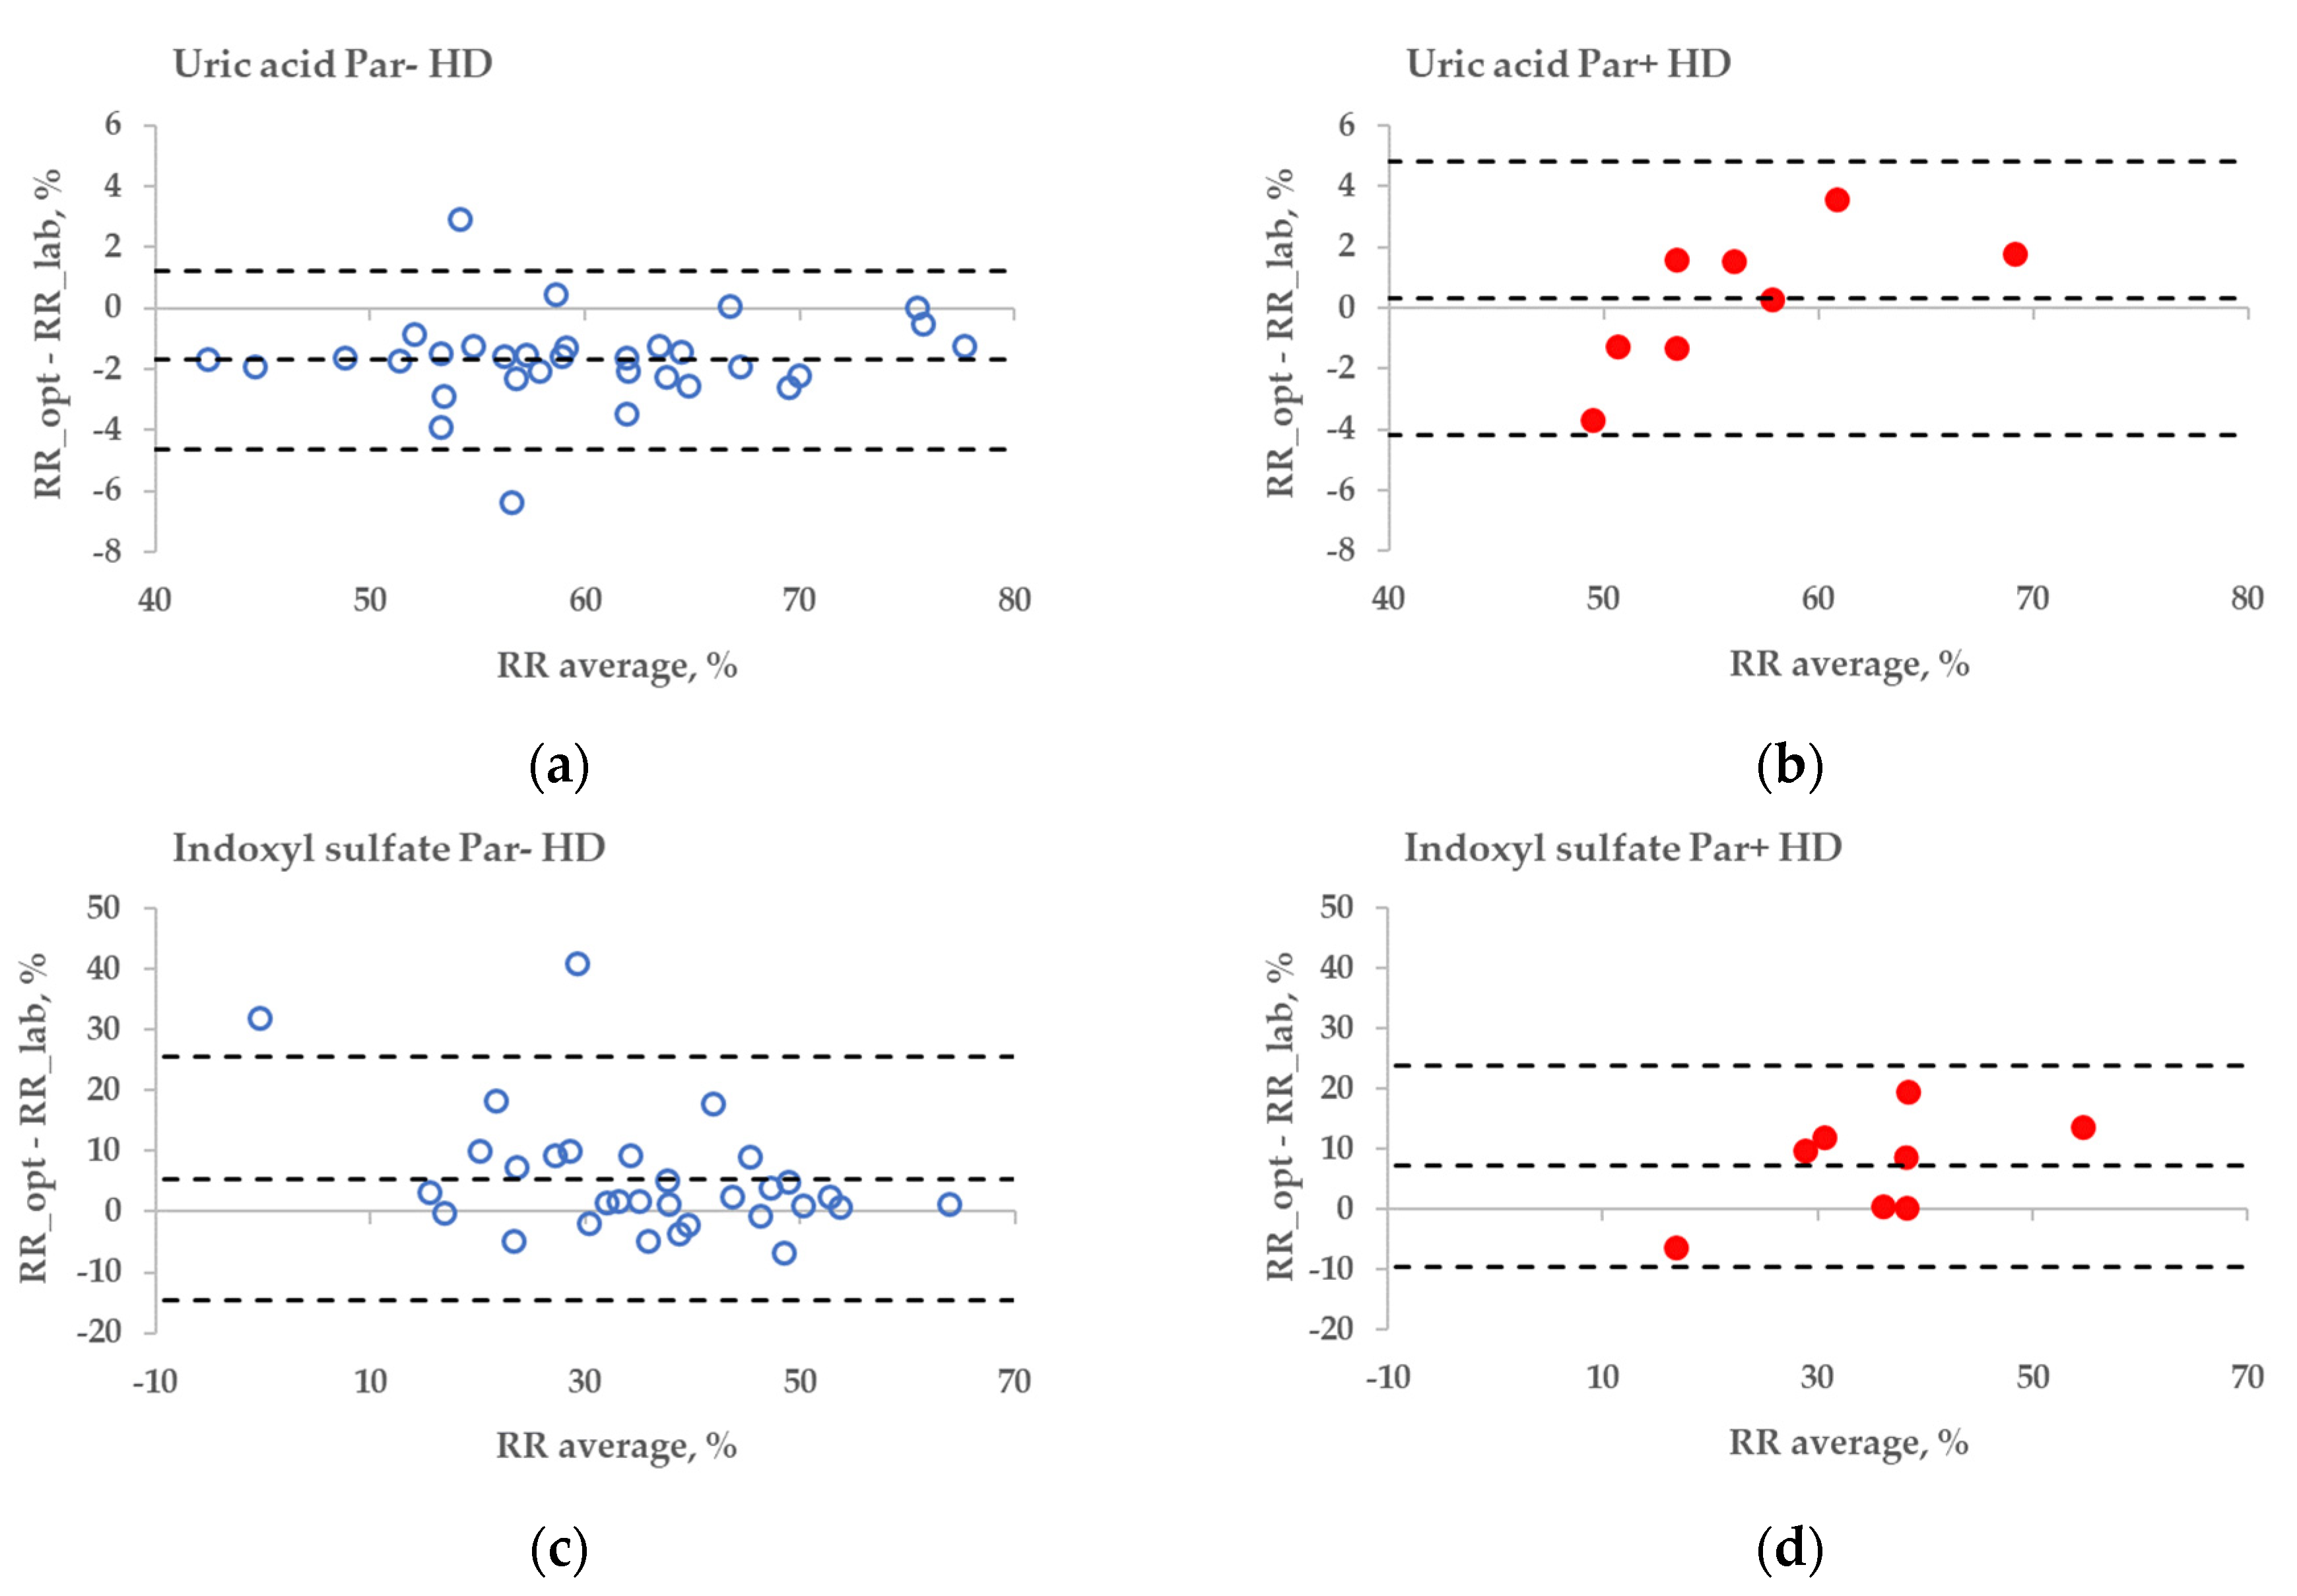
2.3. Influence of Paracetamol on Optical Removal Ratio Monitoring
3. Discussion
4. Conclusions
5. Materials and Methods
Supplementary Materials
Author Contributions
Funding
Institutional Review Board Statement
Informed Consent Statement
Data Availability Statement
Acknowledgments
Conflicts of Interest
References
- Castellarnau, A.; Werner, M.; Günthner, R.; Jakob, M. Real-time Kt/V determination by ultraviolet absorbance in spent dialysate: Technique validation. Kidney Int. 2010, 78, 920–925. [Google Scholar] [CrossRef] [PubMed]
- Uhlin, F.; Fridolin, I. Optical Monitoring of Dialysis Dose. In Modeling and Control of Dialysis Systems; Azar, A.T., Ed.; Springer: Heidelberg, Germany, 2013; Volume 2, pp. 867–928. [Google Scholar] [CrossRef]
- Adimea™ Dialysis Measurement System (Kt/V) for Dialog+®. Available online: https://www.bbraunusa.com/en/products/b2/dialog-adimea-dialysismeasurementsystemktv.html (accessed on 29 June 2022).
- Kt/v Measurement Dialysis Dose Monitor Measuring the Delivered Dialysis Dose. Available online: http://nikkisomedical.com/wp-content/uploads/2017/06/DDM_english_2013-03_vers04.pdf (accessed on 29 June 2022).
- Jerotskaja, J.; Lauri, K.; Tanner, R.; Luman, M.; Fridolin, I. Optical dialysis adequacy sensor: Wavelength dependence of the ultraviolet absorbance in the spent dialysate to the removed solutes. In Proceeding of the 29th Annual International Conference of the IEEE Engineering in Medicine and Biology Society, Lyon, France, 23–26 August 2007; pp. 2960–2963. [Google Scholar] [CrossRef]
- Jerotskaja, J.; Uhlin, F.; Fridolin, I.; Lauri, K.; Luman, M.; Fernström, A. Optical Online Monitoring of Uric Acid Removal during Dialysis. Blood Purif. 2010, 29, 69–74. [Google Scholar] [CrossRef] [PubMed]
- Arund, J.; Luman, M.; Uhlin, F.; Tanner, R.; Fridolin, I. Is Fluorescence Valid to Monitor Removal of Protein Bound Uremic Solutes in Dialysis? PLoS ONE 2016, 11, e0156541. [Google Scholar] [CrossRef] [PubMed]
- Lauri, K.; Arund, J.; Holmar, J.; Tanner, R.; Kalle, S.; Luman, M.; Fridolin, I. Removal of Urea, beta-2-Microglobulin, and Indoxyl Sulfate Assessed by Absorbance and Fluorescence in the Spent Dialysate During Hemodialysis. ASAIO J. 2020, 66, 698–705. [Google Scholar] [CrossRef] [PubMed]
- Paats, J.; Adoberg, A.; Arund, J.; Fridolin, I.; Lauri, K.; Leis, L.; Luman, M.; Tanner, R. Optical Method and Biochemical Source for the Assessment of the Middle-Molecule Uremic Toxin β2-Microglobulin in Spent Dialysate. Toxins 2021, 13, 255. [Google Scholar] [CrossRef] [PubMed]
- Tanner, R.; Arund, J.; Fridolin, I.; Luman, M. Paracetamol interference in uric Acid levels in uremic patients revealed by monitoring spent dialysate. ISRN Nephrol. 2013, 2013, 515292. [Google Scholar] [CrossRef] [PubMed]
- Paats, J.; Adoberg, A.; Arund, J.; Fridolin, I.; Holmar, J.; Leis, L.; Pilt, K.; Tanner, R.; Uhlin, F.; Luman, M. POS-648 Medicines intake influences accuracy of the uremic retention molecules’ optical monitoring in spent dialysate: The case of uremic toxin uric acid and paracetamol. Kidney Int. Rep. 2022, 7, S277–S278. [Google Scholar] [CrossRef]
- Norazmi, N.; Abdul Rasad, Z.R.; Mohamad, M.; Manap, H. Uric acid detection using uv-vis spectrometer. IOP Conf. Ser. Mater. Sci. Eng. 2017, 257, 012031. [Google Scholar] [CrossRef] [Green Version]
- Vasquez-Rios, G.; Zhang, F.; Scott, M.G.; Vijayan, A. Adequacy of hemodialysis in acute kidney injury: Real-time monitoring of dialysate ultraviolet absorbance vs. blood-based Kt/Vurea. Hemodial. Int. 2021, 25, 43–49. [Google Scholar] [CrossRef] [PubMed]
- Holmar, J.; Fridolin, I.; Uhlin, F.; Lauri, K.; Luman, M. Optical Method for Cardiovascular Risk Marker Uric Acid Removal Assessment during Dialysis. Sci. World J. 2012, 2012, 506486. [Google Scholar] [CrossRef] [PubMed]
- Fonin, A.V.; Sulatskaya, A.I.; Kuznetsova, I.M.; Turoverov, K.K. Fluorescence of Dyes in Solutions with High Absorbance. Inner Filter Effect Correction. PLoS ONE 2014, 9, e103878. [Google Scholar] [CrossRef] [PubMed]
- Wang, T.; Zeng, L.-H.; Li, D.-L. A review on the methods for correcting the fluorescence inner-filter effect of fluorescence spectrum. Appl. Spectrosc. Rev. 2017, 52, 883–908. [Google Scholar] [CrossRef]
- Paats, J.; Adoberg, A.; Around, J.; Dhondt, A.; Fernström, A.; Fridolin, I.; Glorieux, G.; Leis, L.; Luman, M.; Gonzalez-Parra, E.; et al. Serum Levels and Removal by Haemodialysis and Haemodiafiltration of Tryptophan-Derived Uremic Toxins in ESKD Patients. Int. J. Mol. Sci. 2020, 21, 1522. [Google Scholar] [CrossRef] [PubMed]
- Jones, G.A.; Bradshaw, D.S. Resonance Energy Transfer: From Fundamental Theory to Recent Applications. Front. Phys. 2019, 7, 100. [Google Scholar] [CrossRef] [Green Version]


| Groups Treatments | RR_UA_lab | RR_UA_opt | RR_IS_lab | RR_IS_opt |
|---|---|---|---|---|
| Par− HD | 60.68 ± 8.40 | 59.00 ± 8.57 | 32.88 ± 16.30 | 38.34 ± 12.27 |
| Par+ HD | 56.2 ± 5.62 | 56.52 ± 7.19 | 31.66 ± 9.09 | 38.89 ± 13.62 |
| p-value | 0.091 | 0.419 | 0.783 | 0.919 |
| Par− HDF | 75.41 ± 6.88 | 73.67 ± 6.78 | 51.92 ± 13.52 | 54.48 ± 9.77 |
| Par+ HDF | 73.37 ± 4.19 | 72.64 ± 4.23 | 50.88 ± 10.20 | 54.33 ± 7.49 |
| p-value | 0.096 | 0.396 | 0.707 | 0.943 |
| Entity of the Data | Specifications | ||
|---|---|---|---|
| Par− Group | Par+ Group | Exceptional Cases * | |
| No. of patients * | 38 | 9 | 3 |
| Cause of ESKD | Diabetes (4); glomerulonephritis (8); hypertension (10); ADPKD (2); renal carcinoma (3); tubulointerstitial nephritis (5); other (6) | Diabetes (3); glomerulonephritis (1); hypertension (1); ADPKD (1); renal carcinoma (1); other (2) | Diabetes (1); other (2) |
| Age (years) | 62 ± 16 | 68 ± 15 | 45 ± 15 |
| Gender | M (32), F (6) | M (7), F (2) | M (2), F (1) |
| Race | Caucasian 100% | Caucasian 100% | Caucasian 100% |
| BW a, kg | 78.0 (68.0–87.9) | 79.0 (74.6–84.1) | 79.9 (73.5–89.8) |
| BMI a, kg/m2 | 25.8 (23.0–29.5) | 27.2 (23.3–28.1) | 25.8 (24.4–27.3) |
| Urinary volume a, mL | 0 (19 patients) 800 (335–1200) (19 patients) | 0 (5 patients) 575 (388–750) (4 patients) | 0 (2 patients) 2700 (2700–2700) (1 patient) |
| Pre-dialysis-serum total protein a, g/L | 66.3 (61.0–68.9) | 68.0 (66.0–71.0) | 68.5 (64.1–71.3) |
| Pre-dialysis haematocrit a, % | 35.8 (33.9–37.7) | 38.0 (37.0–39.0) | 32.7 (30.4–35.5) |
| Pre-dialysis-serum calcium a, mmol/L | 2.30 (2.18–2.39) | 2.31 (2.20–2.36) | 2.26 (2.22–2.36) |
| Pre-dialysis-serum phosphorus a, mmol/L | 1.70 (1.22–1.95) | 1.50 (1.40–1.66) | 2.25 (2.14–2.38) |
| Dialysis vintage, months | 32 (12–89) | 51 (25–63) | 12 (11–48) |
| Vascular access | Native fistula (28); graft (8); catheter (2) | Native fistula (8); graft (1) | Native fistula (3) |
| No. of dialyses | 35 (HD) 102 (HDF) | 8 (HD) 23 (HDF) | 3 (HD) 3 (HDF) |
| spKt/V | 1.04 (0.90–1.17) (HD) 1.60 (1.36–1.83) (HDF) | 1.13 (0.94–1.17) (HD) 1.69 (1.52–1.83) (HDF) | 1.03 (0.99–1.07) (HD) 1.44 (1.40–1.56) (HDF) |
| Blood flow (Q_b) effective, mL/min | 199 (199–199)) (HD) 300 (297–356) (HDF) | 199 (199–200) (HD) 345 (298–360) (HDF) | 199 (199–199) (HD) 297 (282–347) (HDF) |
| Dialysate flow (Q_d), mL/min | 299 (297–300) (HD) 789 (500–800) (HDF) | 300 (300–300) HD) 800 (497–800) (HDF) | 300 (299–300) (HD) 795 (558–798) (HDF) |
| Ultrafiltration volume, mL | 2378 (1051–3336) (HD) 2000 (1336–3000) (HDF) | 2050 (1400–2445) (HD) 2500 (2000–2937) (HDF) | 4000 (2200–4150) (HD) 398 (397–399) (HDF) |
| Liquid-substitution volume, L | 0 (HD) 22 (15–25) (HDF) | 0 (HD) 22 (15–26) (HDF) | 0 (HD) 24 (20–25) (HDF) |
| Dialysis membrane surface area, m2 | 1.5 (1.4–1.5) (HD) 2.2 (2.1–2.2) (HDF) | 1.4 (1.4–1.4) (HD) 2.1 (2.0–2.1) (HDF) | 1.4 (1.4–1.5) (HD) 1.8 (1.8–1.8) (HDF) |
| Patient No. | UV-Absorbing Drug | Daily Dosage |
|---|---|---|
| #1 | Paracetamol | 1 g × 4 or 1 g × 3 |
| #2 | Paracetamol | 1 g × 4 |
| #3 | Paracetamol | 1.33 g × 3 or 1 g × 3 |
| #4 | Paracetamol | 1 g × 4 |
| #5 | Paracetamol | 1 g × 3 |
| #6 | Paracetamol | 1 g × 2 |
| #7 | Paracetamol | 1 g × 4 |
| #8 | Paracetamol | 1 g × 2 |
| #9 | Paracetamol | 1 g |
| #10* | Paracetamol + Flucloxacillin * | 1 g × 4 + 0.75 g × 3 |
| #11* | Ampicillin * | 0.375 g × 1 |
| #12* | Valaciclovir * | 0.5 g × 2 |
Publisher’s Note: MDPI stays neutral with regard to jurisdictional claims in published maps and institutional affiliations. |
© 2022 by the authors. Licensee MDPI, Basel, Switzerland. This article is an open access article distributed under the terms and conditions of the Creative Commons Attribution (CC BY) license (https://creativecommons.org/licenses/by/4.0/).
Share and Cite
Adoberg, A.; Paats, J.; Arund, J.; Dhondt, A.; Fridolin, I.; Glorieux, G.; Holmar, J.; Lauri, K.; Leis, L.; Luman, M.; et al. Treatment with Paracetamol Can Interfere with the Intradialytic Optical Estimation in Spent Dialysate of Uric Acid but Not of Indoxyl Sulfate. Toxins 2022, 14, 610. https://doi.org/10.3390/toxins14090610
Adoberg A, Paats J, Arund J, Dhondt A, Fridolin I, Glorieux G, Holmar J, Lauri K, Leis L, Luman M, et al. Treatment with Paracetamol Can Interfere with the Intradialytic Optical Estimation in Spent Dialysate of Uric Acid but Not of Indoxyl Sulfate. Toxins. 2022; 14(9):610. https://doi.org/10.3390/toxins14090610
Chicago/Turabian StyleAdoberg, Annika, Joosep Paats, Jürgen Arund, Annemieke Dhondt, Ivo Fridolin, Griet Glorieux, Jana Holmar, Kai Lauri, Liisi Leis, Merike Luman, and et al. 2022. "Treatment with Paracetamol Can Interfere with the Intradialytic Optical Estimation in Spent Dialysate of Uric Acid but Not of Indoxyl Sulfate" Toxins 14, no. 9: 610. https://doi.org/10.3390/toxins14090610
APA StyleAdoberg, A., Paats, J., Arund, J., Dhondt, A., Fridolin, I., Glorieux, G., Holmar, J., Lauri, K., Leis, L., Luman, M., Pilt, K., Uhlin, F., & Tanner, R. (2022). Treatment with Paracetamol Can Interfere with the Intradialytic Optical Estimation in Spent Dialysate of Uric Acid but Not of Indoxyl Sulfate. Toxins, 14(9), 610. https://doi.org/10.3390/toxins14090610