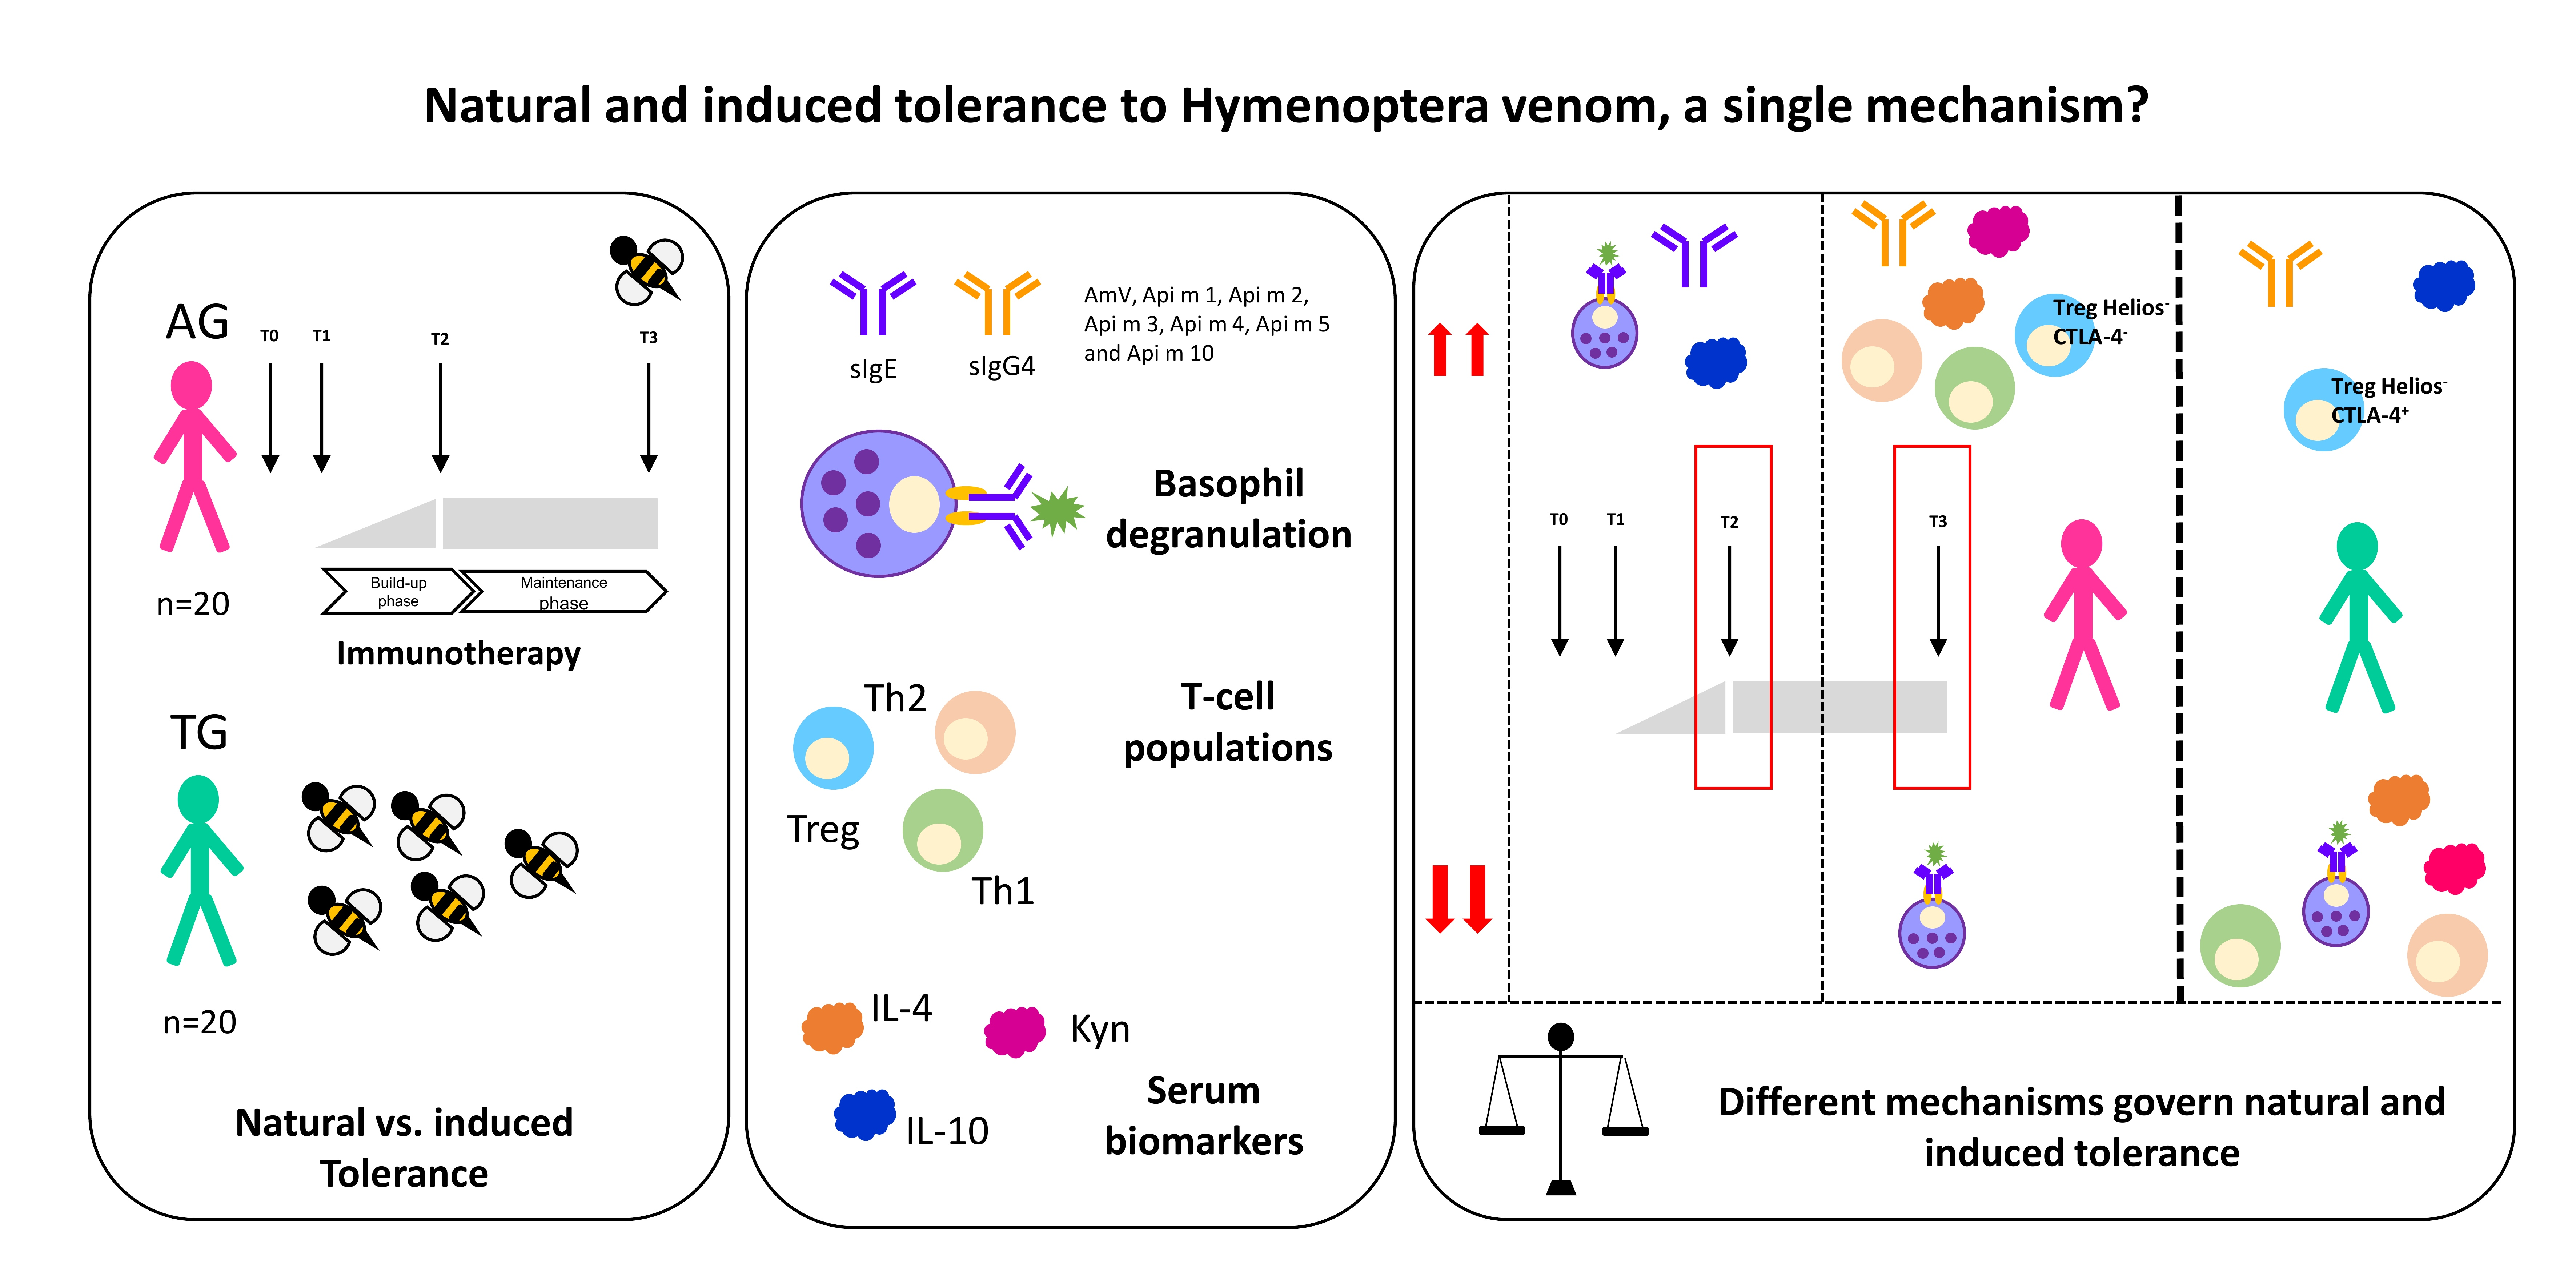
Natural and Induced Tolerance to Hymenoptera Venom: A Single Mechanism?


 ,
,  and
and 
Abstract
: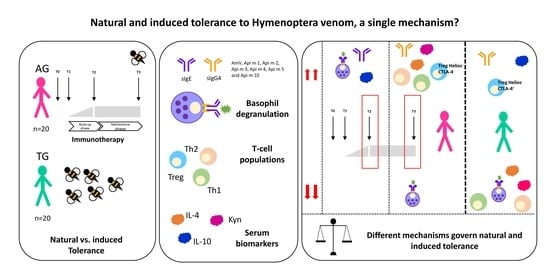
1. Introduction
2. Results
2.1. Biodemographic and Clinical
2.2. Efector Cells
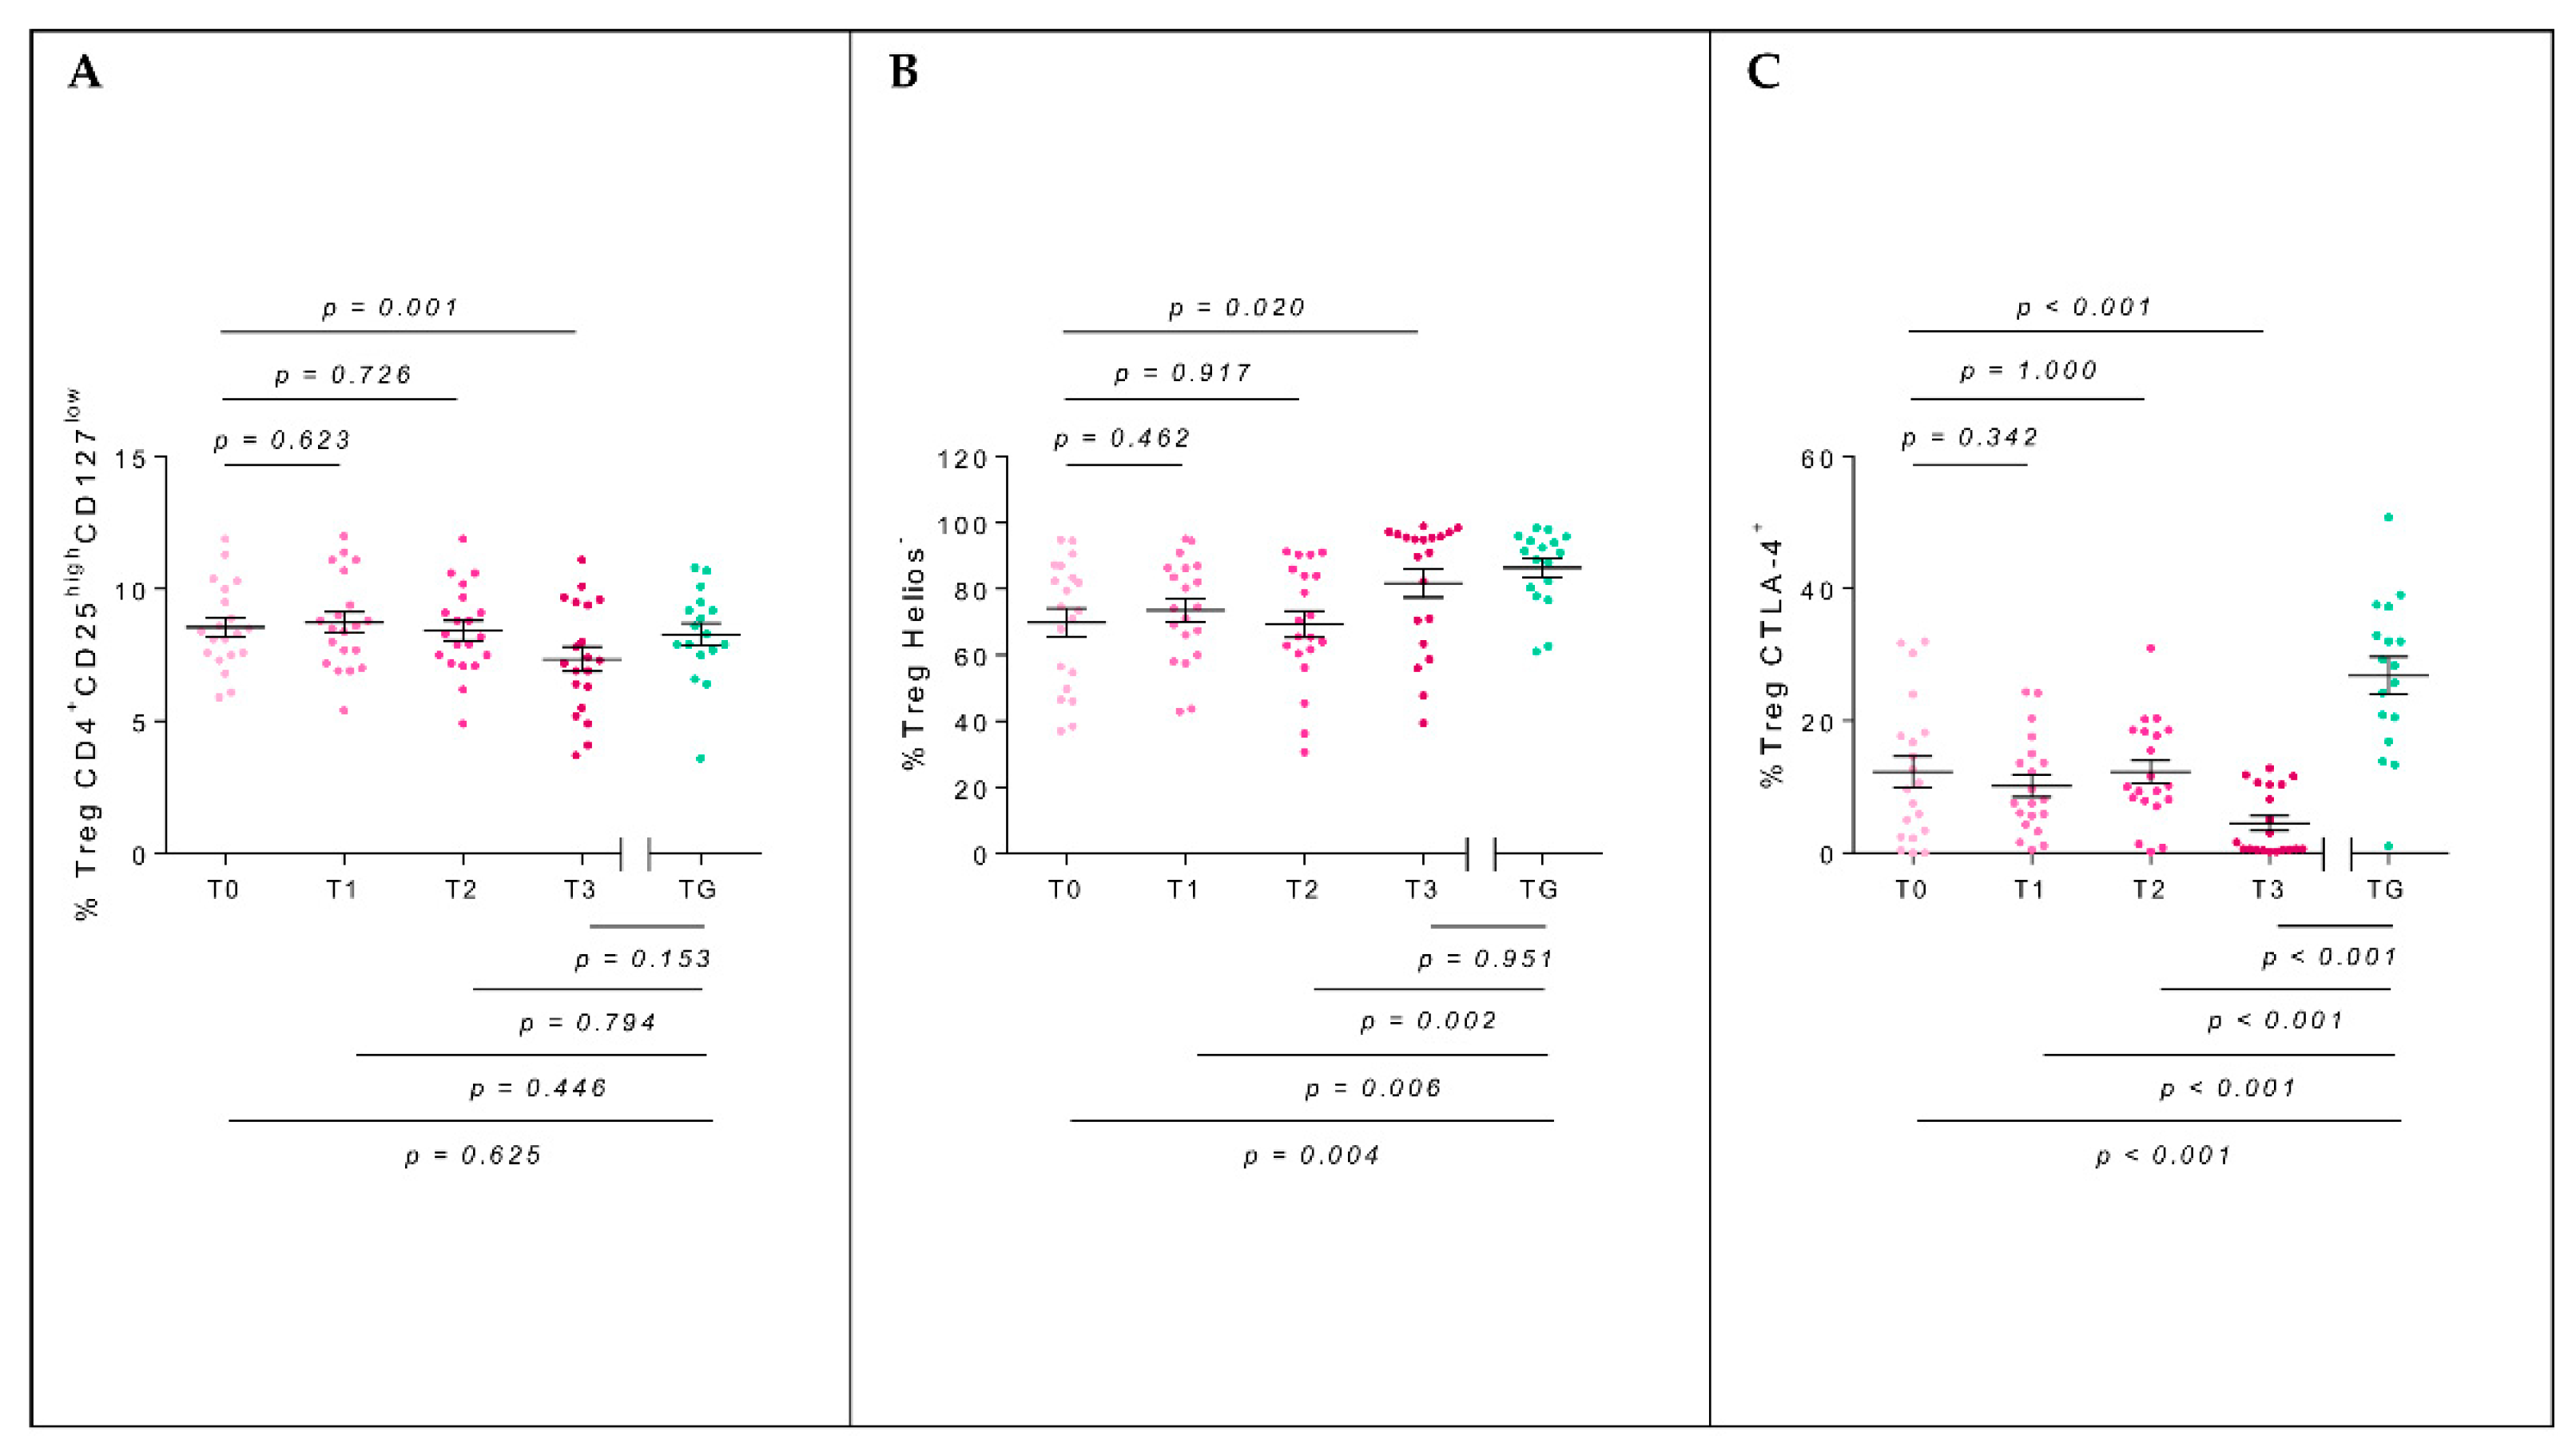
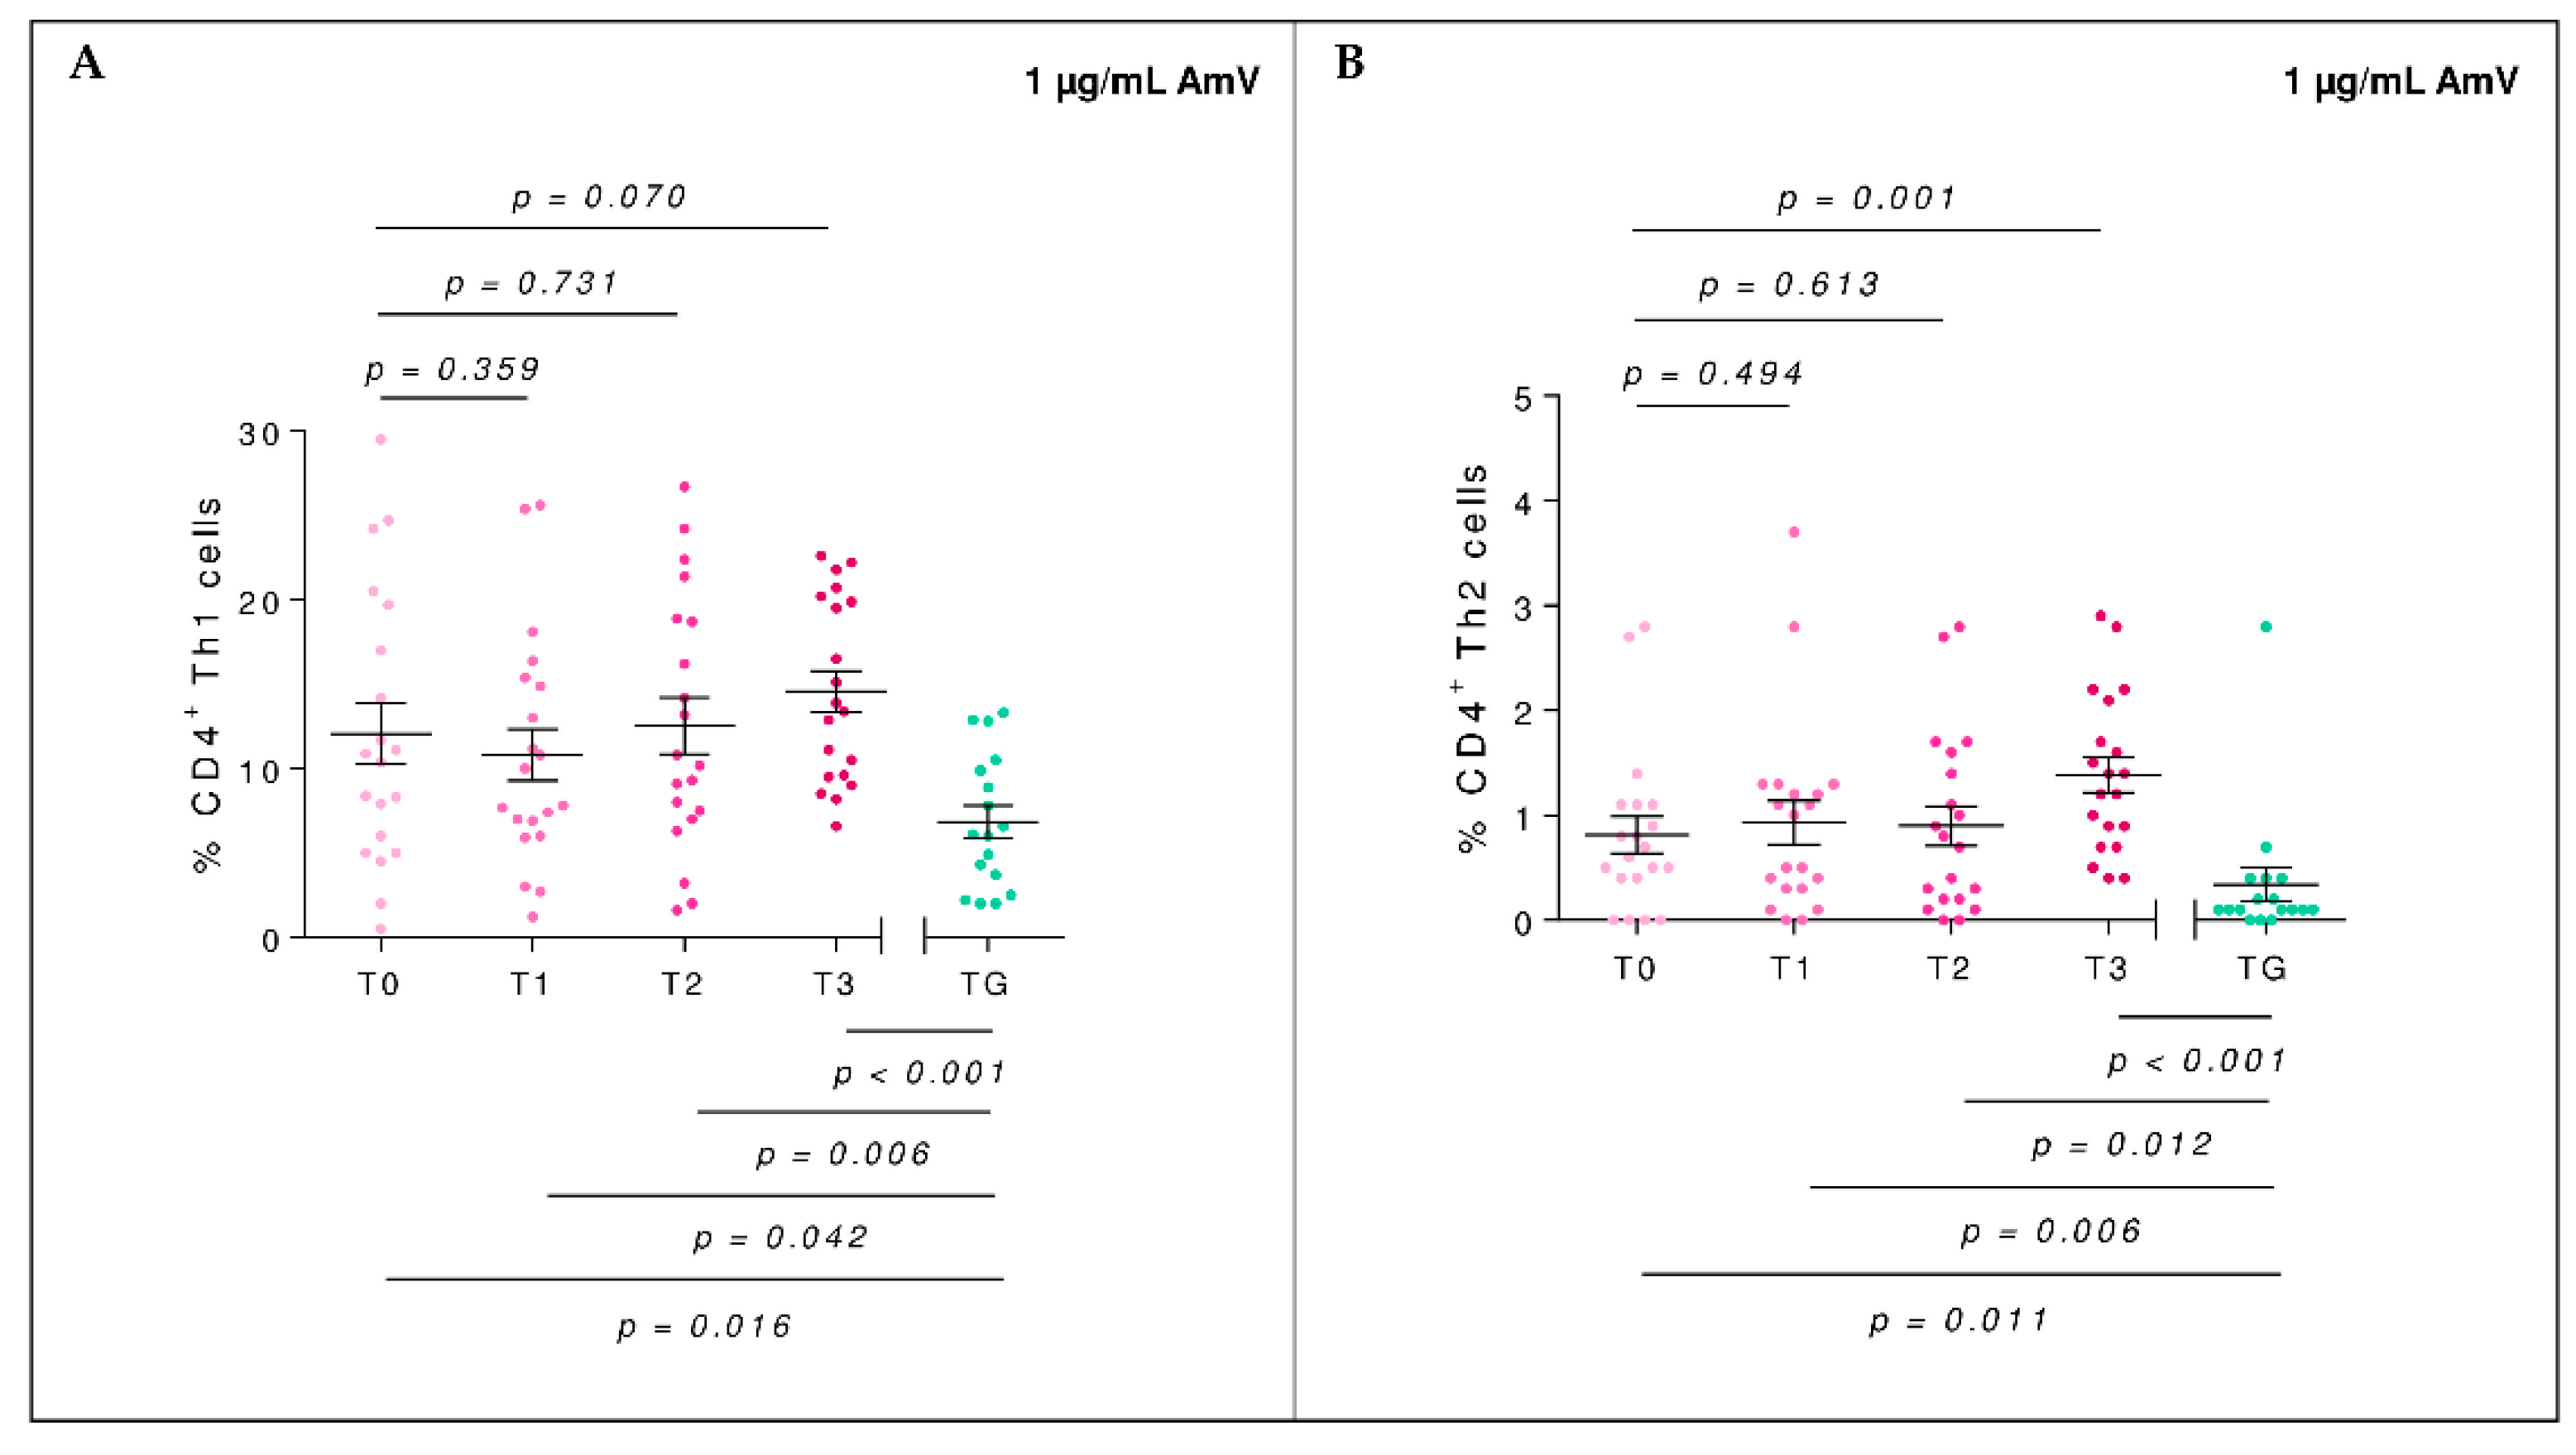
2.3. T-Regulatory Populations
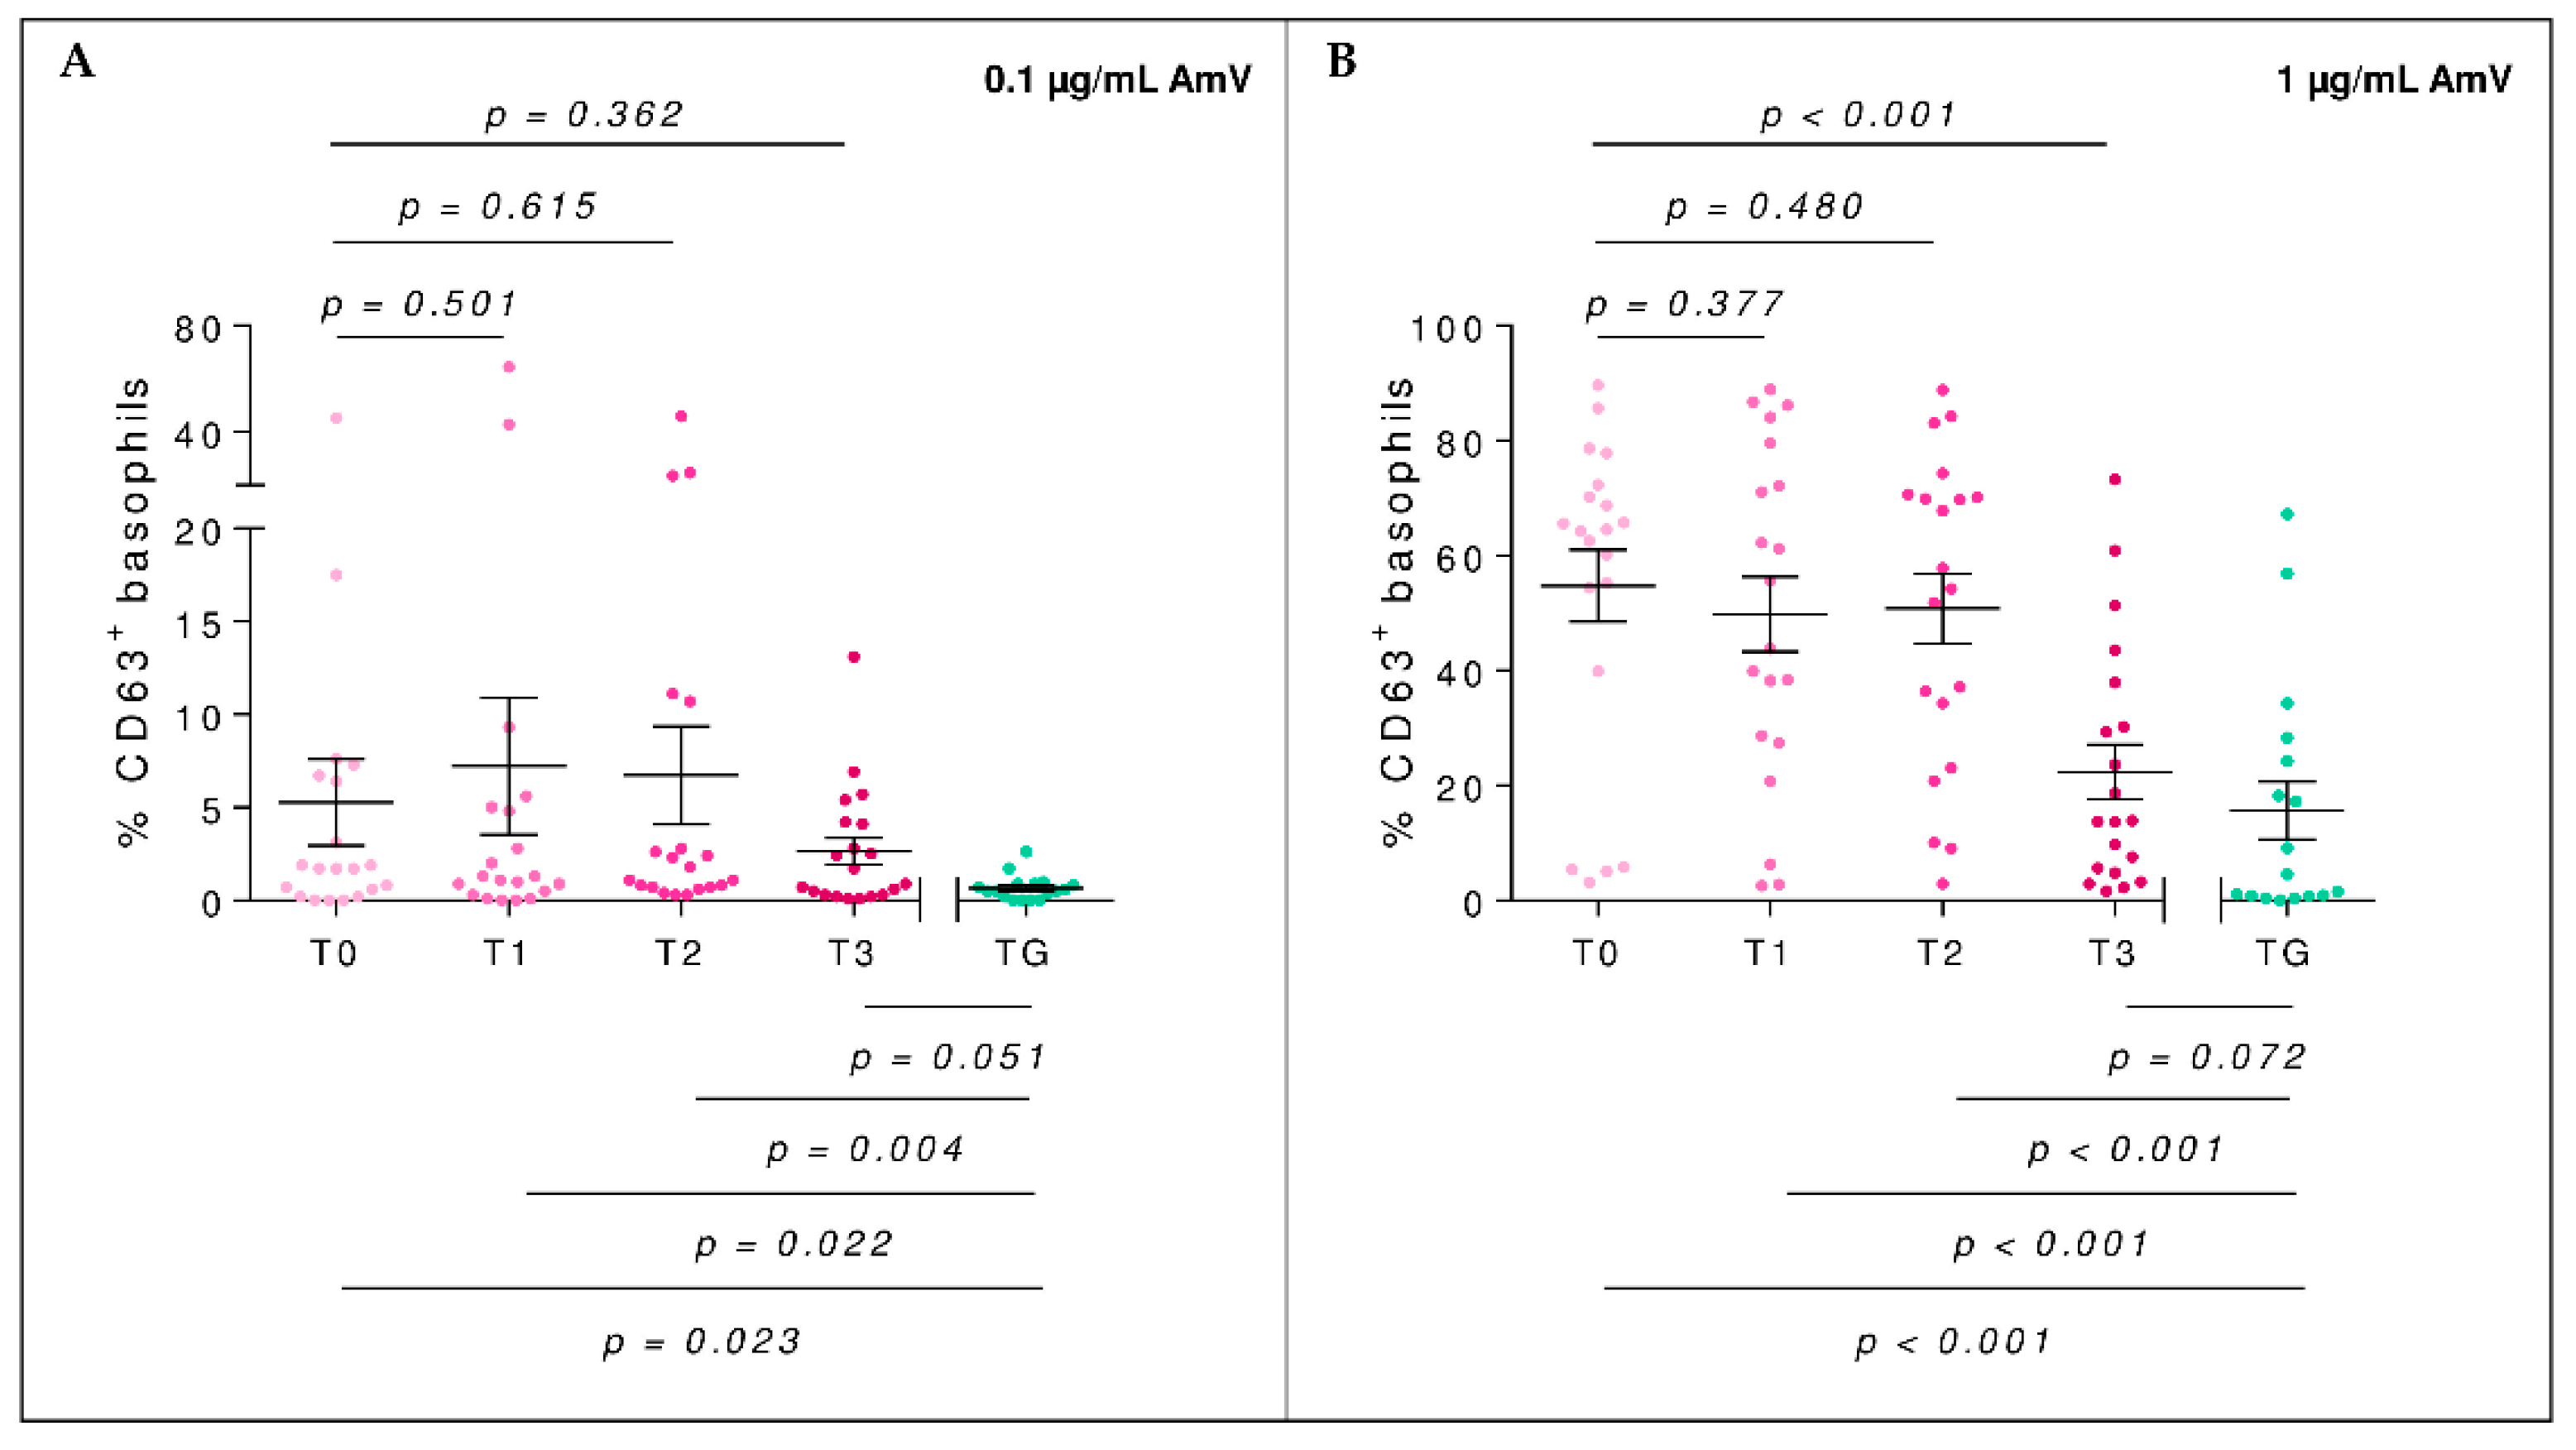
2.4. Basophil Activation Test
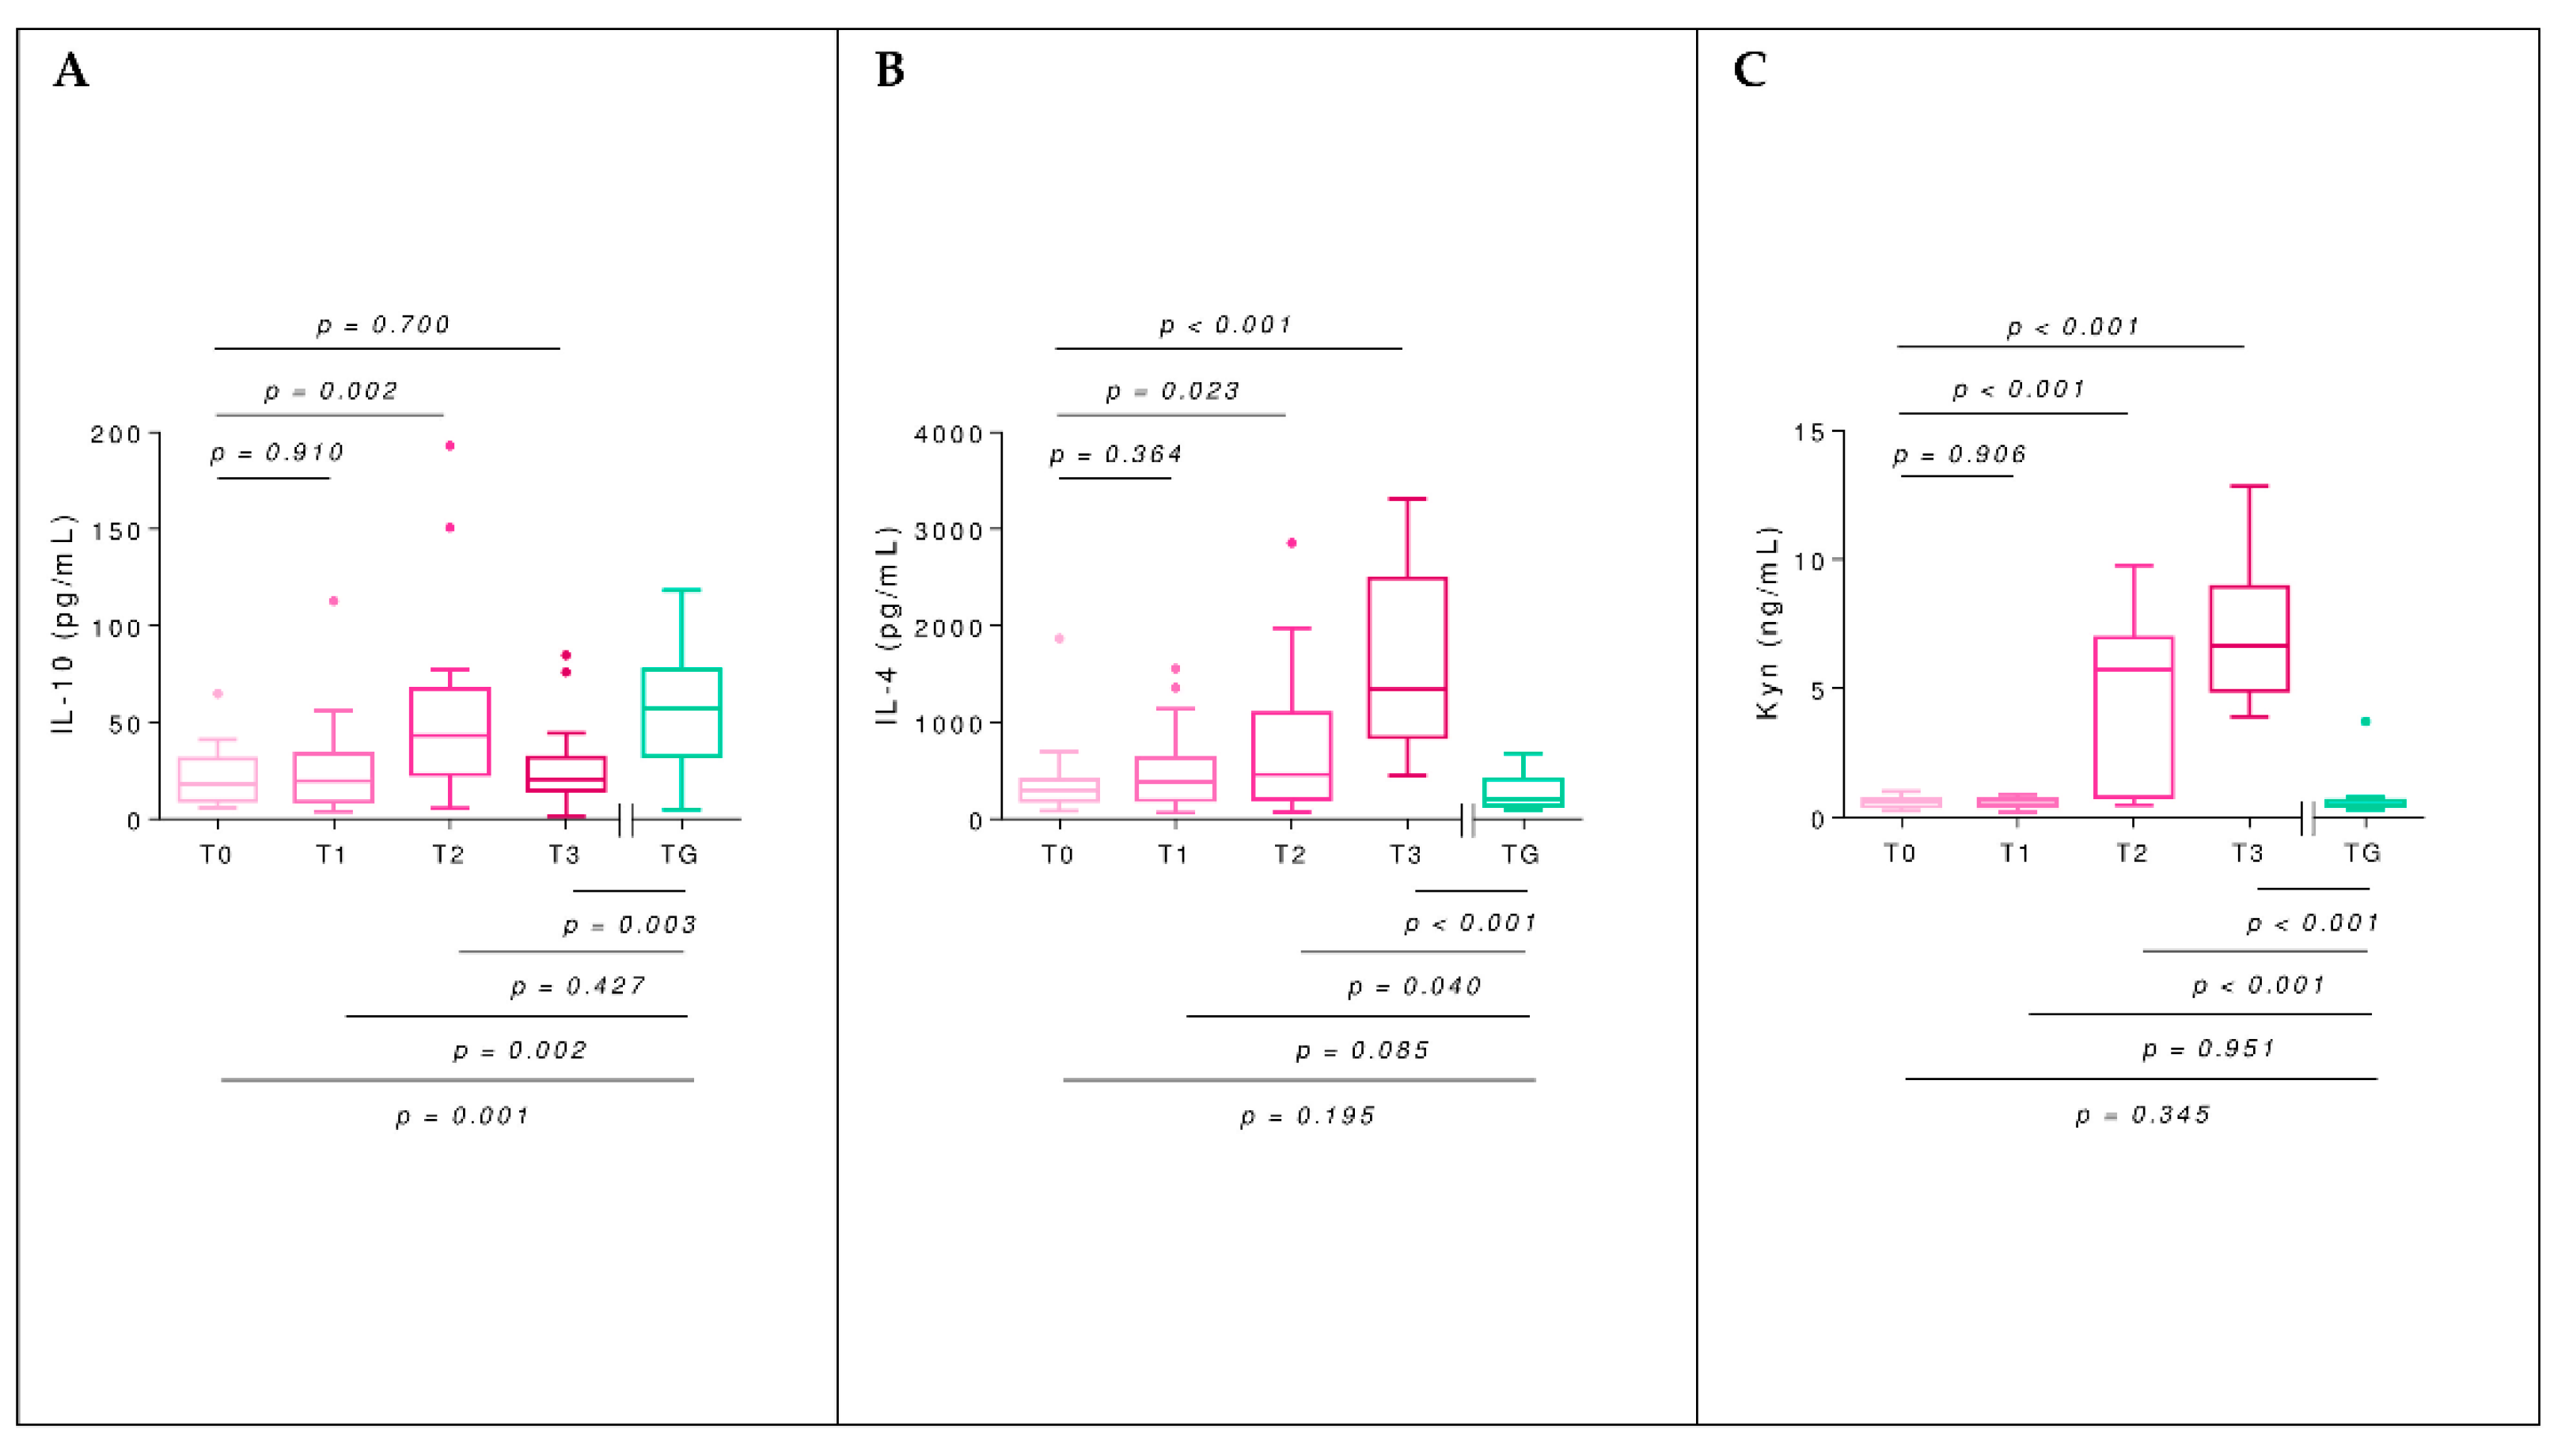
2.5. Interleukins
2.6. Kynurenine
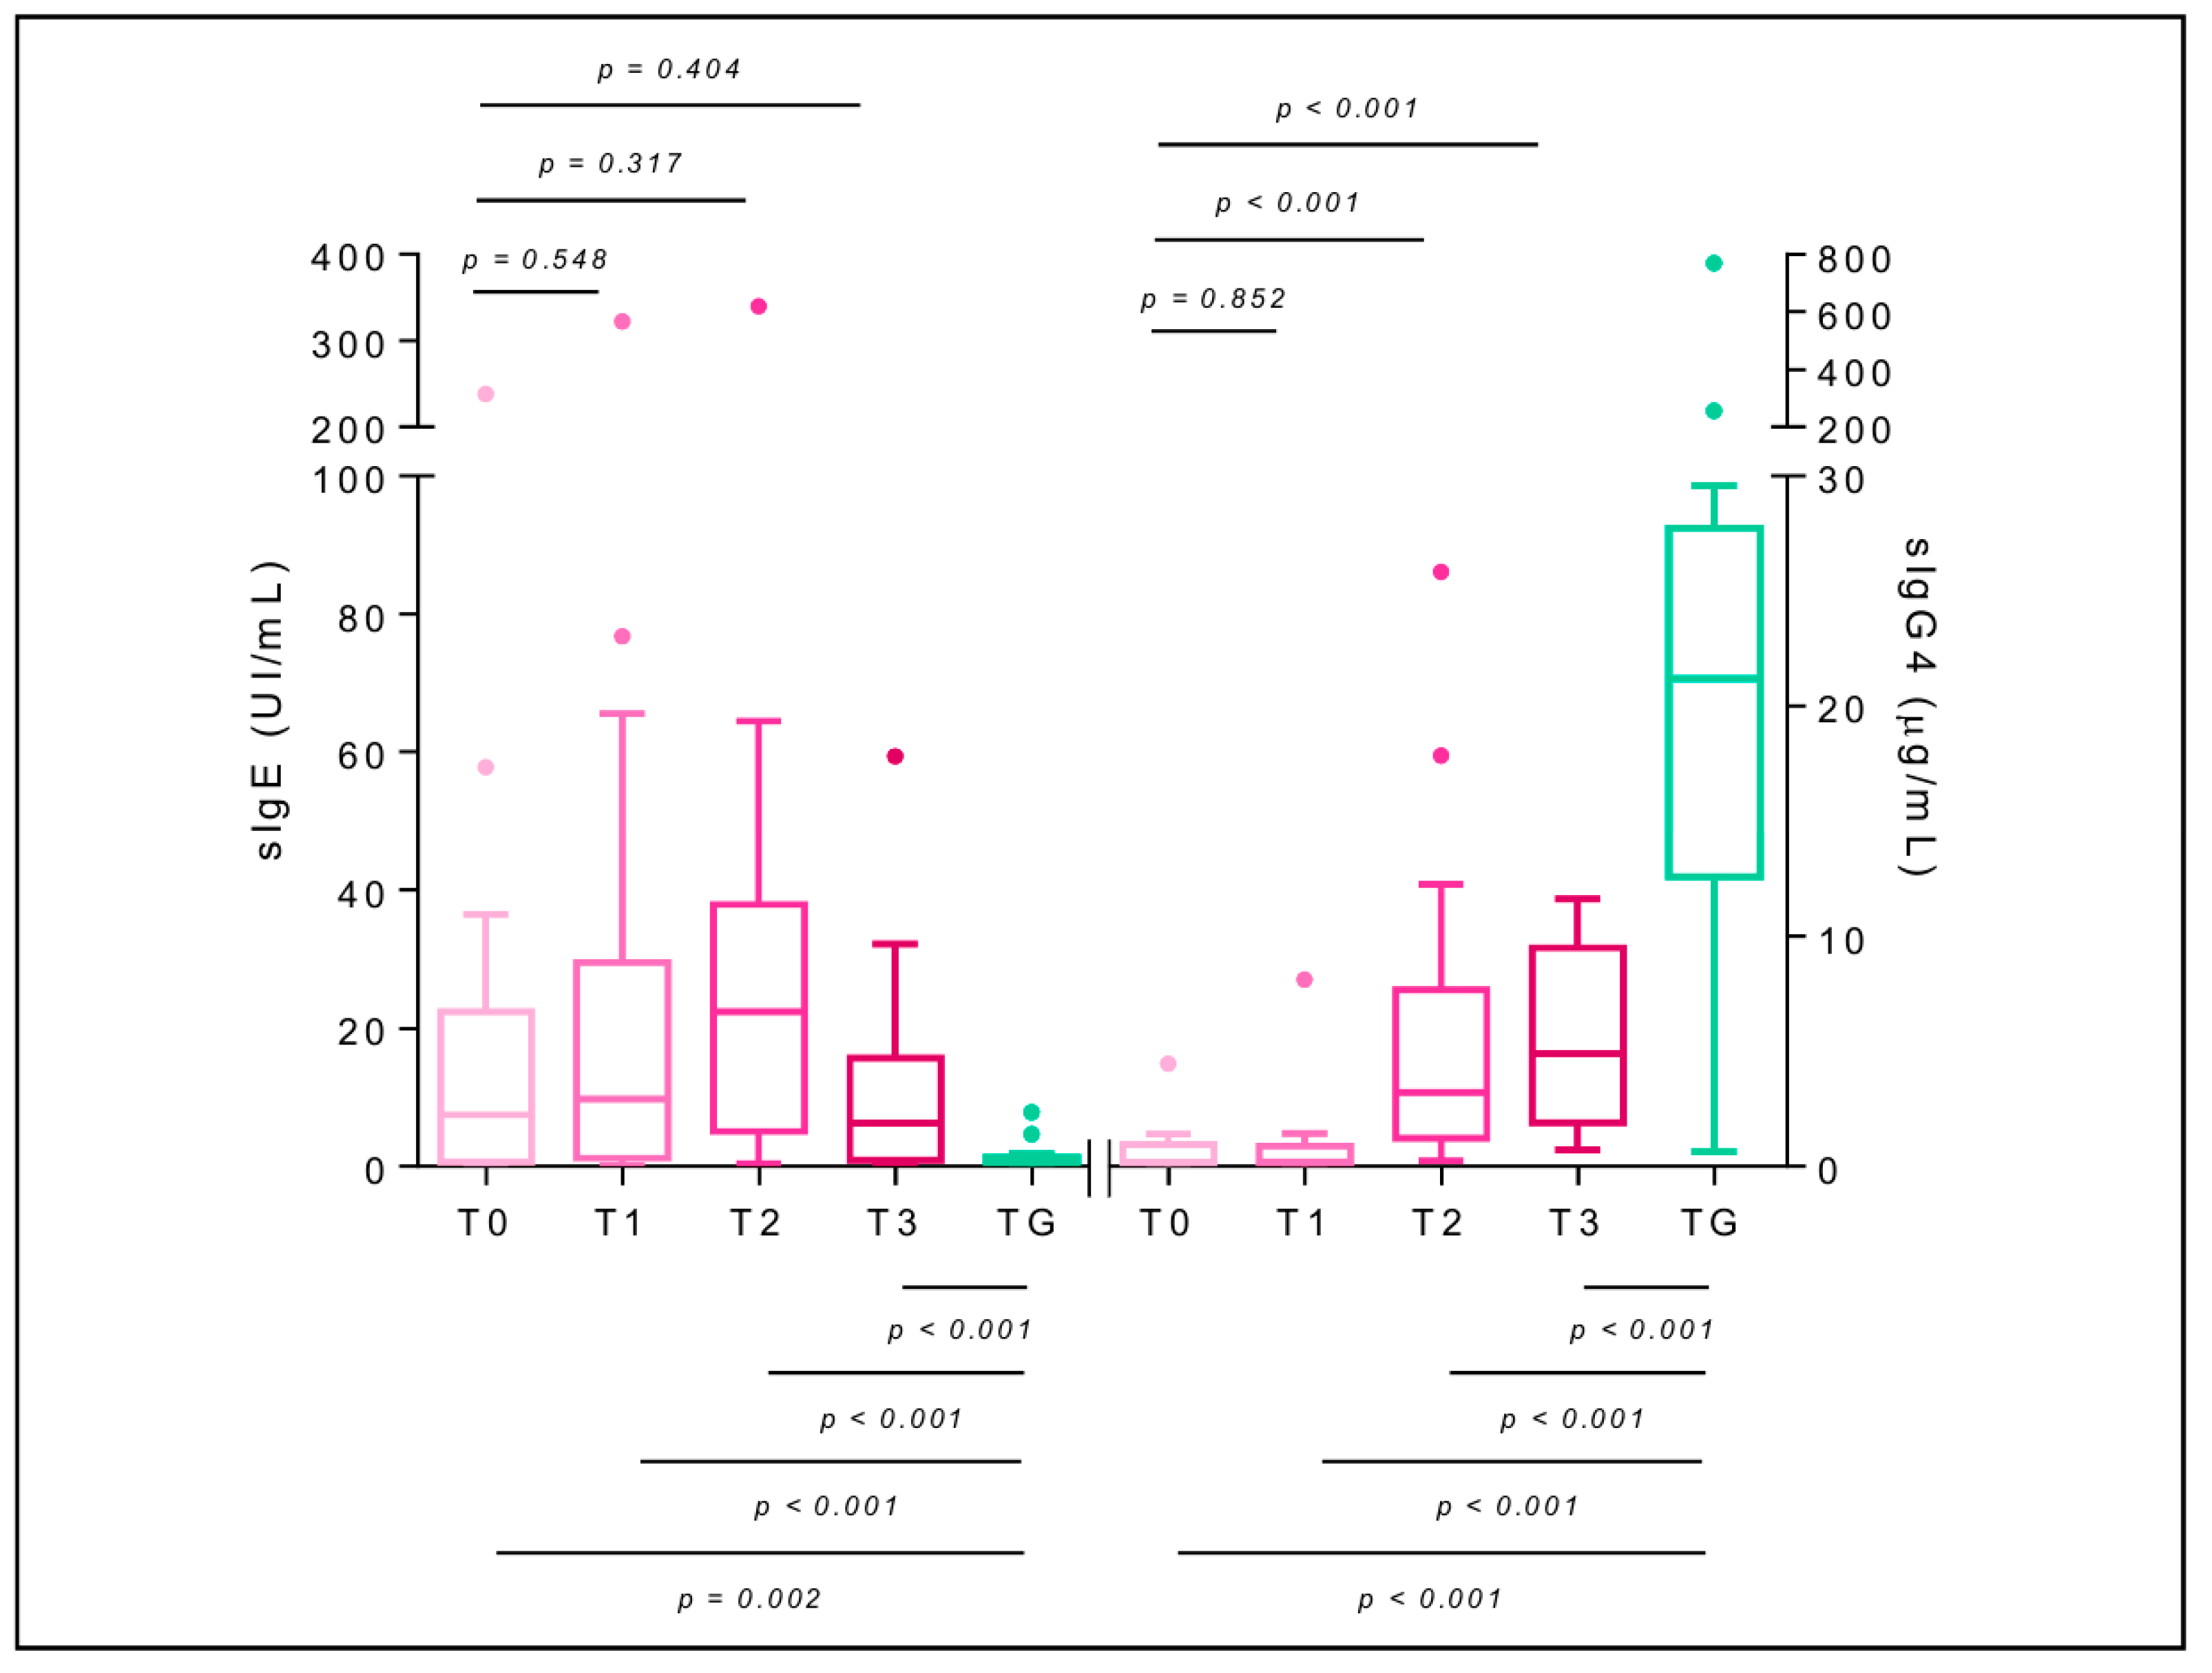
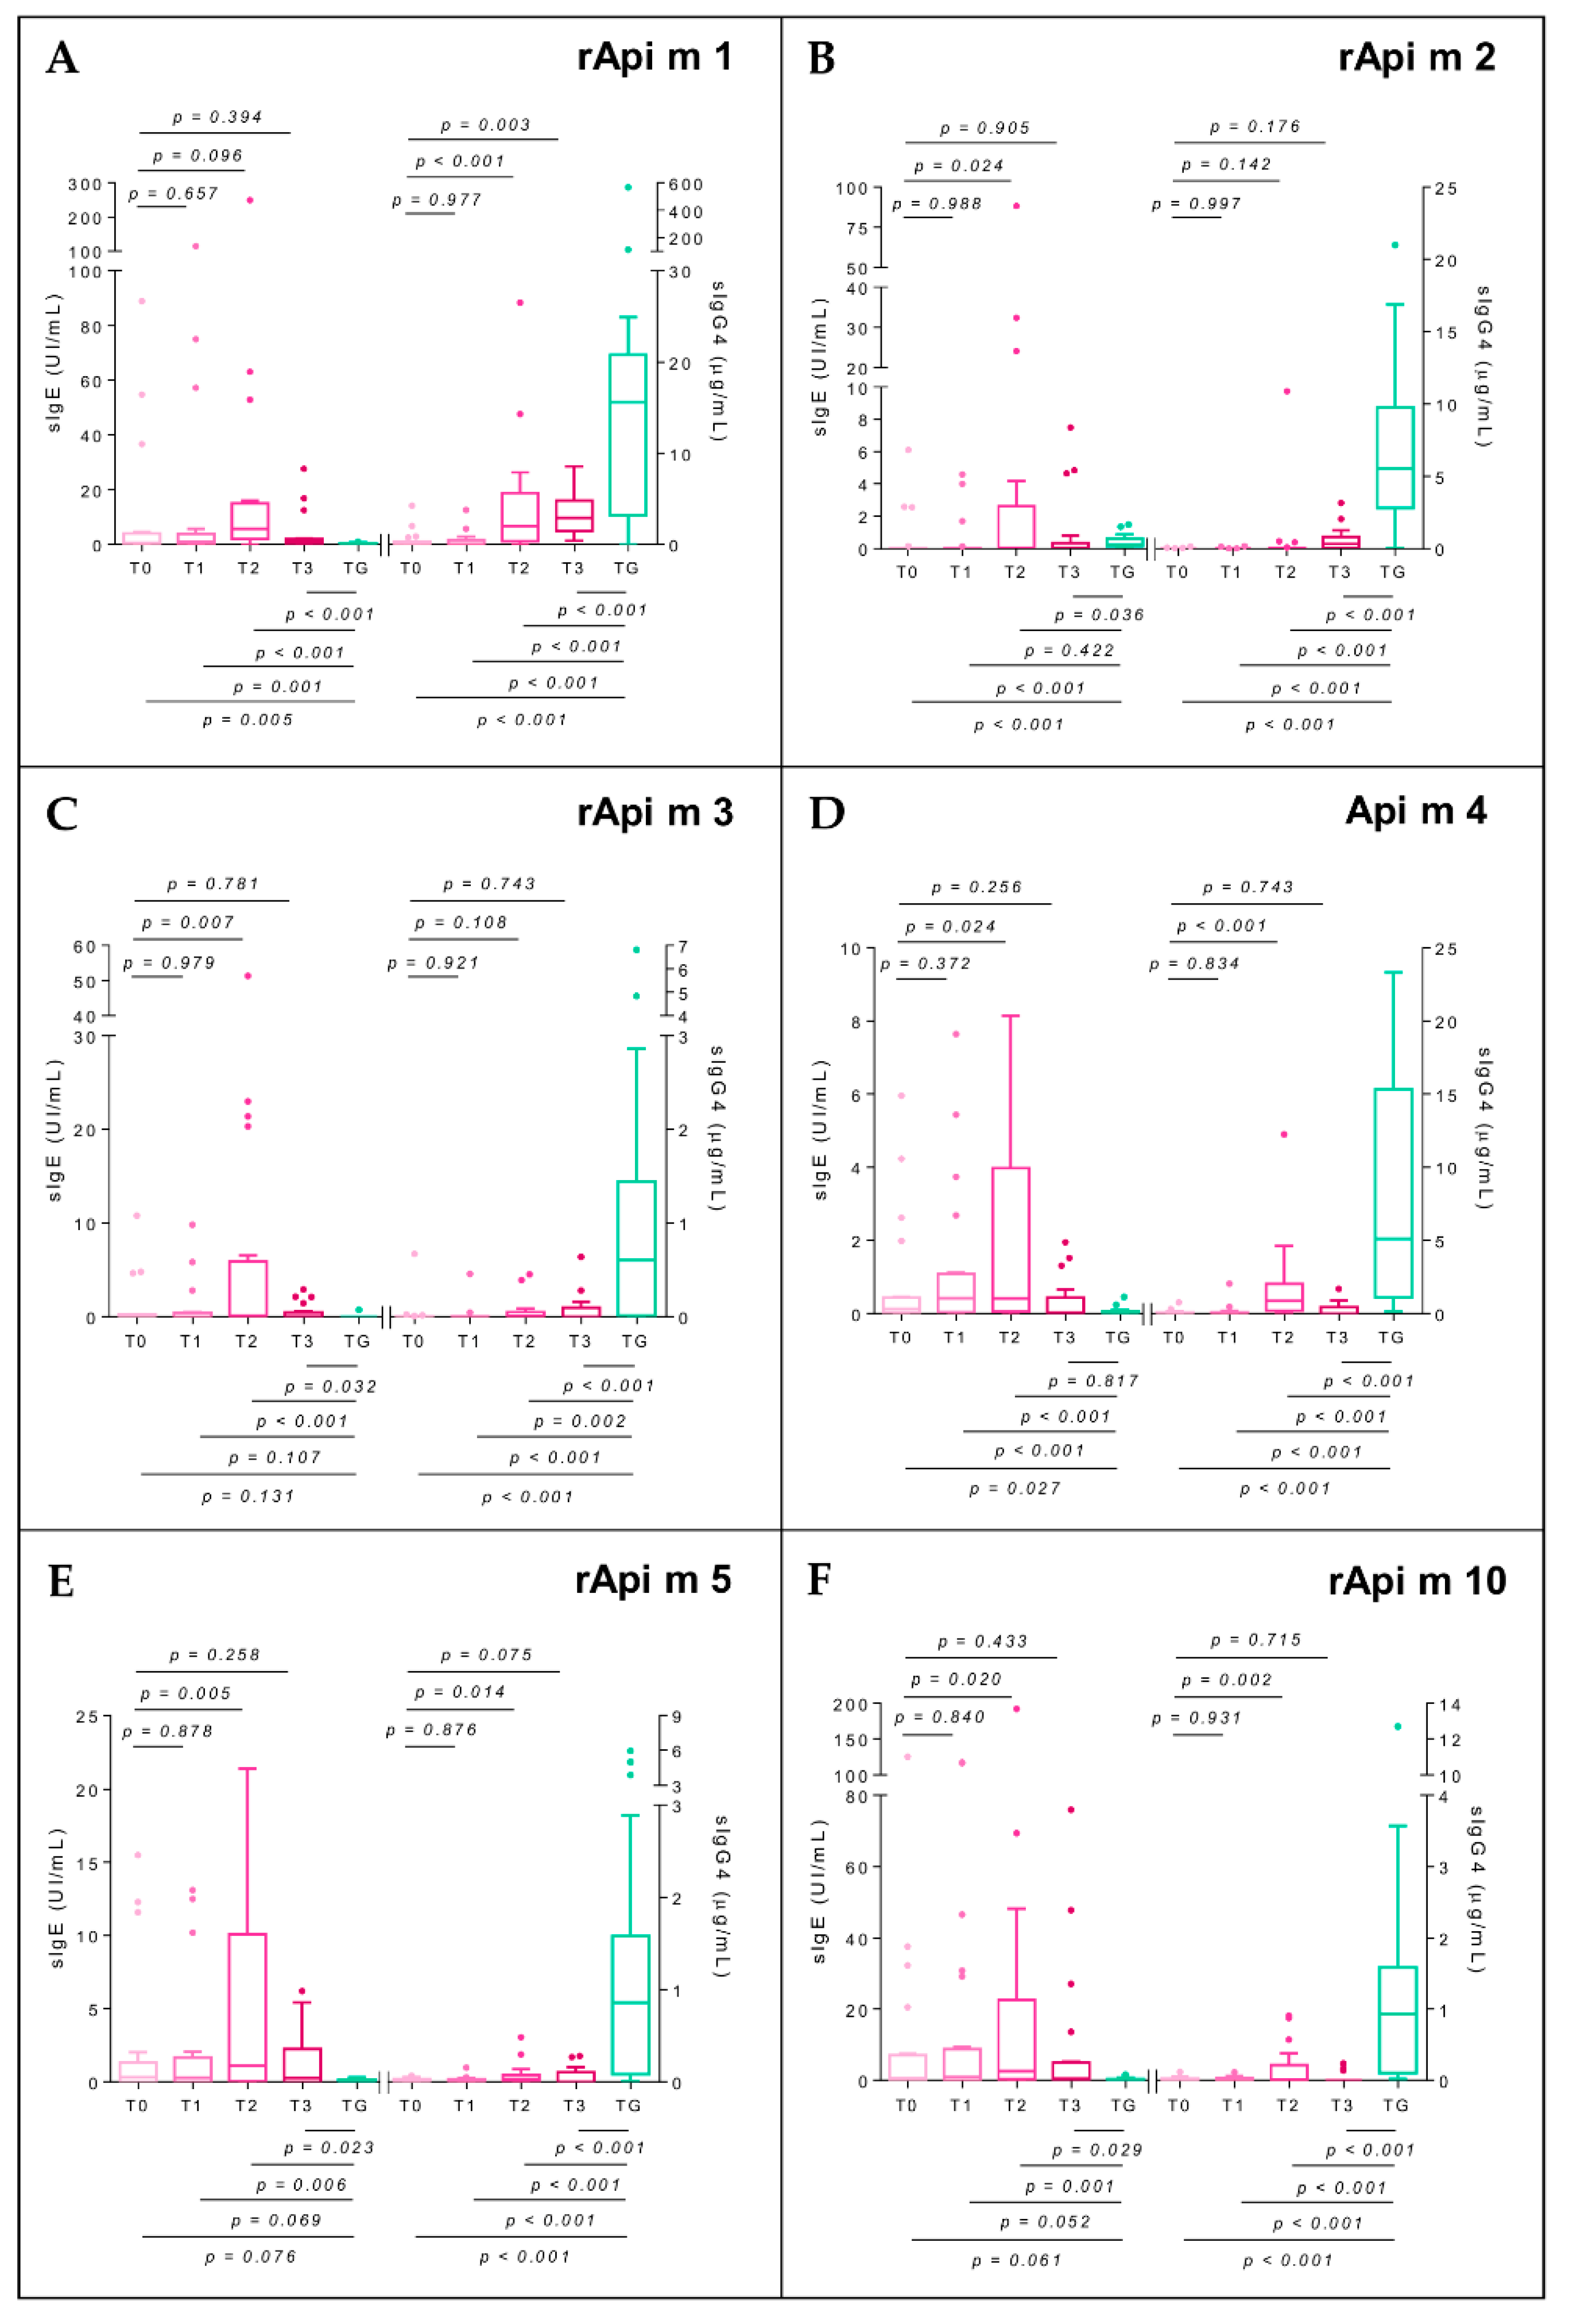
2.7. Specific Immunoglobulin E
2.8. Specific Immunoglobulin G4
3. Discussion
4. Conclusions
5. Materials and Methods
5.1. Study Design
5.2. Demographic and Clinical Features
5.3. Biological Samples
5.4. Immunotherapy
5.5. Evaluation of BVIT Safety
5.6. Sting Challenge
5.7. Serum sIgE and sIgG4 Level to Apis Mellifera Venom and Its Molecular Components
5.8. Basophil Activation Test
5.9. T-Cell Phenotype
5.10. IL-4 and IL-10 Cytokines and Kynurenine Quantitation
5.11. Statistical Analysis
Supplementary Materials
Author Contributions
Funding
Institutional Review Board Statement
Informed Consent Statement
Data Availability Statement
Conflicts of Interest
References
- Sturm, G.J.; Varga, E.M.; Roberts, G.; Mosbech, H.; Bilò, M.B.; Akdis, C.A.; Antolín-Amérigo, D.; Cichocka-Jarosz, E.; Gawlik, R.; Jakob, T.; et al. EAACI guidelines on allergen immunotherapy: Hymenoptera venom allergy. Allergy 2018, 73, 744–764. [Google Scholar] [CrossRef] [PubMed] [Green Version]
- Varga, E.M.; Kausar, F.; Aberer, W.; Zach, M.; Eber, E.; Durham, S.R.; Shamji, M.H. Tolerant beekeepers display venom-specific functional IgG4 antibodies in the absence of specific IgE. J. Allergy Clin. Immunol. 2013, 131, 1419–1421. [Google Scholar] [CrossRef] [PubMed]
- Ruiz-Leon, B.; Navas, A.; Serrano, P.; Espinazo, M.; Guler, I.; Alonso, C.; Jurado, A.; Moreno-Aguilar, C. Helios negative Regulatory T-cells as a key factor of immune tolerance in non-allergic beekeepers. J. Investig. Allergol. Clin. Immunol. 2021, 32, 23063581. [Google Scholar] [CrossRef] [PubMed]
- Kemeny, D.M.; Lessof, M.H.; Patel, S.; Youlten, L.J.; Williams, A.; Lambourn, E. IgG and IgE antibodies after immunotherapy with bee and wasp venom. Int. Arch. Allergy Appl. Immunol. 1989, 88, 247–249. [Google Scholar] [CrossRef]
- Ozdemir, C.; Kucuksezer, U.C.; Akdis, M.; Akdis, C.A. Mechanisms of immunotherapy to wasp and bee venom. Clin. Exp. Allergy 2011, 41, 1226–1234. [Google Scholar] [CrossRef]
- Thornton, A.M.; Shevach, E.M. Helios: Still behind the clouds. Immunology 2019, 158, 161–170. [Google Scholar] [CrossRef] [Green Version]
- Thornton, A.M.; Lu, J.; Korty, P.E.; Kim, Y.C.; Martens, C.; Sun, P.D.; Shevach, E.M. Helios+ and Helios− Treg subpopulations are phenotypically and functionally distinct and express dissimilar TCR repertoires. Eur. J. Immunol. 2019, 49, 398–412. [Google Scholar] [CrossRef]
- Noval Rivas, M.; Chatila, T.A. Regulatory T cells in allergic diseases. J. Allergy Clin. Immunol. 2016, 138, 639–652. [Google Scholar] [CrossRef] [Green Version]
- Boonpiyathad, T.; Sözener, Z.C.; Akdis, M.; Akdis, C.A. The role of Treg cell subsets in allergic disease. Asian. Pac. J. Allergy Immunol. 2020, 38, 139–149. [Google Scholar] [CrossRef]
- Lan, F.; Zhang, N.; Bachert, C.; Zhang, L. Stability of regulatory T cells in T helper 2-biased allergic airway diseases. Allergy 2020, 75, 1918–1926. [Google Scholar] [CrossRef] [Green Version]
- Syed, A.; Garcia, M.A.; Lyu, S.C.; Bucayu, R.; Kohli, A.; Ishida, S.; Berglund, J.P.; Tsai, M.; Maecker, H.; O’Riordan, G.; et al. Peanut oral immunotherapy results in increased antigen-induced regulatory T-cell function and hypomethylation of forkhead box protein 3 (FOXP3). J. Allergy Clin. Immunol. 2014, 133, 500–510. [Google Scholar] [CrossRef] [PubMed] [Green Version]
- Boonpiyathad, T.; Sokolowska, M.; Morita, H.; Rückert, B.; Kast, J.I.; Wawrzyniak, M.; Sangasapaviliya, A.; Pradubpongsa, P.; Fuengthong, R.; Thantiworasit, P.; et al. Der p 1-specific regulatory T-cell response during house dust mite allergen immunotherapy. Allergy 2019, 74, 976–985. [Google Scholar] [CrossRef] [PubMed]
- Urra, J.M.; Cabrera, C.M.; Alfaya, T.; Feo-Brito, F. Agreement of skin test with IL-4 production and CD40L expression by T cells upon immunotherapy of subjects with systemic reactions to Hymenoptera stings. Mol. Immunol. 2016, 70, 134–139. [Google Scholar] [CrossRef] [PubMed]
- Riccio, A.M.; Saverino, D.; Pesce, G.; Rogkakou, A.; Severino, M.; Bonadonna, P.; Ridolo, E.; Mauro, M.; Canonica, G.W.; Bagnasco, M.; et al. Effects of different up-dosing regimens for hymenoptera venom immunotherapy on serum CTLA-4 and IL-10. PLoS ONE 2012, 7, e37980. [Google Scholar] [CrossRef] [PubMed]
- Urra, J.M.; Carrasco, P.; Feo-Brito, F.; De La Roca, F.; Guerra, F.; Cabrera, C.M. Immunotherapy reduces CD40L expression and modifies cytokine production in the CD4 cells of pollen allergy patients. J. Investig. Allergol. Clin. Immunol. 2014, 24, 98–105. [Google Scholar] [PubMed]
- Moitra, S.; Datta, A.; Mondal, S.; Hazra, I.; Faruk, S.M.O.; Das, P.K.; Basu, A.K.; Tripathi, S.K.; Chaudhuri, S. Modulation of regulatory T cells by intranasal allergen immunotherapy in an experimental rat model of airway allergy. Int. Immunopharmacol. 2017, 47, 9–19. [Google Scholar] [CrossRef]
- Dioszeghy, V.; Mondoulet, L.; Puteaux, E.; Dhelft, V.; Ligouis, M.; Plaquet, C.; Dupont, C.; Benhamou, P.H. Differences in phenotype, homing properties and suppressive activities of regulatory T cells induced by epicutaneous, oral or sublingual immunotherapy in mice sensitized to peanut. Cell Mol. Immunol. 2017, 14, 770–782. [Google Scholar] [CrossRef] [Green Version]
- Anvari, S.; Watkin, L.; Rajapakshe, K.; Hassan, O.; Schuster, K.; Coarfa, C.; Davis, C.M. Memory and naïve gamma delta regulatory T-cell gene expression in the first 24-weeks of peanut oral immunotherapy. Clin. Immunol. 2021, 230, 108820. [Google Scholar] [CrossRef]
- Wang, S.H.; Zissler, U.M.; Buettner, M.; Heine, S.; Heldner, A.; Kotz, S.; Pechtold, L.; Kau, J.; Plaschke, M.; Ullmann, J.T.; et al. An exhausted phenotype of TH 2 cells is primed by allergen exposure, but not reinforced by allergen-specific immunotherapy. Allergy 2021, 76, 2827–2839. [Google Scholar] [CrossRef]
- Kucuksezer, U.C.; Ozdemir, C.; Cevhertas, L.; Ogulur, I.; Akdis, M.; Akdis, C.A. Mechanisms of allergen-specific immunotherapy and allergen tolerance. Allergol. Int. 2020, 69, 549–560. [Google Scholar] [CrossRef]
- Zhao, L.; Zhou, X.; Zhou, X.; Wang, H.; Gu, L.; Ke, Y.; Zhang, M.; Ji, X.; Yang, X. Low expressions of PD-L1 and CTLA-4 by induced CD4+CD25+ Foxp3+ Tregs in patients with SLE and their correlation with the disease activity. Cytokine 2020, 133, 155119. [Google Scholar] [CrossRef] [PubMed]
- Bussmann, C.; Xia, J.; Allam, J.P.; Maintz, L.; Bieber, T.; Novak, N. Early markers for protective mechanisms during rush venom immunotherapy. Allergy 2010, 65, 1558–1565. [Google Scholar] [CrossRef] [PubMed]
- Francis, J.N.; James, L.K.; Paraskevopoulos, G.; Wong, C.; Calderon, M.A.; Durham, S.R.; Till, S.J. Grass pollen immunotherapy: IL-10 induction and suppression of late responses precedes IgG4 inhibitory antibody activity. J. Allergy Clin. Immunol. 2008, 121, 1120–1125.e2. [Google Scholar] [CrossRef] [PubMed]
- Boonpiyathad, T.; Satitsuksanoa, P.; Akdis, M.; Akdis, C.A. Il-10 producing T and B cells in allergy. Semin. Immunol. 2019, 44, 101326. [Google Scholar] [CrossRef]
- Golebski, K.; Layhadi, J.A.; Sahiner, U.; Steveling-Klein, E.H.; Lenormand, M.M.; Li, R.C.Y.; Bal, S.M.; Heesters, B.A.; Vilà-Nadal, G.; Hunewald, O.; et al. Induction of IL-10-producing type 2 innate lymphoid cells by allergen immunotherapy is associated with clinical response. Immunity 2021, 54, 291–307.e7. [Google Scholar] [CrossRef]
- Pallotta, M.T.; Rossini, S.; Suvieri, C.; Coletti, A.; Orabona, C.; Macchiarulo, A.; Volpi, C.; Grohmann, U. Indoleamine 2,3-dioxygenase 1 (IDO1): An up-to-date overview of an eclectic immunoregulatory enzyme. FEBS J. 2021. [Google Scholar] [CrossRef]
- Huang, Y.S.; Ogbechi, J.; Clanchy, F.I.; Williams, R.O.; Stone, T.W. IDO and Kynurenine Metabolites in Peripheral and CNS Disorders. Front. Immunol. 2020, 11, 388. [Google Scholar] [CrossRef] [Green Version]
- Tanaka, M.; Tóth, F.; Polyák, H.; Szabó, Á.; Mándi, Y.; Vécsei, L. Immune Influencers in Action: Metabolites and Enzymes of the Tryptophan-Kynurenine Metabolic Pathway. Biomedicines 2021, 9, 734. [Google Scholar] [CrossRef]
- Mamessier, E.; Birnbaum, J.; Dupuy, P.; Vervloet, D.; Magnan, A. Ultra-rush venom immunotherapy induces differential T cell activation and regulatory patterns according to the severity of allergy. Clin. Exp. Allergy 2006, 36, 704–713. [Google Scholar] [CrossRef]
- Schuerwegh, A.J.; De Clerck, L.S.; Bridts, C.H.; Stevens, W.J. Wasp venom immunotherapy induces a shift from IL-4-producing towards interferon-gamma-producing CD4+ and CD8+ T lymphocytes. Clin. Exp. Allergy 2001, 31, 740–746. [Google Scholar] [CrossRef]
- Chaker, A.M.; Shamji, M.H.; Dumitru, F.A.; Calderon, M.A.; Scadding, G.W.; Makatsori, M.; Jones, I.; He, Q.A.; Subramanian, K.K.; Arm, J.P.; et al. Short-term subcutaneous grass pollen immunotherapy under the umbrella of anti-IL-4: A randomized controlled trial. J. Allergy Clin. Immunol. 2016, 137, 452–461.e9. [Google Scholar] [CrossRef] [PubMed] [Green Version]
- Zielen, S.; Gabrielpillai, J.; Herrmann, E.; Schulze, J.; Schubert, R.; Rosewich, M. Long-term effect of monophosphoryl lipid A adjuvanted specific immunotherapy in patients with grass pollen allergy. Immunotherapy 2018, 10, 529–536. [Google Scholar] [CrossRef] [PubMed]
- Tuzlak, S.; Dejean, A.S.; Iannacone, M.; Quintana, F.J.; Waisman, A.; Ginhoux, F.; Korn, T.; Becher, B. Repositioning TH cell polarization from single cytokines to complex help. Nat. Immunol. 2021, 22, 1210–1217. [Google Scholar] [CrossRef]
- Sahiner, U.M.; Durham, S.R. Hymenoptera Venom Allergy: How Does Venom Immunotherapy Prevent Anaphylaxis from Bee and Wasp Stings? Front. Immunol. 2019, 10, 1959. [Google Scholar] [CrossRef] [PubMed]
- Demšar Luzar, A.; Korošec, P.; Košnik, M.; Zidarn, M.; Rijavec, M. Hymenoptera Venom Immunotherapy: Immune Mechanisms of Induced Protection and Tolerance. Cells 2021, 10, 1575. [Google Scholar] [CrossRef] [PubMed]
- Abbas, A.K.; Lichtman, A.H.; Pillai, S. B Cell Activation and Antibody Production in Cellular and Molecular Immunology, 10th ed.; Jeremy, B., Ed.; Elsevier Health Sciences: Philadelphia, PA, USA, 2022; pp. 273–276. [Google Scholar]
- Rodríguez Trabado, A.; Cámara Hijón, C.; Ramos Cantariño, A.; Romero-Chala, S.; García-Trujillo, J.A.; Fernández Pereira, L.M. Short-, Intermediate-, and Long-Term Changes in Basophil Reactivity Induced by Venom Immunotherapy. Allergy Asthma Immunol. Res. 2016, 8, 412–420. [Google Scholar] [CrossRef] [PubMed] [Green Version]
- Peternelj, A.; Silar, M.; Erzen, R.; Kosnik, M.; Korosec, P. Basophil sensitivity in patients not responding to venom immunotherapy. Int. Arch. Allergy Immunol. 2008, 146, 248–254. [Google Scholar] [CrossRef]
- Eržen, R.; Košnik, M.; Silar, M.; Korošec, P. Basophil response and the induction of a tolerance in venom immunotherapy: A long-term sting challenge study. Allergy 2012, 67, 822–830. [Google Scholar] [CrossRef]
- Behrends, J.; Schwager, C.; Hein, M.; Scholzen, T.; Kull, S.; Jappe, U. Innovative robust basophil activation test using a novel gating strategy reliably diagnosing allergy with full automation. Allergy 2021, 76, 3776–3788. [Google Scholar] [CrossRef]
- Alvarez-Twose, I.; González de Olano, D.; Sánchez-Muñoz, L.; Matito, A.; Esteban-López, M.I.; Vega, A.; Mateo, M.B.; Alonso Díaz de Durana, M.D.; de la Hoz, B.; Del Pozo Gil, M.D.; et al. Clinical, biological, and molecular characteristics of clonal mast cell disorders presenting with systemic mast cell activation symptoms. J. Allergy Clin. Immunol. 2010, 125, 1269–1278.e2. [Google Scholar] [CrossRef]
- Muraro, A.; Fernandez-Rivas, M.; Beyer, K.; Cardona, V.; Clark, A.; Eller, E.; Hourihane, J.O.B.; Jutel, M.; Sheikh, A.; Agache, I.; et al. The urgent need for a harmonized severity scoring system for acute allergic reactions. Allergy 2018, 73, 1792–1800. [Google Scholar] [CrossRef] [PubMed] [Green Version]
- Moreno, C.; Barasona, M.J.; Serrano, P.; Justicia, J.L.; Ruz, J.M.; Guerra, F. Alternating Polistes-Vespula venom immunotherapy: A therapeutic strategy to resolve a diagnostic deficiency. J. Investig. Allergol. Clin. Immunol. 2011, 21, 28–33. [Google Scholar] [PubMed]
- Axen, R.; Dreven, H. A new laboratory diagnostic system applied to allergy testing. Allergy Proc. 1988, 9, 3–5. [Google Scholar]
- R Core Team. R: A Language and Environment for Statistical Computing; R Foundation for Statistical Computing: Vienna, Austria, 2019. [Google Scholar]
- Pinheiro, J.; Bates, D.; DebRoy, S.; Sarkar, D.; R Core Team. nlme: Linear and Nonlinear Mixed Effects Models; R Package Version 3.1-142; R Foundation for Statistical Computing: Vienna, Austria, 2019. [Google Scholar]


| Allergic Patients | ||||||||||||
|---|---|---|---|---|---|---|---|---|---|---|---|---|
| Demographics | Diagnostic | Treatment | ||||||||||
| n | Sex | Age | Employment | Atopy | AX Grade | REMA Score | ID Test | sIgE Apis | sIgG4 Apis | BVIT Dose | SR to BVIT | SCT |
| 1 | F | 52 | Beekeeper | No | 3 | <2 | 0.01 | 36.5 | 0.29 | 200 | - | ND |
| 2 | M | 65 | Builder | No | 3 | <2 | 0.001 | 11.7 | 4.48 | 100 | - | Neg |
| 3 | M | 49 | Truck Driver | No | 2 | <2 | 0.01 | 6.96 | 0.09 | 100 | - | Neg |
| 4 | M | 43 | Harvester | Yes | 3 | >2 | 0.01 | 0.29 | 0.02 | 100 | - | Neg |
| 5 | M | 28 | Beekeeper | No | 3 | <2 | 0.001 | 6.75 | 0.16 | 200 | - | Neg |
| 6 | F | 25 | Beekeeper | No | 2 | <2 | 0.001 | 3.48 | 0.07 | 200 | 1 (1) | Neg |
| 7 | M | 46 | Beekeeper | Yes | 3 | <2 | Neg | 7.98 | 0.18 | 300 | - | Neg |
| 8 | F | 68 | Retired | Yes | 3 | <2 | 0.01 | 0.37 | 0.11 | 100 | - | Neg |
| 9 | F | 41 | Beekeeper | No | 2 | <2 | 0.1 | 0.54 | 0.03 | 100 | - | Neg |
| 10 | M | 30 | Beekeeper | No | 3 | >2 | Neg | 0.24 | 0.00 | 150 | 1 (3) | Neg |
| 11 | M | 18 | Beekeeper | No | 3 | <2 | 0.01 | 238 | 0.90 | 200 | - | Neg |
| 12 | M | 45 | Beekeeper | No | 2 | <2 | 0.01 | 0.22 | 0.002 | 100 | - | Neg |
| 13 | F | 54 | Teacher | Yes | 2 | <2 | 0.1 | 8.4 | 0.5 | 100 | - | Neg |
| 14 | M | 32 | Harvester | Yes | 3 | <2 | 0.01 | 27.1 | 1.31 | 300 | - | Neg |
| 15 | M | 48 | Beekeeper | Yes | 3 | <2 | 0.01 | 16 | 0.19 | 300 | - | Neg |
| 16 | M | 50 | Beekeeper | Yes | 2 | <2 | 0.01 | 24.6 | 0.99 | 300 | - | Neg |
| 17 | M | 51 | Beekeeper | No | 3 | <2 | 0.1 | 1.16 | 1.41 | 200 | - | Neg |
| 18 | M | 52 | Beekeeper | No | 3 | <2 | 0.01 | 5.88 | 0.09 | 300 | - | Neg |
| 19 | M | 53 | Sealer | Yes | 2 | <2 | 0.001 | 57.8 | 0.22 | 100 | - | Neg |
| 20 | M | 54 | Harvester | Yes | 3 | <2 | 0.1 | 8.09 | 1.34 | 300 | - | Neg |
| Tolerant Group | ||||||
|---|---|---|---|---|---|---|
| Demographics | Diagnostic | |||||
| n | Sex | Age | Atopy | Stings per Year | sIgE Apis | sIgG4 Apis |
| 1 | F | 52 | Yes | >200 | 0.21 | 21 |
| 2 | M | 65 | No | >200 | 0.18 | 18.94 |
| 3 | M | 49 | No | >200 | 0.94 | 21.98 |
| 4 | M | 43 | No | 50 | 7.86 | 5.37 |
| 5 | M | 28 | No | >200 | 0.25 | 27.87 |
| 6 | F | 28 | No | >200 | 1.33 | 13.44 |
| 7 | M | 46 | No | >200 | 0.48 | 24.58 |
| 8 | F | 68 | No | 50 | 1.83 | 2.74 |
| 9 | F | 41 | No | >200 | 0.28 | 17.13 |
| 10 | M | 30 | No | >200 | 1.33 | 23.38 |
| 11 | M | 26 | No | >200 | 1.27 | 29.43 |
| 12 | M | 45 | No | >200 | 1.67 | 3.689 |
| 13 | F | 54 | No | >200 | 0.61 | 27.30 |
| 14 | M | 32 | Yes | >200 | 0.61 | 29.58 |
| 15 | M | 48 | No | >200 | 0.24 | 21.38 |
| 16 | M | 50 | Yes | 50 | 0.64 | 15.00 |
| 17 | M | 51 | No | 50 | 4.47 | 0.66 |
| 18 | M | 42 | No | >200 | 1.1 | 768 |
| 19 | M | 56 | No | >200 | 0.73 | 12.3 |
| 20 | M | 57 | No | >200 | 0.07 | 256 |
Publisher’s Note: MDPI stays neutral with regard to jurisdictional claims in published maps and institutional affiliations. |
© 2022 by the authors. Licensee MDPI, Basel, Switzerland. This article is an open access article distributed under the terms and conditions of the Creative Commons Attribution (CC BY) license (https://creativecommons.org/licenses/by/4.0/).
Share and Cite
Navas, A.; Ruiz-Leon, B.; Serrano, P.; Martí, M.; Espinazo, M.L.; Blanco, N.; Molina, J.; Alonso, C.; Jurado, A.; Moreno-Aguilar, C. Natural and Induced Tolerance to Hymenoptera Venom: A Single Mechanism? Toxins 2022, 14, 426. https://doi.org/10.3390/toxins14070426
Navas A, Ruiz-Leon B, Serrano P, Martí M, Espinazo ML, Blanco N, Molina J, Alonso C, Jurado A, Moreno-Aguilar C. Natural and Induced Tolerance to Hymenoptera Venom: A Single Mechanism? Toxins. 2022; 14(7):426. https://doi.org/10.3390/toxins14070426
Chicago/Turabian StyleNavas, Ana, Berta Ruiz-Leon, Pilar Serrano, Manuel Martí, M Luisa Espinazo, Nadine Blanco, Juan Molina, Corona Alonso, Aurora Jurado, and Carmen Moreno-Aguilar. 2022. "Natural and Induced Tolerance to Hymenoptera Venom: A Single Mechanism?" Toxins 14, no. 7: 426. https://doi.org/10.3390/toxins14070426
APA StyleNavas, A., Ruiz-Leon, B., Serrano, P., Martí, M., Espinazo, M. L., Blanco, N., Molina, J., Alonso, C., Jurado, A., & Moreno-Aguilar, C. (2022). Natural and Induced Tolerance to Hymenoptera Venom: A Single Mechanism? Toxins, 14(7), 426. https://doi.org/10.3390/toxins14070426