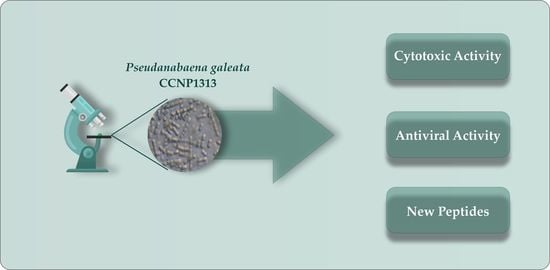
Pseudanabaena galeata CCNP1313—Biological Activity and Peptides Production

 ,
,  , , , , , , ,
Abstract
:
1. Introduction
2. Results
2.1. Flash Chromatography and Peptide Separation
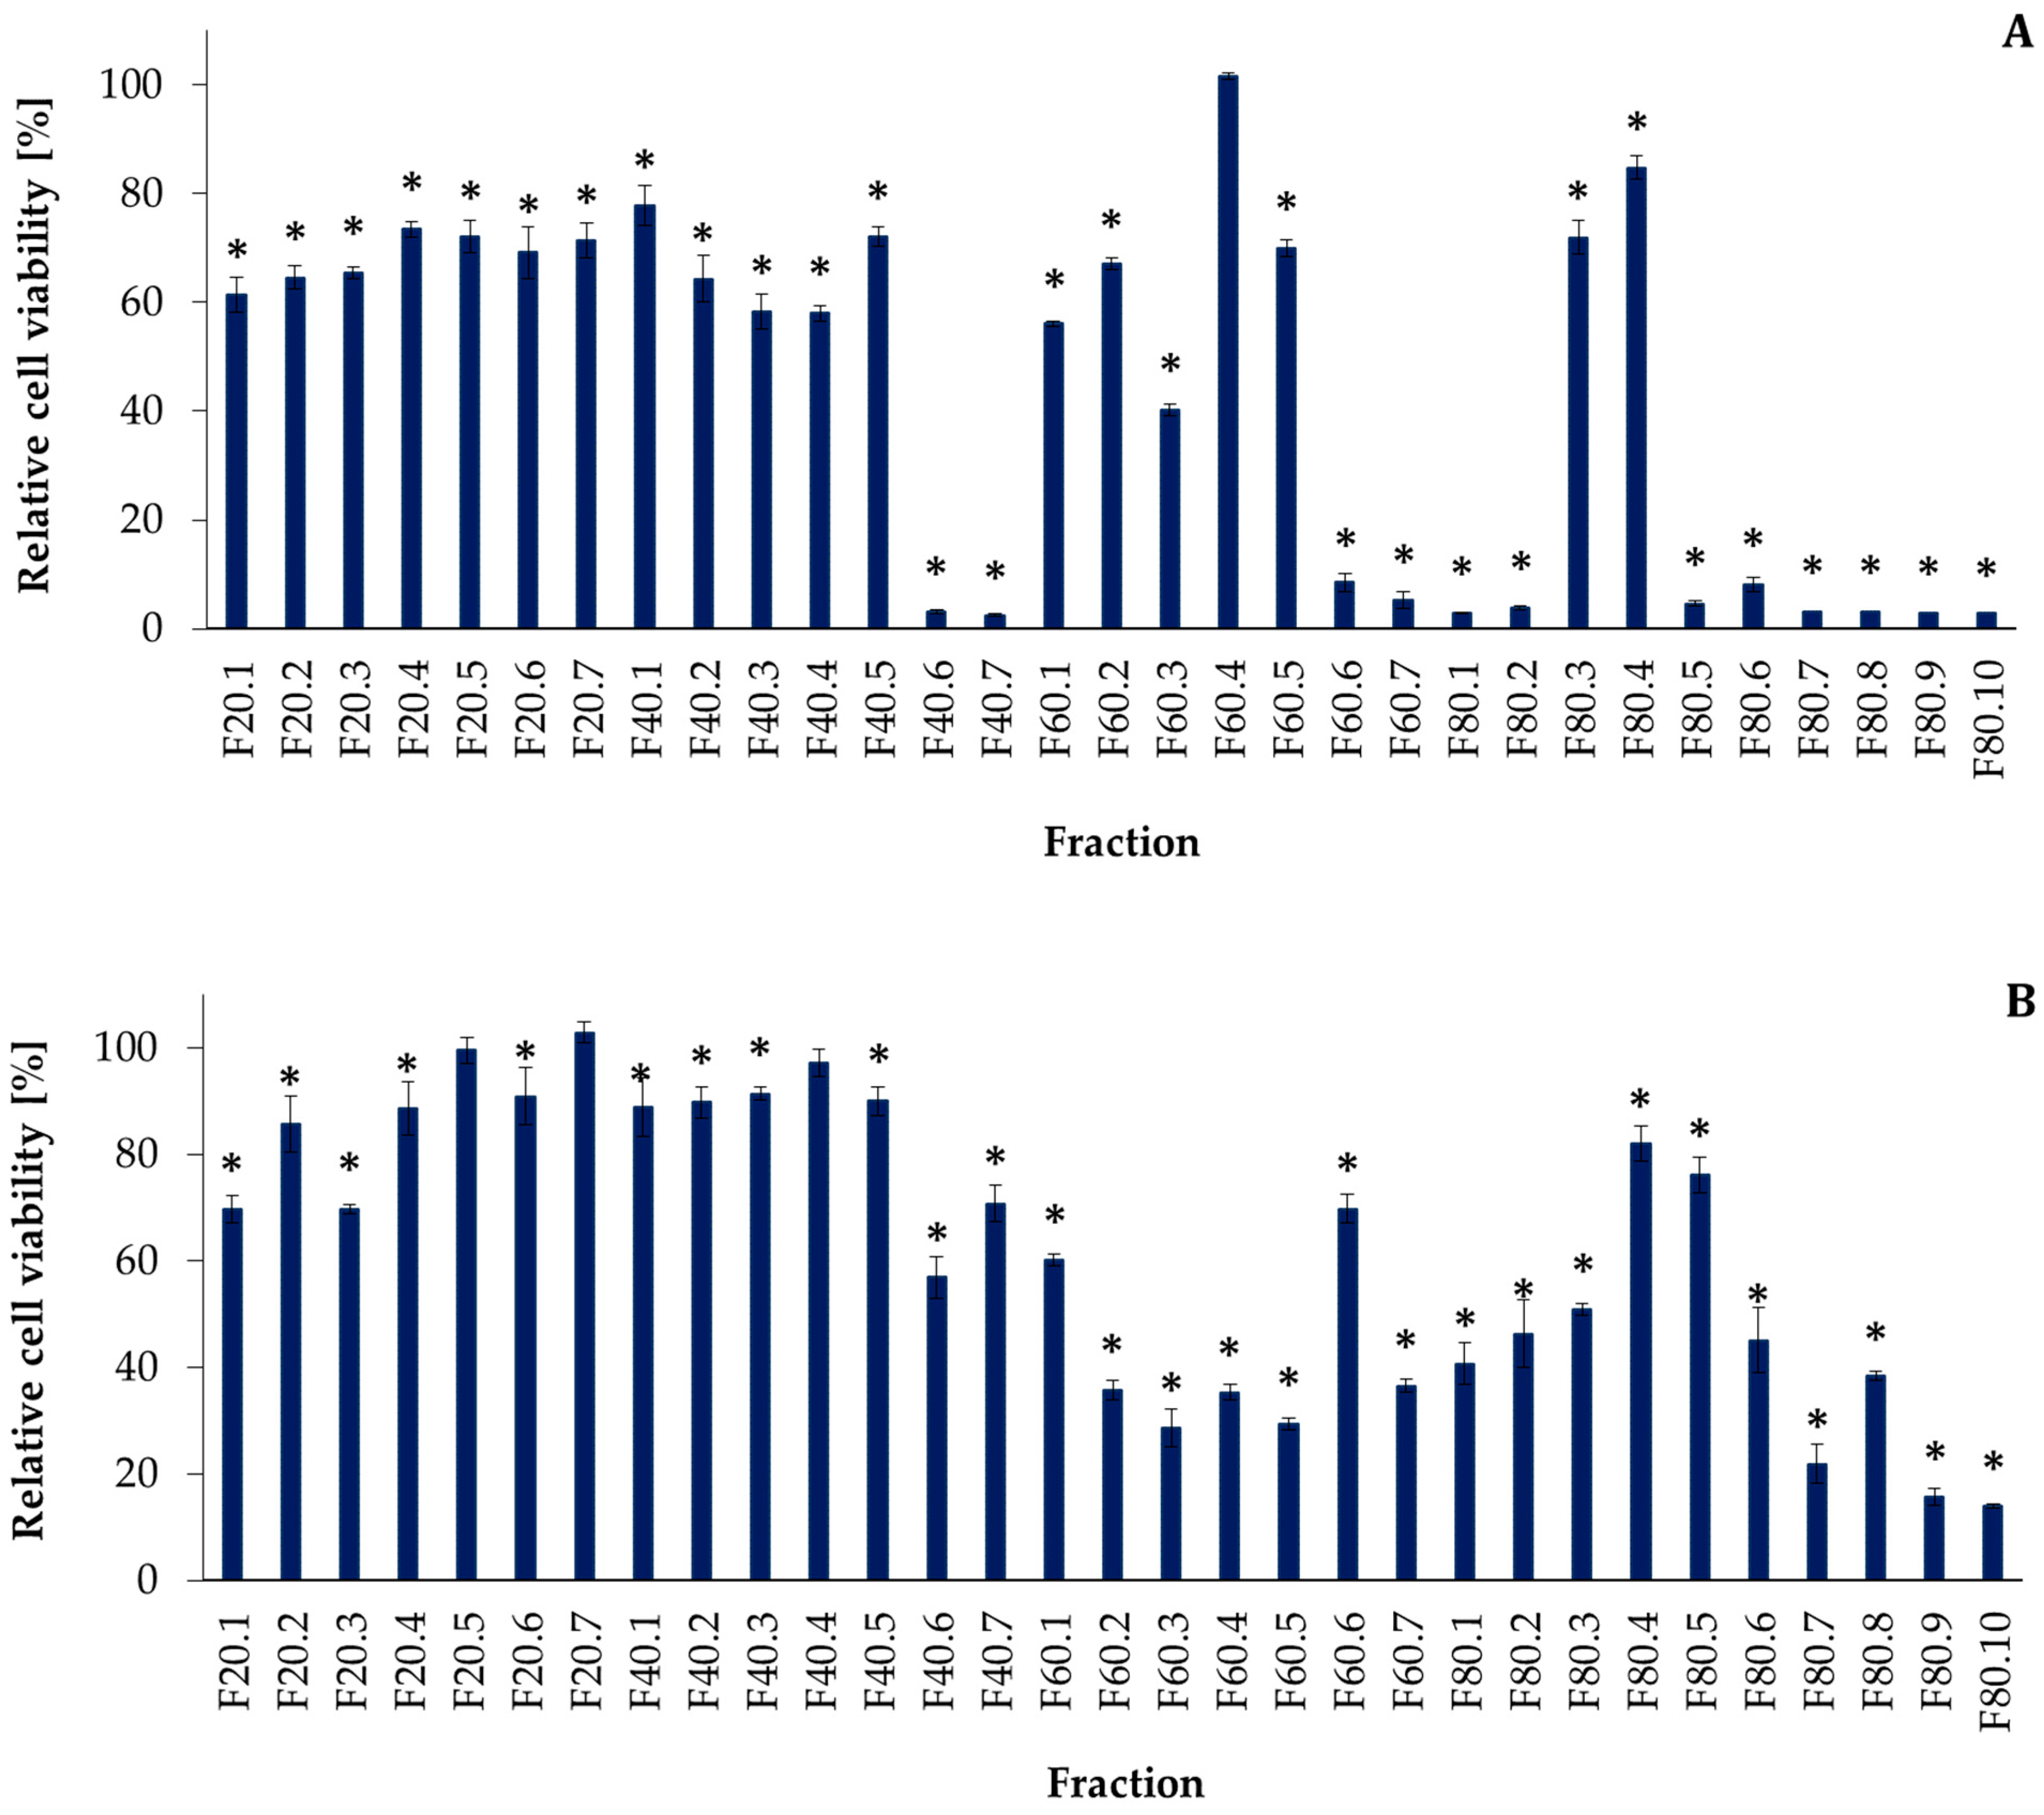
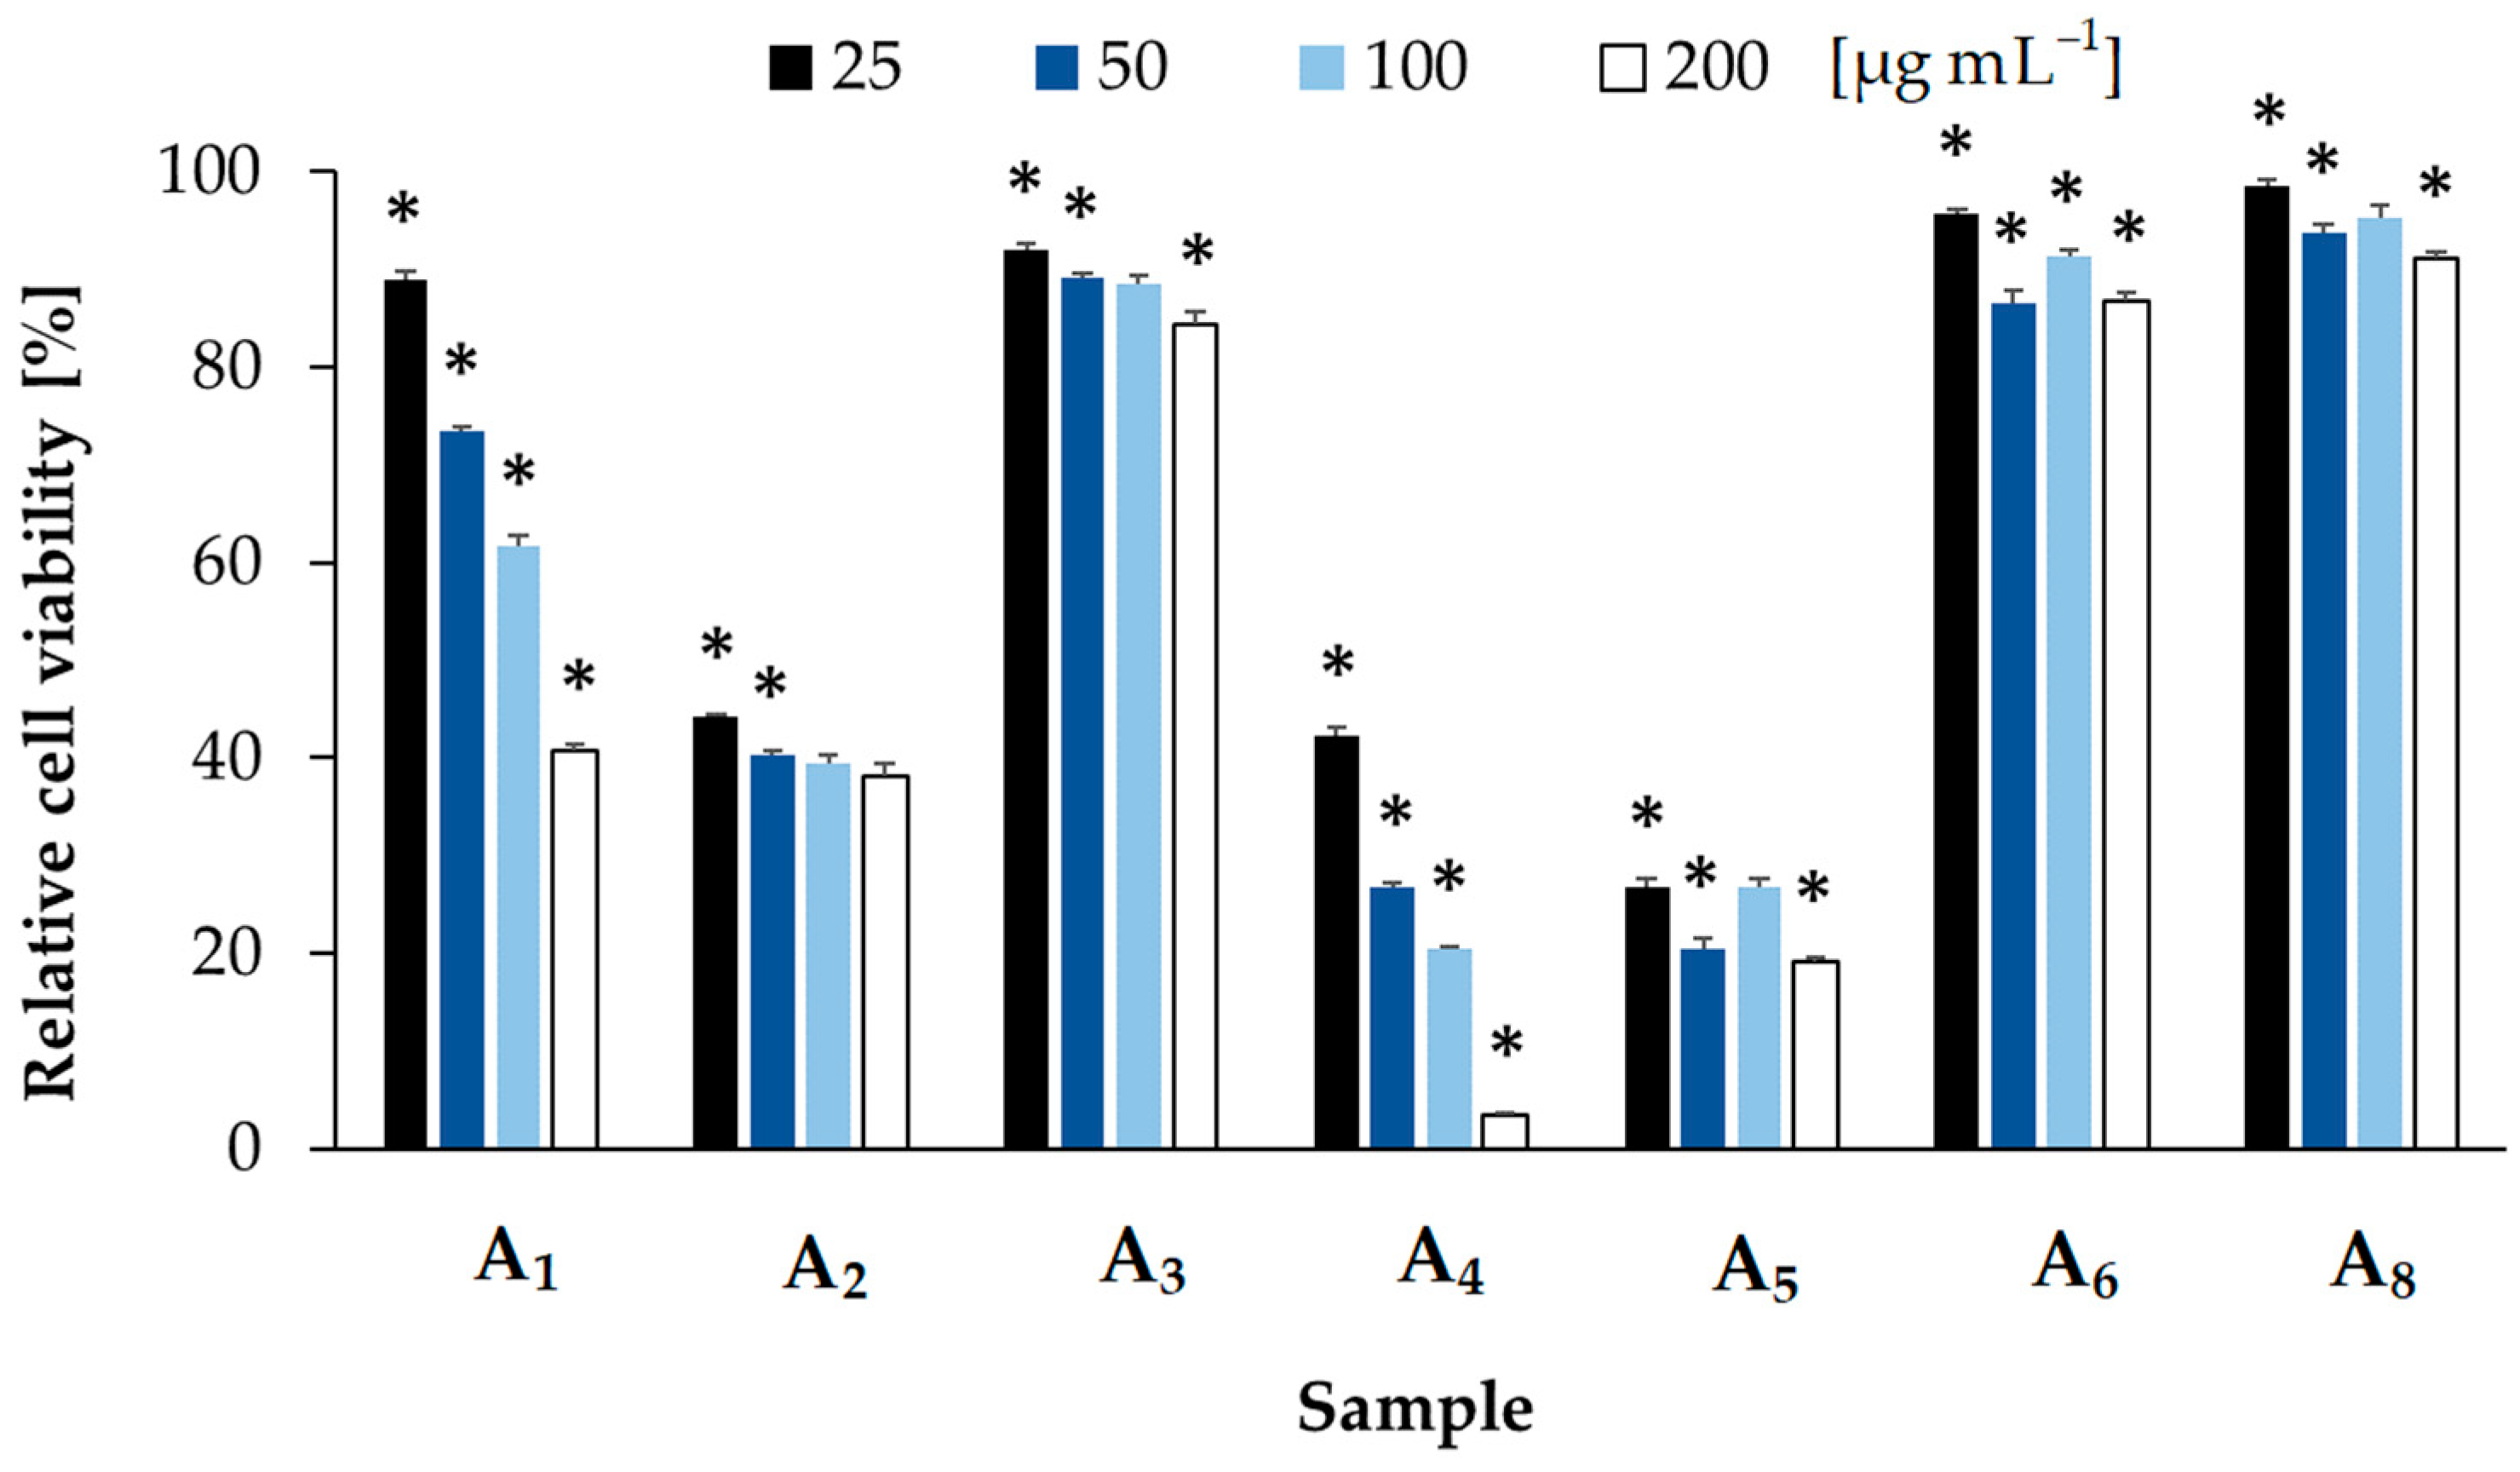
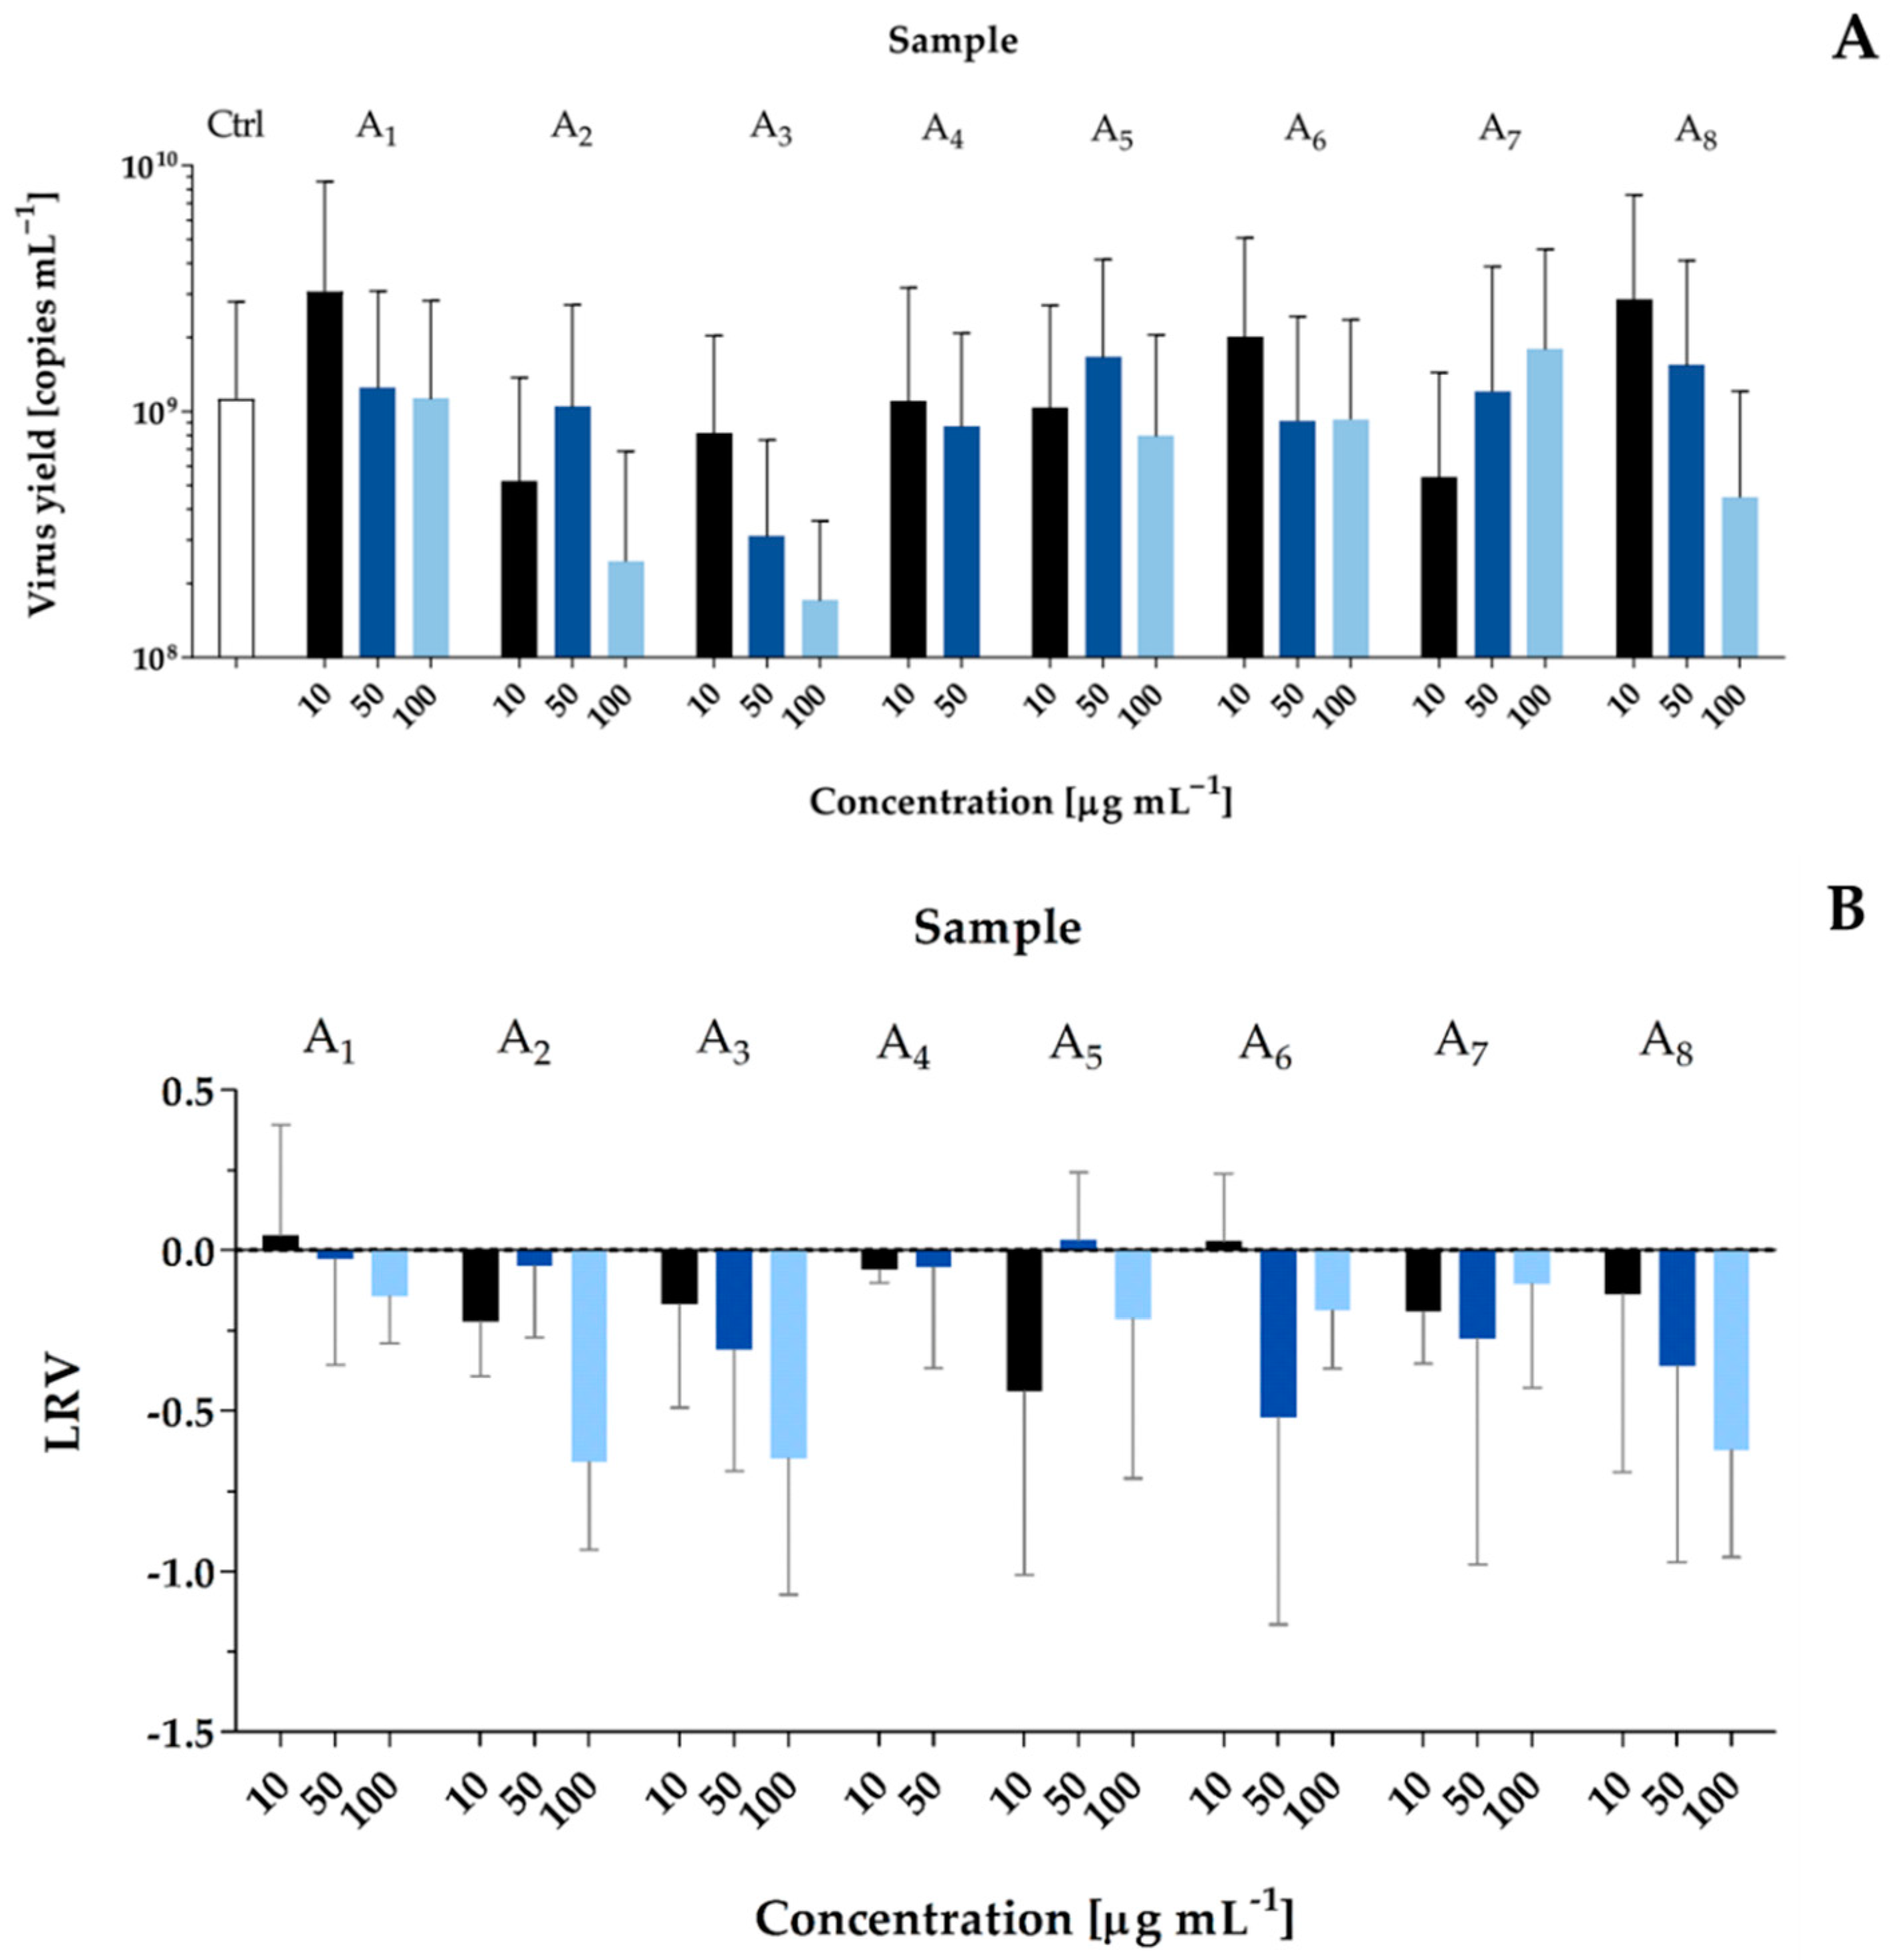
2.2. Bioactivity Screening
2.3. Structure Characterization of Compounds Present in the Active Fractions
3. Discussion
4. Conclusions
5. Materials and Methods
5.1. Culture Conditions
5.2. Extraction and Isolation of Metabolites
5.3. LC-MS/MS Analyses
5.4. Cytotoxicity Assays
5.5. Antiviral Activity
Supplementary Materials
Author Contributions
Funding
Institutional Review Board Statement
Informed Consent Statement
Data Availability Statement
Conflicts of Interest
References
- Komárek, J.; Kastovsksy, J.; Mares, J.; Johnsen, J. Taxonomic classification of Cyanoprokaryotes (cyanobacterial genera) 2014, using a polyphasic approach. Preslia 2014, 86, 295–335. [Google Scholar]
- Guiry, M.D.; Guiry, M.D.; Guiry, G.M. (Eds.) AlgaeBase; World-Wide Electronic Publication; National University of Ireland: Galway, Ireland, 2022; Available online: http://www.algaebase.org (accessed on 18 April 2022).
- Krienitz, L.; Ballot, A.; Casper, P.; Kotut, K.; Wiegand, C.; Pflugmacher, S. Cyanobacteria in hot springs of East Africa and their potential toxicity. Algol. Stud. 2005, 117, 297–306. [Google Scholar] [CrossRef]
- Kirkwood, A.E.; Henley, E.J. Algal community dynamics and halotolerance in a terrestrial, hypersaline environment. J. Phycol. 2006, 42, 537–547. [Google Scholar] [CrossRef]
- Matuła, J.; Pietryka, M.; Richter, D.; Wojtun, B. Cyanoprokaryota and algae of Arctic terrestrial ecosystems in the Hornsund area, Spitsbergen. Pol. Polar Res. 2007, 28, 283–315. [Google Scholar]
- Molisani, M.M.; Barroso, H.D.; Becker, H.B.; Moreira, M.O.; Hijo, C.A.; Maia, T.D.; Harrison, G.R. Trophic state, phytoplankton assemblages and limnological diagnosis of the Castanhão reservoir, CE, Brazil. Acta Limnol. Bras. 2010, 22, 1–12. [Google Scholar] [CrossRef]
- Mazur-Marzec, H.; Błaszczyk, A.; Felczykowsk, A.; Hohlfeld, N.; Kobos, J.; Toruńska-Sitarz, A.; Devi, P.; Montalvão, S.; D’souza, L.; Tammela, P.; et al. Baltic cyanobacteria—A source of biologically active compounds. Eur. J. Phycol. 2015, 50, 343–360. [Google Scholar] [CrossRef] [Green Version]
- Mohamed, Z.A.; Al-Shehri, A.M. Biodiversity and toxin production of cyanobacteria in mangrove swamps in the Red Sea off the southern coast of Saudi Arabia. Bot. Mar. 2015, 58, 23–34. [Google Scholar] [CrossRef]
- Yu, G.; Zhu, M.; Chen, Y.; Pan, W.; Chai, W.; Li, R. Polyphasic characterization of four species of Pseudanabaena (Oscillatoriales, cyanobacteria) from China and insights into polyphyletic divergence within the Pseudanabaena genus. Phytotaxa 2015, 192, 1–12. [Google Scholar] [CrossRef]
- Temraleeva, A.D. Cyanobacterial diversity in the soil of Russian dry steppes and semideserts. Microbiology 2018, 87, 249–260. [Google Scholar] [CrossRef]
- Olvera-Ramírez, R.; Centeno-Ramos, C.; Martínez-Jerónimo, F. Toxic effects of Pseudanabaena tenuis (Cyanobacteria) on the cladocerans Daphnia magna and Ceriodaphnia dubia. Hidrobiologica 2010, 20, 203–212. [Google Scholar]
- Leão, P.N.; Ramos, V.; Gonçalves, P.B.; Viana, F.; Lage, O.M.; Gerwick, W.H.; Vasconcelos, V.M. Chemoecological screening reveals high bioactivity in diverse culturable Portuguese marine cyanobacteria. Mar. Drugs 2013, 11, 1316–1335. [Google Scholar] [CrossRef] [PubMed] [Green Version]
- Oudra, B.; Loudiki, M.; Sbiyyaa, B.; Martins, R.; Vasconcelos, V.; Namikoshi, N. Isolation, characterization and quantification of microcystins (heptapeptides hepatotoxins) in Microcystis aeruginosa dominated bloom of Lalla Takerkoust lakereservoir (Morocco). Toxicon 2001, 39, 1375–1381. [Google Scholar] [CrossRef]
- Oudra, B.; Loudiki, M.; Vasconcelos, V.; Sabour, B.; Sbiyyaa, B.; Oufdou, K.; Mezrioui, N. Detection and quantification of microcystins from cyanobacteria strains isolated from reservoirs and ponds in Morocco. Environ. Toxicol. 2002, 17, 32–39. [Google Scholar] [CrossRef] [PubMed]
- Maršálek, B.; Bláha, L.; Babica, P. Analyses of microcystins in the biomass of Pseudanabaena limnetica collected in Znojmo reservoir. Fottea 2003, 3, 195–197. [Google Scholar]
- Douma, M.; Loudiki, M.; Oudra, B.; Mouhri, K.; Ouahid, Y.; del Campo, F.F. Taxonomic diversity and toxicological assessment of cyanobacteria in Moroccan inland waters. Rev. Des Sci. De L’eau/J. Water Sci. 2009, 22, 435–449. [Google Scholar] [CrossRef] [Green Version]
- Gantar, M.; Sekar, R.; Richardson, L.L. Cyanotoxins from black band disease of corals and from other coral reef environments. Microb. Ecol. 2009, 58, 856–864. [Google Scholar] [CrossRef] [PubMed] [Green Version]
- Teneva, I.; Mladenov, R.; Dzhambazov, B. Toxic effects of extracts from Pseudanabaena galeata (Cyanoprokaryota) in mice and cell cultures in vitro. Nat. Sci. Hum. 2009, 12, 237–243. [Google Scholar]
- Patterson, G.M.L.; Baker, K.K.; Baldwin, C.L.; Bolis, C.M.; Caplan, F.R.; Larsen, L.K.; Levine, I.A.; Moore, R.E.; Moore, E.; Nelson, C.S.; et al. Antiviral activity of cultured blue-green algae (Cyanophyta). J. Phycol. 1993, 29, 125–130. [Google Scholar] [CrossRef]
- Cano-Europa, E.; Ortiz-Butrón, R.; Gallardo-Casas, C.A.; Blas-Valdivia, V.; Pineda-Reynoso, M.; Olvera-Ramírez, R.; Franco-Colin, M. Phycobiliproteins from Pseudanabaena tenuis rich in c-phycoerythrin protect against HgCl2-caused oxidative stress and cellular damage in the kidney. J. Appl. Phycol. 2010, 22, 495–501. [Google Scholar] [CrossRef]
- Costa, M.; Garcia, M.; Costa-Rodrigues, J.; Costa, M.S.; Ribeiro, M.J.; Fernandes, M.H.; Barros, P.; Barreiro, A.; Vasconcelos, V.; Martins, R. Exploring bioactive properties of marine cyanobacteria isolated from the Portuguese coast: High potential as a source of anticancer compounds. Mar. Drugs 2014, 12, 98–114. [Google Scholar] [CrossRef] [Green Version]
- Priatni, S.; Budiwati, T.A.; Ratnaningrum, D.; Kosasih, W.; Andryani, R.; Susanti, H.; Susilaningsih, D. Antidiabetic screening of some Indonesian marine cyanobacteria collection. Biodiversitas 2016, 17, 642–646. [Google Scholar] [CrossRef]
- Felczykowska, A.; Pawlik, A.; Mazur-Marzec, H.; Toruńska-Sitarz, A.; Narajczyk, M.; Richert, M.; Węgrzyn, G.; Herman-Antosiewicz, A. Selective inhibition of cancer cells’ proliferation by compounds included in extracts from Baltic Sea cyanobacteria. Toxicon 2015, 8, 1–10. [Google Scholar] [CrossRef] [PubMed]
- Jones, M.R.; Pinto, E.; Torres, M.A.; Dörr, F.; Mazur-Marzec, H.; Szubert, K.; Tartaglione, L.; Dell’Aversano, C.; Miles, C.O.; Beach, D.G.; et al. CyanoMetDB, a comprehensive public database of secondary metabolites from cyanobacteria. Water Res. 2021, 196, 117017. [Google Scholar] [CrossRef] [PubMed]
- Dittmann, E.; Gugger, M.; Sivonen, K.; Fewer, D.P. Natural product biosynthetic diversity and comparative genomics of the cyanobacteria. Trends Microbiol. 2015, 23, 642–652. [Google Scholar] [CrossRef] [PubMed]
- Demay, J.; Bernard, C.; Reinhardt, A.; Marie, B. Natural products from cyanobacteria: Focus on beneficial activities. Mar. Drugs 2019, 17, 320. [Google Scholar] [CrossRef] [PubMed] [Green Version]
- Costa, M.; Costa-Rodrigues, J.; Fernandes, M.H.; Barros, P.; Vasconcelos, V.; Martins, R. Marine cyanobacteria compounds with anticancer properties: A review on the implication of apoptosis. Mar. Drugs 2012, 10, 2181–2207. [Google Scholar] [CrossRef] [Green Version]
- Salvador-Reyes, L.A.; Luesch, H. Biological targets and mechanisms of action of natural products from marine cyanobacteria. Nat. Prod. Rep. 2015, 32, 478–503. [Google Scholar] [CrossRef] [Green Version]
- Singh, S.B. Discovery and development of dolastatin 10-derived antibody drug conjugate anticancer drugs. J. Nat. Prod. 2022, 85, 666–687. [Google Scholar] [CrossRef]
- Yang, K.; Chen, B.; Gianolio, D.D.; Stefano, J.E.; Busch, M.; Manning, C.; Alving, K.; Gregory, R.C.; Brondyk, W.H.; Miller, R.J.; et al. Convergent synthesis of hydrophilic monomethyl dolastatin 10 based drug linkers for antibody-drug conjugation. Org. Biomol. Chem. 2019, 17, 8115–8124. [Google Scholar] [CrossRef]
- Helle, F.; Wychowski, C.; Vu-Dac, N.; Gustafson, K.R.; Voisset, C.; Dubuisson, J. Cyanovirin-N inhibits hepatitis C virus entry by binding to envelope protein glycans. J. Biol. Chem. 2006, 281, 25177–25183. [Google Scholar] [CrossRef] [Green Version]
- Lotfi, H.; Sheervalilou, R.; Zarghami, N. An update of the recombinant protein expression systems of cyanovirin-N and challenges of preclinical development. Bioimpacts 2018, 8, 139–151. [Google Scholar] [CrossRef] [PubMed] [Green Version]
- Mader, J.; Gallo, A.; Schommartz, T.; Handke, W.; Nagel, C.-H.; Günther, P.; Brune, W.; Reich, K. Calcium spirulan derived from Spirulina platensis inhibits herpes simplex virus 1 attachment to human keratinocytes and protects against herpes labialis. J. Allergy Clin. Immunol. 2016, 137, 197–203.e3. [Google Scholar] [CrossRef] [PubMed] [Green Version]
- Zainuddin, E.N.; Mentel, R.; Wray, V.; Jansen, R.; Nimtz, M.; Lalk, M.; Mundt, S. Cyclic depsipeptides, ichthyopeptins A and B, from Microcystis ichthyoblabe. J. Nat. Prod. 2007, 70, 1084–1088. [Google Scholar] [CrossRef] [PubMed] [Green Version]
- Naidoo, D.; Roy, A.; Kar, P.; Mutanda, T.; Anandraj, A. Cyanobacterial metabolites as promising drug leads against the Mpro and PLpro of SARS-CoV-2: An in silico analysis. J. Biomol. Struct. Dyn. 2021, 39, 6218–6230. [Google Scholar] [CrossRef] [PubMed]
- Loya, S.; Reshef, V.; Mizrachi, E.; Silberstein, C.; Rachamim, Y.; Carmeli, S.; Hizi, A. The inhibition of the reverse transcriptase of HIV-1 by the natural sulfoglycolipids from cyanobacteria: Contribution of different moieties to their high potency. J. Nat. Prod. 1998, 61, 891–895. [Google Scholar] [CrossRef] [PubMed]
- Ferreira, L.; Morais, J.; Preto, M.; Silva, R.; Urbatzka, R.; Vasconcelos, V.; Reis, M. Uncovering the bioactive potential of a cyanobacterial natural products library aided by untargeted metabolomics. Mar. Drugs 2021, 19, 633. [Google Scholar] [CrossRef] [PubMed]
- Petit, L.; Vernès, L.; Cadoret, J.-P. Docking and in silico toxicity assessment of Arthrospira compounds as potential antiviral agents against SARS-CoV-2. J. Appl. Phycol. 2021, 33, 1579–1602. [Google Scholar] [CrossRef]
- Pierson, T.C.; Diamond, M.S. The continued threat of emerging flaviviruses. Nat. Microbiol. 2020, 5, 796–812. [Google Scholar] [CrossRef]
- Li, J.; Lai, S.; Gao, G.F.; Shi, W. The emergence, genomic diversity and global spread of SARS-CoV-2. Nature 2021, 600, 408–418. [Google Scholar] [CrossRef]
- Stawicki, S.P.; Jeanmonod, R.; Miller, A.C.; Paladino, L.; Gaieski, D.F.; Yaffee, A.Q.; De Wulf, A.; Grover, J.; Papadimos, T.J.; Bloem, C.; et al. The 2019-2020 novel coronavirus (severe acute respiratory syndrome coronavirus 2) pandemic: A joint American College of Academic International Medicine-World Academic Council of Emergency Medicine Multidisciplinary COVID-19 Working Group Consensus Paper. J. Glob. Infect. Dis. 2020, 12, 47–93. [Google Scholar] [CrossRef]
- Hoffmann, M.; Kleine-Weber, H.; Schroeder, S.; Krüger, N.; Herrler, T.; Erichsen, S.; Schiergens, T.S.; Herrler, G.; Wu, N.-H.; Nitsche, A.; et al. SARS-CoV-2 cell entry depends on ACE2 and TMPRSS2 and is blocked by a clinically proven protease inhibitor. Cell 2020, 181, 271–280.e8. [Google Scholar] [CrossRef] [PubMed]
- Synowiec, A.; Jedrysik, M.; Branicki, W.; Klajmon, A.; Lei, J.; Owczarek, K.; Suo, C.; Szczepanski, A.; Wang, J.; Zhang, P.; et al. Identification of cellular factors required for SARS-CoV-2 replication. Cells 2021, 10, 3159. [Google Scholar] [CrossRef] [PubMed]
- Klemm, T.; Ebert, G.; Calleja, D.J.; Allison, C.C.; Richardson, L.W.; Bernardini, J.P.; Gc Lu, B.; Kuchel, N.W.; Grohmann, C.; Shibata, Y.; et al. Mechanism and inhibition of the papain-like protease, PLpro, of SARS-CoV-2. EMBO J. 2020, 39, e106275. [Google Scholar] [CrossRef] [PubMed]
- Clemente, V.; D’Arcy, P.; Bazzaro, M. Deubiquitinating enzymes in coronaviruses and possible therapeutic opportunities for COVID-19. Int. J. Mol. Sci. 2020, 21, 3492. [Google Scholar] [CrossRef]
- Huynh, T.; Cornell, W.; Luan, B. In silico exploration of inhibitors for SARS-CoV-2′s papain-like protease. Front. Chem. 2021, 8, 624163. [Google Scholar] [CrossRef]
- Zhao, Y.; Du, X.; Duan, Y.; Pan, X.; Sun, Y.; You, T.; Han, L.; Jin, Z.; Shang, W.; Yu, J.; et al. High-throughput screening identifies established drugs as SARS-CoV-2 PLpro inhibitors. Protein Cell 2021, 12, 877–888. [Google Scholar] [CrossRef]
- Liang, X.; Kaya, A.; Zhang, Y.; Tien Le, D.; Hua, D.; Gladyshev, V.N. Characterization of methionine oxidation and methionine sulfoxide reduction using methionine-rich cysteine-free proteins. BMC Biochem. 2012, 13, 21. [Google Scholar] [CrossRef] [Green Version]
- Kim, G.; Weiss, S.J.; Levine, R.L. Methionine oxidation and reduction in proteins. Biochim. Biophys. Acta 2014, 1840, 901–905. [Google Scholar] [CrossRef] [Green Version]
- Shoombuatong, W.; Schaduangrat, N.; Nantasenamat, C. Unraveling the bioactivity of anticancer peptides as deduced from machine learning. EXCLI J. 2018, 17, 734–752. [Google Scholar] [CrossRef]
- Sakib, M.M.H.; Nishat, A.A.; Islam, M.T.; Raihan Uddin, M.A.; Iqbal, M.S.; Bin Hossen, F.F.; Ahmed, M.I.; Bashir, M.S.; Hossain, T.; Tohura, U.S.; et al. Computational screening of 645 antiviral peptides against the receptor-binding domain of the spike protein in SARS-CoV-2. Comput. Biol. Med. 2021, 136, 104759. [Google Scholar] [CrossRef]
- Chowdhury, S.M.; Talukder, S.A.; Khan, A.M.; Afrin, N.; Ali, M.A.; Islam, R.; Parves, R.; Al Mamun, A.; Sufian, M.A.; Hossain, M.N.; et al. Antiviral peptides as promising therapeutics against SARS-CoV-2. J. Phys. Chem. B 2020, 124, 9785–9792. [Google Scholar] [CrossRef] [PubMed]
- Huang, K.Y.; Tseng, Y.J.; Kao, H.J.; Chen, C.H.; Yang, H.H.; Weng, S.L. Identification of subtypes of anticancer peptides based on sequential features and physicochemical properties. Sci. Rep. 2021, 11, 13594. [Google Scholar] [CrossRef] [PubMed]
- Dai, Y.; Cai, X.; Shi, W.; Bi, X.; Su, X.; Pan, M.; Li, H.; Lin, H.; Huang, W.; Qian, H. Pro-apoptotic cationic host defense peptides rich in lysine or arginine to reverse drug resistance by disrupting tumor cell membrane. Amino Acids 2017, 49, 1601–1610. [Google Scholar] [CrossRef]
- Chiangjong, W.; Chutipongtanate, S.; Hongeng, S. Anticancer peptide: Physicochemical property, functional aspect and trend in clinical application (Review). Int. J. Oncol. 2020, 57, 678–696. [Google Scholar] [CrossRef] [PubMed]
- Pettit, G.R.; Kamano, Y.; Herald, C.L.; Tuinman, A.A.; Boettner, F.E.; Kizu, H.; Schmidt, J.M.; Baczynskyj, L.; Tomer, K.B.; Bontems, R.J. The isolation and structure of a remarkable marine animal antineoplastic constituent: Dolastatin 10. J. Am. Chem. Soc. 1987, 109, 6883–6885. [Google Scholar] [CrossRef]
- Thornburg, C.C.; Cowley, E.S.; Sikorska, J.; Shaala, L.A.; Ishmael, J.E.; Youssef, D.T.; McPhail, K.L. Apratoxin H and apratoxin A sulfoxide from the Red Sea cyanobacterium Moorea producens. J. Nat. Prod. 2013, 76, 1781–1788. [Google Scholar] [CrossRef] [PubMed] [Green Version]
- Trimurtulu, T.; Ohtani, I.; Patterson, G.M.L.; Moore, R.E.; Corbett, T.H.; Valeriote, F.A.; Demchik, L. Total structures of cryptophycins, potent antitumor depsipeptides from the blue-green alga Nostoc sp. Strain GSV 224. J. Am. Chem. Soc. 1994, 116, 4729–4737. [Google Scholar] [CrossRef]
- Kaneda, M.; Kawaguchi, S.; Fujii, N.; Ohno, H.; Oishi, S. Structure-activity relationship study on odoamide: Insights into the bioactivities of aurilide-family hybrid peptide-polyketides. ACS Med. Chem. Lett. 2018, 9, 365–369. [Google Scholar] [CrossRef]
- Simmons, T.L.; McPhail, K.L.; Ortega-Barría, E.; Mooberry, S.L.; Gerwick, W.H. Belamide A, a new antimitotic tetrapeptide from a Panamanian marine cyanobacterium. Tetrahedron Lett. 2006, 47, 3387–3390. [Google Scholar] [CrossRef]
- Cegłowska, M.; Toruńska-Sitarz, A.; Stoń-Egiert, J.; Mazur-Marzec, H.; Kosakowska, A. Characteristics of cyanobacterium Pseudanabaena galeata CCNP1313 from the Baltic Sea. Algal Res. 2020, 47, 101861. [Google Scholar] [CrossRef]
- Jin, Z.; Du, X.; Xu, Y.; Deng, Y.; Liu, M.; Zhao, Y.; Zhang, B.; Li, X.; Zhang, L.; Peng, C.; et al. Structure of Mpro from SARS-CoV-2 and discovery of its inhibitors. Nature 2020, 582, 289–293. [Google Scholar] [CrossRef] [PubMed] [Green Version]
- Osipiuk, J.; Azizi, S.-A.; Dvorkin, S.; Endres, M.; Jedrzejczak, R.; Jones, K.A.; Kang, S.; Kathayat, R.S.; Kim, Y.; Lisnyak, V.G.; et al. Structure of papain-like protease from SARS-CoV-2 and its complexes with non-covalent inhibitors. Nat. Commun. 2021, 12, 743. [Google Scholar] [CrossRef] [PubMed]
- Owen, D.R.; Allerton, C.M.N.; Anderson, A.S.; Aschenbrenner, L.; Avery, M.; Berritt, S.; Boras, B.; Cardin, R.D.; Carlo, A.; Coffman, K.J.; et al. An oral SARS-CoV-2 Mpro inhibitor clinical candidate for the treatment of COVID-19. Science 2021, 374, 1586–1593. [Google Scholar] [CrossRef] [PubMed]


| Sample Number | m/z and Relative Amounts * (%) of the Peptides | Preparative (P) Chromatography Fractions | Weight (mg) |
|---|---|---|---|
| A1 | 639 (75%), 862 (25%) | P1 F41 | 1.10 |
| A2 | 656 (25%), 819 (60%), 854 (15%) | P1 F44–45 | 1.16 |
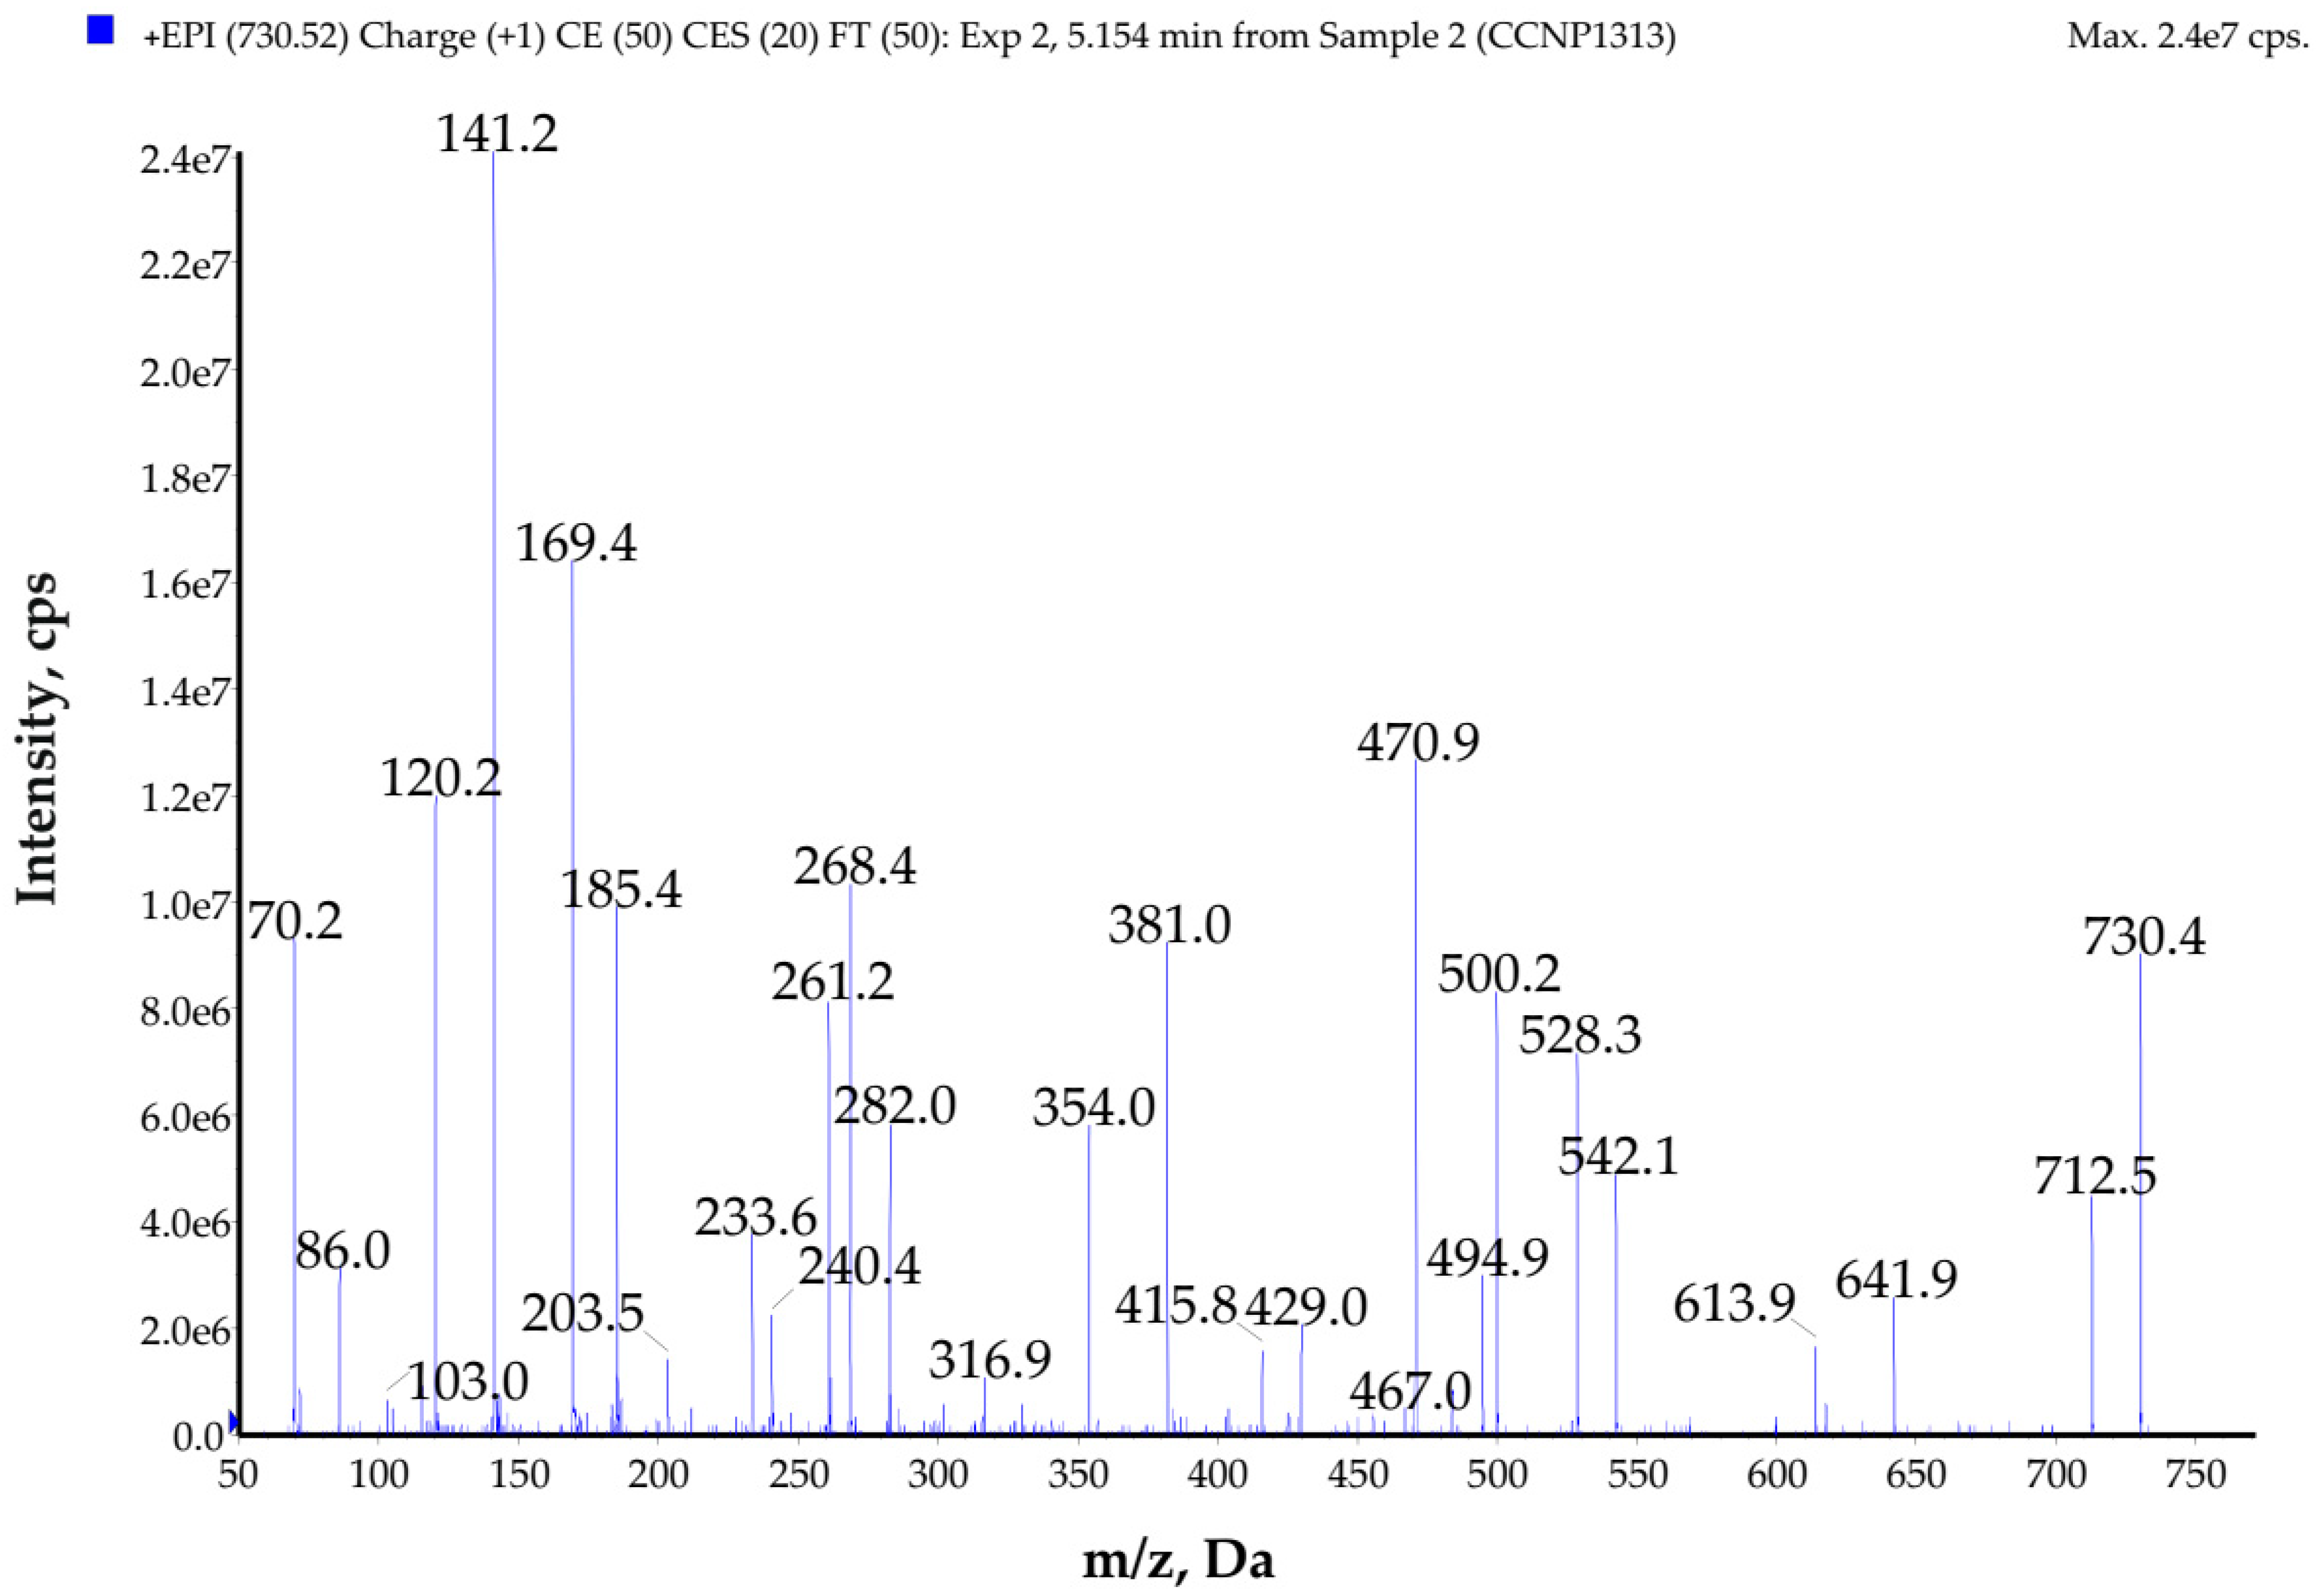
| A3 | 730 (100%) | P1 F53–54 | 1.30 |
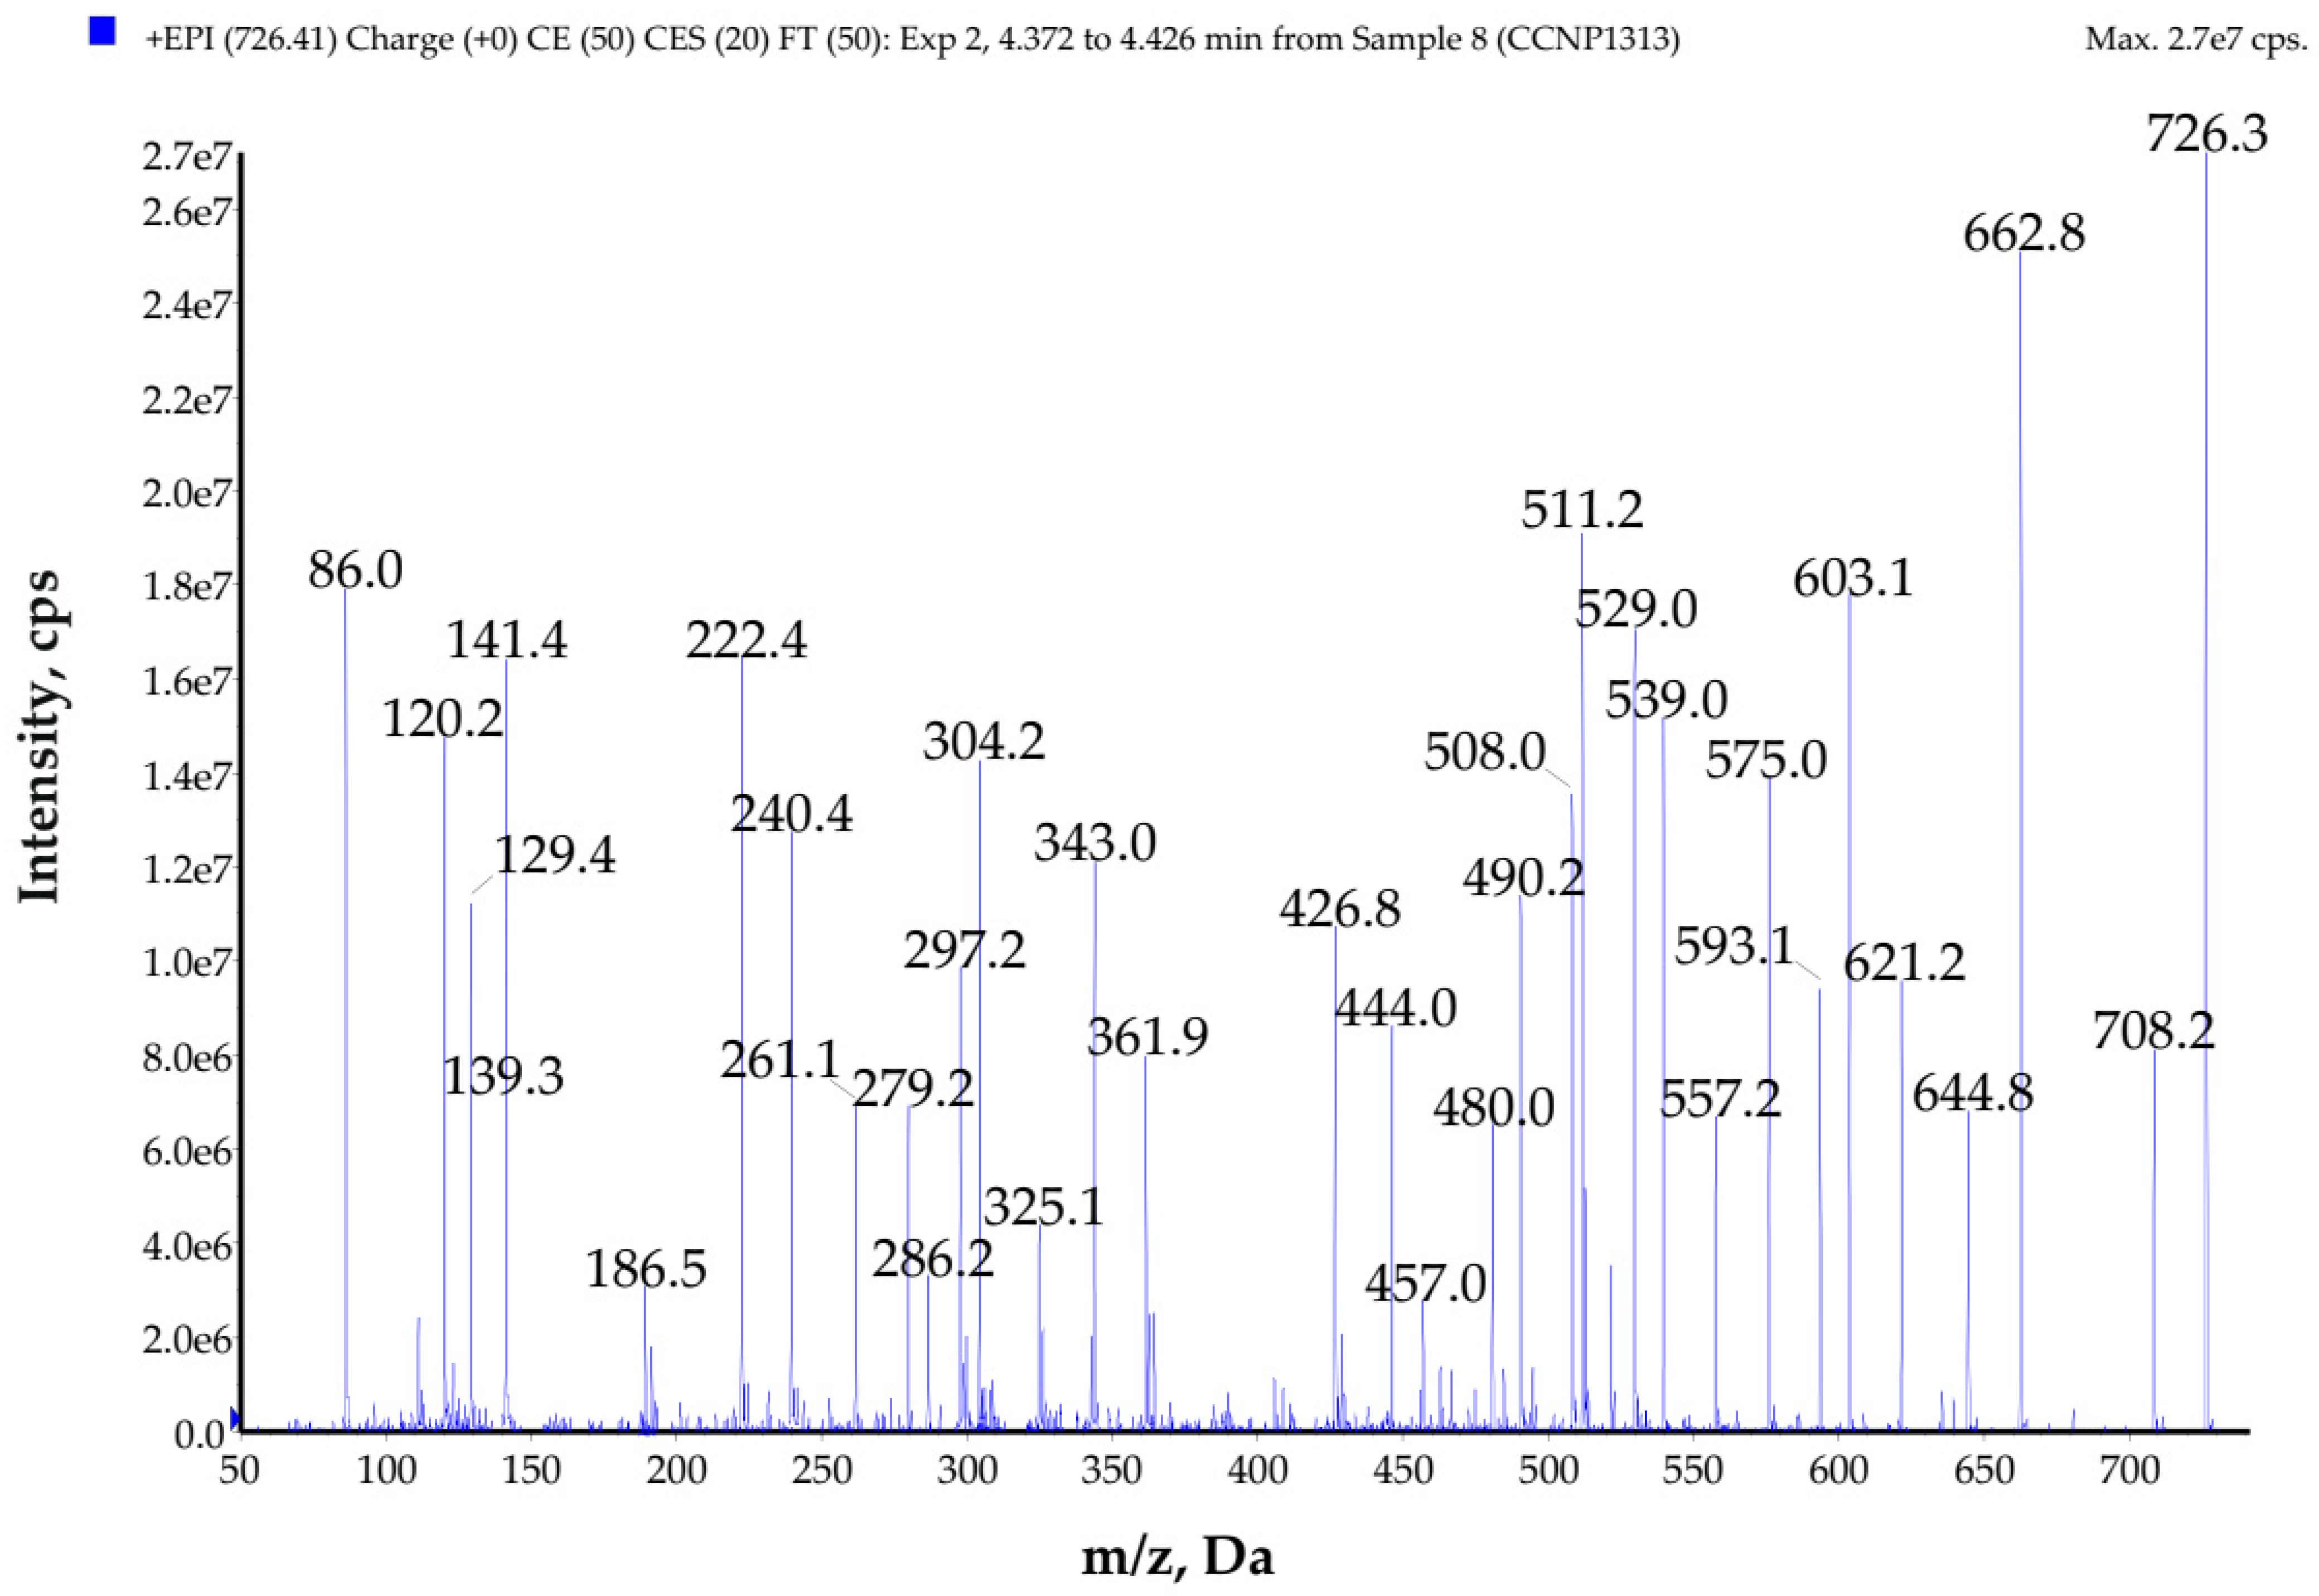
| A4 | 726 (100%) | P1 F38 and P2 F19 | 1.10 |
| A5 | 891 (100%) | P1 F87–90 | 1.21 |
| A6 | 599 (32%), 716 (68%) | P2 F20–23 | 1.34 |
| A7 | 677 (23%), 999 (77%) | P3 F39–40 | 0.70 |
| A8 | 1167 (100%) | P3 F43–45 | 1.70 |
| Pseudanabaena galeata Peptides | m/z | Suggested Chemical Structure | Sample | Cytotoxic Activity | Antiviral Activity | |
|---|---|---|---|---|---|---|
| T47D | HDF | |||||
| GP598 | 599 | Ala-Leu *-Val-Leu *-Leu *-Ala | A6 | – | – | – |
| PG638 | 639 | Arg-MetO-Gly-Phe-Leu * | A1 | – | + | – |
| GP655 | 656 | Ala-Leu *-Val-Leu *-Leu *-Ala-Gly | A2 | – | ++ | + |
| UP676 | 677 | - | A7 | NT | NT | – |
| PG709 | 710 | Arg-Met-Gly-Phe-Leu *-Ser | - | NT | NT | NT |
| GP715 | 716 | Ala-Val-Val-Phe-Leu *-Pro-Ala | A6 | – | – | – |
| PG725 | 726 | Arg-MetO-Gly-Phe-Leu *-Ser | A4 | – | +++ | – |
| GP729 | 730 | Ala-Pro-Val-Leu *-Phe-Leu *-Ala | A3 | – | – | – |
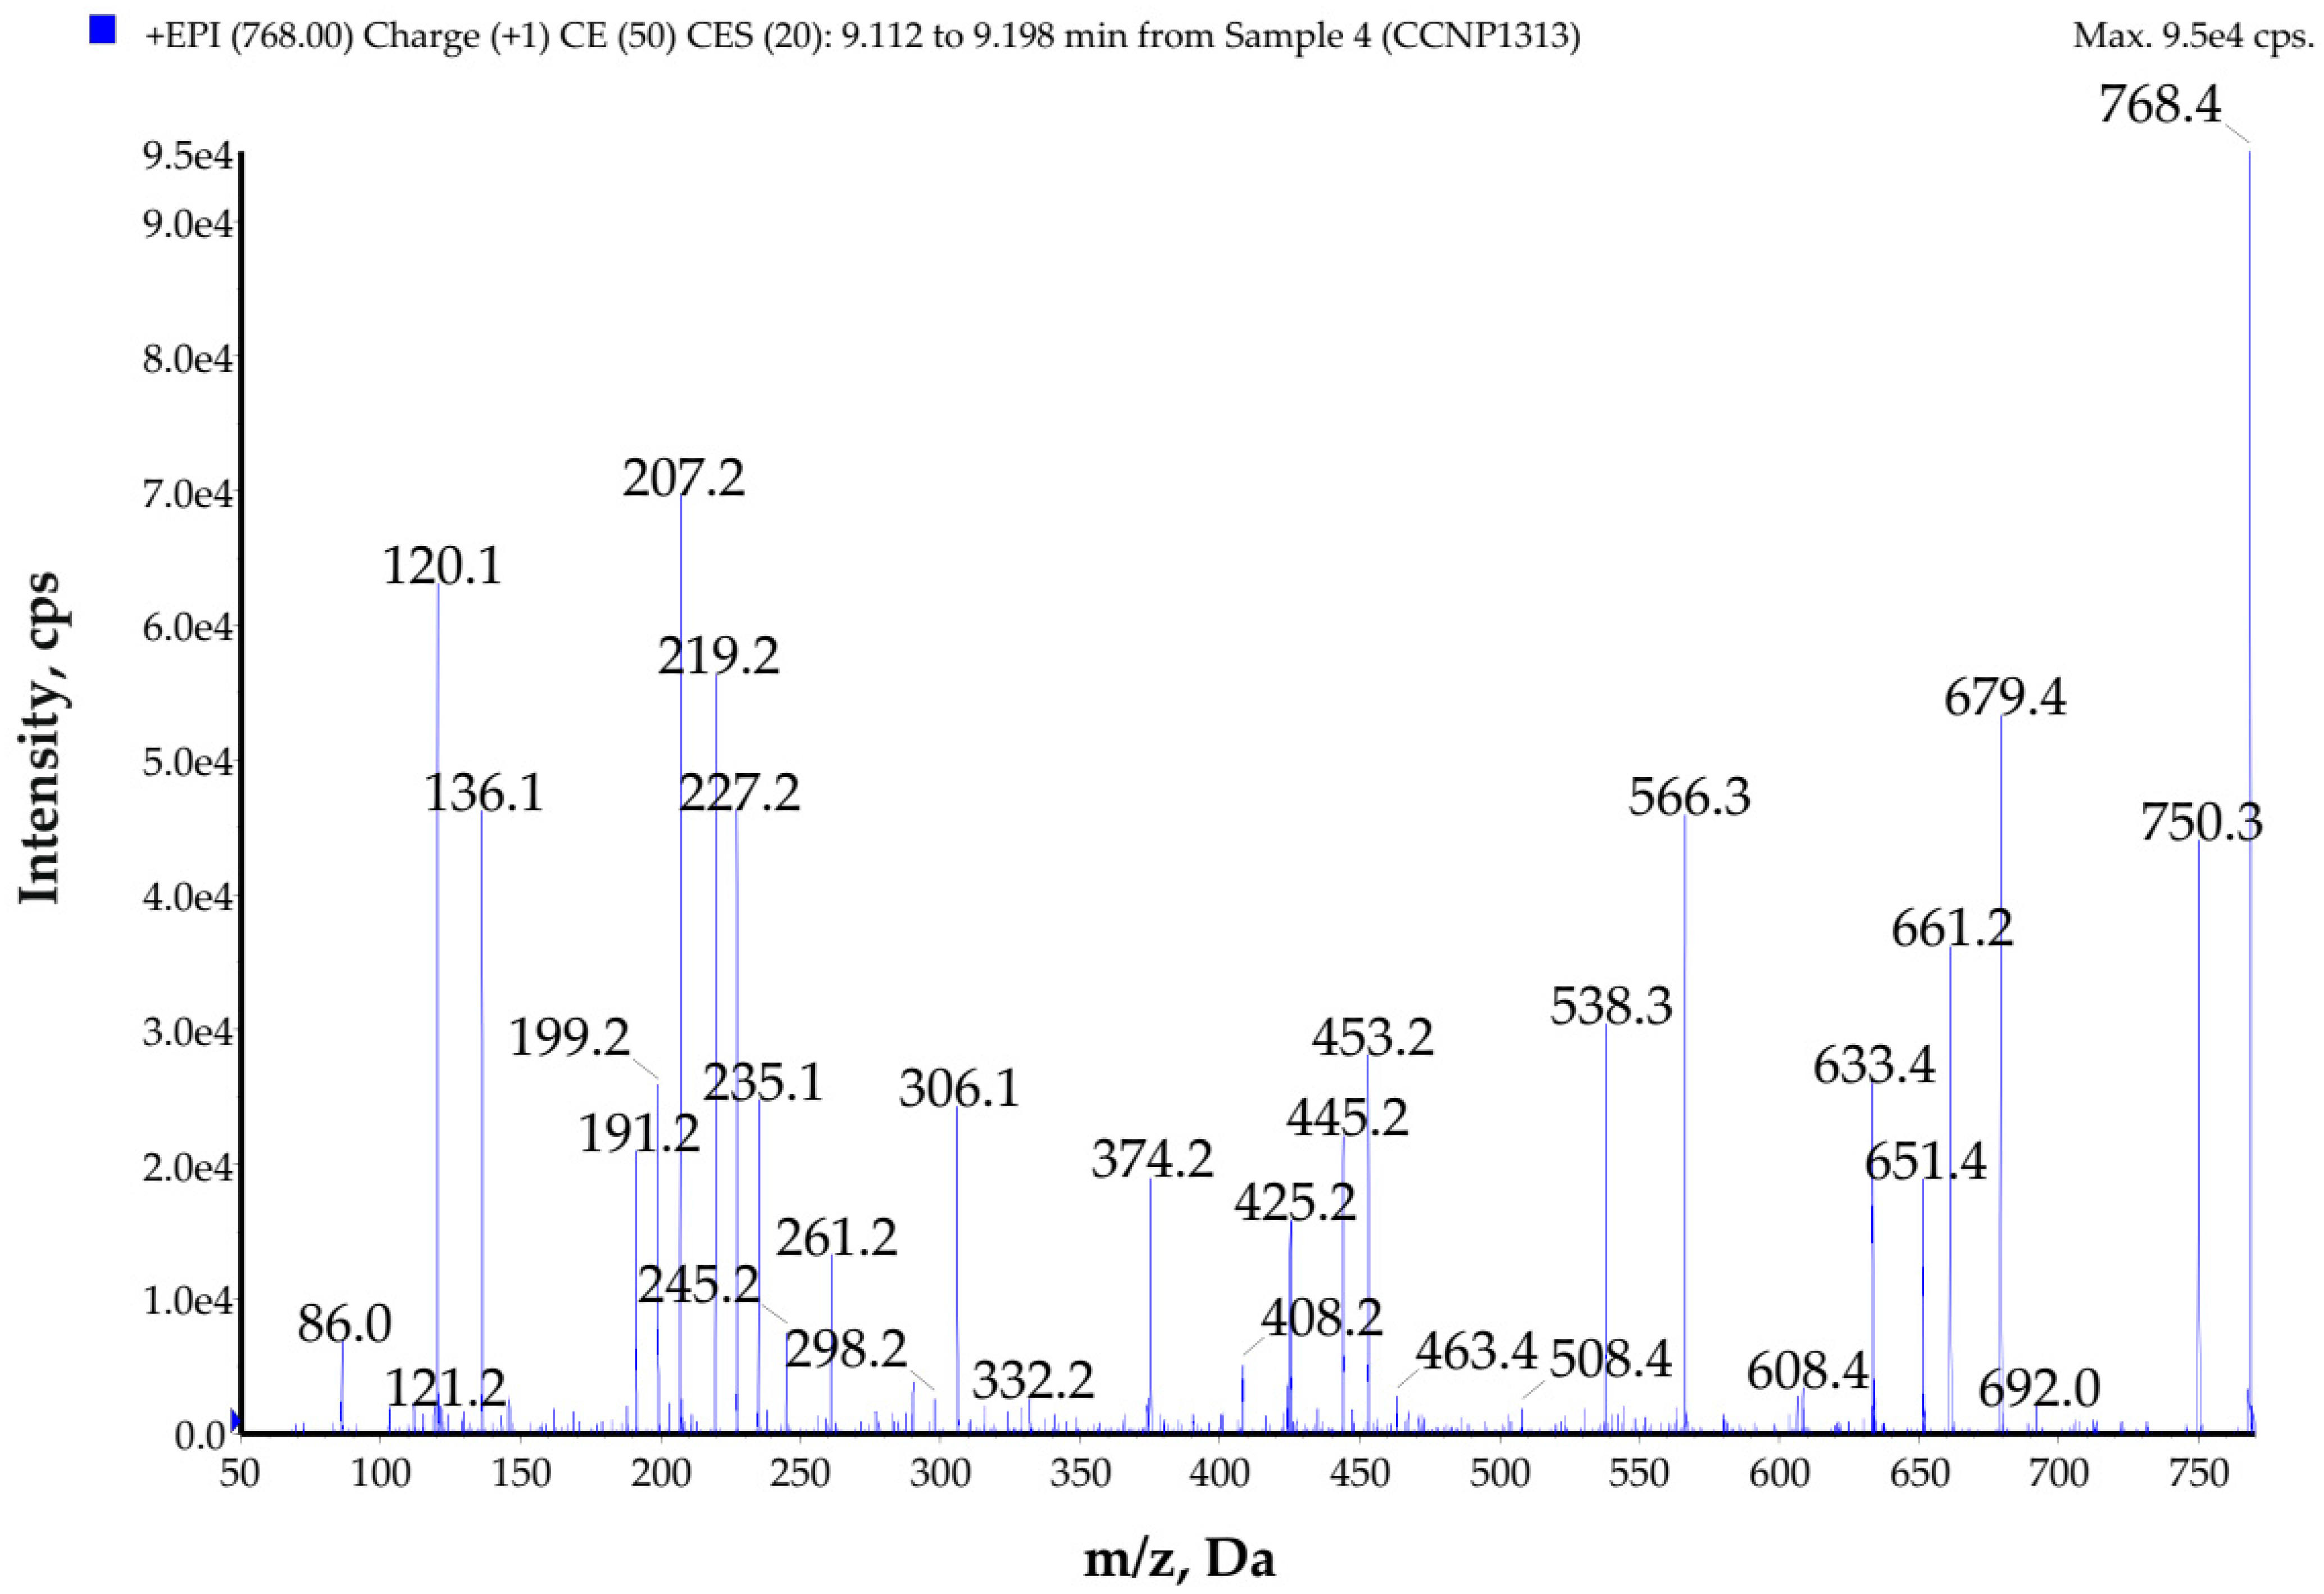
| GP767 | 768 | Tyr-Ala-Ala-Phe-Leu *-Leu *-Ala | - | NT | NT | NT |
| GP794 | 795 | Ala-Val-Val-Leu *-Leu *-Pro-Leu *-Ala | - | NT | NT | NT |
| GP818 | 819 | Ala-Thr-Leu *-Val-Phe-Val-Val-Ala | A2 | – | ++ | + |
| GP825 | 826 | Ala-Pro-Val-Leu *-?-Val-Leu *-Ala | - | NT | NT | NT |
| GP828 | 829 | Ala-Leu *-Val-Val-Leu *-Phe-Pro-Ala | - | NT | NT | NT |
| UP853 | 854 | - | A2 | – | ++ | + |
| UP861 | 862 | - | A1 | – | + | – |
| GP879 | 880 | Ala-Pro-Val-?-Pro-Ala-Val-Leu *-Ala | - | NT | NT | NT |
| UP890 | 891 | - | A5 | – | +++ | – |
| GP998 | 999 | Ala-Pro-Val-Leu *-Ala-Phe-Val-Val-Leu *-Ala | A7 | NT | NT | NT |
| GP1166 | 1167 | - | A8 | – | – | + |
| Prep1 | Prep2 | Prep3 | |
|---|---|---|---|
| Flash Chromatography Fractions | |||
| F40%.7–F60%.3 | F40%.2 and F40%.6 | F80%.1–F80%.3 | |
| Precolumn | SecurityGuard Prep Cartridge C12 (15 × 30 mm; 90 Å; 4 µm) (Phenomenex, Torrence, CA, USA) | ReproSil-Pur Basic C18 (5 × 4.6 mm; 100 Å; 5 µm) (Dr. Maisch GmbH, Ammerbuch, Germany) | |
| Column | Jupiter Proteo C12 (250 × 21.2 mm; 90 Å; 4 µm) (Phenomenex, Torrence, CA, USA) Flow rate: 15 mL min−1 | ReproSil-Pur Basic C18 (250 × 4.6 mm; 100 Å; 5 µm) (Dr. Maisch GmbH, Ammerbuch, Germany) Flow rate: 1.5 mL min−1 | |
| Gradient | From 10% B to 100% B in 35 min | From 20% B to 100% B in 35 min | From 15% B to 100% B in 70 min |
| Fraction volume | 3 mL per vial | 1.5 mL per vial | 1.5 mL per vial |
| Virus | Cells | Infection Culture Condition | Samples |
|---|---|---|---|
| WNV strain Hungary 578/10 TCID50 = 400 mL−1 | Vero E6 | 37 °C, 5% CO2, 48 h | Extract; 250 µg mL−1 |
| HCoV-OC43 ATCC: VR-1558 TCID50 = 400 mL−1 | HCT-8 | 32 °C, 5% CO2, 96–120 h | Extract; 250 µg mL−1 |
| SARS-CoV-2 TCID50 = 400 mL−1 PL_P18 [GISAID Clade G, Pangolin lineage B.1] (accession numbers for the GISAID database: EPI_ISL_451979) | Vero E6 | 37 °C, 5% CO2, 72 h | F20, F40, F60, F80; 50 µg mL−1 |
| SARS-CoV-2 TCID50 = 1600 mL−1 PL_P18 [GISAID Clade G, Pangolin lineage B.1] (accession numbers for the GISAID database: EPI_ISL_451979) | A549ACE2/TMPRSS2 | 37 °C, 5% CO2, 96 h | Flash chromatography fractions; samples A1–A8; 10, 50, 100 µg mL−1 |
| Virus | Oligonucleotides | Sequence (5′ -> 3′) |
|---|---|---|
| ZIKV | Primer 5′ (Forward) | TTGGTCATGATACTGCTGATTGC |
| Primer 3′ (Reverse) | CCTTCCACAAAGTCCCTATTGC | |
| Probe | 6-FAM-CGGCATACAGCATCAGGTGCATAGGAG-TAMRA | |
| WNV | Primer 5′ (Forward) | CGGAAGTyGrGTAkACGGTGCTG |
| Primer 3′ (Reverse) | CGGTwyTGAGGGCTTACrTGG | |
| Probe | 6-FAM-wCCCCAGGwGGACTG-BHQ1 | |
| HCoV-OC43 | Primer 5′ (Forward) | AGCAACCAGGCTGATGTCAATACC |
| Primer 3′ (Reverse) | AGCAGACCTTCCTGAGCCTTCAAT | |
| Probe | 6-FAM-TGACATTGTCGATCGGGACCCAAGTA-TAMRA | |
| SARS-CoV-2 | Primer 5′ (Forward) | CACATTGGCACCCGCAATC |
| Primer 3′ (Reverse) | GAGGAACGAGAAGAGGCTTG | |
| Probe | 6-ACTTCCTCAAGGAACAACATTGCCA-BHQ-1 |
Publisher’s Note: MDPI stays neutral with regard to jurisdictional claims in published maps and institutional affiliations. |
© 2022 by the authors. Licensee MDPI, Basel, Switzerland. This article is an open access article distributed under the terms and conditions of the Creative Commons Attribution (CC BY) license (https://creativecommons.org/licenses/by/4.0/).
Share and Cite
Cegłowska, M.; Szubert, K.; Grygier, B.; Lenart, M.; Plewka, J.; Milewska, A.; Lis, K.; Szczepański, A.; Chykunova, Y.; Barreto-Duran, E.; et al. Pseudanabaena galeata CCNP1313—Biological Activity and Peptides Production. Toxins 2022, 14, 330. https://doi.org/10.3390/toxins14050330
Cegłowska M, Szubert K, Grygier B, Lenart M, Plewka J, Milewska A, Lis K, Szczepański A, Chykunova Y, Barreto-Duran E, et al. Pseudanabaena galeata CCNP1313—Biological Activity and Peptides Production. Toxins. 2022; 14(5):330. https://doi.org/10.3390/toxins14050330
Chicago/Turabian StyleCegłowska, Marta, Karolina Szubert, Beata Grygier, Marzena Lenart, Jacek Plewka, Aleksandra Milewska, Kinga Lis, Artur Szczepański, Yuliya Chykunova, Emilia Barreto-Duran, and et al. 2022. "Pseudanabaena galeata CCNP1313—Biological Activity and Peptides Production" Toxins 14, no. 5: 330. https://doi.org/10.3390/toxins14050330
APA StyleCegłowska, M., Szubert, K., Grygier, B., Lenart, M., Plewka, J., Milewska, A., Lis, K., Szczepański, A., Chykunova, Y., Barreto-Duran, E., Pyrć, K., Kosakowska, A., & Mazur-Marzec, H. (2022). Pseudanabaena galeata CCNP1313—Biological Activity and Peptides Production. Toxins, 14(5), 330. https://doi.org/10.3390/toxins14050330