Comparison Evaluation of the Biological Effects of Sterigmatocystin and Aflatoxin B1 Utilizing SOS-Chromotest and a Novel Zebrafish (Danio rerio) Embryo Microinjection Method

 ,
,  , , , ,
Abstract
: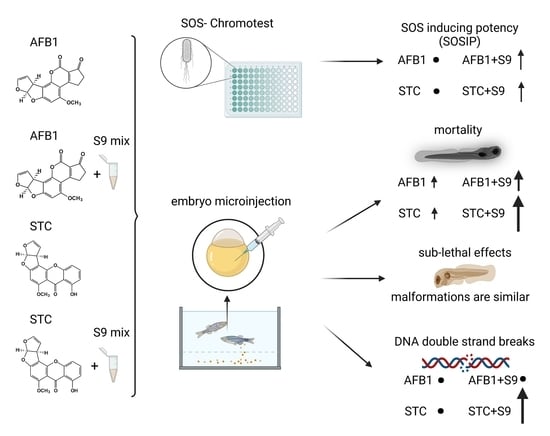
1. Introduction
2. Results
2.1. Metabolic Activation
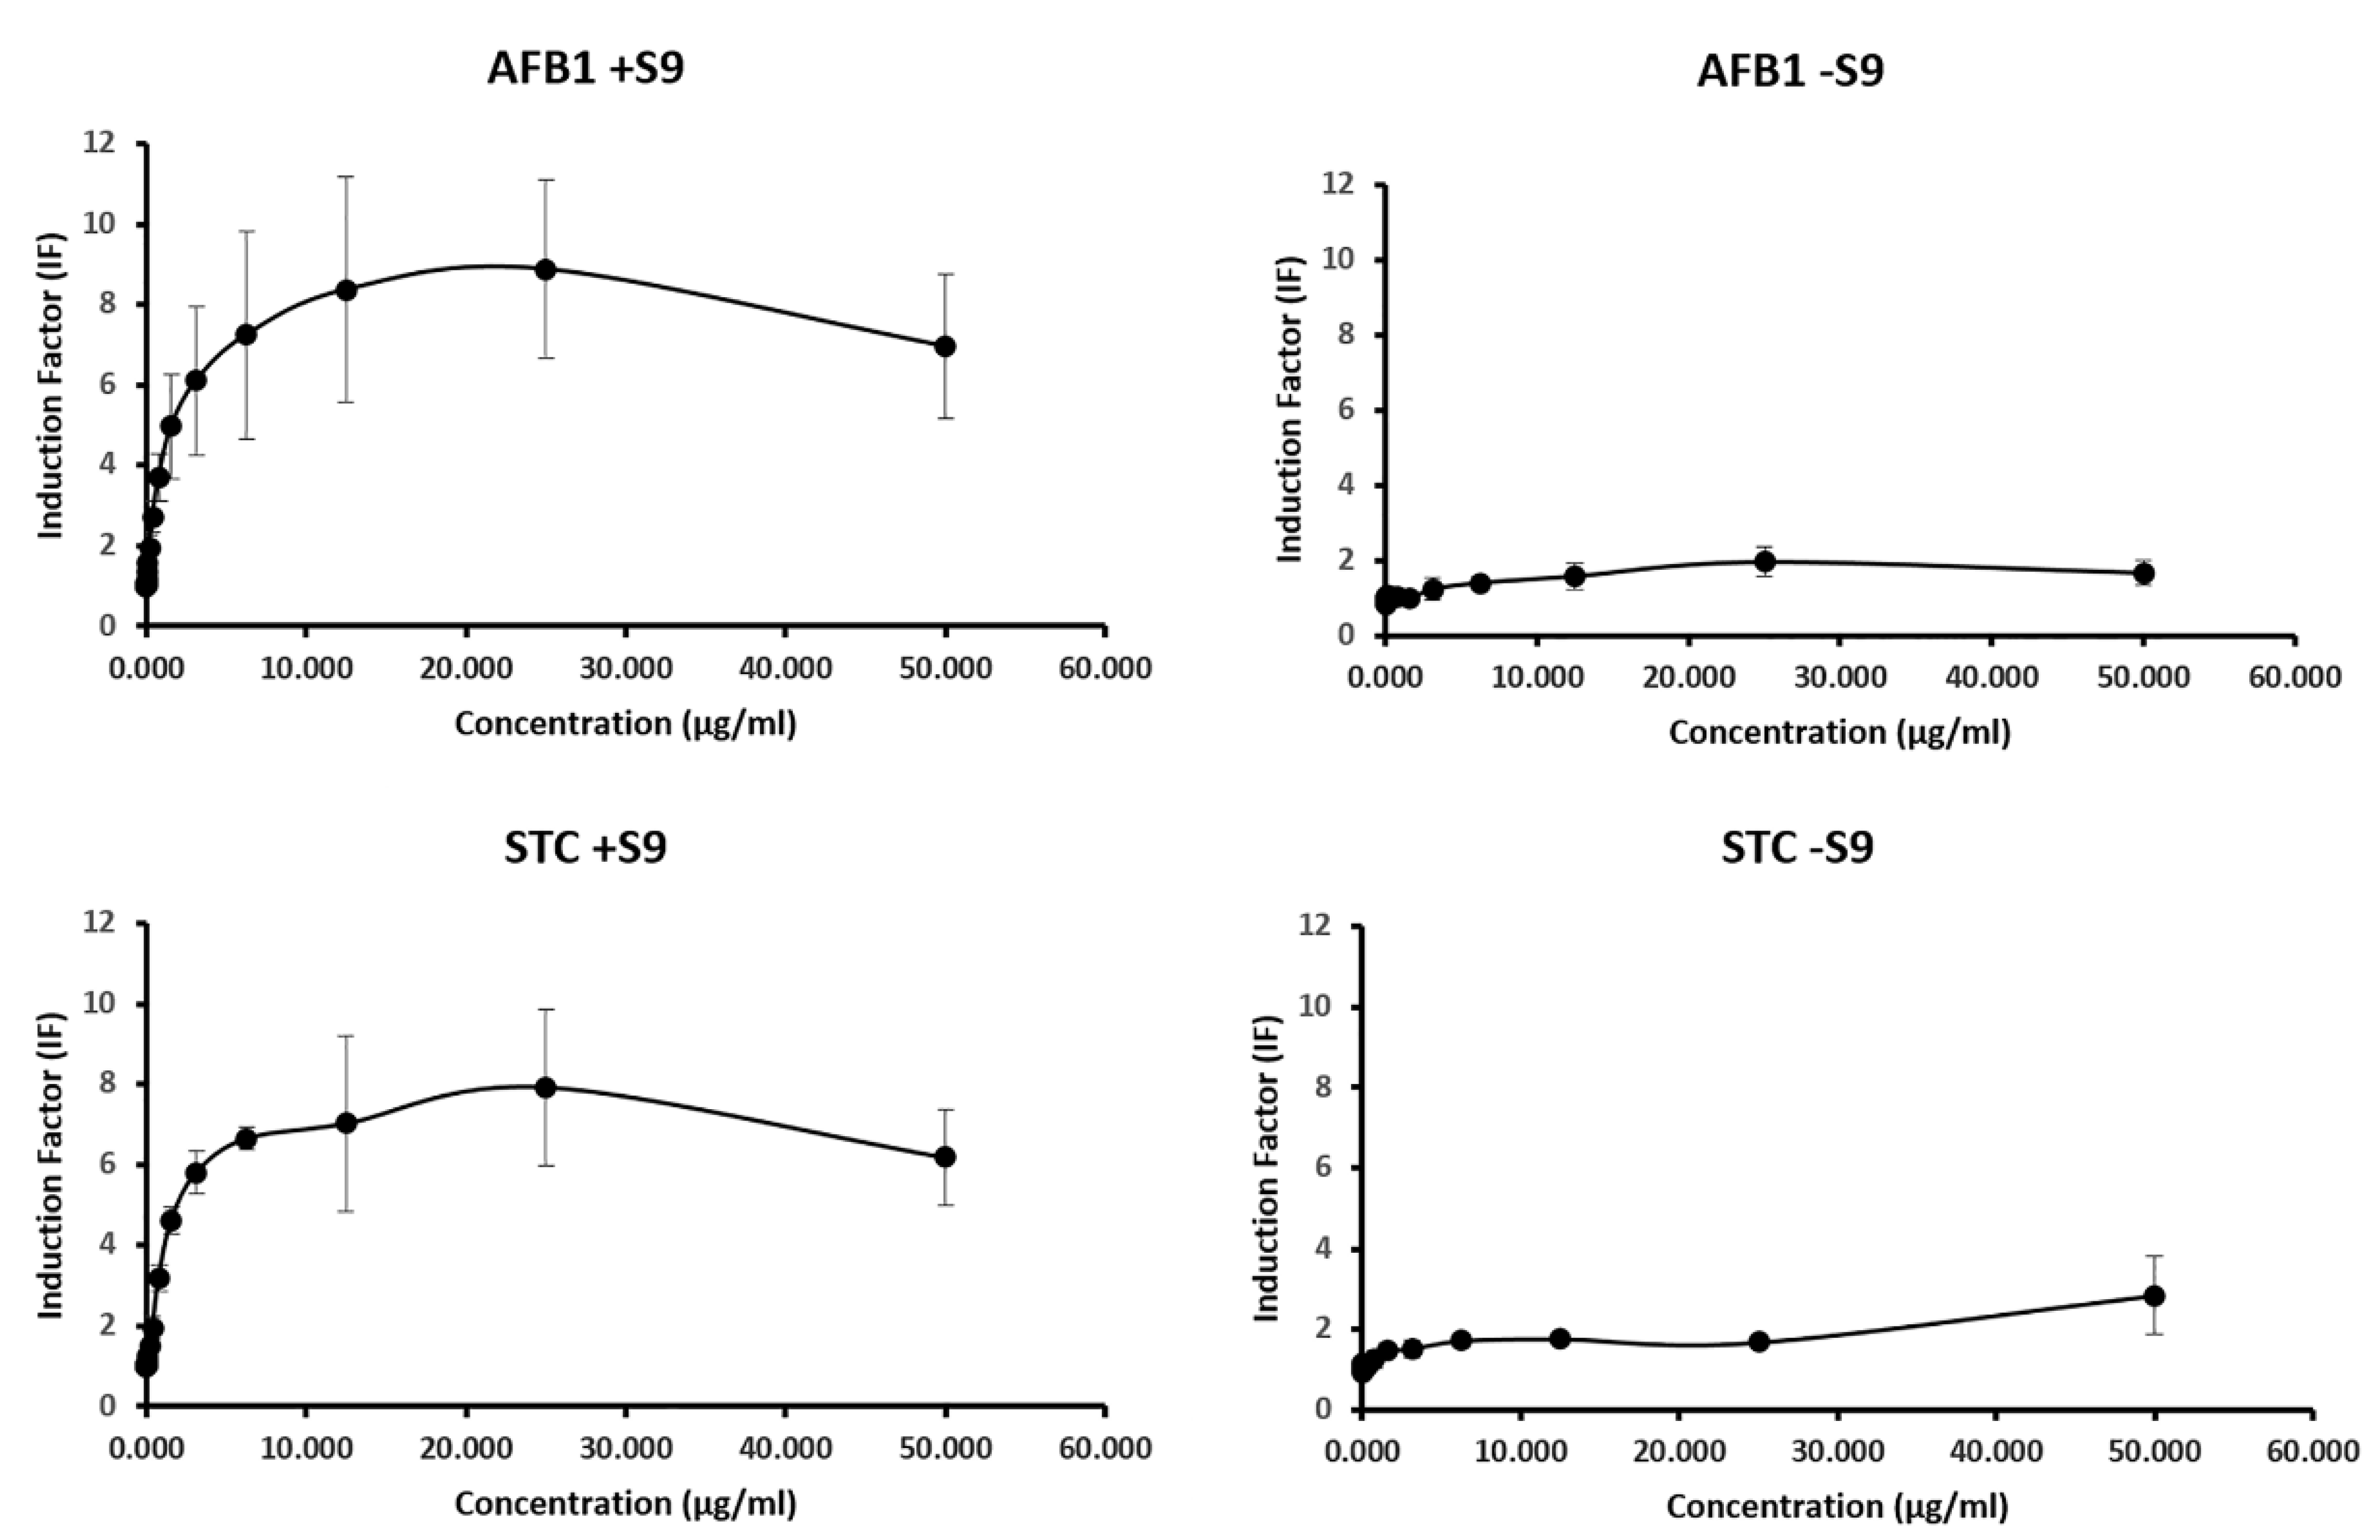
2.2. Genotoxic Potential of AFB1 and STC by SOS Chromotest
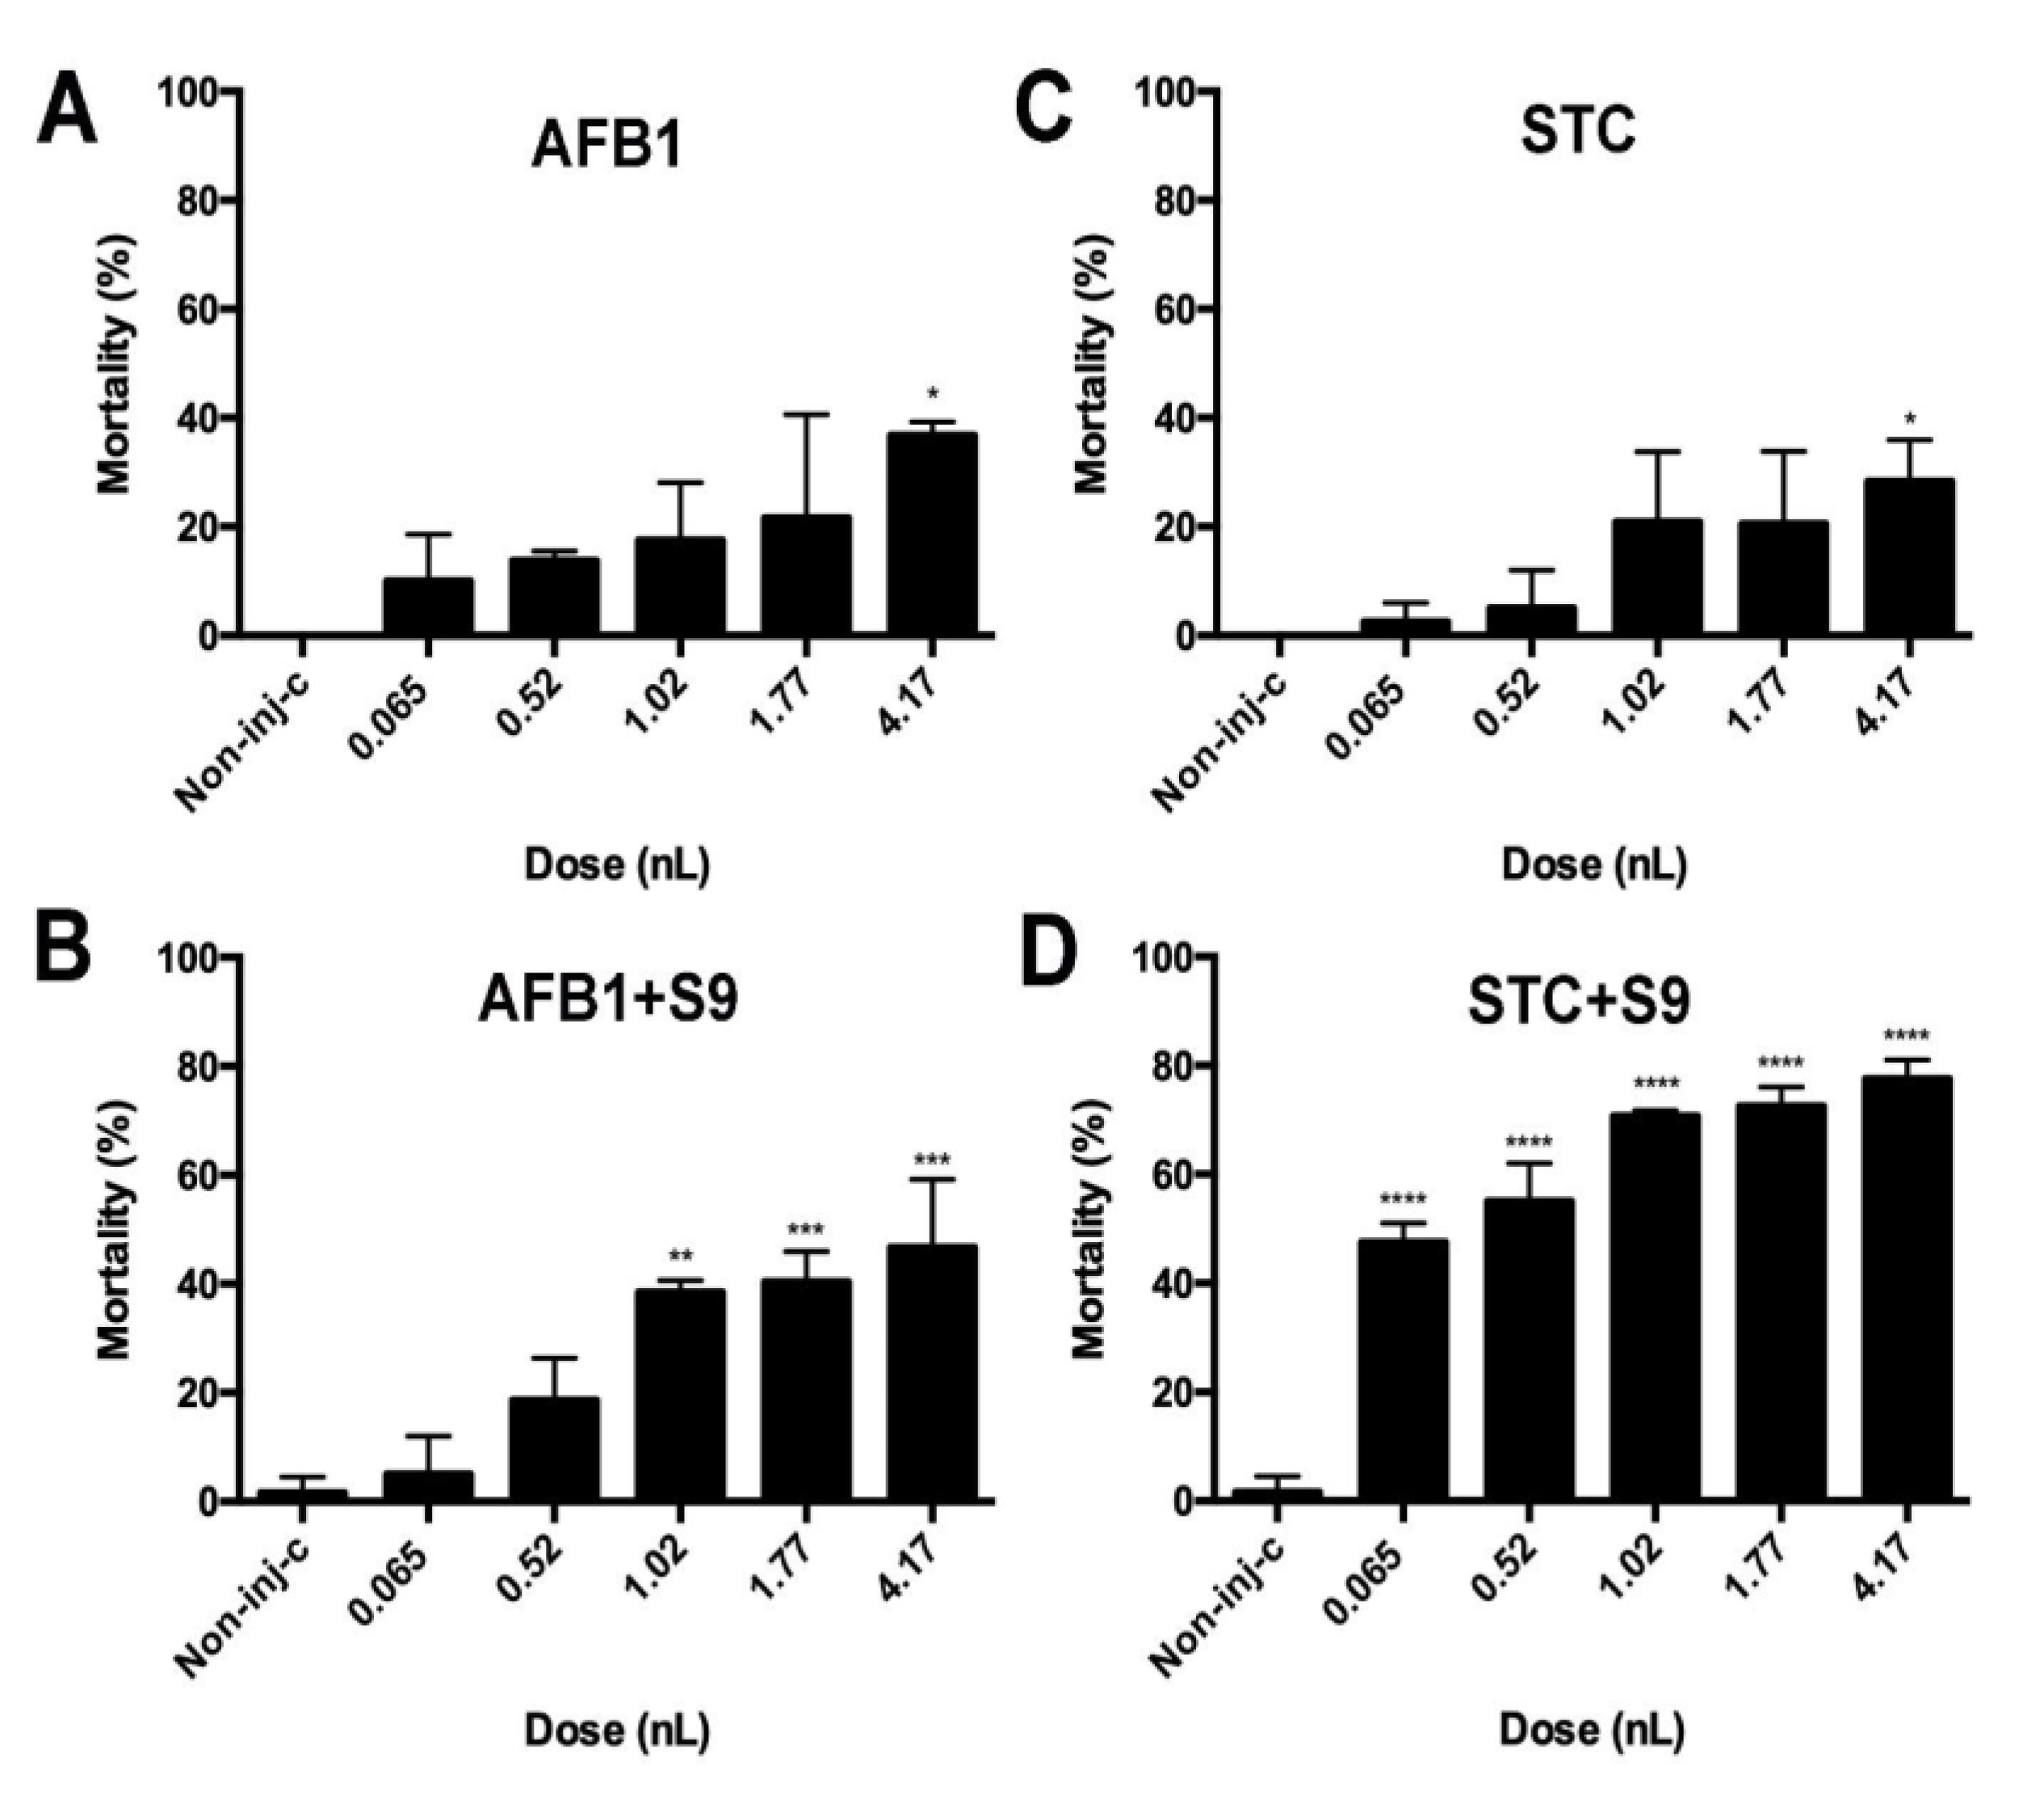
2.3. The Effect of Normal and Metabolically Activated Mycotoxins on the Survival of Microinjected Embryos
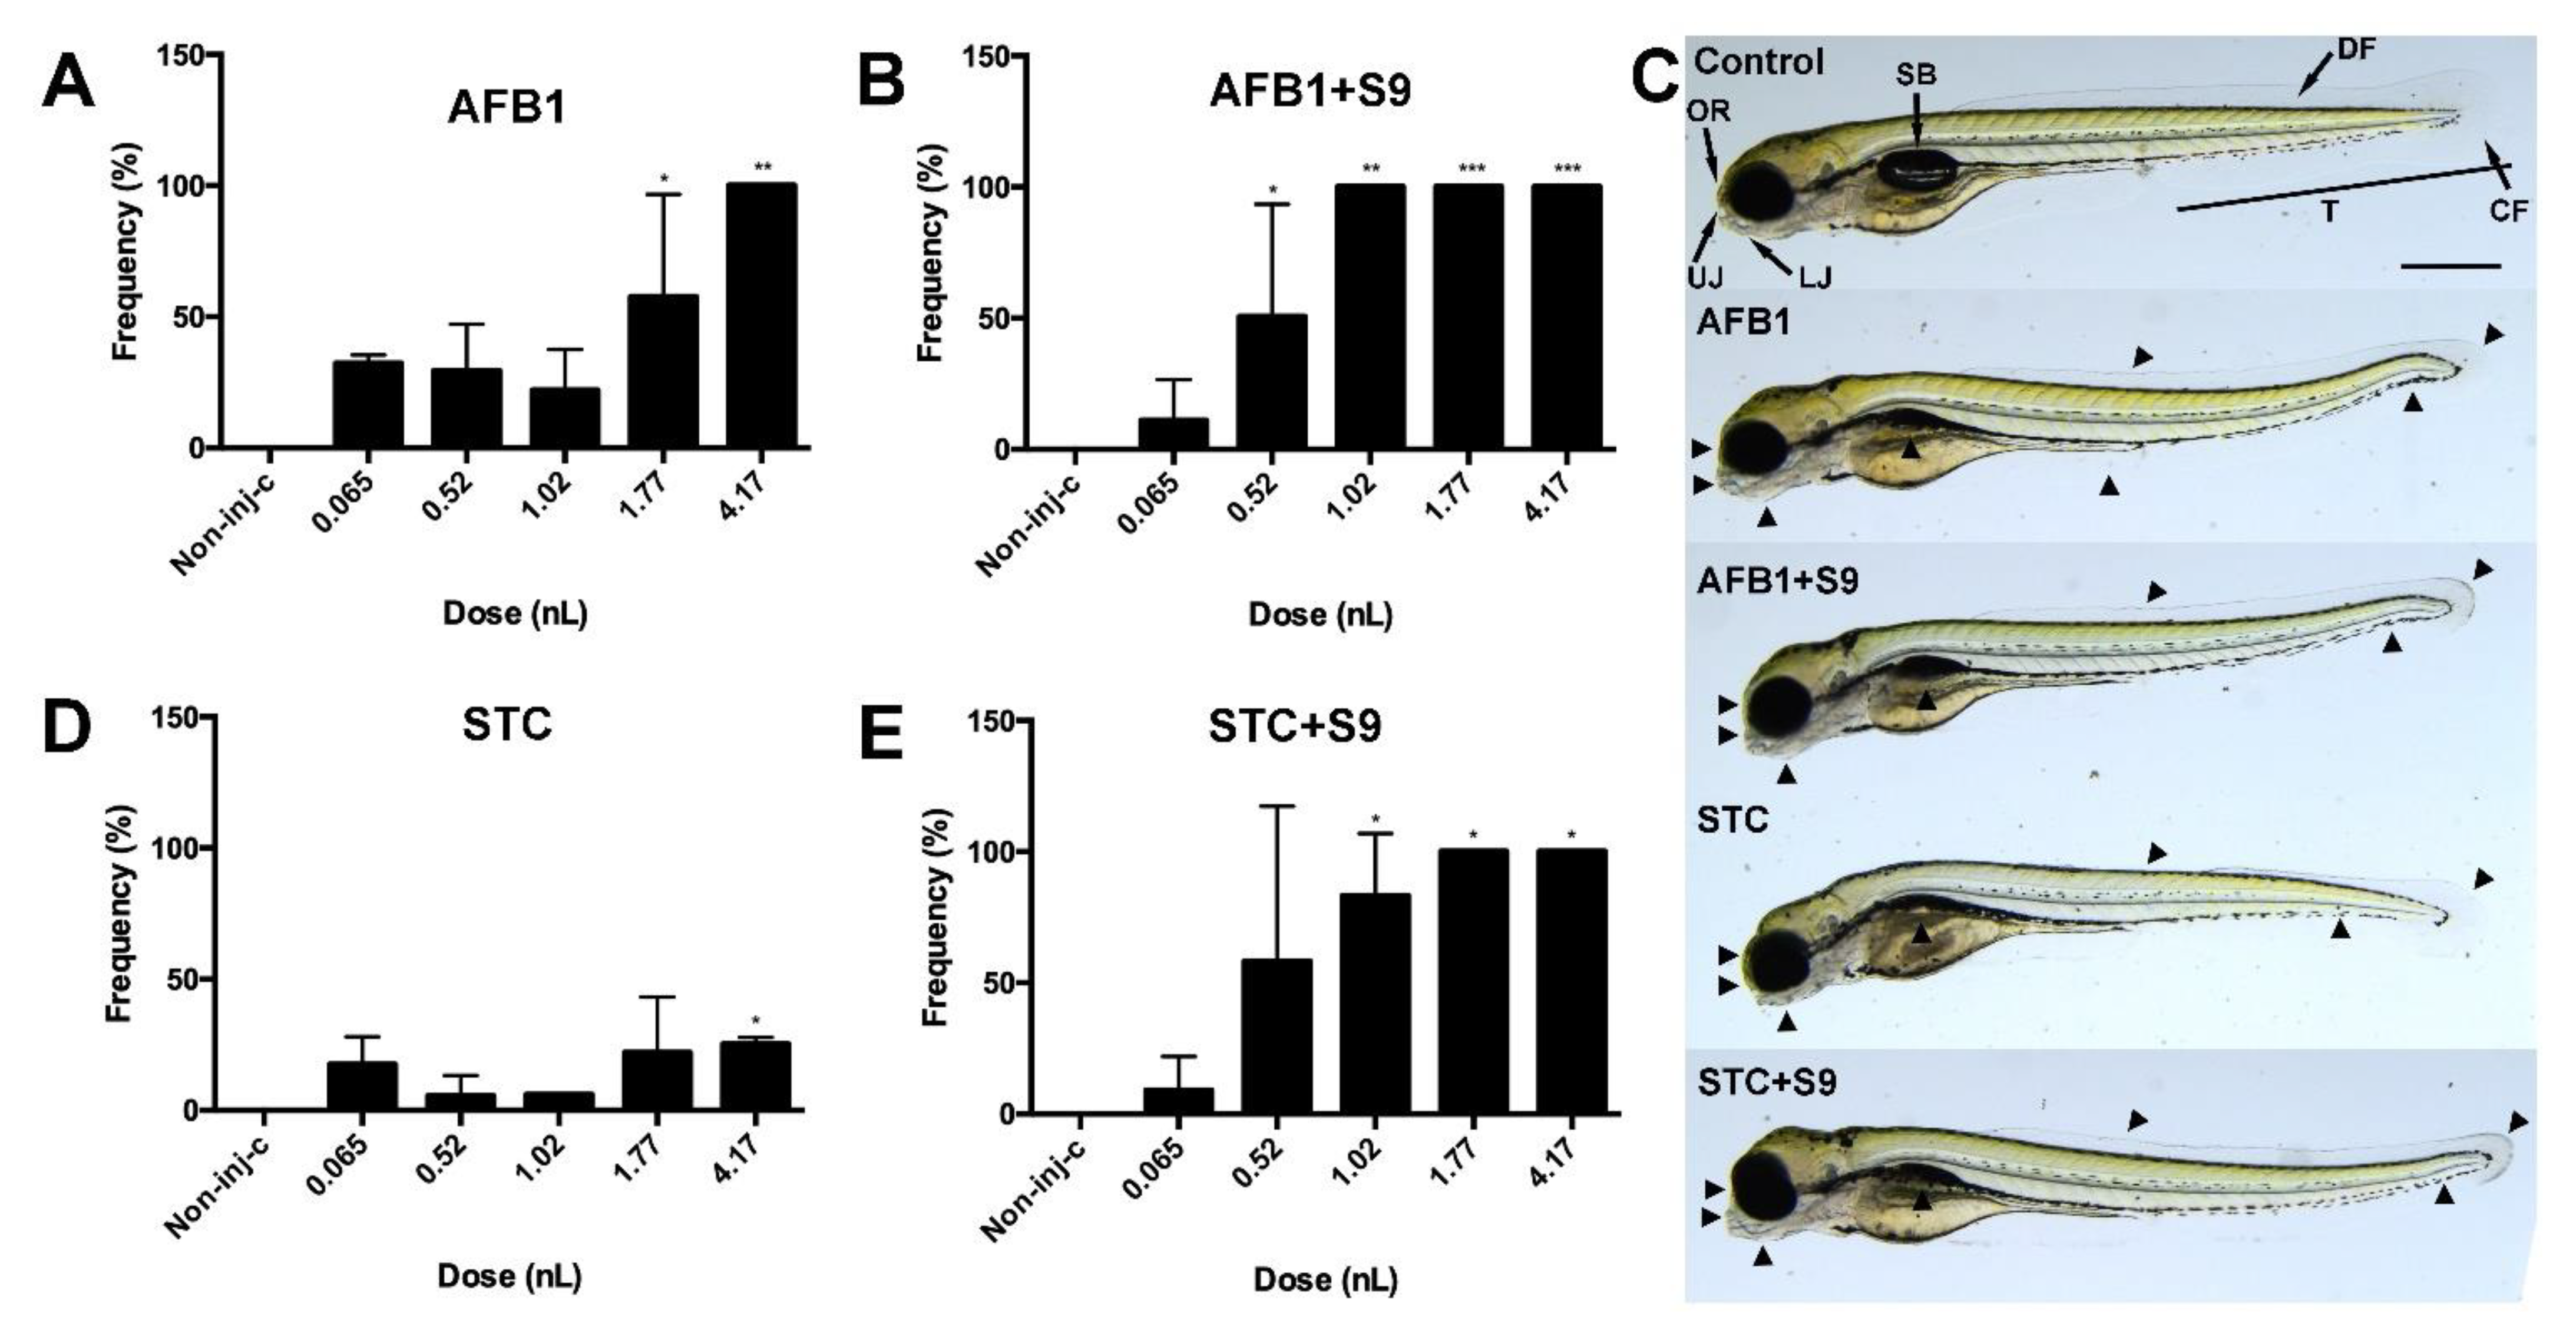
2.4. Sublethal Effects of Normal and Metabolically Activated Mycotoxins in Injected Embryos
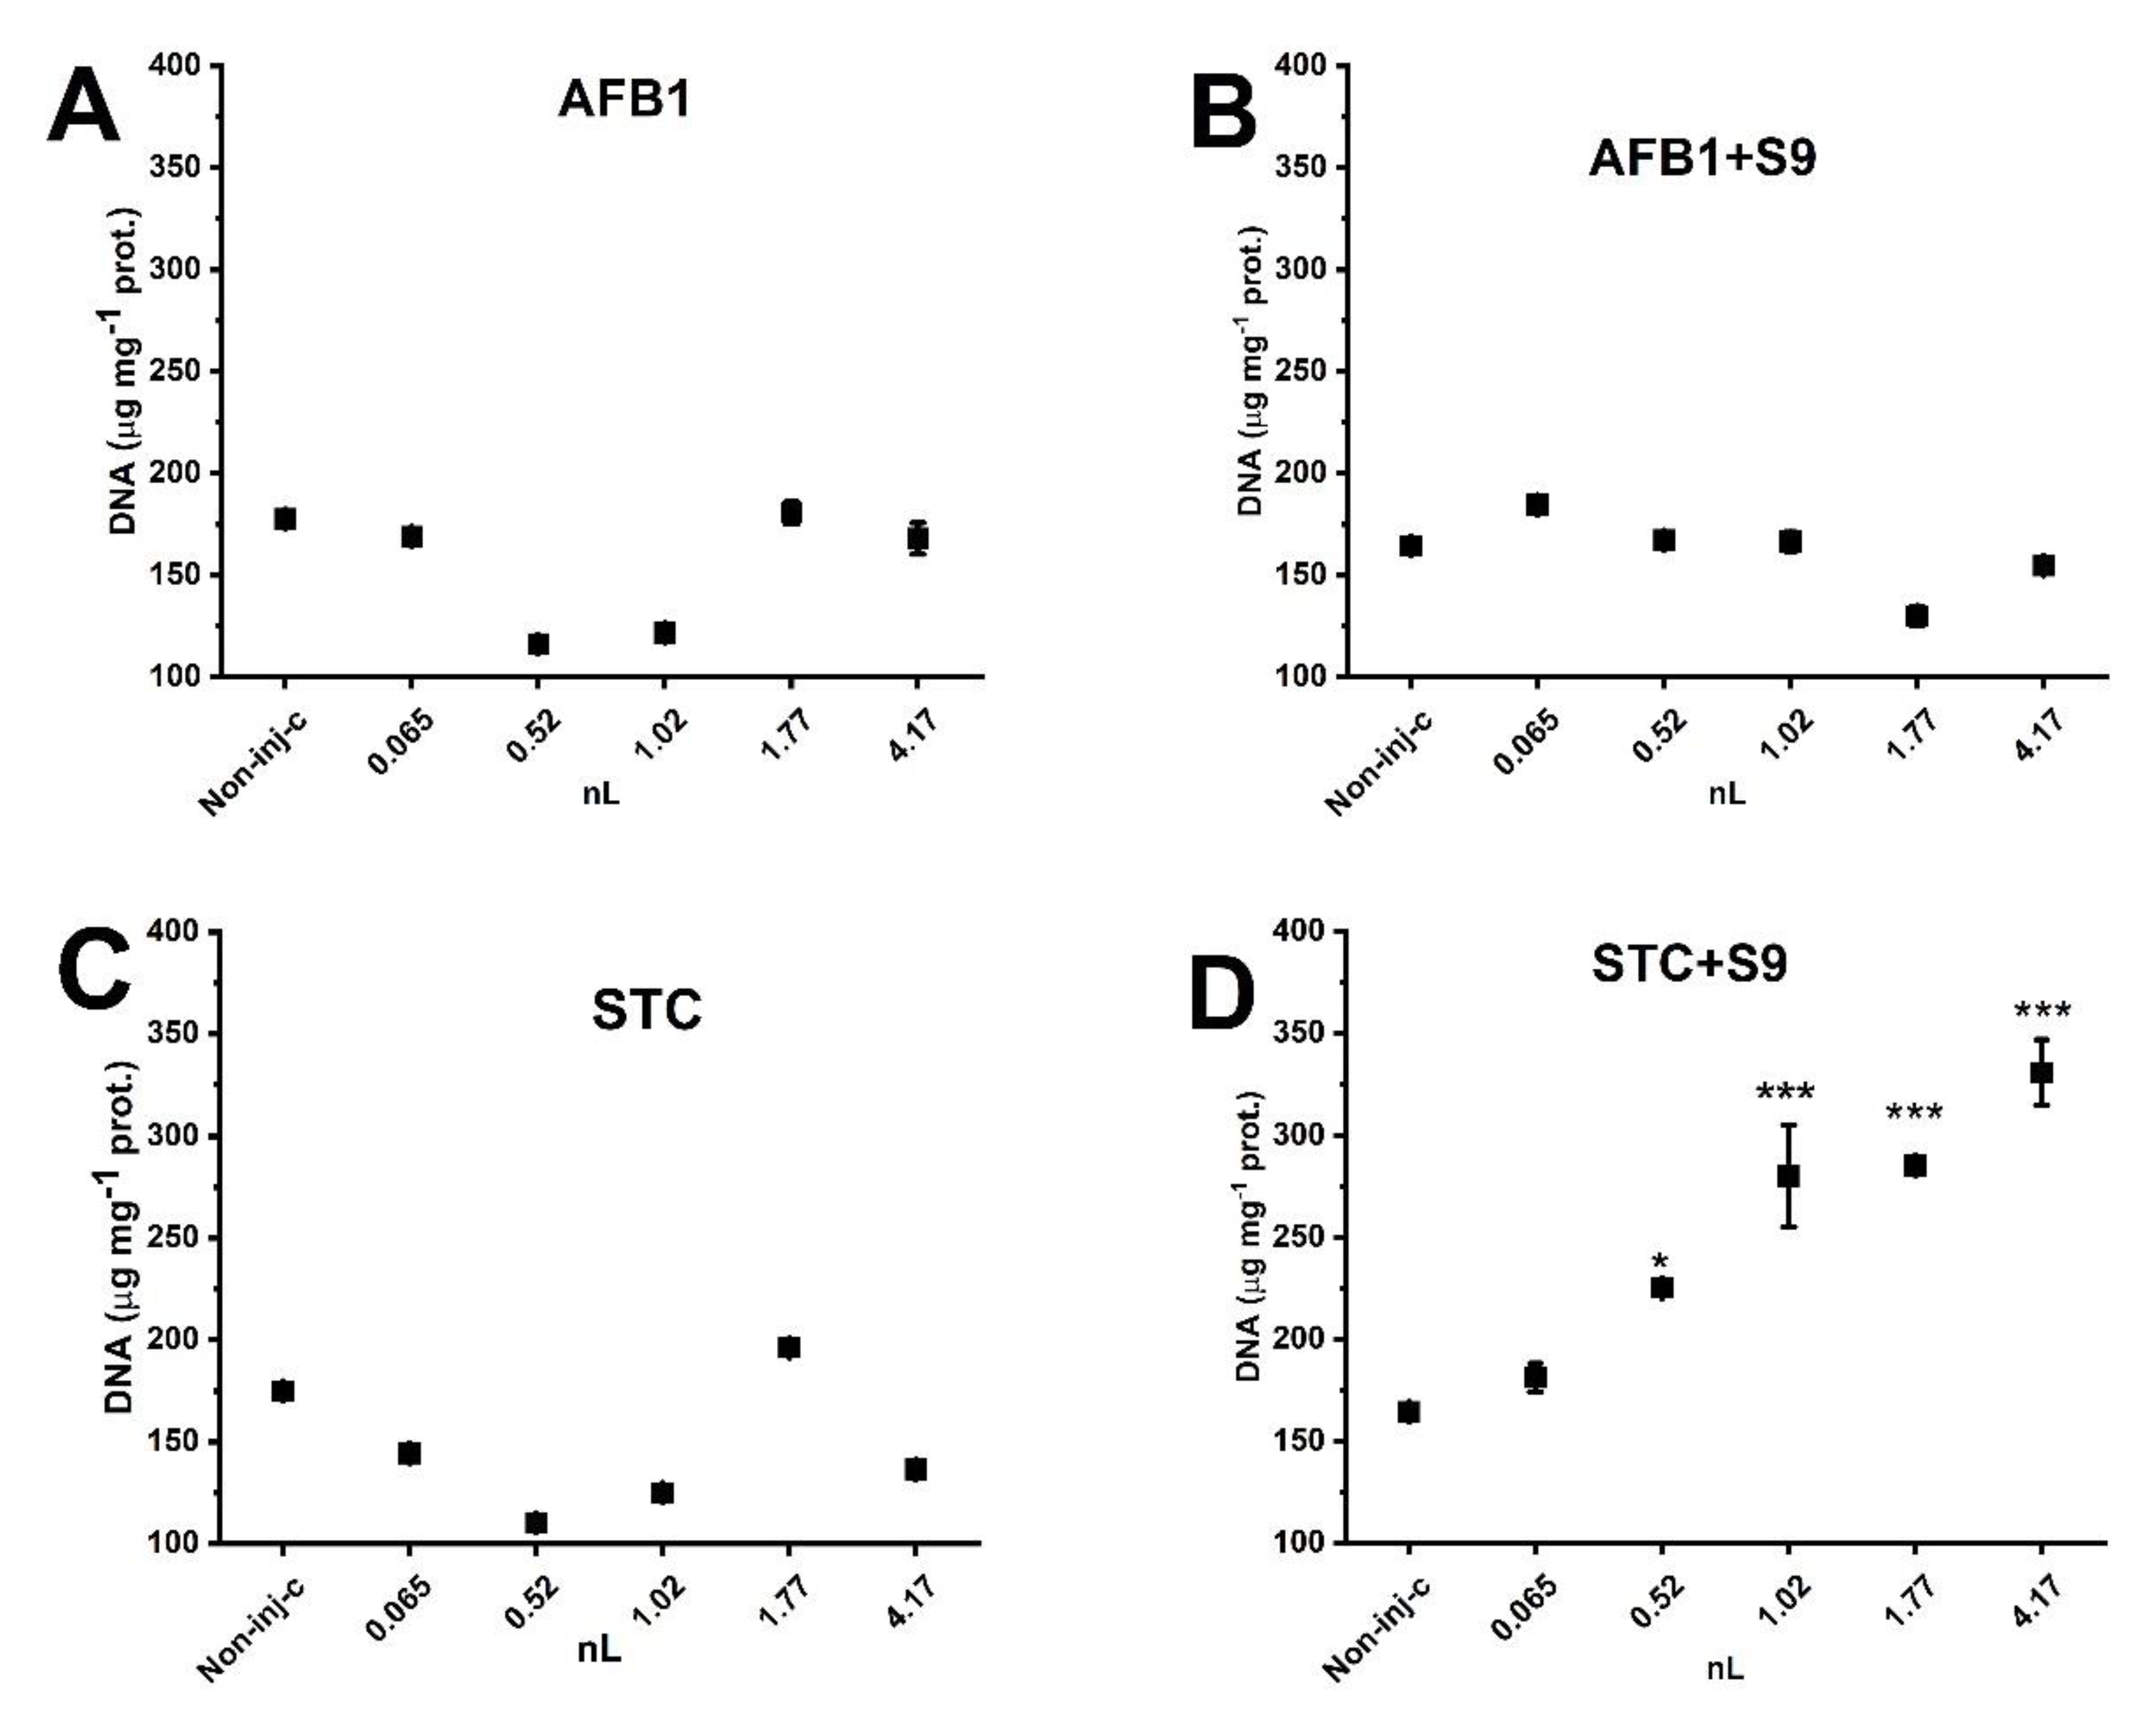
2.5. Effects of Normal and Metabolically Activated Mycotoxins on DNA Double-Strand Breaks
3. Discussion
4. Conclusions
5. Materials and Methods
5.1. Animal Protection
5.2. Mycotoxins
5.3. Metabolic Activation
5.4. Mycotoxin Extraction and Analytical Determination
5.5. Measurement of the Genotoxic Potential of AFB1 and STC Using the SOS Chromotest Kit
5.6. Zebrafish Maintenance and Egg Collection
5.7. Zebrafish Embryo Microinjection
5.8. Examination of Injected Embryos
5.9. Sample Preparation for DNA Damage Measurement
5.10. Statistics
Supplementary Materials
Author Contributions
Funding
Informed Consent Statement
Data Availability Statement
Acknowledgments
Conflicts of Interest
References
- Da Rocha, M.E.B.; Freire, F.D.C.O.; Maia, F.E.F.; Guedes, M.I.F.; Rondina, D. Mycotoxins and their effects on human and animal health. Food Control 2014, 36, 159–165. [Google Scholar] [CrossRef]
- European Commission. Amending Regulation (EC) No 165/2010 of 26 February 2010 amending Regulation (EC) No 1881/2006 setting maximum levels for certain contaminants in foodstuffs as regards aflatoxins. Off. J. Eur. Union 2010, 165, 8–12. [Google Scholar]
- Wu, F. Mycotoxin reduction in Bt corn: Potential economic, health, and regulatory impacts. Transg. Res. 2006, 15, 277–289. [Google Scholar] [CrossRef] [PubMed]
- Nieto, D.C.H.; Granero, A.M.; Zon, M.A.; Fernández, H. Sterigmatocystin: A mycotoxin to be seriously considered. Food Chem. Toxicol. 2018, 118, 460–470. [Google Scholar] [CrossRef] [PubMed]
- Nékám, L.; Polgár, P. The inhibitory effect of a mold upon staphylococcus. Urol. Cutan. Rev. 1948, 52, 372–375. [Google Scholar]
- Hatsuda, Y.; Kuyama, S. Metabolic products of Aspergillus versicolor. I. Cultivation of Aspergillus versicolor and isolation and purification of metabolic products. J. Agric. Chem. Soc. Jpn. 1954, 28, 989. [Google Scholar]
- Bullock, E.; Roberts, J.C.; Underwood, J.G. Studies in mycological chemistry. Part Xl. The structure of isoterigmatocystin and an amended structure for sterigmatocystin. J. Chem. Soc. 1962, 10, 4179–4183. [Google Scholar] [CrossRef]
- Blount, W.P. Turkey “X” disease. Turkeys 1961, 9, 52–77. [Google Scholar]
- Asao, T.; Büchi, G.; Abdel-Kader, M.M.; Chang, S.B.; Wick, E.L.; Wogan, G.N. Aflatoxins B and G. J. Am. Chem. Soc. 1963, 85, 1706–1707. [Google Scholar] [CrossRef]
- Rushing, B.R.; Selim, M.I. Aflatoxin B1: A review on metabolism, toxicity, occurrence in food, occupational exposure, and detoxification methods. Food Chem. Toxicol. 2019, 124, 81–100. [Google Scholar] [CrossRef] [PubMed]
- Zingales, V.; Fernández-Franzón, M.; Ruiz, M.-J. Sterigmatocystin: Occurrence, toxicity and molecular mechanisms of action–A review. Food Chem. Toxicol. 2020, 146, 111802. [Google Scholar] [CrossRef]
- Essigmann, J.M.; Barker, L.J.; Fowler, K.W.; Francisco, M.A.; Reinhold, V.N.; Wogan, G.N. Sterigmatocystin-DNA interactions: Identification of a major adduct formed after metabolic activation in vitro. Proc. Natl. Acad. Sci. USA 1979, 76, 179–183. [Google Scholar] [CrossRef] [PubMed] [Green Version]
- Gopalakrishnan, S.; Liu, X.; Patel, D.J. Solution structure of the covalent sterigmatocystin-DNA adduct. Biochemistry 1992, 31, 10790–10801. [Google Scholar] [CrossRef] [PubMed]
- McCann, J.; Choi, E.; Yamasaki, E.; Ames, B.N. Detection of carcinogens as mutagens in the Salmonella/microsome test: Assay of 300 chemicals. Proc. Natl. Acad. Sci. USA 1975, 72, 5135–5139. [Google Scholar] [CrossRef] [PubMed] [Green Version]
- Baertschi, S.W.; Raney, K.D.; Shimada, T.; Harris, T.M.; Guengerich, F.P. Comparison of rates of enzymatic oxidation of aflatoxin B1, aflatoxin G1, and sterigmatocystin and activities of the epoxides in forming guanyl-N7 adducts and inducing different genetic responses. Chem. Res. Toxicol. 1989, 2, 114–122. [Google Scholar] [CrossRef] [PubMed]
- Krivobok, S.; Olivier, P.H.; Marzin, D.R.; Seigle-Murandi, F.; Steiman, R. Study of the genotoxic potential of 17 mycotoxins with the SOS Chromotest. Mutagensis 1987, 2, 433–439. [Google Scholar] [CrossRef] [PubMed]
- Pfeiffer, E.; Fleck, S.C.; Metzler, M. Catechol formation: A novel pathway in the metabolism of sterigmatocystin and 11-methoxysterigmatocystin. Chem. Res. Toxicol. 2014, 27, 2093–2099. [Google Scholar] [CrossRef] [PubMed]
- Ueda, N.; Fujie, K.; Gotoh-Mimura, K.; Chattopadhyay, S.C.; Sugiyama, T. Acute cytogenetic effect of sterigmatocystin on rat bone-marrow cells in vivo. Mutat. Res. Lett. 1984, 139, 203–206. [Google Scholar] [CrossRef]
- Huang, S.; Wang, J.; Xing, L.; Shen, H.; Yan, X.; Wang, J.; Zhang, X. Impairment of cell cycle progression by sterigmatocystin in human pulmonary cells in vitro. Food Chem. Toxicol. 2014, 66, 89–95. [Google Scholar] [CrossRef] [PubMed]
- Umeda, M.; Tsutsui, T.; Saito, M. Mutagenicity and inducibility of DNA single-strand breaks and chromosome aberrations by various mycotoxins. GANN Jpn. J. Cancer Res. 1977, 68, 619–625. [Google Scholar] [CrossRef]
- IARC. Monographs on the evaluation of carcinogenic risks to humans: Chemical agents and related occupations. A review of human carcinogens. Lyon Fr. Int. Agency Res. Cancer 2012, 100F, 224–248. [Google Scholar]
- Hopkins, J. IARC Monographs on the evaluation of carcinogenic risks to humans: Overall evaluations of carcinogenicity: An updating o IARC Monographs. Lyon Fr. Int. Agency Res. Cancer 1987, 1, 1–403. [Google Scholar]
- Wangikar, P.B.; Dwivedi, P.; Sinha, N.; Sharma, A.K.; Telang, A.G. Effects of aflatoxin B1 on embryo fetal development in rabbits. Food Chem. Toxicol. 2005, 43, 607–615. [Google Scholar] [CrossRef] [PubMed]
- Sur, E.; Celik, I. Effects of aflatoxin B1on the development of the bursa of Fabricius and blood lymphocyte acid phosphatase of the chicken. Br. Poult. Sci. 2003, 44, 558–566. [Google Scholar] [CrossRef] [PubMed]
- Schroeder, H.W.; Kelton, W.H. Production of sterigmatocystin by some species of the genus Aspergillus and its toxicity to chicken embryos. Appl. Microbiol. 1975, 30, 589–591. [Google Scholar] [CrossRef] [PubMed]
- Agag, B.I. Mycotoxins in foods and feeds 1-Aflatoxins. Ass. Univ. Bull. Environ. Res. 2004, 7, 173–205. [Google Scholar]
- Halver, J.E. Aflatoxicosis and rainbow trout hepatoma. In Mycotoxins in Foodstuffs; Wogan, G.N., Ed.; MIT Press: Cambridge, MA, USA, 1965; pp. 209–234. [Google Scholar]
- Butler, J. Acute toxicity of aflatoxin b1 in rats. Br. J. Cancer 1964, 18, 756–762. [Google Scholar] [CrossRef] [Green Version]
- Sahoo, P.K.; Mukherjee, S.C. Immunosuppressive effects of aflatoxin B1 in Indian major carp (Labeo rohita). Comp. Immunol. Microbiol. Infect. Dis. 2001, 24, 143–149. [Google Scholar] [CrossRef]
- Braunbeck, T.; Boettcher, M.; Hollert, H.; Kosmehl, T.; Lammer, E.; Leist, E.; Rudolf, M.; Seitz, N. Towards an alternative for the acute fish LC(50) test in chemical assessment: The fish embryo toxicity test goes multi-species–an update. ALTEX 2005, 22, 87–102. [Google Scholar] [CrossRef]
- Scholz, S.; Fischer, S.; Gundel, U.; Kuster, E.; Luckenbach, T.; Voelker, D. The zebrafish embryo model in environmental risk assessment—applications beyond acute toxicity testing. Environ. Sci. Pollut. Res. Int. 2008, 15, 394–404. [Google Scholar] [CrossRef]
- Nagel, R. DarT: The embryo test with the zebrafish Danio rerio-a general model in ecotoxicology and toxicology. ALTEX 2002, 19 (Suppl. S1), 38–48. [Google Scholar] [PubMed]
- Selderslaghs, I.W.; van Rompay, A.R.; De Coen, W.; Witters, H.E. Development of a screening assay to identify teratogenic and embryotoxic chemicals using the zebrafish embryo. Reprod. Toxicol. 2009, 28, 308–320. [Google Scholar] [CrossRef] [PubMed]
- Weigt, S.; Huebler, N.; Braunbeck, T.; von Landenberg, F.; Broschard, T.H. Zebrafish teratogenicity test with metabolic activation (mDarT): Effects of phase I activation of acetaminophen on zebrafish Danio rerio embryos. Toxicology 2010, 275, 36–49. [Google Scholar] [CrossRef] [PubMed]
- Webster, W.S.; Brown-Woodman, P.D.; Ritchie, H.E. A review of the contribution of whole embryo culture to the determination of hazard and risk in teratogenicity testing. Int. J. Dev. Biol. 1997, 41, 329–335. [Google Scholar] [PubMed]
- Wells, P.G.; Bhuller, Y.; Chen, C.S.; Jeng, W.; Kasapinovic, S.; Kennedy, J.C.; Kim, P.M.; Laposa, R.R.; McCallum, G.P.; Nicol, C.J.; et al. Molecular and biochemical mechanisms in teratogenesis involving reactive oxygen species. Toxicol. Appl. Pharmacol. 2005, 207, 354–366. [Google Scholar] [CrossRef] [PubMed]
- Zhao, J.; Krafft, N.; Terlouw, G.D.C.; Bechter, R. A model combining the whole embryo culture with human liver S-9 fraction for human teratogenic prediction. Toxicol. Vitr. 1993, 7, 827–831. [Google Scholar] [CrossRef]
- Fantel, A.G. Culture of whole rodent embryos in teratogen screening. Teratog. Carcinog. Mutagen. 1982, 2, 231–242. [Google Scholar] [CrossRef]
- Guengerich, F.P. Common and uncommon cytochrome P450 reactions related to metabolism and chemical toxicity. Chem. Res. Toxicol. 2001, 14, 611–650. [Google Scholar] [CrossRef]
- Thompson, E.D.; Burwinkel, K.E.; Chava, A.K.; Notch, E.G.; Mayer, G.D. Activity of Phase I and Phase II enzymes of the benzo [a] pyrene transformation pathway in zebrafish (Danio rerio) following waterborne exposure to arsenite. Comp. Biochem. Physiol. Part C Toxicol. Pharmacol. 2010, 152, 371–378. [Google Scholar] [CrossRef]
- Weigt, S.; Huebler, N.; Strecker, R.; Braunbeck, T.; Broschard, T.H. Zebrafish (Danio rerio) embryos as a model for testing proteratogens. Toxicology 2011, 281, 25–36. [Google Scholar] [CrossRef]
- Thisse, B.; Pflumio, S.; Fürthauer, M.; Loppin, B.; Heyer, V.; Degrave, A.; Woehl, R.; Lux, A.; Steffan, T.; Charbonnier, X.Q.; et al. Expression of the Zebrafish Genome during Embryogenesis (NIH R01 RR15402). ZFIN Direct Data Submission. 2001. ZFIN ID Contains: ZDB-PUB-010810-1. Available online: http://zfin.org (accessed on 8 February 2022).
- Otte, J.C.; Schmidt, A.D.; Hollert, H.; Braunbeck, T. Spatio-temporal development of CYP1 activity in early life-stages of zebrafish (Danio rerio). Aquat. Toxicol. 2010, 100, 38–50. [Google Scholar] [CrossRef] [PubMed]
- Tseng, H.P.; Hseu, T.H.; Buhler, D.R.; Wang, W.D.; Hu, C.H. Constitutive and xenobiotics-induced expression of a novel CYP3A gene from zebrafish larva. Toxicol. Appl. Pharmacol. 2005, 205, 247–258. [Google Scholar] [CrossRef]
- Küster, E.; Altenburger, R. Oxygen decline in biotesting of environmental samplesdis there a need for consideration in the acute zebrafish embryo assay? Environ. Toxicol. Int. J. 2008, 23, 745–750. [Google Scholar] [CrossRef] [PubMed]
- Strecker, R.; Seiler, T.B.; Hollert, H.; Braunbeck, T. Oxygen requirements of zebrafish (Danio rerio) embryos in embryo toxicity tests with environmental samples. Comp. Biochem. Physiol. C Toxicol. Pharmacol. 2011, 153, 318–327. [Google Scholar] [CrossRef] [PubMed]
- Csenki, Z.; Garai, E.; Risa, A.; Cserháti, M.; Bakos, K.; Márton, D.; Urbányi, B. Biological evaluation of microbial toxin degradation by microinjected zebrafish (Danio rerio) embryos. Chemosphere 2019, 227, 151–161. [Google Scholar] [CrossRef] [PubMed]
- Schubert, S.; Keddig, N.; Hanel, R.; Kammann, U. Microinjection into zebrafish embryos (Danio rerio)-a useful tool in aquatic toxicity testing? Environ. Sci. Eur. 2014, 26, 32. [Google Scholar] [CrossRef] [Green Version]
- Walker, M.K.; Hufnagle, L.C.J.; Clayton, M.K.; Peterson, R.E. An egg injection method for assessing early life stage mortality of polychlorinated dibenzo-p-dioxins, dibenzofurans, and biphenyls in rainbow trout, (Onchorhynchus mykiss). Aquat. Toxicol. 1992, 22, 15–38. [Google Scholar] [CrossRef]
- Quillardet, P.; de Bellecombe, C.; Hofnung, M. The SOS Chromotest, a colorimetric bacterial assay for genotoxins: Validation study with 83 compounds. Mutat. Res. 1985, 147, 79–95. [Google Scholar] [CrossRef]
- EFSA Panel on Plant Protection Products and their Residues (PPR). Guidance on tiered risk assessment for plant protection products for aquatic organisms in edge-of-field surface waters. EFSA J. 2013, 11, 3290. [Google Scholar]
- Tang, T.; Friedman, M.A. Carcinogen activation by human liver enzymes in the Ames mutagenicity test. Mutat. Res. 1977, 46, 387–394. [Google Scholar] [CrossRef]
- Kuczuk, M.H.; Benson, P.M.; Heath, H.; Hayes, A.W. Evaluation of the mutagenic potential of mycotoxins using Salmonella typhimurium and Saccharomyces cerevisiae. Mutat. Res. 1978, 53, 11–20. [Google Scholar] [CrossRef]
- Zingales, V.; Torriero, N.; Zanella, L.; Fernández-Franzón, M.; Ruiz, M.J.; Esposito, M.R.; Cimetta, E. Development of an in vitro neuroblastoma 3D model and its application for sterigmatocystin-induced cytotoxicity testing. Food Chem. Toxicol. 2021, 157, 112605. [Google Scholar] [CrossRef] [PubMed]
- Abdel-Wahhab, M.A.; Hasan, A.M.; Aly, S.E.; Mahrous, K.F. Adsorption of sterigmatocystin by montmorillonite and inhibition of its genotoxicity in the Nile tilapia fish (Oreochromis niloticus). Mutat. Res. 2005, 582, 20–27. [Google Scholar] [CrossRef] [PubMed]
- Gallagher, E.P.; Eaton, D.L. In vitro biotransformation of aflatoxin (AFB1) in channel catfish liver. Toxicol. Appl. Pharmacol. 1995, 132, 82–90. [Google Scholar] [CrossRef] [PubMed]
- Eaton, D.L.; Groopman, J.D. (Eds.) The Toxicology of Aflatoxins. Human Health, Veterinary and Agricultural Significance; Academic Press Inc.: San Diego, CA, USA, 1994. [Google Scholar]
- Cullen, J.M.; Newberne, P.M. Acute hepatotoxicity of aflatoxins. In The Toxicology of Aflatoxins; Eaton, D.L., Groopman, J.D., Eds.; Academic Press Inc.: San Diego, CA, USA, 1994; pp. 3–26. [Google Scholar]
- Davis, N.D. Sterigmatocystin and other mycotoxins produced by Aspergillus species. J. Food Prot. 1981, 44, 711–714. [Google Scholar] [CrossRef] [PubMed]
- Raisuddin, S. Toxic responses to aflatoxins in a developing host. J. Toxicol. Toxin Rev. 1993, 12, 175–201. [Google Scholar] [CrossRef]
- Roll, R.; Matthiaschk, G.; Korte, A. Embryotoxicity and mutagenicity of mycotoxins. J. Environ. Pathol. Toxicol. Oncol. 1990, 10, 1–7. [Google Scholar]
- Schmidt, R.E.; Panciera, R.J. Effects of aflatoxin on pregnant hamsters and hamster foetuses. J. Comp. Pathol. 1980, 90, 339–347. [Google Scholar] [CrossRef]
- Wangikar, P.B.; Dwivedi, P.; Sharma, A.K.; Sinha, N. Effect in rats of simultaneous prenatal exposure to ochratoxin A and aflatoxin B1. II. Histopathological features of teratological anomalies induced in fetuses. Birth Defects Res. B Dev. Reprod. Toxicol. 2004, 71, 352–358. [Google Scholar] [CrossRef] [PubMed]
- Shuaib, F.M.; Ehiri, J.; Abdullahi, A.; Williams, J.H.; Jolly, P.E. Reproductive health effects of aflatoxins: A review of the literature. Reprod. Toxicol. 2010, 29, 262–270. [Google Scholar] [CrossRef]
- Abdelhamid, A.M. Effect of sterigmatocystin contaminated diets on fish performance. Arch. Anim. Nutr. Berl. 1988, 38, 833–846. [Google Scholar] [CrossRef]
- Mahrous, K.F.; Khalil, W.K.B.; Mahmoud, M.A. Assessment of toxicity and clastogenicity of sterigmatocystin in Egyptian Nile tilapia. Afr. J. Biotechnol. 2006, 5, 1180–1189. [Google Scholar]
- Hendricks, J.D.; Sinnhuber, R.O.; Wales, J.H.; Stack, M.E.; Hsieh, D.P. Hepatocarcinogenicity of sterigmatocystin and versicolorin A to rainbow trout (Salmo gairdneri) embryos. J. Natl. Cancer Inst. 1980, 64, 1503–1509. [Google Scholar] [CrossRef] [PubMed]
- Hatanaka, J.; Doke, N.; Harada, T.; Aikawa, T.; Enomoto, M. Usefulness and rapidity of screening for the toxicity and carcinogenicity of chemicals in medaka, Oryzias latipes. Jpn. J. Exp. Med. 1982, 52, 243–253. [Google Scholar]
- Ivanovics, B.; Gazsi, G.; Reining, M.; Berta, I.; Poliska, S.; Toth, M.; Czimmerer, Z. Embryonic exposure to low concentrations of aflatoxin B1 triggers global transcriptomic changes, defective yolk lipid mobilization, abnormal gastrointestinal tract development and inflammation in zebrafish. J. Hazard. Mater. 2021, 416, 125788. [Google Scholar] [CrossRef]
- Garai, E.; Risa, A.; Varga, E.; Cserháti, M.; Kriszt, B.; Urbányi, B.; Csenki, Z. Evaluation of the Multimycotoxin-Degrading Efficiency of Rhodococcus erythropolis NI1 Strain with the Three-Step Zebrafish Microinjection Method. Int. J. Mol. Sci. 2021, 22, 724. [Google Scholar] [CrossRef] [PubMed]
- Ober, E.A.; Field, H.A.; Stainier, D.Y.R. From endoderm formation to liver and pancreas development in zebrafish. Mech. Dev. 2003, 120, 5–18. [Google Scholar] [CrossRef]
- Tao, T.; Peng, J. Liver development in zebrafish (Danio rerio). J. Genet. Genom. 2009, 36, 325–334. [Google Scholar] [CrossRef]
- OECD. OECD Guidelines for the Testing of Chemicals; Organization for Economic: Paris, France, 2013; pp. 1–22. [Google Scholar]
- Maron, D.M.; Ames, B.N. Revised methods for the Salmonella mutagenicity test. Mutat. Res. 1983, 113, 173–215. [Google Scholar] [CrossRef]
- Risa, A.; Krifaton, C.; Kukolya, J.; Kriszt, B.; Cserháti, M.; Táncsics, A. Aflatoxin B1 and Zearalenone-detoxifying profile of Rhodococcus type strains. Curr. Microbiol. 2018, 75, 907–917. [Google Scholar] [CrossRef]
- Legault, R.; Blaise, C.; Rokosh, D.; Chong-Kit, R. Comparative assessment of the SOS chromotest kit and the Mutatox test with the Salmonella plate incorporation (Ames test) and fluctuation tests for screening genotoxic agents. Environ. Toxicol. Water Qual. 1994, 9, 45–57. [Google Scholar] [CrossRef]
- Quillardet, P.; Huisman, O.; D’Ari, R.; Hofnung, M. SOS Chromotest, a direct assay of induction of an SOS function in Escherichia coli K-12 to measure genotoxicity. Proc. Natl. Acad. Sci. USA 1982, 79, 5971–5975. [Google Scholar] [CrossRef] [Green Version]
- Olive, P.L. DNA precipitation assay: A rapid and simple method for detecting DNA damage in mammalian cells. Environ. Mol. Mutagen. 1988, 11, 487–495. [Google Scholar] [CrossRef] [PubMed]
- Bradford, M.M. A rapid and sensitive method for the quantitation of microgram quantities of protein utilizing the principle of protein-dye binding. Anal. Biochem. 1976, 72, 248–254. [Google Scholar] [CrossRef]


| Samples | Mean Toxin Concentration (µg/mL) |
|---|---|
| STC −S9 | 5.16 ± 0.16 |
| AFB1 −S9 | 5.20 ± 0.18 |
| STC +S9 | 1.46 ± 0.24 |
| AFB1 +S9 | 1.43 ± 0.23 |
| SOSIPin Our Results | SOSIPin the Literature | Reference | |||
|---|---|---|---|---|---|
| +S9 | −S9 | +S9 | −S9 | ||
| AFB1 | 76.96 (±4.91) | 1.28 (±0.45) | 75.0 | n.d. | [50] |
| STC | 75.27 (±7.54) | 1,13 (±0.48) | n.d. | n.d. | - |
Publisher’s Note: MDPI stays neutral with regard to jurisdictional claims in published maps and institutional affiliations. |
© 2022 by the authors. Licensee MDPI, Basel, Switzerland. This article is an open access article distributed under the terms and conditions of the Creative Commons Attribution (CC BY) license (https://creativecommons.org/licenses/by/4.0/).
Share and Cite
Csenki, Z.; Risa, A.; Sárkány, D.; Garai, E.; Bata-Vidács, I.; Baka, E.; Szekeres, A.; Varga, M.; Ács, A.; Griffitts, J.; et al. Comparison Evaluation of the Biological Effects of Sterigmatocystin and Aflatoxin B1 Utilizing SOS-Chromotest and a Novel Zebrafish (Danio rerio) Embryo Microinjection Method. Toxins 2022, 14, 252. https://doi.org/10.3390/toxins14040252
Csenki Z, Risa A, Sárkány D, Garai E, Bata-Vidács I, Baka E, Szekeres A, Varga M, Ács A, Griffitts J, et al. Comparison Evaluation of the Biological Effects of Sterigmatocystin and Aflatoxin B1 Utilizing SOS-Chromotest and a Novel Zebrafish (Danio rerio) Embryo Microinjection Method. Toxins. 2022; 14(4):252. https://doi.org/10.3390/toxins14040252
Chicago/Turabian StyleCsenki, Zsolt, Anita Risa, Dorottya Sárkány, Edina Garai, Ildikó Bata-Vidács, Erzsébet Baka, András Szekeres, Mónika Varga, András Ács, Jeffrey Griffitts, and et al. 2022. "Comparison Evaluation of the Biological Effects of Sterigmatocystin and Aflatoxin B1 Utilizing SOS-Chromotest and a Novel Zebrafish (Danio rerio) Embryo Microinjection Method" Toxins 14, no. 4: 252. https://doi.org/10.3390/toxins14040252
APA StyleCsenki, Z., Risa, A., Sárkány, D., Garai, E., Bata-Vidács, I., Baka, E., Szekeres, A., Varga, M., Ács, A., Griffitts, J., Bakos, K., Bock, I., Szabó, I., Kriszt, B., Urbányi, B., & Kukolya, J. (2022). Comparison Evaluation of the Biological Effects of Sterigmatocystin and Aflatoxin B1 Utilizing SOS-Chromotest and a Novel Zebrafish (Danio rerio) Embryo Microinjection Method. Toxins, 14(4), 252. https://doi.org/10.3390/toxins14040252