Revisiting the HPLC-FLD Method to Quantify Paralytic Shellfish Toxins: C3,4 Quantification and the First Steps towards Validation


Abstract
:
1. Introduction
2. Results
2.1. Method Development and Validation
2.2. Range and Linearity
2.3. LOD and LOQ
2.4. Precision
2.5. Selectivity
2.6. Quantification of Each PST
3. Discussion
4. Materials and Methods
4.1. Reagents and Materials
4.2. Calibration Curves
4.3. Pre-Oxidation Reactions
4.4. Method Description and Equipment
4.5. Statictical Analysis
Supplementary Materials
Author Contributions
Funding
Institutional Review Board Statement
Informed Consent Statement
Data Availability Statement
Conflicts of Interest
References
- Leal, J.F.; Cristiano, M.L.S. Marine Paralytic Shellfish Toxins: Chemical Properties, Mode of Action, Newer Analogues, and Structure–Toxicity Relationship. Nat. Prod. Rep. 2022, 39, 33–57. [Google Scholar] [CrossRef] [PubMed]
- Hoagland, P.; Scatasta, S. The Economic Effects of Harmful Algal Blooms. In Ecology of Harmful Algae; Granéli, E., Turner, J.T., Eds.; Springer: Berlin/Heidelberg, Germany, 2006; pp. 391–402. ISBN 978-3-540-32210-8. [Google Scholar]
- Sanseverino, I.; Conduto, D.; Pozzoli, L.; Dobricic, S.; Lettieri, T. Algal Bloom and Its Economic Impact; European Comission: Brussels, Belgium, 2016.
- Turner, A.D.; Dhanji-Rapkova, M.; Fong, S.Y.; Hungerford, J.; McNabb, P.S.; Boundy, M.J.; Harwood, T. Ultrahigh-Performance Hydrophilic Interaction Liquid Chromatography with Tandem Mass Spectrometry Method for the Determination of Paralytic Shellfish Toxins and Tetrodotoxin in Mussels, Oysters, Clams, Cockles, and Scallops: Collaborative Study. J. AOAC Int. 2020, 103, 533–562. [Google Scholar] [CrossRef] [PubMed]
- Bosch-Orea, C.; Sanchís, J.; Farré, M. Analysis of Highly Polar Marine Biotoxins in Seawater by Hydrophilic Interaction Liquid Chromatography Coupled to High Resolution Mass Spectrometry. Methodsx 2021, 8, 101370. [Google Scholar] [CrossRef] [PubMed]
- Patria, F.P.; Pekar, H.; Zuberovic-Muratovic, A. Multi-Toxin Quantitative Analysis of Paralytic Shellfish Toxins and Tetrodotoxins in Bivalve Mollusks with Ultra-Performance Hydrophilic Interaction LC-MS/MS—An In-House Validation Study. Toxins 2020, 12, 452. [Google Scholar] [CrossRef] [PubMed]
- Hatfield, R.G.; Turner, A.D. Rapid Liquid Chromatography for Paralytic Shellfish Toxin Analysis Using Superficially Porous Chromatography with AOAC Official MethodSM 2005.06. J. AOAC Int. 2012, 95, 1089–1096. [Google Scholar] [CrossRef]
- Turner, A.D.; Hatfield, R.G.; Maskrey, B.H.; Algoet, M.; Lawrence, J.F. Evaluation of the New European Union Reference Method for Paralytic Shellfish Toxins in Shellfish: A Review of Twelve Years Regulatory Monitoring Using Pre-Column Oxidation LC-FLD. Trends Analyt. Chem. 2019, 113, 124–139. [Google Scholar] [CrossRef]
- AOAC Official Method 2005.06. Paralytic Shellfish Poisoning Toxins in Shellfish. Available online: http://www.aoacofficialmethod.org/index.php?main_page=product_info&cPath=1&products_id=261 (accessed on 18 July 2021).
- Lawrence, J.F.; Niedzwiadek, B.; Menard, C. Quantitative Determination of Paralytic Shellfish Poisoning Toxins in Shellfish Using Prechromatographic Oxidation and Liquid Chromatography with Fluorescence Detection: Collaborative Study. J. AOAC Int. 2005, 88, 1714–1732. [Google Scholar] [CrossRef] [PubMed] [Green Version]
- Vale, P.; Ribeiro, I.; Rodrigues, S.M. Workflow of the Pre-Chromatographic ‘Lawrence’ Method for Bivalves Contaminated with Gymnodinium Catenatum’s Paralytic Shellfish Poisoning Toxins. Food Control. 2021, 126, 108081. [Google Scholar] [CrossRef]
- Boyer, G.L.; Sullivan, J.J.; Andersen, R.J.; Taylor, F.; Harrison, P.J.; Cembella, A.D. Use of High-Performance Liquid Chromatography to Investigate the Production of Paralytic Shellfish Toxins by Protogonyaulax Spp. in Culture *. Mar. Biol. 1986, 93, 361–369. [Google Scholar] [CrossRef]
- ICH. Validation of Analytical Procedures: Text and Methodology Q2(R1); ICH: Geneva, Switzerland, 2005. [Google Scholar]
- EURLMB SOP for the Analysis of Paralytic Shellfish Toxins (PST) by Precolumn HPLC-FLD According to OMA AOAC 2005.06. Available online: https://www.aesan.gob.es/en/CRLMB/docs/docs/metodos_analiticos_de_desarrollo/PST_OMA-AOAC2005-06_HPLC-FLD_EURLMB.pdf (accessed on 16 January 2022).
- Ben-Gigirey, B.; Rodríguez-Velasco, M.L.; Gago-Martínez, A. Extension of the Validation of AOAC Official MethodSM 2005.06 for Dc-GTX2,3: Interlaboratory Study. J. AOAC Int. 2012, 95, 111–121. [Google Scholar] [CrossRef] [PubMed]
- Ben-Gigirey, B.; Rodríguez-Velasco, M.L.; Otero, A.; Vieites, J.M.; Cabado, A.G. A Comparative Study for PSP Toxins Quantification by Using MBA and HPLC Official Methods in Shellfish. Toxicon 2012, 60, 864–873. [Google Scholar] [CrossRef] [PubMed]
- Miller, J.N.; Miller, J.C. Statistics and Chemometrics for Analytical Chemistry, 5th.ed; Pearson Education Limited: Essex, UK, 2005; p. 288. [Google Scholar]
- EFSA Marine Biotoxins in Shellfish–Saxitoxin Group. EFSA J. 2009, 1019, 1–76.
- FAO/WHO. Technical Paper on Toxicity Equivalency Factors for Marine Biotoxins Associated with Bivalve Molluscs; FAO/WHO: Geneva, Switzerland, 2016.
- Horwitz, W.; Albert, R. The Horwitz Ratio (HorRat): A Useful Index of Method Performance with Respect to Precision. J. AOAC Int. 2006, 89, 1095–1109. [Google Scholar] [CrossRef] [PubMed]
- Rey, V.; Botana, A.M.; Botana, L.M. Quantification of PSP Toxins in Toxic Shellfish Matrices Using Post-Column Oxidation Liquid Chromatography and Pre-Column Oxidation Liquid Chromatography Methods Suggests Post-Column Oxidation Liquid Chromatography as a Good Monitoring Method of Choice. Toxicon 2017, 129, 28–35. [Google Scholar] [CrossRef] [PubMed]
- Trainer, V.L.; Hardy, F.J.; D’anglada, L.V.; Hilborn, E.D.; Backer, L.C. Integrative Monitoring of Marine and Freshwater Harmful Algae in Washington State for Public Health Protection. Toxins 2015, 7, 1206–1234. [Google Scholar] [CrossRef] [PubMed]
- Botelho, M.J.; Vale, C.; Mota, A.M.; Rodrigues, S.M.; Costa, P.R.; Simões Gonçalves, M.L.S. Matrix Effect on Paralytic Shellfish Toxins Quantification and Toxicity Estimation in Mussels Exposed to Gymnodinium Catenatum. Food Addit. Contam. 2010, 27, 1724–1732. [Google Scholar] [CrossRef] [PubMed] [Green Version]
- Turner, A.D.; Norton, D.M.; Hatfield, R.G.; Morris, S.; Reese, A.R.; Algoet, M.; Lees, D.N. Refinement and Extension of AOAC Method 2005.06 to Include Additional Toxins in Mussels: Single-Laboratory Validation. J. AOAC Int. 2009, 92, 190–207. [Google Scholar] [CrossRef] [PubMed] [Green Version]


| PST | Linear Range (µM) | R (≥) | R2 (≥) | LOD (µM) | LOQ (µM) |
|---|---|---|---|---|---|
| dcGTX2,3 | 0.03–0.91 | 0.9999 | 0.9998 | ≥0.004 | ≥0.01 |
| GTX1,4 | 0.10–0.78 | 0.9996 | 0.9991 | ≥0.02 | ≥0.05 |
| C3,4 | 0.02–0.65 | 0.9995 | 0.9994 | ≥0.006 | ≥0.02 |
| C1,2 | 0.01–0.67 | 1.0000 | 0.9999 | ≥0.003 | ≥0.01 |
| dcSTX | 0.08–1.25 | 0.9997 | 0.9995 | ≥0.005 | ≥0.02 |
| dcNEO | 0.07–1.17 | 0.9997 | 0.9994 | ≥0.02 | ≥0.07 |
| NEO | 0.06–1.01 | 0.9996 | 0.9992 | ≥0.02 | ≥0.06 |
| GTX6 | 0.05–0.81 | 0.9999 | 0.9999 | ≥0.005 | ≥0.02 |
| GTX2,3 | 0.03–0.72 | 0.9999 | 0.9998 | ≥0.004 | ≥0.01 |
| GTX5 | 0.03–0.86 | 1.0000 | 0.9999 | ≥0.004 | ≥0.01 |
| STX | 0.13–1.07 | 0.9990 | 0.9980 | ≥0.03 | ≥0.09 |
| EFSA | AOAC 2005.06 * | FAO/WHO | |||||
|---|---|---|---|---|---|---|---|
| PST | TEF | LOD (µM STX eqv.) (µg STX.2HCl eqv./kg) | LOQ (µM STX eqv.) (µg STX.2HCl eqv./kg) | LOQ (µM STX eqv.) (µg STX.2HCl eqv./kg) † | TEF | LOD (µM STX eqv.) (µg STX.2HCl eqv./kg) | LOQ (µM STX eqv.) (µg STX.2HCl eqv./kg) |
| dcGTX2,3 | 0.4 | 1.6 × 10⁻³ 4.8 × 100 | 5.2 × 10⁻³ 1.5 × 101 | --- 2.8 × 101 ‡ | 0.4 | 1.6 × 10⁻³ 4.8 × 100 | 5.2 × 10⁻³ 1.5 × 101 |
| GTX1,4 | 1.0 | 1.6 × 10⁻² 9.5 × 101 | 5.4 × 10⁻² 3.2 × 10² | --- 5.0 × 101 | 1.0 | 1.6 × 10⁻² 9.5 × 101 | 5.4 × 10⁻² 3.2 × 10² |
| C3,4 | 0.1 | 6.0 × 10⁻⁴ 5.4 × 100 | 1.9 × 10⁻³ 1.7 × 101 | --- 7.3 × 10² | 0.1 | 6.0 × 10⁻⁴ 5.4 × 100 | 1.9 × 10⁻³ 1.7 × 101 |
| C1,2 | 0.1 | 3.0 × 10⁻⁴ 8.9 × 10⁻¹ | 1.1 × 10⁻³ 3.3 × 100 | --- 9.3 × 101 | 0.1 | 3.0 × 10⁻⁴ 8.9 × 10⁻¹ | 1.1 × 10⁻³ 3.3 × 100 |
| dcSTX | 1.0 | 5.0 × 10⁻³ 1.5 × 101 | 1.8 × 10⁻² 5.4 × 101 | --- 8.0 × 100 | 0.5 | 2.5 × 10⁻³ 7.4 × 100 | 9.0 × 10⁻³ 2.7 × 101 |
| dcNEO | 0.4 | 9.2 × 10⁻³ 6.8 × 101 | 3.0 × 10⁻² 2.2 × 10² | --- --- | 0.2 | 4.6 × 10⁻³ 3.4 × 101 | 1.5 × 10⁻² 1.1 × 10² |
| NEO | 1.0 | 1.7 × 10⁻² 1.3 × 10² | 5.5 × 10⁻² 4.1 × 10² | --- 4.0 × 101 | 2.0 | 3.4 × 10⁻² 2.5 × 10² | 1.1 × 10⁻¹ 8.2 × 10² |
| GTX6 | 0.1 | 4.0 × 10⁻⁴ 2.4 × 100 | 1.5 × 10⁻³ 8.9 × 100 | --- --- | 0.05 | 2.0 × 10⁻⁴ 1.2 × 100 | 7.5 × 10⁻⁴ 4.5 × 100 |
| GTX2,3 | 0.6 | 2.4 × 10⁻³ 7.1 × 100 | 7.2 × 10⁻³ 2.1 × 101 | --- 1.3 × 10² | 0.6 | 2.4 × 10⁻³ 7.1 × 100 | 7.2 × 10⁻³ 2.1 × 101 |
| GTX5 | 0.1 | 4.0 × 10⁻⁴ 1.2 × 100 | 1.2 × 10⁻³ 3.6 × 100 | --- 2.7 × 101 | 0.1 | 4.0 × 10⁻⁴ 1.2 × 100 | 1.2 × 10⁻³ 3.6 × 100 |
| STX | 1.0 | 2.8 × 10⁻² 8.3 × 101 | 9.4 × 10⁻² 2.8 × 10² | --- 2.2 × 101 | 1.0 | 2.8 × 10⁻² 8.3 × 101 | 9.4 × 10⁻² 2.8 × 10² |
| PST | Conc. (µg STX.2HCl eqv./g) | RSD intsr. (%) | RSD interm. (%) | HorRat |
|---|---|---|---|---|
| dcGTX2,3 | 0.03–1.08 | ≤0.8 | ≤9.8 | 0.5 |
| GTX1,4 | 0.58–4.63 | ≤2.6 | ≤12.8 | 0.8 |
| C3,4 | 0.02–0.58 | ≤2.6 | ≤14.7 | 0.9 |
| C1,2 | 0.003–0.20 | ≤0.8 | ≤4.0 | 0.1 |
| dcSTX | 0.23–3.72 | ≤1.2 | ≤13.4 | 0.8 |
| dcNEO | 0.22–3.50 | ≤2.3 | ≤22.2 | 1.7 |
| NEO | 0.47–7.55 | ≤3.0 | ≤17.5 | 1.2 |
| GTX6 | 0.03–0.48 | ≤3.6 | ≤6.6 | 0.4 |
| GTX2,3 | 0.05–1.28 | ≤2.6 | ≤12.7 | 0.6 |
| GTX5 | 0.008–0.26 | ≤0.8 | ≤7.2 | 0.3 |
| STX | 0.40–3.18 | ≤2.3 | ≤4.7 | 0.3 |
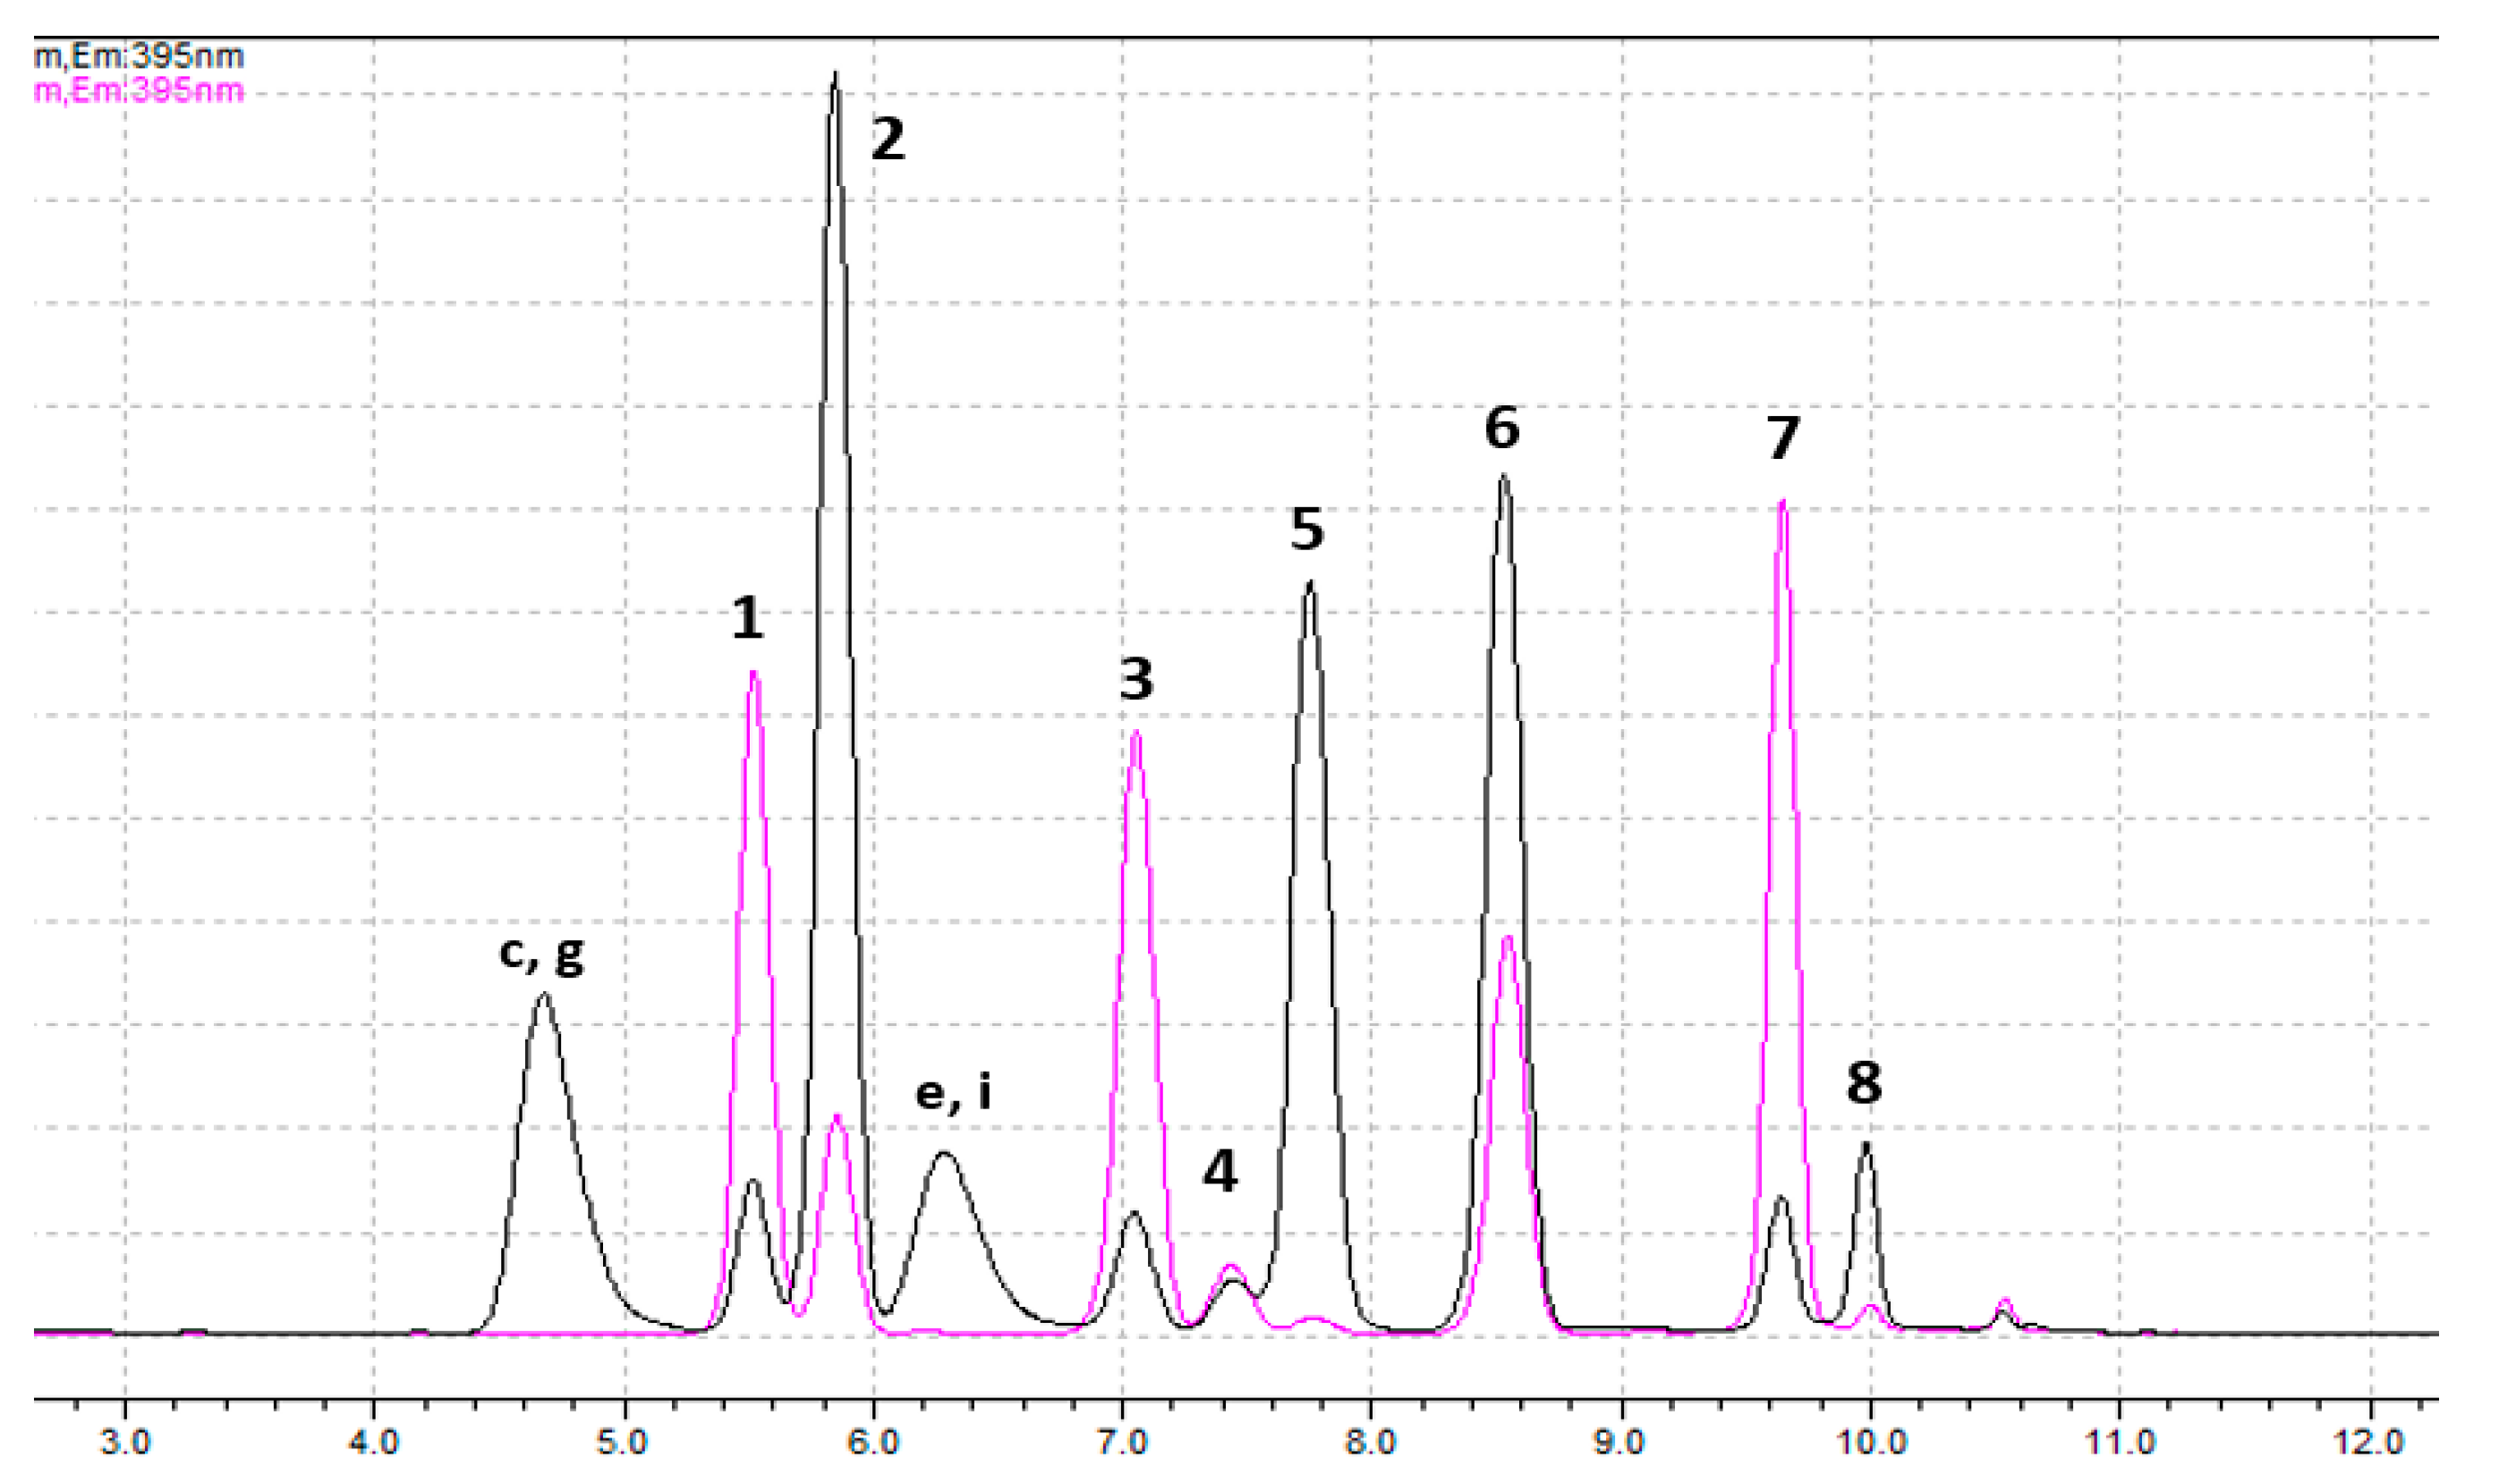
| Rt (Minutes) | Products | Separation—Quantification |
|---|---|---|
| 4.6–4.7 | By-products of GTX1,4 and C3,4 | --- |
| 5.4–5.5 | dcGTX2,3 (1st peak) | SPE-C18—Px |
| 5.8–5.9 | GTX1,4 and C3,4 (and 2nd peak of dcGTX2,3) | C3,4: SPE-C18—SPE-COOH, fraction 1—Pe GTX1,4: SPE-C18—SPE-COOH, fraction 2—Pe dcGTX2,3: SPE-C18—SPE-COOH, fraction 2—Pe * |
| 6.2–6.4 | By-products of NEO and GTX6 | --- |
| 6.9–7.0 | C1,2 | SPE-C18—Px |
| 7.3–7.4 | dcSTX and dcNEO (1st peaks) | dcSTX: SPE-C18—Px dcNEO: SPE-C18—(SPE-COOH, fraction 3)—Pe |
| 7.7–7.8 | NEO and GTX6 (and 2nd peaks of dcSTX and dcNEO) | GTX6: SPE-C18—SPE-COOH, fraction 2—Pe NEO: SPE-C18—SPE-COOH, fraction 3—Pe dcNEO: SPE-C18—SPE-COOH, fraction 3—Pe dcSTX: SPE-C18—SPE-COOH, fraction 3—Pe * |
| 8.3–8.4 | GTX2,3 (and by-products of GTX1,4 and C3,4) | SPE-C18—Px |
| 9.4–9.5 | GTX5 | SPE-C18—Px |
| 9.9–10.0 | STX (and by-products of GTX6 and NEO) | SPE-C18—Px |
Publisher’s Note: MDPI stays neutral with regard to jurisdictional claims in published maps and institutional affiliations. |
© 2022 by the authors. Licensee MDPI, Basel, Switzerland. This article is an open access article distributed under the terms and conditions of the Creative Commons Attribution (CC BY) license (https://creativecommons.org/licenses/by/4.0/).
Share and Cite
Leal, J.F.; Cristiano, M.L.S. Revisiting the HPLC-FLD Method to Quantify Paralytic Shellfish Toxins: C3,4 Quantification and the First Steps towards Validation. Toxins 2022, 14, 179. https://doi.org/10.3390/toxins14030179
Leal JF, Cristiano MLS. Revisiting the HPLC-FLD Method to Quantify Paralytic Shellfish Toxins: C3,4 Quantification and the First Steps towards Validation. Toxins. 2022; 14(3):179. https://doi.org/10.3390/toxins14030179
Chicago/Turabian StyleLeal, Joana F., and Maria L. S. Cristiano. 2022. "Revisiting the HPLC-FLD Method to Quantify Paralytic Shellfish Toxins: C3,4 Quantification and the First Steps towards Validation" Toxins 14, no. 3: 179. https://doi.org/10.3390/toxins14030179
APA StyleLeal, J. F., & Cristiano, M. L. S. (2022). Revisiting the HPLC-FLD Method to Quantify Paralytic Shellfish Toxins: C3,4 Quantification and the First Steps towards Validation. Toxins, 14(3), 179. https://doi.org/10.3390/toxins14030179