Metaproteomics Reveals Alteration of the Gut Microbiome in Weaned Piglets Due to the Ingestion of the Mycotoxins Deoxynivalenol and Zearalenone

 , , , ,
  and
and 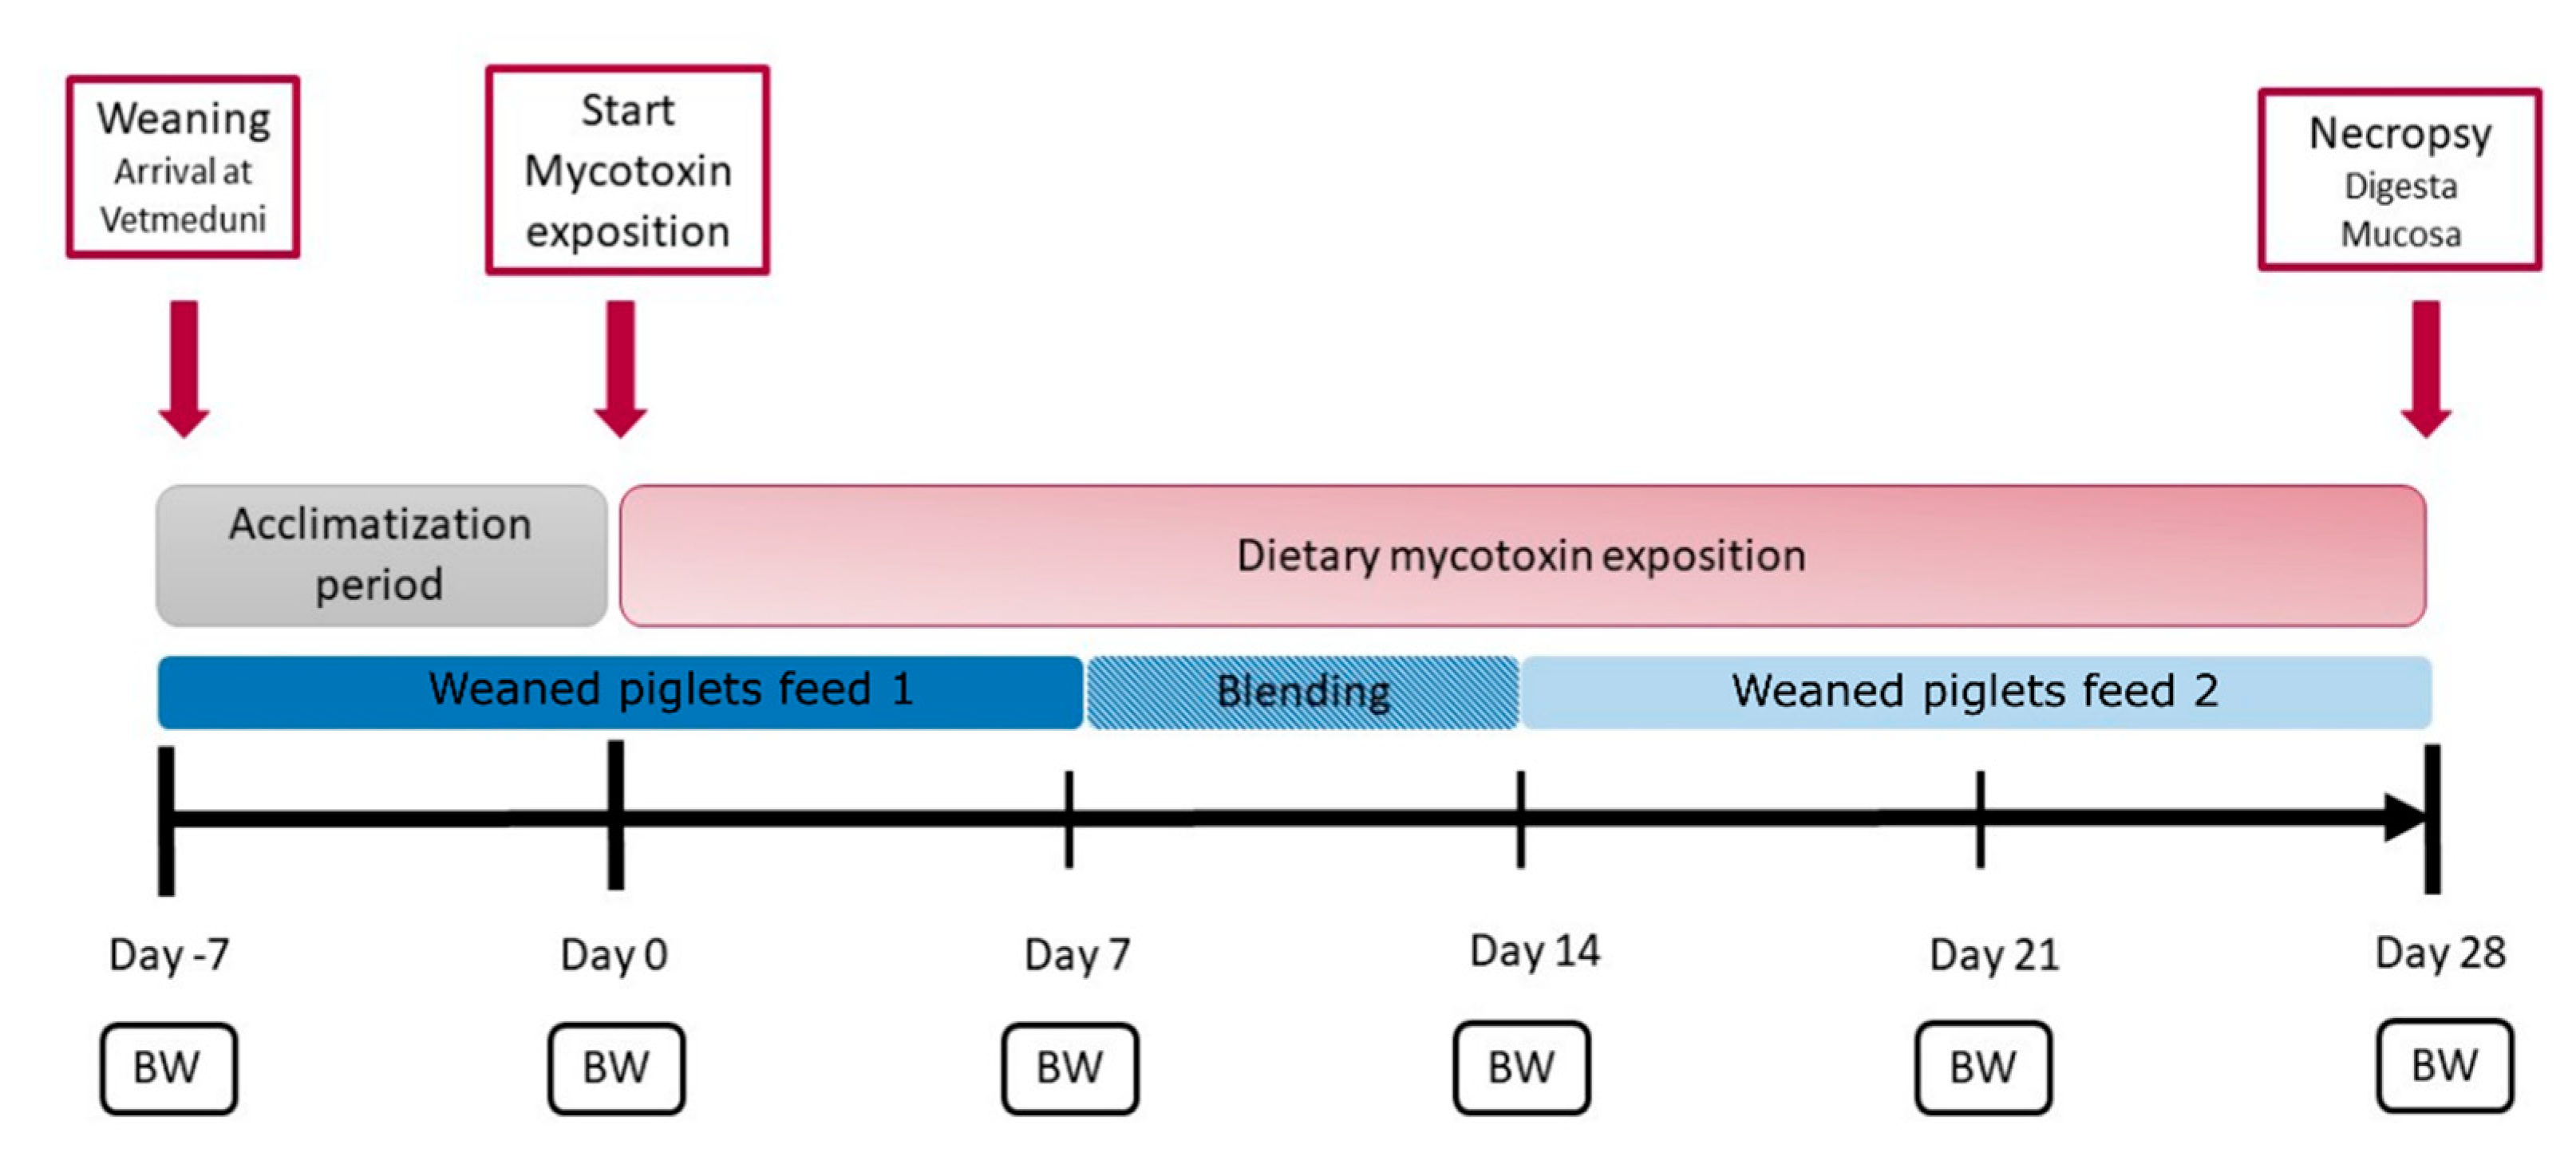
Abstract
:1. Introduction
2. Results
2.1. Effect of the Mycotoxins on the Animal Health
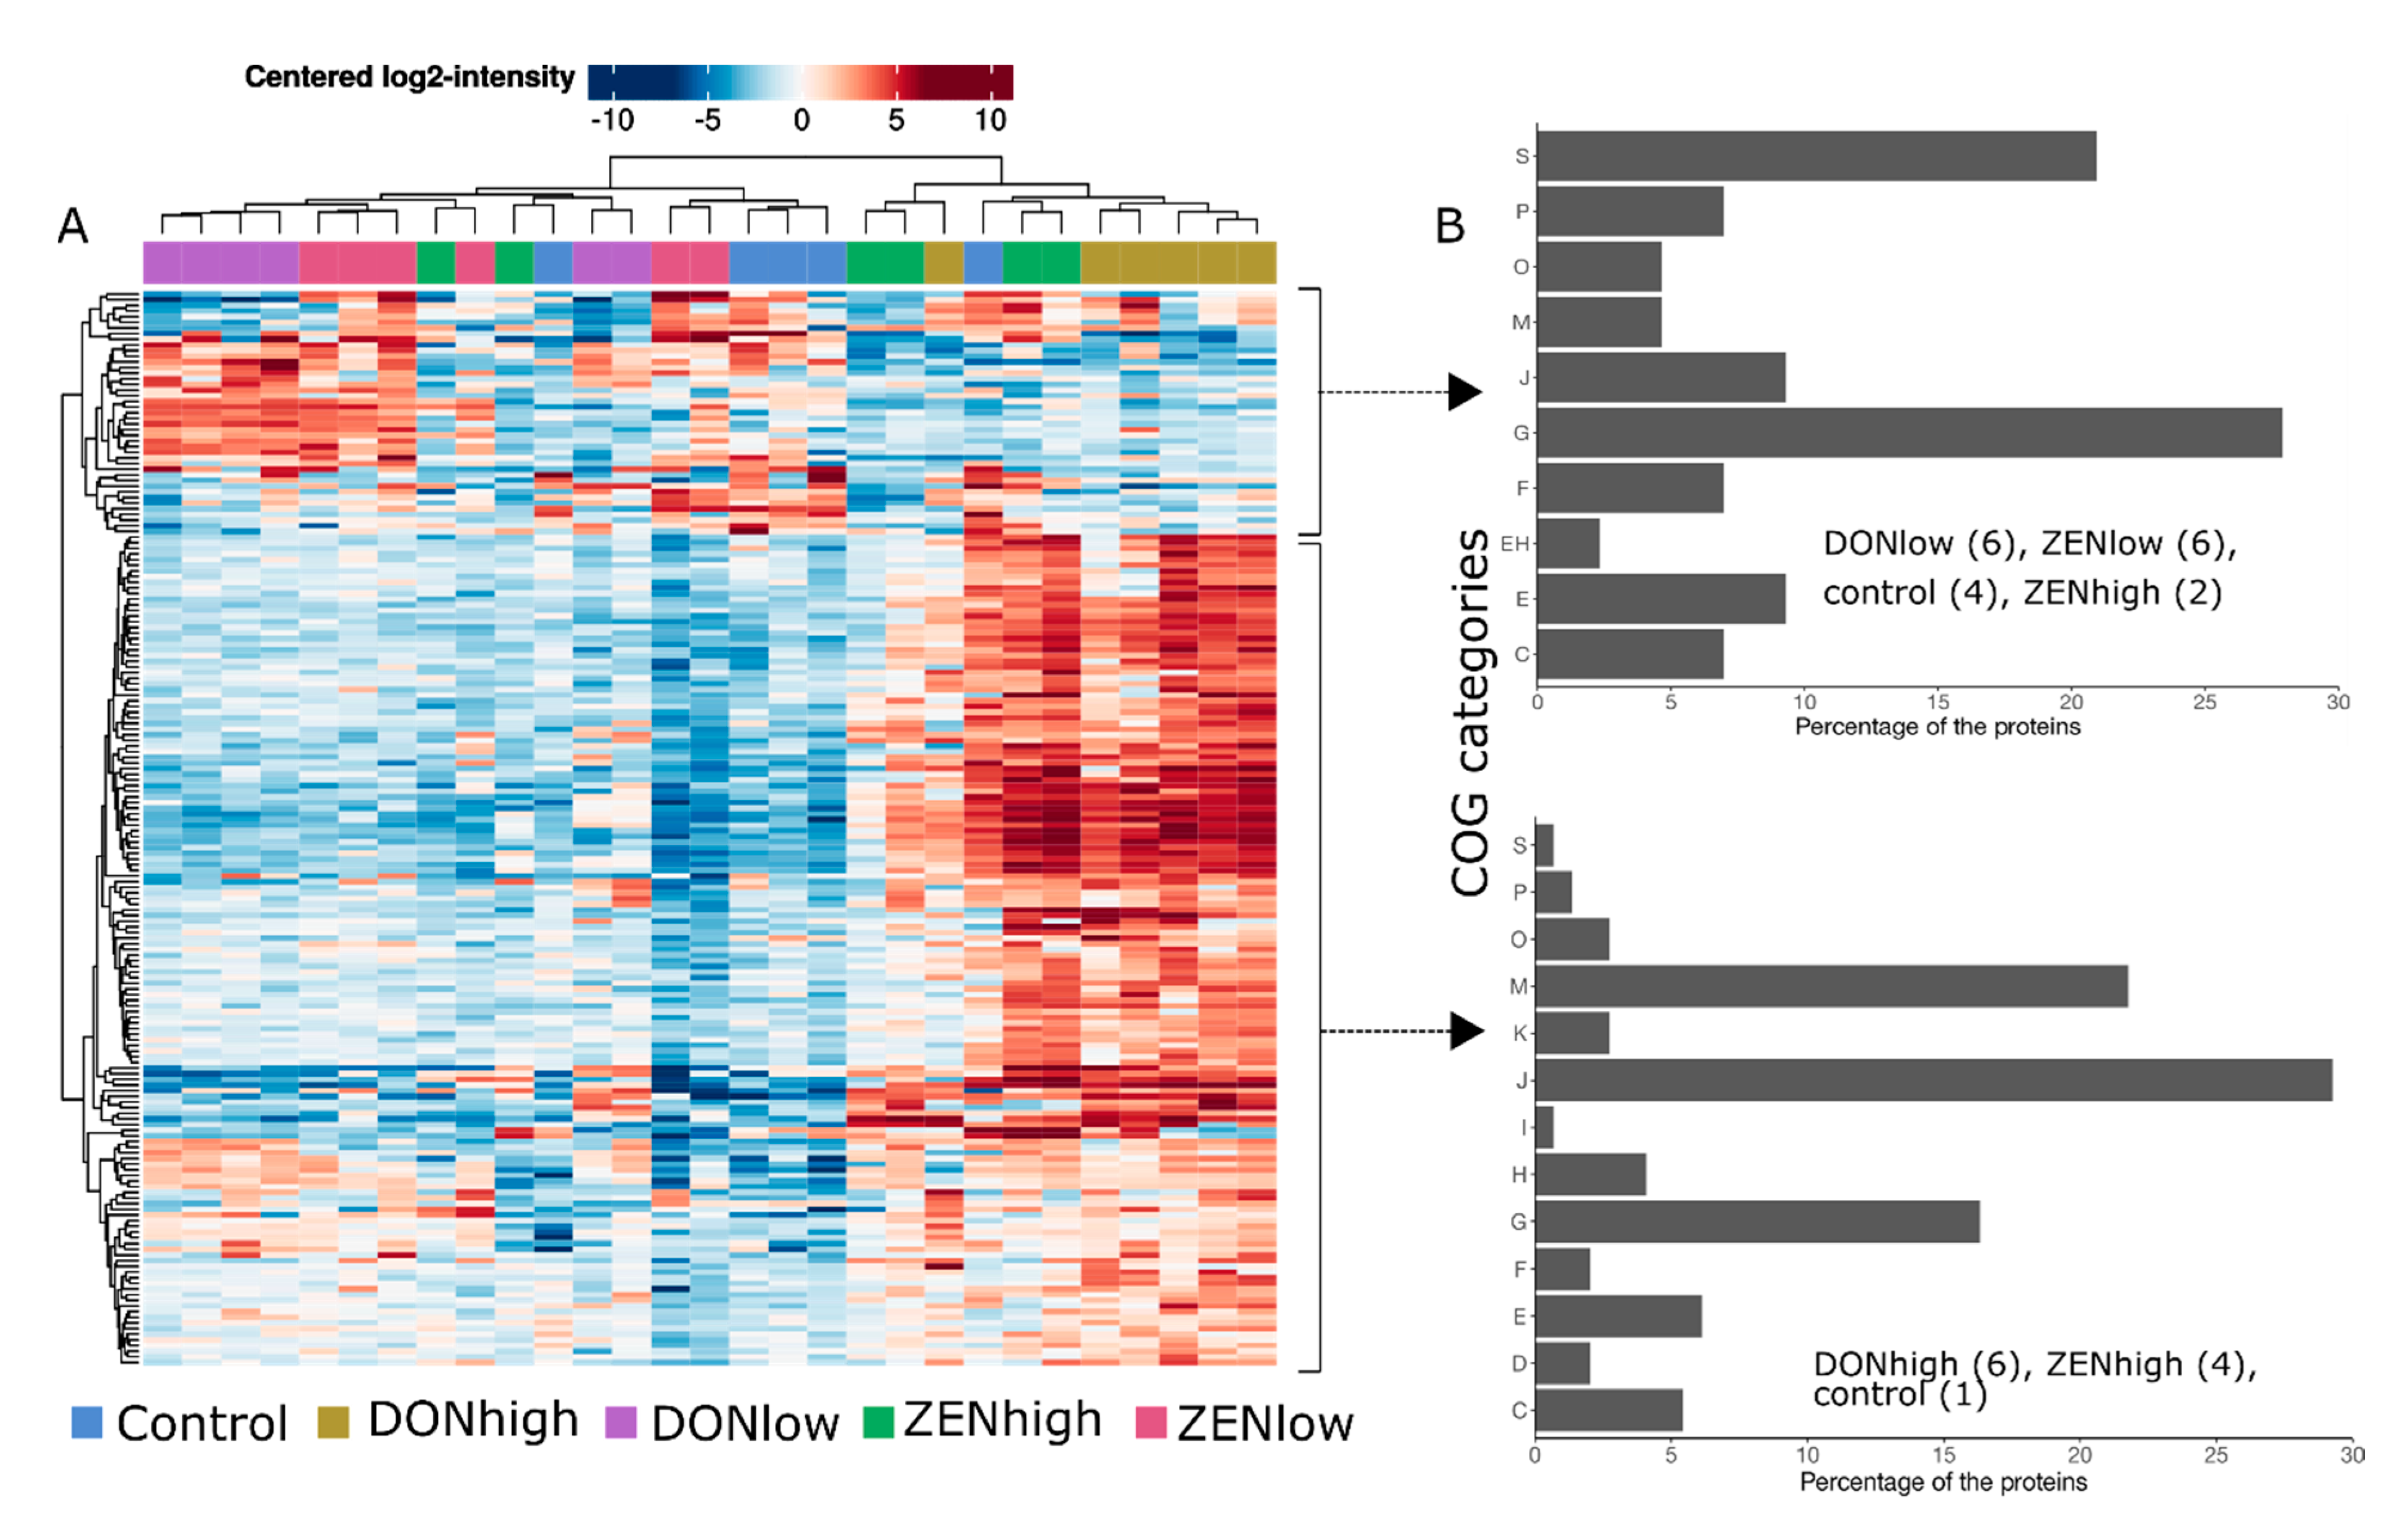
2.2. Effect of the Mycotoxins on the Global Microbial Protein Composition
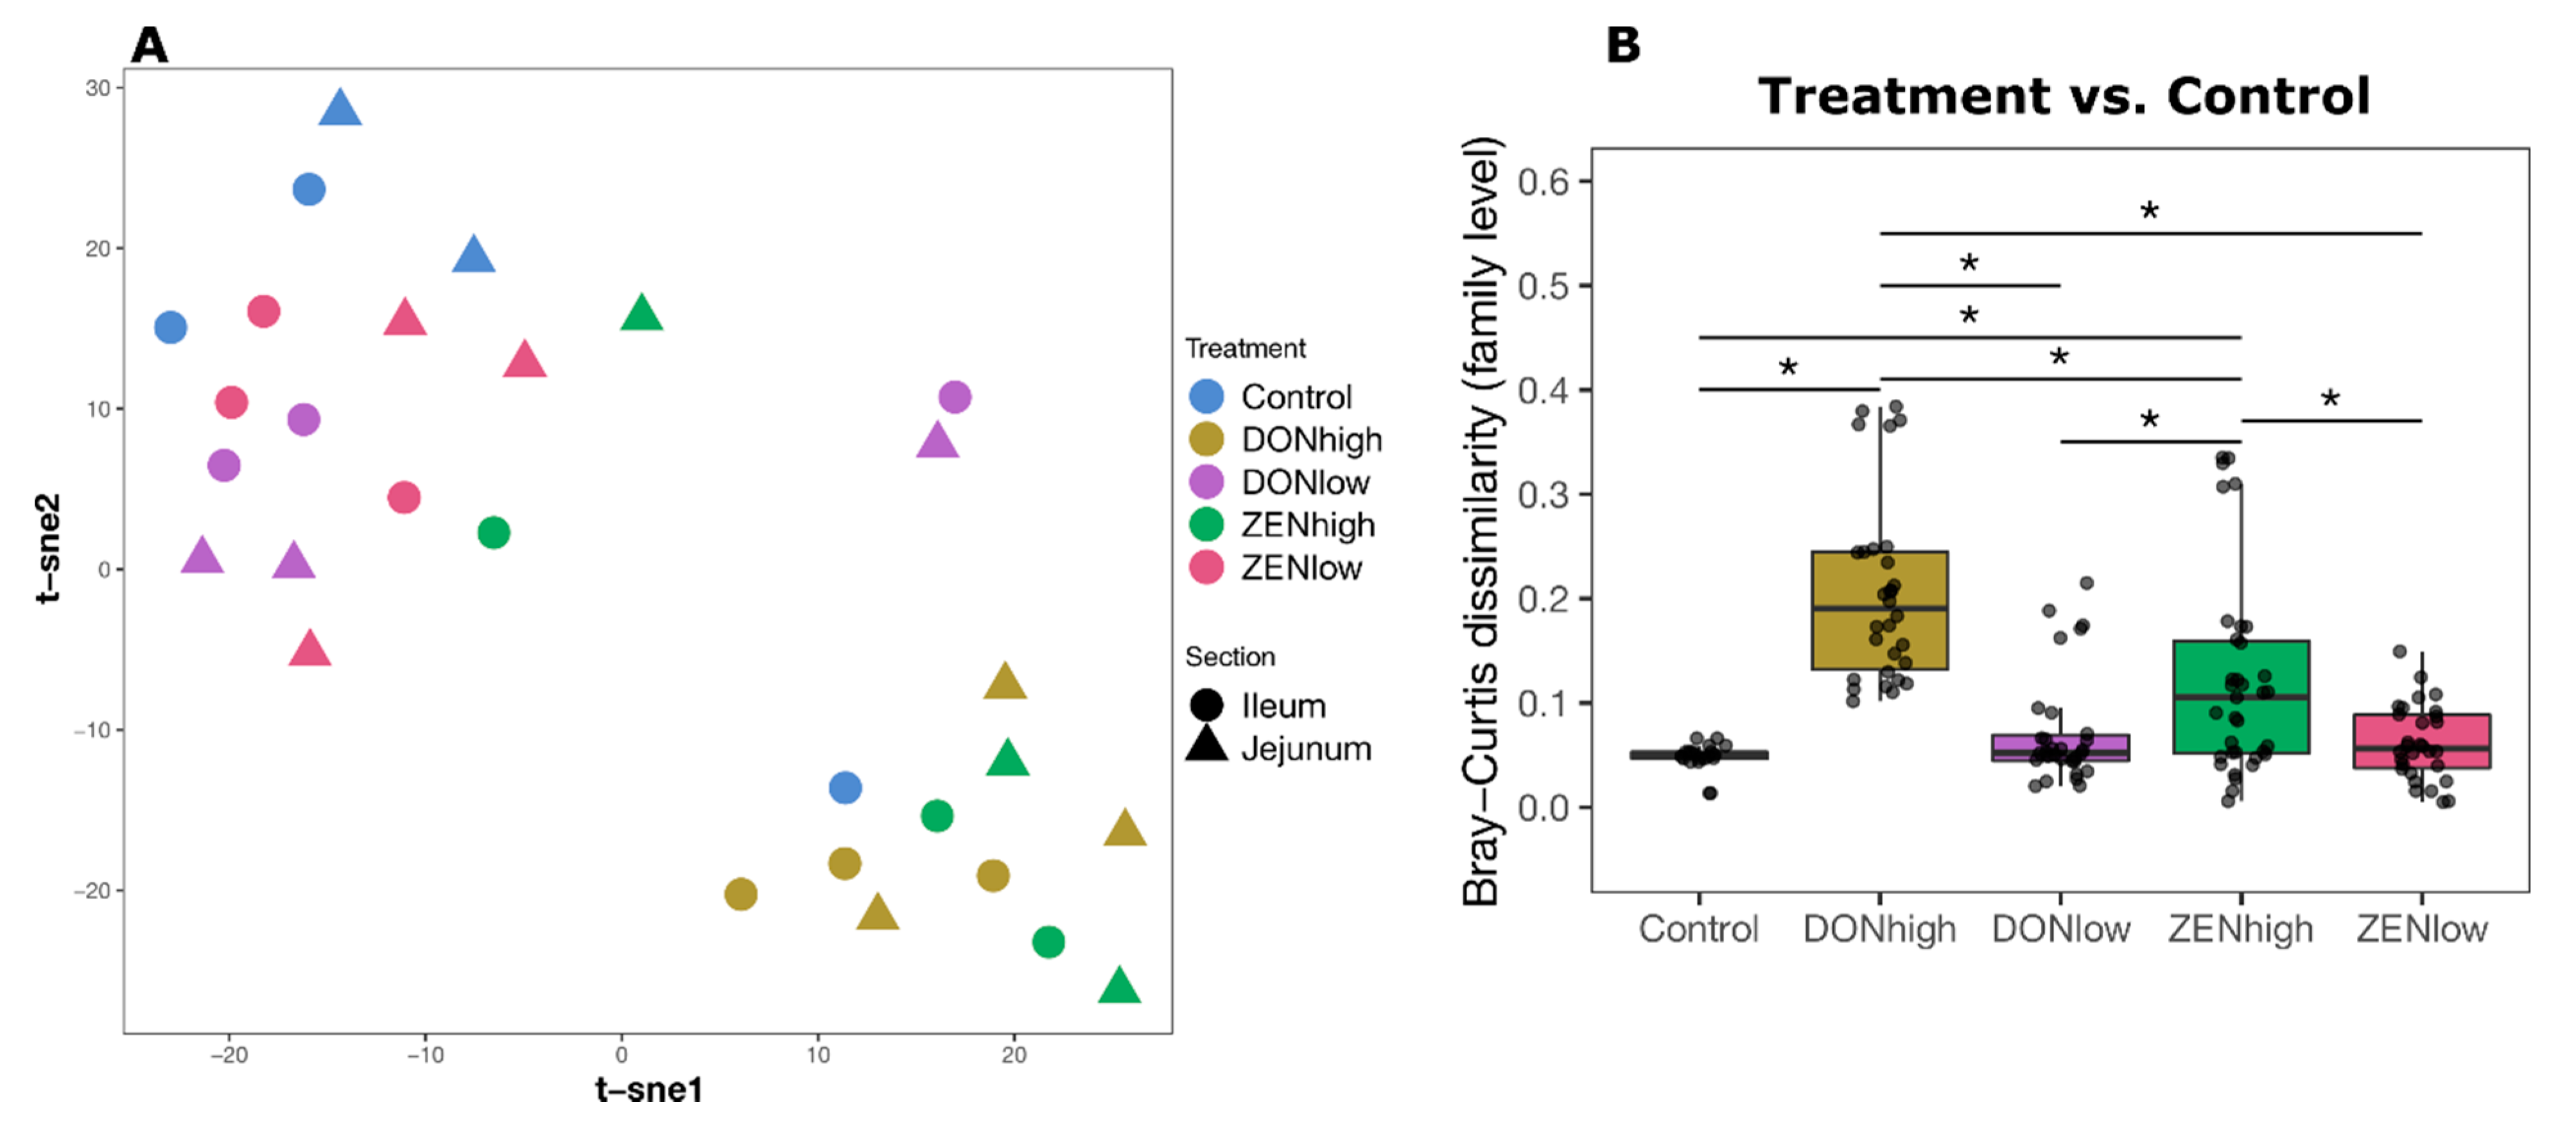
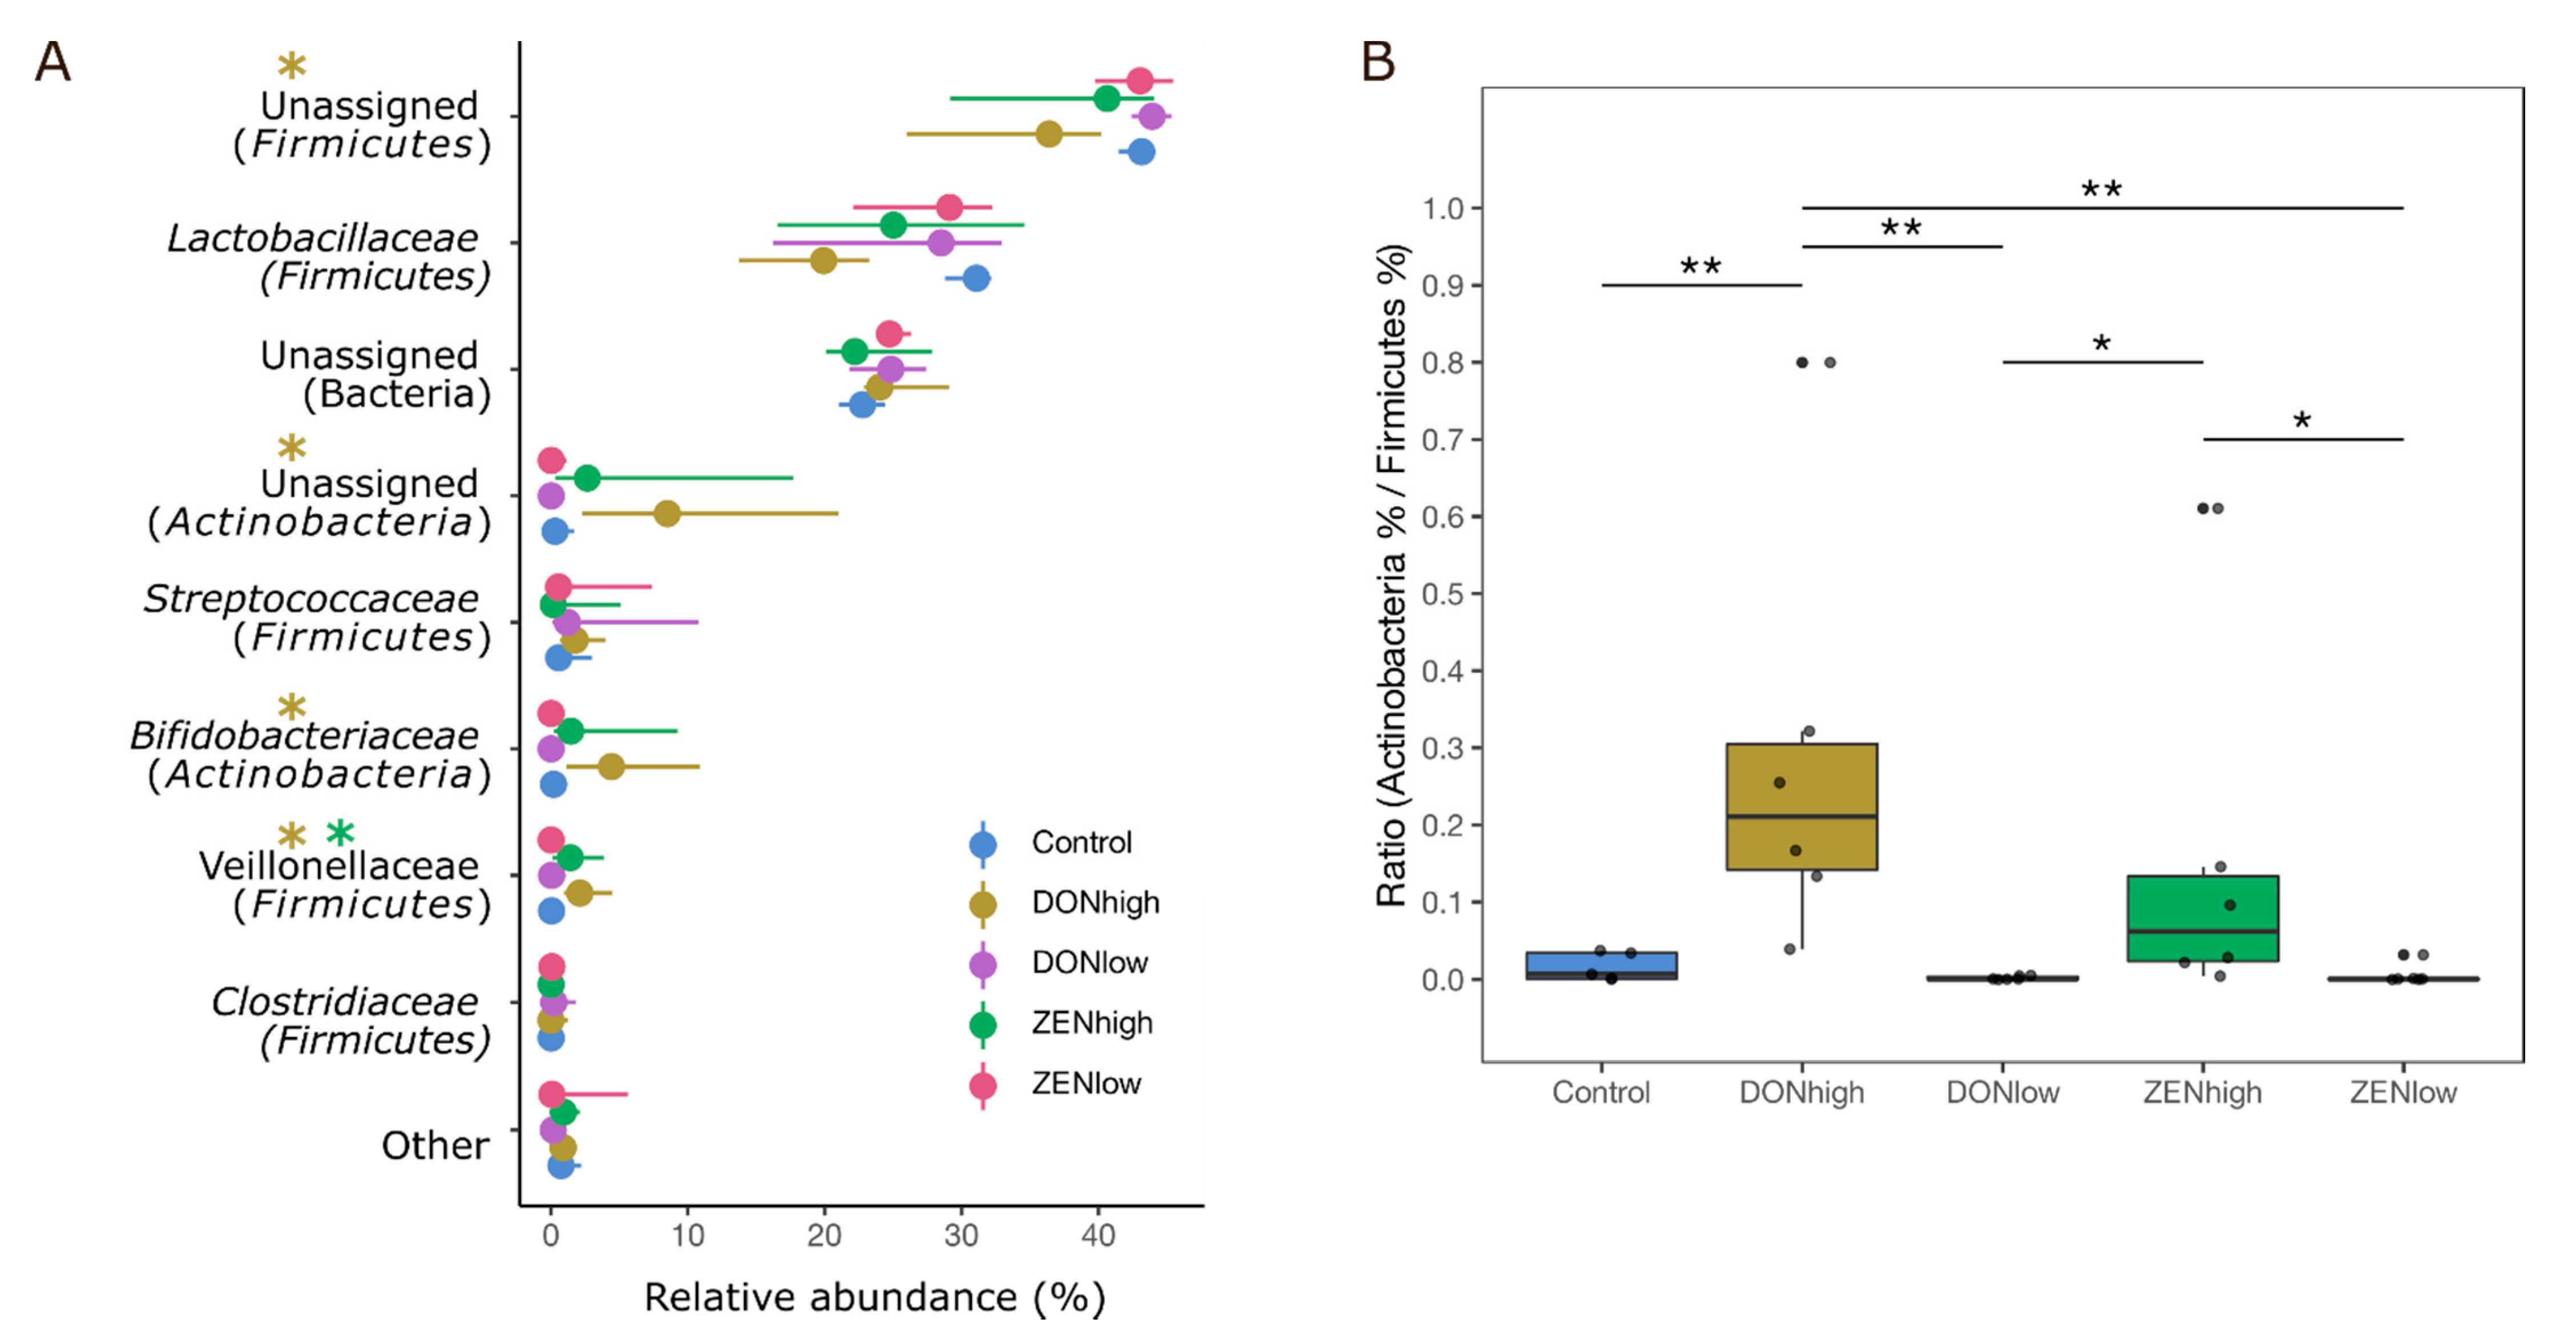
2.3. Effect of the Mycotoxins on Microbial Composition
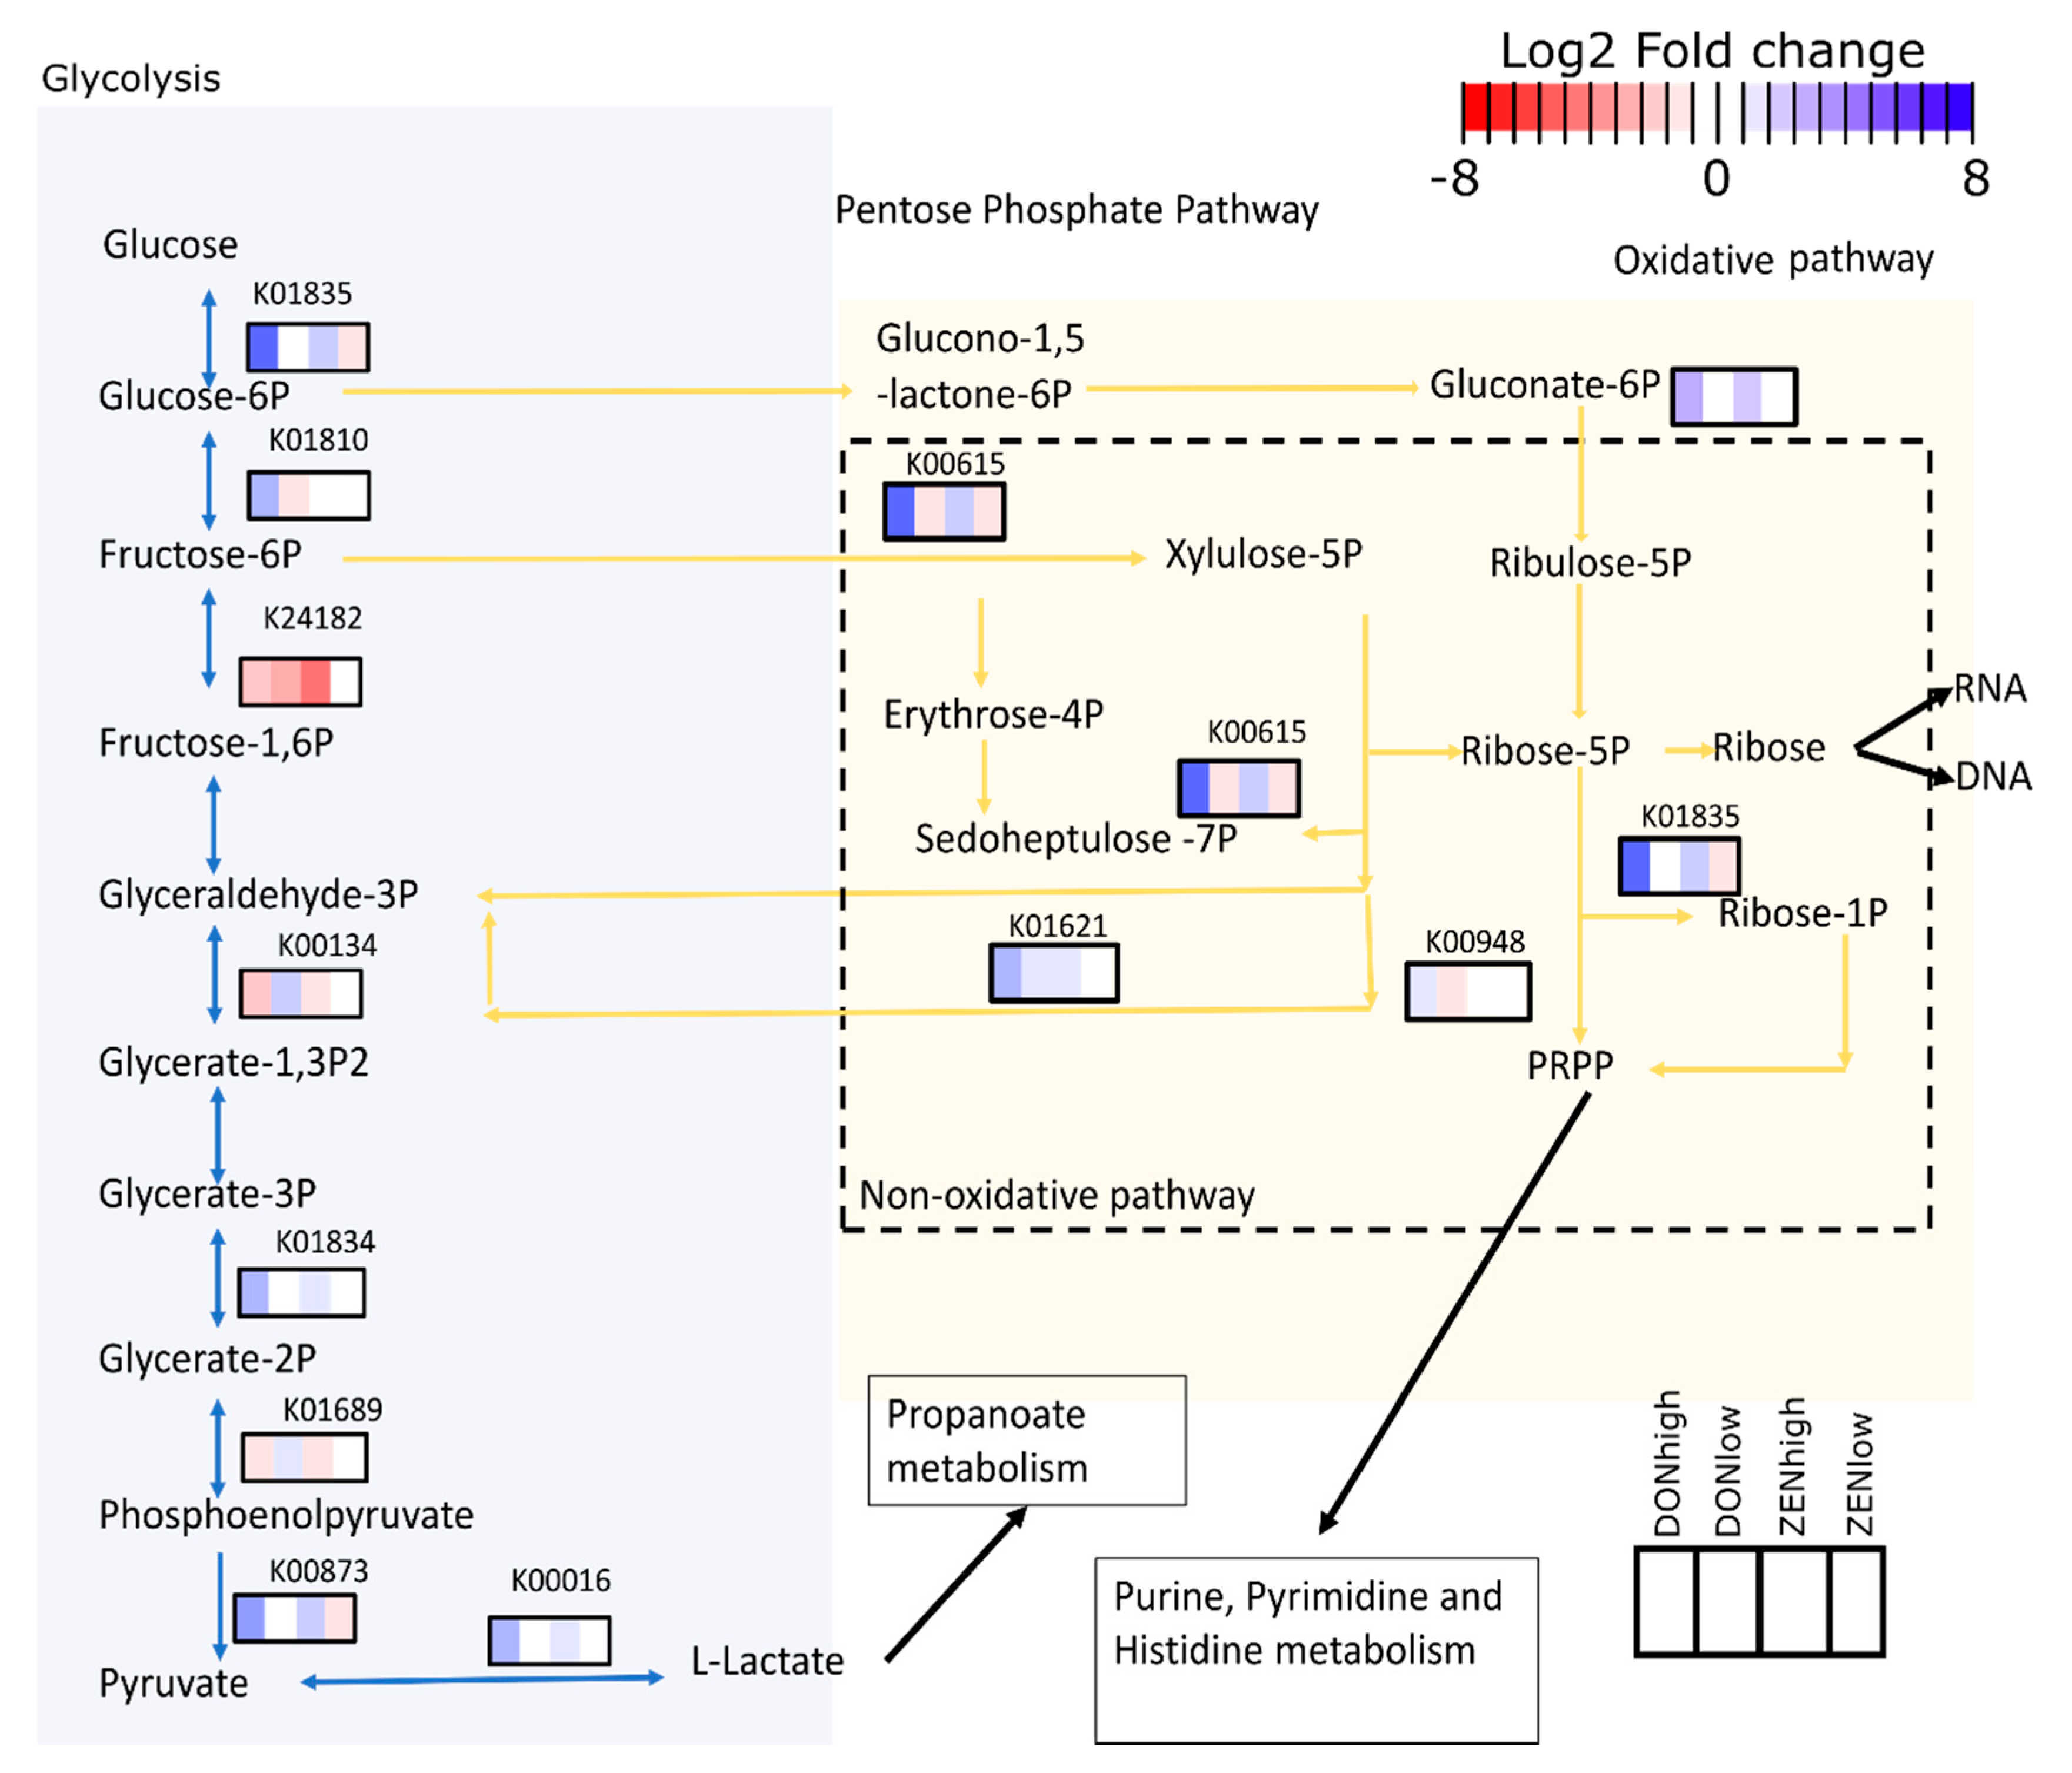
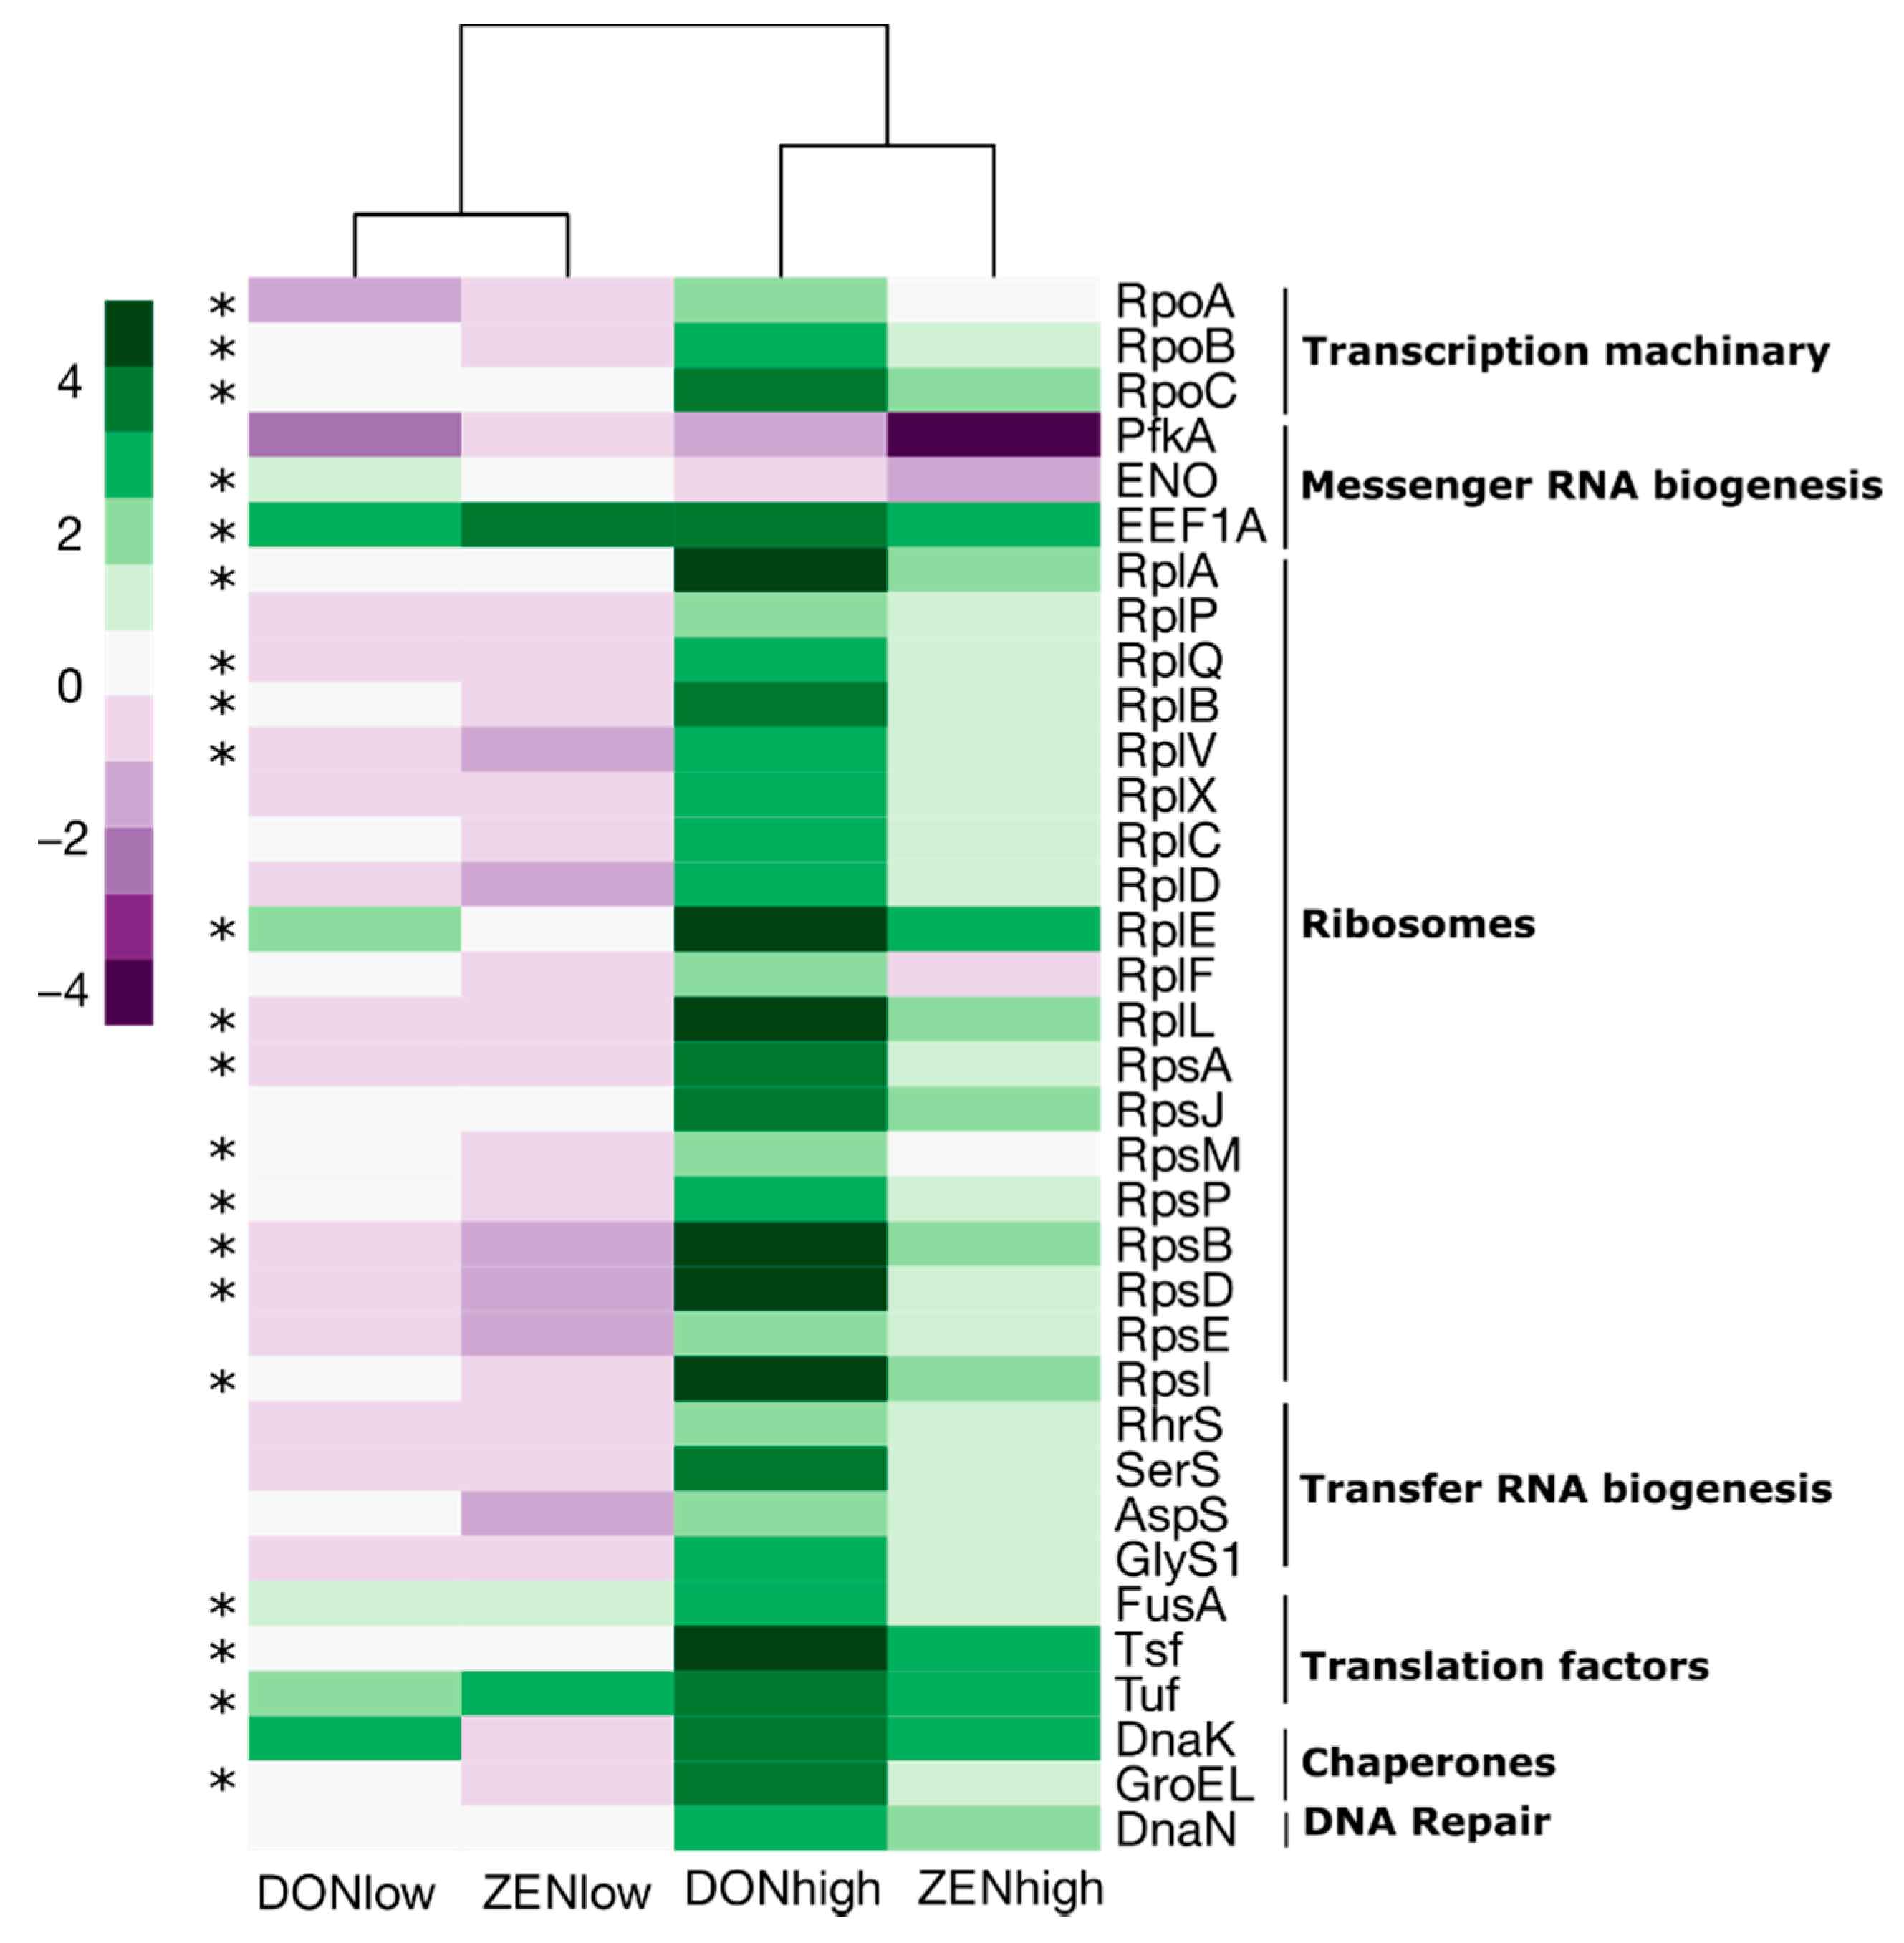
2.4. Effect of the Mycotoxins on Gut Microbiome Function
3. Discussion
4. Conclusions
5. Materials and Methods
5.1. Animal Experiment and Sampling
5.2. Sample Preparation
5.3. LC–MS/MS Analysis
5.4. Data Analysis
5.5. Statistical Analysis
5.6. Data Visualization
Supplementary Materials
Author Contributions
Funding
Institutional Review Board Statement
Data Availability Statement
Acknowledgments
Conflicts of Interest
Abbreviations
| DON | deoxynivalenol |
| ZEN | zearalenone |
| BW | Body weight |
| PP | Pentose phosphate |
| KO | KEGG orthology |
References
- Eskola, M.; Kos, G.; Elliott, C.T.; Hajšlová, J.; Mayar, S.; Krska, R. Worldwide contamination of food-crops with mycotoxins: Validity of the widely cited “FAO Estimate” of 25%. Crit. Rev. Food Sci. Nutr. 2020, 60, 2773–2789. [Google Scholar] [CrossRef]
- Gruber-Dorninger, C.; Jenkins, T.; Schatzmayr, G. Global mycotoxin occurrence in feed: A ten-year survey. Toxins 2019, 11, 375. [Google Scholar] [CrossRef] [Green Version]
- Bennett, J.W.; Klich, M. Mycotoxins. Clin. Microbiol. Rev. 2003, 16, 497–516. [Google Scholar] [CrossRef] [PubMed] [Green Version]
- Ismaiel, A.A.; Papenbrock, J. Mycotoxins: Producing fungi and mechanisms of phytotoxicity. Agriculture 2015, 5, 492–537. [Google Scholar] [CrossRef] [Green Version]
- Smith, M.-C.; Madec, S.; Coton, E.; Hymery, N. Natural co-occurrence of mycotoxins in foods and feeds and their in vitro combined toxicological effects. Toxins 2016, 8, 94. [Google Scholar] [CrossRef] [PubMed]
- Santos Pereira, C.; C Cunha, S.; Fernandes, J.O. Prevalent mycotoxins in animal feed: Occurrence and analytical methods. Toxins 2019, 11, 290. [Google Scholar] [CrossRef] [PubMed] [Green Version]
- Richard, J.L. Some major mycotoxins and their mycotoxicoses—An overview. Int. J. Food Microbiol. 2007, 119, 3–10. [Google Scholar] [CrossRef]
- Bullerman, L.B.; Bianchini, A. Stability of mycotoxins during food processing. Int. J. Food Microbiol. 2007, 119, 140–146. [Google Scholar] [CrossRef]
- Schaarschmidt, S.; Fauhl-Hassek, C. The fate of mycotoxins during the processing of wheat for human consumption. Compr. Rev. Food Sci. Food Saf. 2018, 17, 556–593. [Google Scholar] [CrossRef] [Green Version]
- Bryden, W.L. Mycotoxins in the food chain: Human health implications. Asia Pac. J. Clin. Nutr. 2007, 16, 95–101. [Google Scholar]
- Agriopoulou, S.; Stamatelopoulou, E.; Varzakas, T. Advances in occurrence, importance, and mycotoxin control strategies: Prevention and detoxification in foods. Foods 2020, 9, 137. [Google Scholar] [CrossRef] [PubMed]
- Adegbeye, M.J.; Reddy, P.R.K.; Chilaka, C.A.; Balogun, O.B.; Elghandour, M.M.; Rivas-Caceres, R.R.; Salem, A.Z.M. Mycotoxin toxicity and residue in animal products: Prevalence, consumer exposure and reduction strategies—A review. Toxicon 2020, 177, 96–108. [Google Scholar] [CrossRef]
- Liew, W.-P.-P.; Mohd-Redzwan, S. Mycotoxin: Its impact on gut health and microbiota. Front. Cell. Infect. Microbiol. 2018, 8, 60. [Google Scholar] [CrossRef] [Green Version]
- Omotayo, O.P.; Omotayo, A.O.; Mwanza, M.; Babalola, O.O. Prevalence of mycotoxins and their consequences on human health. Toxicol. Res. 2019, 35, 1–7. [Google Scholar] [CrossRef] [Green Version]
- Guerre, P. Mycotoxin and gut microbiota interactions. Toxins 2020, 12, 769. [Google Scholar] [CrossRef]
- Bünger, M.; Dippel, M.; Ruczizka, U.; Nagl, V.; Grenier, B.; Ladinig, A. Mykotoxine und ihr Einfluss auf die Schweinegesundheit. Tierärztliche Umsch. Pferd Nutztier 2020, 3, 22–28. [Google Scholar]
- Liu, M.; Zhang, L.; Chu, X.-H.; Ma, R.; Wang, Y.-W.; Liu, Q.; Zhang, N.-Y.; Karrow, N.A.; Sun, L.-H. Effects of deoxynivalenol on the porcine growth performance and intestinal microbiota and potential remediation by a modified HSCAS binder. Food Chem. Toxicol. 2020, 141, 111373. [Google Scholar] [CrossRef] [PubMed]
- Wang, J.; Tang, L.; Glenn, T.C.; Wang, J.-S. Aflatoxin B1 induced compositional changes in gut microbial communities of male F344 rats. Toxicol. Sci. 2016, 150, 54–63. [Google Scholar] [CrossRef] [PubMed] [Green Version]
- Li, P.; Yang, S.; Zhang, X.; Huang, S.; Wang, N.; Wang, M.; Long, M.; He, J. Zearalenone changes the diversity and composition of caecum microbiota in weaned rabbit. Biomed Res. Int. 2018, 2018, 3623274. [Google Scholar] [CrossRef] [PubMed] [Green Version]
- Lucke, A.; Böhm, J.; Zebeli, Q.; Metzler-Zebeli, B.U. Dietary deoxynivalenol contamination and oral lipopolysaccharide challenge alters the cecal microbiota of broiler chickens. Front. Microbiol. 2018, 9, 804. [Google Scholar] [CrossRef] [Green Version]
- Cano-Sancho, G.; González-Arias, C.A.; Ramos, A.J.; Sanchis, V.; Fernández-Cruz, M.L. Cytotoxicity of the mycotoxins deoxynivalenol and ochratoxin A on Caco-2 cell line in presence of resveratrol. Toxicol. In Vitro 2015, 29, 1639–1646. [Google Scholar] [CrossRef] [Green Version]
- Wang, X.; Yu, H.; Fang, H.; Zhao, Y.; Jin, Y.; Shen, J.; Zhou, C.; Zhou, Y.; Fu, Y.; Wang, J.; et al. Transcriptional profiling of zearalenone-induced inhibition of IPEC-J2 cell proliferation. Toxicon 2019, 172, 8–14. [Google Scholar] [CrossRef]
- Gao, Y.; Meng, L.; Liu, H.; Wang, J.; Zheng, N. The compromised intestinal barrier induced by mycotoxins. Toxins 2020, 12, 619. [Google Scholar] [CrossRef]
- Da Silva, E.O.; Bracarense, A.P.; Oswald, I.P. Mycotoxins and oxidative stress: Where are we? World Mycotoxin J. 2018, 11, 113–134. [Google Scholar] [CrossRef]
- Mullarky, E.; Cantley, L.C. Diverting glycolysis to combat oxidative stress. In Innovative Medicine: Basic Research and Development; Nakao, K., Minato, N., Uemoto, S., Eds.; Springer: Tokyo, Japan, 2018; ISBN 9784431556503. [Google Scholar]
- Kusch, H.; Engelmann, S.; Albrecht, D.; Morschhäuser, J.; Hecker, M. Proteomic analysis of the oxidative stress response in Candida albicans. Proteomics 2007, 7, 686–697. [Google Scholar] [CrossRef] [PubMed]
- Noster, J.; Persicke, M.; Chao, T.-C.; Krone, L.; Heppner, B.; Hensel, M.; Hansmeier, N. Impact of ROS-induced damage of TCA cycle enzymes on metabolism and virulence of Salmonella enterica serovar Typhimurium. Front. Microbiol. 2019, 10, 762. [Google Scholar] [CrossRef] [PubMed] [Green Version]
- Chavarría, M.; Nikel, P.I.; Pérez-Pantoja, D.; de Lorenzo, V. The Entner--Doudoroff pathway empowers Pseudomonas putida KT 2440 with a high tolerance to oxidative stress. Environ. Microbiol. 2013, 15, 1772–1785. [Google Scholar] [CrossRef]
- Hollinshead, W.D.; Rodriguez, S.; Martin, H.G.; Wang, G.; Baidoo, E.E.K.; Sale, K.L.; Keasling, J.D.; Mukhopadhyay, A.; Tang, Y.J. Examining Escherichia coli glycolytic pathways, catabolite repression, and metabolite channeling using Δpfk mutants. Biotechnol. Biofuels 2016, 9, 1–13. [Google Scholar] [CrossRef] [PubMed] [Green Version]
- Dubreuil, M.M.; Morgens, D.W.; Okumoto, K.; Honsho, M.; Contrepois, K.; Lee-McMullen, B.; Traber, G.M.; Sood, R.S.; Dixon, S.J.; Snyder, M.P.; et al. Systematic identification of regulators of oxidative stress reveals non-canonical roles for peroxisomal import and the pentose phosphate pathway. Cell Rep. 2020, 30, 1417–1433.e7. [Google Scholar] [CrossRef] [PubMed]
- Kugler, K.G.; Jandric, Z.; Beyer, R.; Klopf, E.; Glaser, W.; Lemmens, M.; Shams, M.; Mayer, K.; Adam, G.; Schüller, C. Ribosome quality control is a central protection mechanism for yeast exposed to deoxynivalenol and trichothecin. BMC Genom. 2016, 17, 417. [Google Scholar] [CrossRef] [Green Version]
- Jyoti, P.; Shree, M.; Joshi, C.; Prakash, T.; Ray, S.K.; Satapathy, S.S.; Masakapalli, S.K. The Entner-Doudoroff and nonoxidative pentose phosphate pathways bypass glycolysis and the oxidative pentose phosphate pathway in Ralstonia solanacearum. mSystems 2020, 5, e00091-20. [Google Scholar] [CrossRef] [PubMed] [Green Version]
- Su, T.; Si, M.; Zhao, Y.; Liu, Y.; Yao, S.; Che, C.; Chen, C. A Thioredoxin-dependent peroxiredoxin Q from Corynebacterium glutamicum plays an important role in defense against oxidative stress. PLoS ONE 2018, 13, e0192674. [Google Scholar] [CrossRef] [Green Version]
- Latifi, A.; Ruiz, M.; Jeanjean, R.; Zhang, C.-C. PrxQ-A, a member of the peroxiredoxin Q family, plays a major role in defense against oxidative stress in the cyanobacterium Anabaena sp. strain PCC7120. Free Radic. Biol. Med. 2007, 42, 424–431. [Google Scholar] [CrossRef] [PubMed]
- Achard, M.E.S.; Hamilton, A.J.; Dankowski, T.; Heras, B.; Schembri, M.S.; Edwards, J.L.; Jennings, M.P.; McEwan, A.G. A Periplasmic thioredoxin-like protein plays a role in defense against oxidative stress in Neisseria gonorrhoeae. Infect. Immun. 2009, 77, 4934–4939. [Google Scholar] [CrossRef] [Green Version]
- Yu, Y.; Wu, H.; Tang, Y.; Qiu, L. Cloning, expression of a peroxiredoxin gene from Acinetobacter sp. SM04 and characterization of its recombinant protein for zearalenone detoxification. Microbiol. Res. 2012, 167, 121–126. [Google Scholar] [CrossRef]
- Tang, Y.; Xiao, J.; Chen, Y.; Yu, Y.; Xiao, X.; Yu, Y.; Wu, H. Secretory expression and characterization of a novel peroxiredoxin for zearalenone detoxification in Saccharomyces cerevisiae. Microbiol. Res. 2013, 168, 6–11. [Google Scholar] [CrossRef]
- Kollarczik, B.; Gareis, M.; Hanelt, M. In vitro transformation of the Fusarium mycotoxins deoxynivalenol and zearalenone by the normal gut microflora of pigs. Nat. Toxins 1994, 2, 105–110. [Google Scholar] [CrossRef] [PubMed]
- Gao, L.; Zhou, Z.; Chen, X.; Zhang, W.; Lin, M.; Chen, M. Comparative proteomics analysis reveals new features of the oxidative stress response in the polyextremophilic bacterium Deinococcus radiodurans. Microorganisms 2020, 8, 451. [Google Scholar] [CrossRef] [PubMed] [Green Version]
- Calloni, G.; Chen, T.; Schermann, S.M.; Chang, H.-C.; Genevaux, P.; Agostini, F.; Tartaglia, G.G.; Hayer-Hartl, M.; Hartl, F.U. DnaK functions as a central hub in the E. coli chaperone network. Cell Rep. 2012, 1, 251–264. [Google Scholar] [CrossRef] [PubMed] [Green Version]
- Susin, M.F.; Baldini, R.L.; Gueiros-Filho, F.; Gomes, S.L. GroES/GroEL and DnaK/DnaJ have distinct roles in stress responses and during cell cycle progression in Caulobacter crescentus. J. Bacteriol. 2006, 188, 8044–8053. [Google Scholar] [CrossRef] [Green Version]
- Daud, N.; Currie, V.; Duncan, G.; Farquharson, F.; Yoshinari, T.; Louis, P.; Gratz, S. Prevalent human gut bacteria hydrolyse and metabolise important food-derived mycotoxins and masked mycotoxins. Toxins 2020, 12, 654. [Google Scholar] [CrossRef] [PubMed]
- Million, M.; Tidjani Alou, M.; Khelaifia, S.; Bachar, D.; Lagier, J.-C.; Dione, N.; Brah, S.; Hugon, P.; Lombard, V.; Armougom, F.; et al. Increased gut redox and depletion of anaerobic and methanogenic prokaryotes in severe acute malnutrition. Sci. Rep. 2016, 6, 26051. [Google Scholar] [CrossRef] [PubMed]
- Cieplińska, K.; Gajęcka, M.; Dąbrowski, M.; Rykaczewska, A.; Lisieska-Żołnierczyk, S.; Bulińska, M.; Zielonka, Ł.; Gajęcki, M.T. Time-dependent changes in the intestinal microbiome of gilts exposed to low zearalenone doses. Toxins 2019, 11, 296. [Google Scholar] [CrossRef] [PubMed] [Green Version]
- Tilocca, B.; Witzig, M.; Rodehutscord, M.; Seifert, J. Variations of phosphorous accessibility causing changes in microbiome functions in the gastrointestinal tract of chickens. PLoS ONE 2016, 11, e0164735. [Google Scholar] [CrossRef] [PubMed] [Green Version]
- Goldberg, S. Mechanical/physical methods of cell disruption and tissue homogenization. Methods Mol. Biol. 2008, 424, 3–22. [Google Scholar] [CrossRef]
- Crowell, A.M.J.; Wall, M.J.; Doucette, A.A. Maximizing recovery of water-soluble proteins through acetone precipitation. Anal. Chim. Acta 2013, 796, 48–54. [Google Scholar] [CrossRef]
- Shapiro, A.L.; Viñuela, E.; Maizel, J.V., Jr. Molecular weight estimation of polypeptide chains by electrophoresis in SDS-polyacrylamide gels. Biochem. Biophys. Res. Commun. 1967, 28, 815–820. [Google Scholar] [CrossRef]
- Laemmli, U.K. Cleavage of structural proteins during the assembly of the head of bacteriophage T4. Nature 1970, 227, 680–685. [Google Scholar] [CrossRef]
- Raymond, S.; Weintraub, L. Acrylamide gel as a supporting medium for zone electrophoresis. Science 1959, 130, 711. [Google Scholar] [CrossRef]
- Jehmlich, N.; Schmidt, F.; Hartwich, M.; von Bergen, M.; Richnow, H.-H.; Vogt, C. Incorporation of carbon and nitrogen atoms into proteins measured by protein-based stable isotope probing (Protein-SIP). Rapid Commun. Mass Spectrom. 2008, 22, 2889–2897. [Google Scholar] [CrossRef]
- Cheng, K.; Ning, Z.; Zhang, X.; Li, L.; Liao, B.; Mayne, J.; Stintzi, A.; Figeys, D. MetaLab: An automated pipeline for metaproteomic data analysis. Microbiome 2017, 5, 157. [Google Scholar] [CrossRef] [PubMed] [Green Version]
- Xiao, L.; Estellé, J.; Kiilerich, P.; Ramayo-Caldas, Y.; Xia, Z.; Feng, Q.; Liang, S.; Pedersen, A.Ø.; Kjeldsen, N.J.; Liu, C.; et al. A Reference gene catalogue of the pig gut microbiome. Nat. Microbiol. 2016, 1, 16161. [Google Scholar] [CrossRef] [PubMed]
- Li, L.; Ning, Z.; Zhang, X.; Mayne, J.; Cheng, K.; Stintzi, A.; Figeys, D. RapidAIM: A culture- and metaproteomics-based rapid assay of individual microbiome responses to drugs. Microbiome 2020, 8, 33. [Google Scholar] [CrossRef] [PubMed] [Green Version]
- Oksanen, J.; Blanchet, F.G.; Friendly, M.; Kindt, R.; Legendre, P.; McGlinn, D.; Minchin, P.R.; O’Hara, R.B.; Simpson, G.L.; Solymos, P.; et al. Vegan: Community Ecology Package. 2020. R Package Version 2.5-7. Available online: https://CRAN.R-project.org/package=vegan (accessed on 20 August 2021).
- R Core Team. R: A Language and Environment for Statistical Computing; R Foundation for Statistical Computing: Vienna, Austria, 2020; Available online: https://www.R-project.org/ (accessed on 20 August 2021).
- Shah, A.D.; Goode, R.J.A.; Huang, C.; Powell, D.R.; Schittenhelm, R.B. LFQ-Analyst: An easy-to-use interactive web platform to analyze and visualize label-free proteomics data preprocessed with MaxQuant. J. Proteome Res. 2020, 19, 204–211. [Google Scholar] [CrossRef]
- Kanehisa, M.; Sato, Y. KEGG mapper for inferring cellular functions from protein sequences. Protein Sci. 2020, 29, 28–35. [Google Scholar] [CrossRef] [PubMed] [Green Version]
- Luo, W.; Pant, G.; Bhavnasi, Y.K.; Blanchard, S.G., Jr.; Brouwer, C. Pathview Web: User friendly pathway visualization and data integration. Nucleic Acids Res. 2017, 45, W501–W508. [Google Scholar] [CrossRef] [PubMed]


Publisher’s Note: MDPI stays neutral with regard to jurisdictional claims in published maps and institutional affiliations. |
© 2021 by the authors. Licensee MDPI, Basel, Switzerland. This article is an open access article distributed under the terms and conditions of the Creative Commons Attribution (CC BY) license (https://creativecommons.org/licenses/by/4.0/).
Share and Cite
Saenz, J.S.; Kurz, A.; Ruczizka, U.; Bünger, M.; Dippel, M.; Nagl, V.; Grenier, B.; Ladinig, A.; Seifert, J.; Selberherr, E. Metaproteomics Reveals Alteration of the Gut Microbiome in Weaned Piglets Due to the Ingestion of the Mycotoxins Deoxynivalenol and Zearalenone. Toxins 2021, 13, 583. https://doi.org/10.3390/toxins13080583
Saenz JS, Kurz A, Ruczizka U, Bünger M, Dippel M, Nagl V, Grenier B, Ladinig A, Seifert J, Selberherr E. Metaproteomics Reveals Alteration of the Gut Microbiome in Weaned Piglets Due to the Ingestion of the Mycotoxins Deoxynivalenol and Zearalenone. Toxins. 2021; 13(8):583. https://doi.org/10.3390/toxins13080583
Chicago/Turabian StyleSaenz, Johan S., Alina Kurz, Ursula Ruczizka, Moritz Bünger, Maximiliane Dippel, Veronika Nagl, Bertrand Grenier, Andrea Ladinig, Jana Seifert, and Evelyne Selberherr. 2021. "Metaproteomics Reveals Alteration of the Gut Microbiome in Weaned Piglets Due to the Ingestion of the Mycotoxins Deoxynivalenol and Zearalenone" Toxins 13, no. 8: 583. https://doi.org/10.3390/toxins13080583
APA StyleSaenz, J. S., Kurz, A., Ruczizka, U., Bünger, M., Dippel, M., Nagl, V., Grenier, B., Ladinig, A., Seifert, J., & Selberherr, E. (2021). Metaproteomics Reveals Alteration of the Gut Microbiome in Weaned Piglets Due to the Ingestion of the Mycotoxins Deoxynivalenol and Zearalenone. Toxins, 13(8), 583. https://doi.org/10.3390/toxins13080583