Abstract
This study investigated the natural incidence of deoxynivalenol (DON) in corn and corn products from corn-producing districts of Punjab, Pakistan. The analysis was carried out using high performance liquid chromatography (HPLC) with UV detector and immunoaffinity cleanup columns. The detection limit (LOD) and limit of quantification were 25 and 50 µg/kg, respectively. A total of 1220 samples of corn and corn products were analyzed to detect DON, and 539 (44.2%) samples were observed to be contaminated with DON (n ≥ LOD). Furthermore, 92 (7.5%) samples of corn and corn products had DON levels that were higher than the proposed limits of the EU. The data are significantly different from a normal distribution of DON in samples of corn and corn products from different locations (p < 0.05) for Shapiro–Wilk and Kolmogorov–Smirnov values. However, a significant difference in DON levels was found between corn and corn-derived products (p ≤ 0.05). The lowest and highest exposures, and hazard quotient (HQ) values of 0.92 and 9.68 µg/kg bw/day, were documented in corn flour samples.
Key Contribution:
A total of 1220 samples of corn and corn products from three districts of Punjab were analyzed for DON. In all, 539 samples (44.2%) of corn and corn products were found to be positive with DON (n ≥ LOD), while 92 samples (7.5%) of corn and corn products contained levels of DON greater than the proposed limits of the EU (1000 µg/kg; 750 µg/kg). The lowest and highest exposures, and HQ levels of 0.92 and 9.68 µg/kg bw/day, were documented in corn flour samples.
1. Introduction
Corn (Zea mays) is the third most produced crop in Pakistan after wheat and rice. Its share of the country’s total cereal cultivation area is 8.5%; it is responsible for 2.2% of value added in the agriculture sector and 0.4% of gross domestic product (GDP). Corn plays a vital role in the country’s economy through its multiple domestic, commercial and industrial uses. In 2017–2018, corn production was estimated at 5.8 million tons, 3% higher than the previous year, reflecting its in-country demand. Hybrid corn is cultivated in about 40% of the corn-growing area, and its share in total corn production is around 70%. About 65% of corn is utilized in the poultry industry, 10% is used in dairy feed, 15% is used in wet milling and the remainder is used for human consumption and seeds [1]. Corn is a cereal that is susceptible to attacks by fungi and the subsequent production of mycotoxins (e.g., deoxynivalenol (DON)) [2,3].
Mycotoxins are recognized as secondary metabolites and are produced by fungi, mainly Aspergillus, Penicillium, Fusarium, Alternaria and Cladosporium [4,5,6,7]. Fusarium is widely dispersed in nature and causes spoilage or deterioration of food and feeds [8]. DON, also identified as vomitoxin, is a secondary fungal metabolite to the class of trichothecenes and is produced by the genus Fusarium, especially F. graminearum [9,10,11,12,13]. Previous studies have documented the toxic effects of trichothecenes, such as feed refusal, hemorrhage, vomiting, diarrhea, anemia and immunosuppression [14,15,16].
In a previous study by Raza et al. [17], 63 of 100 samples from rural, semirural and urban areas in the central cities of Punjab, Pakistan, were found to be contaminated with DON. The results indicated that 63% of corn samples were contaminated with DON, and from these samples, almost 66% had levels higher than 1250 μg/kg. Furthermore, 49.2% of samples had levels higher than 1401 μg/kg. The results indicated that the levels were higher in samples from rural areas, both in corn (1512 μg/kg) and wheat (1585 μg/kg). Similarly, the effect of seasonal variation on the levels of DON in wheat and corn samples was investigated in Punjab, Pakistan [18]. The results showed that 87 (61.2%) samples of corn and corn products from summer and 57 samples (44.5%) from winter were contaminated, with concentrations ranging from 50 to 2967 µg/kg and 50 to 2490 µg/kg, respectively.
Different countries and organizations have established maximum limits for DON in raw and processed cereal products. The Codex Alimentarius Commission has established a permissible limit of 2000 µg/kg in raw barley, wheat and corn. Similarly, the EU has also established a limit of 2000 µg/kg in unprocessed wheat and oats. However, a permissible legal limit of 1000 µg/kg exists for raw or unprocessed cereals, 750 µg/kg for foodstuffs intended for consumers and dry pasta and 200 µg/kg for snacks and breakfast cereals for children [19]. The proposed daily intake limit for DON is 1 µg/kg bw.
Pakistan is located in the tropics, and therefore, the environmental conditions encourage fungal growth and production [5,20]. Although corn is a major cash crop, previous studies have shown that this substrate is more vulnerable to fungi attack and contamination. However, there is not enough information available on the prevalence of DON in corn-derived foods in Pakistan. Consequently, the existing study was designed to examine the incidence of levels of DON in corn and corn-derived products and compare these levels with EU-recommended regulations. The assessment of levels of DON in corn and corn products will also help disseminate this information to farmers, traders and other stakeholders in Pakistan.
2. Results
2.1. Method Validation
The recovery analysis of DON in corn and corn products is presented in Table 1. The recoveries were in the range of 81.3% to 91.0%, and the relative standard deviation varied from 11% to 28%. The detection limit (LOD) and limit of quantification (LOQ) were 25 and 50 µg/kg, respectively. The straight-line equation was constructed, and the coefficient of determination (0.9992) was obtained, as shown in Supplementary Figure S1.

Table 1.
Recovery percentage of deoxynivalenol (DON) in corn and corn products.
2.2. Incidence of DON in Corn and Corn Products
The occurrence of DON in 1220 samples of corn and corn products (449 samples from Gujranwala, 378 from Hafizabad and 393 from Sheikhupura) is presented in Table 2 and Table 3. In total, 539 samples of corn and corn products (44.2%) were found to be positive (n ≥ LOD) with DON. Of the 449 samples of corn and corn products from Gujranwala, 197 (43.9%) were found to be positive with DON (Table 2).
Table 2.
Occurrence of DON in corn and corn products from Gujranwala, Punjab, Pakistan.
Table 3.
Occurrence of DON in corn and corn products from Sheikhupura, Punjab, Pakistan.
The maximum average of 1256.2 ± 124.5 µg/kg of DON was found in corn type 1 samples and varied from 25 to 5687.5 µg/kg. Table 4 shows that 166 (43.9%) of the 378 samples of corn and corn products from Hafizabad were positive, with the maximum average (1489.4 ± 190.8 µg/kg) in corn type 4 samples ranging from 25 to 5540.5 µg/kg. Furthermore, 176 (44.8%) of the 393 samples of corn and corn products from Sheikhupura were found to be contaminated with DON, and the maximum average (1489.4 ± 180.5 µg/kg) was found in corn type 4 samples, with concentration ranging from 25 to 5540.5 µg/kg. About 92 (7.5%) samples of corn and corn products were found to be contaminated with DON at levels higher than the EU’s proposed limits [19], as represented in Figure 1.
Table 4.
Occurrence of DON in corn and corn products from Hafizabad, Punjab, Pakistan.
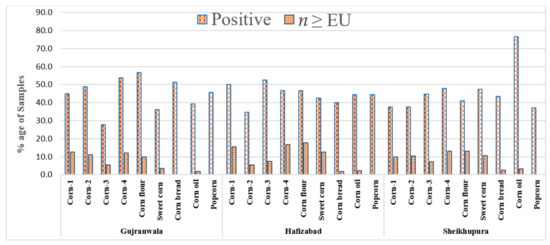
Figure 1.
Percentage of samples of corn and corn products having levels of deoxynivalenol (DON) higher than the EU’s recommended limits (1000 µg/kg for unprocessed corn and 750 µg/kg for foodstuffs).
The data are significantly different from a normal distribution of DON in different types of corn and corn products from different locations, considering the high values of skewness and kurtosis and p ≤ 0.00 for the Shapiro–Wilk and Kolmogorov–Smirnov values. The ANOVA of DON levels in different corn and corn products was statistically significant (p ≤ 0.000). The amounts of DON in corn and corn products from different locations were nonsignificant (p ≥ 0.05), as shown in Table 5. Furthermore, Table 6 shows the least significant difference (LSD) of the different types of corn and corn products.
Table 5.
ANOVA of DON levels in corn and corn products from various locations.
Table 6.
Least significant difference (LSD) analysis of different types of corn and corn products within groups of samples.
2.3. Estimation of Exposure Assessment of DON in Corn Flour
The assessment of exposure of DON levels in corn flour from different locations is presented in Table 7. The highest DON exposure was 9.68 µg/kg bw/day, and the lowest exposure was 0.92 µg/kg bw/day in corn flour samples from the Gujranwala district.
Table 7.
Exposure assessment of DON in corn flour from corn-producing cities of Punjab, Pakistan.
3. Discussion
3.1. Method Validation
The results showed that the analytical parameters such as accuracy and precision of DON in corn and corn products were within the European Commission’s recommended guidelines [21,22]. According to the guidelines, the recoveries of DON should be within the range of 60% to 110%, and the repeatability and reproducibility should be ≤20% and ≤40%, respectively. Furthermore, for DON values >500 µg/kg, the recommendations are 70% to 120% recoveries, and repeatability and reproducibility must be less than 20% and 40%, respectively [22,23]. The determination coefficient was ≥0.999, and LOD and LOQ were 25 and 50 µg/kg, respectively. The coefficient of determination was quite similar to the value from our previous study by Iqbal et al. [18]. However, the LOD and LOQ are much lower in the current study. Ok et al. [23] documented a coefficient of determination of ≥0.999 and found LOD and LOQ values in ranges of 6.4 to 10.0 µg/kg and 21.3 to 33.5 µg/kg, respectively. Yang et al. [24] demonstrated the LOD of 12.2 µg/kg for DON in corn samples using SPE cleanup. In another study, relatively high LOD and LOQ values for DON—i.e., 30 and 40 µg/kg—were documented in milling fractions of wheat using multifunctional column cleanup [25]. Golge and Kabak [26] determined LOQ values of 46.90 to 72.30 µg/kg of DON in various cereal products, higher than the LOQ of the present study.
3.2. Incidence of DON in Corn and Corn Products
The results have shown comparatively high levels of DON in corn and corn products from three districts, i.e., Gujranwala, Hafizabad and Sheikhupura in Punjab, Pakistan. In our previous study [18], we investigated the seasonal variation of DON levels in corn and corn products and documented that samples from summer have a higher incidence—i.e., 87 (61.2%)—than the samples from winter (44.5%). The maximum average observed was 1434.8 ± 25.5 µg/kg in corn flour samples from summer, and the lowest mean level was 620.8 ±17.8 µg/kg in corn bread from winter. A high incidence level of DON compared to the present results was observed in Spain, where almost 68% of commercial corn-based food samples were found to be positive, with levels ranging from 29 to 195 µg/kg [27]. In Turkey, Golge and Kabak [26] assessed 13 wheat samples (58 to 1092 µg/kg), 3 barley samples (138 to 973 µg/kg), 7 paddy rice samples (136 to 256 µg/kg), 3 wheat flour samples (92 to 151 µg/kg), 2 biscuit samples (31.2 to 71.3 µg/kg) and 1 pasta sample (59.3 µg/kg). However, two corn samples were found to be contaminated with DON (313 to 331 µg/kg). All the samples contained levels below the recommended EU limits.
A high amount of DON was documented in wheat and cereal samples from Austria, Germany, Slovakia and Australia [28] (42 to 4130 µg/kg with an average amount of 977 ± 1000 µg/kg). In Cameroon, Njobeh et al. [29] documented that 65% of 82 samples of dried food commodities contained DON levels ranging from 13 to 273 µg/kg. The occurrence and maximum amount of DON found in corn by Paladin et al. [30] in Croatia were higher than the levels found in the current study. They reported that 85% of samples were positive, with the highest concentration being 17,920 µg/kg. In Portugal, Marques et al. [31] analyzed 307 samples of plant crops, with a mean DON concentration of 70 μg/kg and a maximum amount of 17,900 μg/kg. Vidal et al. [32] from Spain observed DON in 42% of bran samples, with the highest amount being 6178 μg/kg, and 13 samples (19%) exceeded the EU’s allowable limit. In Serbia, Jajić et al. [33] documented that 32% of corn samples were contaminated; in Hungary, 86% of samples were contaminated with DON [34].
However, earlier studies have documented low levels of DON compared to those in the present survey. Escobar et al. [3] from Spain analyzed 25 samples of corn oil with mean levels of DON at 31 μg/kg. Similarly, Giménez et al. [35], also from Spain, found 10 of 25 samples of wheat germ oil with mean levels of DON at 41 μg/kg.
It is worth mentioning that regional variation was found in DON levels. Hot weather conditions promote the formation of fusarium-producing fungi and the production of mycotoxins [36]. The elevated prevalence of DON in corn and corn products in summer compared to winter was confirmed in our previous study [17]. Fernandez et al. [37] from the United States documented DON levels in cereal samples that were lower than the levels reported by Ngoko et al. [38] in corn from Cameroon. Temperate conditions favor the production of DON [39]. Furthermore, high levels of humidity combined with high temperature could enhance the growth rate of fungi belonging to the genus Fusarium [40]. Variation in sampling size is another factor that should be considered a significant source of variation in mycotoxins [41]. The elevated amount of DON in corn and corn products could be explained by farmers in Pakistan still using traditional methods in rural areas with cheap varieties of corn and not using crop rotation or a no-till method. Furthermore, the storage of corn in mud bins could enhance the contamination of cereal crops [42].
3.3. Exposure Assessment of DON in Corn Flour
In our previous study, by Iqbal et al. [18], the maximum DON exposure observed in wheat flour in summer was 8.8 µg/kg bw/day. According to the WHO [43], if ADD is greater than the provisional maximum tolerable daily intake (PMTDI), then the potential for health risk exists. The individual or population may suffer a health risk if the hazard quotient (HQ) > 1. The health risks are limited if individuals or a population are exposed to a level of DON less than 1, i.e., if HQ < 1. An exposure of 1.052 µg/kg bw/day of DON was estimated in bread and toasts [44], comparable to the exposure of DON found in the current research. An exposure of 0.027 to 0.038 µg/kg bw/day was observed by Cano-Sancho et al. [45]. The current study’s finding of a high HQ level of 1.11 in the Hafizabad and Sheikhupura districts could indicate serious risk factors for the local populations.
4. Conclusions
Evaluating the findings of this research and comparing them with the EU’s limit for mycotoxins reflects that the prevalence and amounts of DON were comparatively high. About 7.5% of samples of corn and corn products were contaminated with DON at levels greater than the EU’s suggested limits. The exposure and HQ amount of DON in corn and corn products were also high. Adopting good storage practices would reduce the level of DON in cereals because generally, in Pakistan, cereal crops are stored and transported in jute bags, which could absorb moisture from the environment or surface where the crop is stored. The recommendation could be to store these crops in polyethylene bags during transport and in the storage area. Furthermore, moisture, humidity and temperature should be controlled during the storage period, and farmers should use resistant crop varieties. In vivo study of DON levels in blood and urine from local consumers should be used to assess exposure and implement regulations.
5. Materials and Methods
5.1. Sampling
The 1220 samples of corn and corn products (corn flour, sweet corn, corn bread, corn oil and popcorn) from three Punjab districts (n = 449 Gujranwala, n = 378 Hafizabad, n = 393 Sheikhupura) were collected from June 2018 to January 2019. A simple random methodology (each portion or lot has an equal chance to be included) was used for collecting samples of corn and corn products from farmers, markets and superstores. The gross samples were taken by hand and then homogenized and properly labeled. These three districts are well-known producers of corn in Punjab, Pakistan. Due to the high variability of fungi and mycotoxins in kernel samples, each sample size was not less than 2 kg. Then, the kernel samples were mixed and ground in adequate particle size (Retsch, ZM 200, Haan, Düsseldorf, Germany). The lab sample portion was stored in plastic bags and kept in a freezer at −20 °C.
5.2. Chemicals and Reagents
A pure standard of DON (100 mg/mL in ACN) from Sigma-Aldrich (St. Louis, MO, USA) was available in the lab (a food safety lab). High-grade purity (≥99%) solvents of acetonitrile, methanol and polyethylene glycol 8000 (PEG) were acquired from Sigma-Aldrich (Sigma-Aldrich, Lyon, France). The method’s linearity was assessed with seven-point concentrations (100, 200, 800, 1600, 3200, 6400 and 9000 µg/kg) of DON and stored in capped vials at a temperature of −20 °C. All other chemicals used were of analytical grade and available in the lab.
5.3. Extraction and HPLC Parameters
The extraction of DON in corn and corn products was carried out using our previously validated method [17]. Briefly, the sample (5 g) and PEG (1 g) were mixed in 20 mL of ultrapure water, homogenized in 50 mL Teflon tubes and centrifuged at room temperature for 1 min at 6500 rpm. The extraction of corn bread was carried out by adding 200 mL water to dry bread and then homogenizing for 5 min at room temperature at 8000 rpm, as discussed above. After centrifugation, the mixture was filtered and the filtrate (5 mL) was passed through to the immunoaffinity column (IAC-NIV WB, columns) (VICAM, Watertown, MA, USA). The column was washed twice with 10 mL purified water, and the DON was eluted using 1 mL of pure methanol from the IAC column. Then, 0.5 mL of pure water was added to 0.5 mL of eluate and subjected to HPLC analysis, after passing through 0.22 µm nylon syringe filters. The study used a Shimadzu (Kyoto, Japan) HPLC system with a C18 Supelco column (250 × 4.6 × 5 mm) (Discovery HS, Bellefonte, PA, USA). The UV detector (RF-530) was set at a detection wavelength of 218 nm. The mobile phase was 30% methanol and 70% water, with a flow rate of 1.2 mL/min.
5.4. Exposure Assessment
According to the literature, the level of DON found in food in the present study is considered reasonable. Further, it was believed that exposure to DON was only through corn flour, this being the main ingredient in the Pakistani diet. The mean and highest levels of DON in corn flour were used to assess exposure, and an adult body weight is regarded as 65 kg bw. The per capita consumption of corn flour was 0.07 kg [1]. The exposure was assessed using the formula of Equation (1):
where ADDDON is the average daily dose of DON, CDON is the concentration of DON in corn flour, IR is the intake rate of corn flour and bw is body weight.
The hazard quotient (HQ) values for the mean and highest levels of DON in corn flour were also estimated and equaled to exposure assessment studies. The provisional maximum tolerable daily intake (PMTDI) was 1 µg/kg bw for DON [20]. The HQ was determined following the formula shown in Equation (2):
5.5. Method Validation
All the method validation parameters were performed for the assessment of DON in corn and corn products. The recovery analysis was performed. The fortified levels (100, 150, 300, 400, 800, 3000 µg/kg) of DON were added in uncontaminated samples of corn and corn product samples. The LOD and LOQ were assessed as 3:1 and 10:1 signal-to-noise ratios, respectively.
5.6. Statistical Analysis
The results of DON levels in corn and corn products were subjected to statistical analysis using SPSS (version 26 for Windows, SPSS Inc., Chicago, USA). The DON levels in different corn samples and from different locations were checked for normal distribution (Shapiro–Wilks test). ANOVA was applied to investigate the difference of means (DON levels) between different types of corn and corn products and from different locations. The least significant difference (LSD) was used to investigate differences within each type or each location. A probability value of 0.05 was used to determine the statistical significance.
Supplementary Materials
The following are available online at https://www.mdpi.com/article/10.3390/toxins13050296/s1, Figure S1: The standard curve of DON.
Author Contributions
Conceptualization, supervision, writing—original draft preparation, writing—review and editing: S.Z.I.; software, funding acquisition, review and editing: A.F.A.R.; resources: S.U. and N.B.A.; visualization, validation, formal analysis: M.R.A. All authors have read and agreed to the published version of the manuscript.
Funding
The research was funded by Higher Education Commission, Islamabad, Pakistan, with grant no. NRPU-8025. The APC was provided by The Universiti Putra Malaysia, Malaysia.
Institutional Review Board Statement
Not applicable.
Informed Consent Statement
Not applicable.
Data Availability Statement
The data will be available upon request.
Acknowledgments
The authors acknowledge the analytical facilities provided by NIAB, Faisalabad, Pakistan.
Conflicts of Interest
The authors declare no conflict of interest.
References
- USDA. Pakistan: Grain and Feed Annual. GAIN Report Number: PK1707. 2017. Available online: https://www.fas.usda.gov/data/pakistan-grain-and-feed-annual-3 (accessed on 24 January 2021).
- Aniołowska, M.; Steininger, M. Determination of trichothecenes and zearalenone in different corn (Zea mays) cultivars for human consumption in Poland. J. Food Comp. Anal. 2014, 33, 14–19. [Google Scholar] [CrossRef]
- Escobar, J.; Loran, S.; Gimenez, I.; Ferraz, E.; Herrera, M.; Herrera, A.; Arino, A. Occurrence and exposure assessment of Fusarium mycotoxins in maize germ, refined corn oil and margarine. Food Chem. Toxicol. 2013, 62, 514–520. [Google Scholar] [CrossRef] [PubMed]
- Sweeney, M.J.; Dobson, A.D. Mycotoxin production by Aspergillus, Fusarium and Penicillium species. Int. J. Food Microbiol. 1998, 43, 141–158. [Google Scholar] [CrossRef]
- Majeed, S.; Asi, M.R.; Iqbal, M.; Iqbal, S.Z.; Jinap, S. Analysis of nutritional traits and comparison of aflatoxins contamination in selected maize varieties from Pakistan. J. Food Prot. 2017, 80, 1993–1998. [Google Scholar] [CrossRef]
- Iqbal, S.Z.; Asi, M.R.; Jinap, S. Detection of aflatoxins and zearalenone contamination in wheat-derived products. Food Control 2014, 35, 223–226. [Google Scholar] [CrossRef]
- Agriopoulou, S.; Stamatelopoulou, E.; Varzakas, T. Advances in occurrence, importance and mycotoxin control strategies: Prevention and detoxification in foods. Foods 2020, 9, 137. [Google Scholar] [CrossRef]
- Martins, H.M.; Almeida, I.; Marques, M.F.; Guerra, M.M. Fumonisins and deoxynivalenol in corn-based food products in Portugal. Food Chem. Toxicol. 2008, 46, 2585–2587. [Google Scholar] [CrossRef]
- Marasas, W.F.O. Toxigenic Fusaria. In Mycotoxins and Animal Foods; Smith, J.E., Ed.; CRS Press Inc.: Boston, MA, USA, 1991; pp. 216–252. [Google Scholar]
- Tanaka, T.; Yamamoto, S.; Hasegawa, A.; Aoki, N.; Besling, J.R.; Sugiura, Y.; Ueno, Y. A survey of the natural occurrence of Fusarium mycotoxins, deoxynivalenol, nivalenol and zearalenone, in cereal harvested in the Netherlands. Mycopathologia 1990, 110, 19–22. [Google Scholar] [CrossRef]
- Trucksess, M.W.; Thomas, F.; Young, K.; Stack, M.E.; Fulguers, W.J.; Page, S.W. Survey of deoxynivalenol in US 1993 wheat and barley crop by enzyme-linked-immunosorbent-assay. J. AOAC Int. 1995, 78, 631–636. [Google Scholar] [CrossRef]
- Placenta, C.M.; D’Mello, J.P.F.; Macdonald, A.M.C. A review of worldwide contamination of cereal grains and animal feed with Fusarium mycotoxins. Animal Feed Sci. Technol. 1999, 78, 21–37. [Google Scholar] [CrossRef]
- Iqbal, S.Z.; Rehman, B.; Jinap, S.; Akram, N.; Ahmad, M.N.; Sanny, M.; Sukor, R.; Samsudin, N.I. Assessment of fumonisin B1 concentrations in wheat and barley products in the Punjab region of Pakistan. J. Food Prot. 2020, 83, 1284–1288. [Google Scholar] [CrossRef]
- Pestka, J.J.; Bondy, J.S. Alterations of immune function following dietary mycotoxin exposure. Can. J. Physiol. Pharmacol. 1990, 68, 1009–1016. [Google Scholar] [CrossRef]
- Pestka, J.J.; Smolinski, A.T. Deoxynivalenol: Toxicology and potential effects on humans. J. Toxicol. Environ. Health Part B 2005, 8, 39–69. [Google Scholar] [CrossRef]
- Hussein, H.S.; Brasel, J.M. Toxicity, metabolism and impact of mycotoxins on humans and animals. Toxicology 2001, 167, 101–134. [Google Scholar] [CrossRef]
- Raza, H.M.F.; Asi, M.R.; Maqbool, U. Assessment of deoxynivalenol (don) mycotoxin in corn and wheat grains consumed in central Punjab, Pakistan. Pak. J. Bot. 2020, 52, 2205–2210. [Google Scholar] [CrossRef]
- Iqbal, S.Z.; Usman, S.; Razis, A.F.A.; Ali, N.B.; Saif, T.; Asi, M.R. Assessment of deoxynivalenol in wheat, corn and products and estimation of dietary intake. Int. J. Environ. Res. Public Health 2020, 17, 5602. [Google Scholar] [CrossRef]
- European Commission. Commission Regulation No. 1881/2006 of 19 December 2006 setting maximum levels for certain contaminants in foodstuff. Eur. J. Union 2006, 364, 5–24. [Google Scholar]
- Iqbal, S.Z.; Asi, M.R.; Ariño, A.; Akram, N.; Zuber, M. Aflatoxin contamination in different fractions of rice from Pakistan and estimation of dietary intakes. Mycotoxin Res. 2012, 28, 175–180. [Google Scholar] [CrossRef]
- Joint Food and Agriculture Organization/World Health Organization Expert Committee on Food Additives (JECFA). Evaluation of Certain Food Additives and Contaminants (Report of the 72nd Meeting of the Joint FAO/WHO Expert Committee on Food Additives (JECFA)); WHO Technical Report Series; WHO: Geneva, Switzerland, 2010; p. 958. [Google Scholar]
- European Commission. Commission Regulation (EC) No. 401/2006 of 23 February 2006 laying down the methods of sampling and analysis for the official control of the levels of mycotoxins in foodstuffs. Eur. Comm. 2006, 70, 12–35. [Google Scholar]
- Ok, H.E.; Lee, S.Y.; Chun, H.S. Occurrence and simultaneous determination of nivalenol and deoxynivalenol in rice and bran by HPLC-UV detection and immunoaffinity cleanup. Food Control 2018, 87, 53–59. [Google Scholar] [CrossRef]
- Yang, D.; Geng, Z.M.; Ma, H.X.; Yao, J.B.; Zhang, X.; Zhang, P.P.; Zhang, P. Establishment of a HPLC-UV method for simultaneous determination of DON, 15AcDON, and 3AcDON in wheat. Acta Agron. Sin. 2012, 38, 186–189. [Google Scholar] [CrossRef]
- Thammawong, M.; Okabe, M.; Kawasaki, T.; Nakagawa, H.; Nagashima, H.; Okadome, H.; Nakajima, T.; Kushiro, M. Distribution of deoxynivalenol and nivalenol in milling fractions from Fusarium-infected Japanese wheat cultivars. J. Food Prot. 2010, 73, 1817–1823. [Google Scholar] [CrossRef]
- Golge, O.; Kabak, B. Occurrence of deoxynivalenol and zearalenone in cereals and cereal products from Turkey. Food Control 2020, 110, 106982. [Google Scholar] [CrossRef]
- Cerveró, M.C.; Castillo, M.Ã.; Montes, R.; Hernández, E. Determination of trichothecenes, zearalenone and zearalenols in commercially available corn-based foods in Spain. Rev. Iberoam. Micol. 2007, 24, 52–55. [Google Scholar] [CrossRef]
- Berthiller, F.; Dall’asta, C.; Corradini, R.; Marchelli, R.; Sulyok, M.; Krska, R.; Adam, G.; Schuhmacher, R. Occurrence of deoxynivalenol and its 3-β-D-glucoside in wheat and maize. Food Addict. Contam. Part A 2009, 26, 507–511. [Google Scholar] [CrossRef]
- Nobel, P.B.; Dutton, M.F.; Koch, S.H.; Chuturgoon, A.A.; Stoev, S.D.; Mosonik, J.S. Simultaneous occurrence of mycotoxins in human food commodities from Cameroon. Mycotoxin Res. 2010, 26, 47–57. [Google Scholar]
- Paladin, J.; Sokolović, M.; Perši, N.; Zadravec, M.; Jaki, V.; Vulić, A. Contamination of maize with deoxynivalenol and zearalenone in Croatia. Food Control 2012, 28, 94–98. [Google Scholar] [CrossRef]
- Marques, M.F.; Martins, H.M.; Costa, J.M.; Bernardo, F. Co-occurrence of deoxynivalenol and zearalenone in crops marketed in Portugal. Food Addict. Contam. Part B 2008, 1, 130–133. [Google Scholar] [CrossRef]
- Vidal, A.; Marín, S.; Ramos, A.J.; Cano-Sancho, G.; Sanchis, V. Determination of aflatoxins, deoxynivalenol, ochratoxin A and zearalenone in wheat and oat-based bran supplements sold in the Spanish market. Food Chem. Toxicol. 2013, 53, 133–138. [Google Scholar] [CrossRef]
- Jajić, I.; Jurić, V.; Glamočić, D.; Abramović, B. Occurrence of deoxynivalenol in maize and wheat in Serbia. Int. J. Mol. Sci. 2008, 9, 2114–2126. [Google Scholar] [CrossRef]
- Tima, H.; Brückner, A.; Mohácsi-Farkas, C.; Kiskó, G. Fusarium mycotoxins in cereals harvested from Hungarian fields. Food Addict. Contam. Part B 2016, 9, 127–131. [Google Scholar] [CrossRef] [PubMed]
- Giménez, I.; Herrera, M.; Escobar, J.; Ferraz, E.; Lorán, S.; Herrera, A.; Ariño, A. Distribution of deoxynivalenol and zearalenone in milled germ during wheat milling and analysis of toxin levels in wheat germ and wheat germ oil. Food Control 2013, 34, 268–273. [Google Scholar] [CrossRef]
- Hirooka, E.Y.; Yamaguchi, M.M.; Aoyama, S.; Sugiura, Y.; Ueno, Y. The natural occurrence of fumonisins in Brazilian corn kernels. Food Addict. Contam. 1996, 13, 173–183. [Google Scholar] [CrossRef] [PubMed]
- Fernandez, C.; Stack, M.E.; Musser, S.M. Determination of deoxynivalenol in 1991 in US winter and spring wheat by high-performance thin-layer chromatography. J. Assoc. Off. Anal. Chem. Int. 1994, 77, 628–630. [Google Scholar]
- Ngoko, Z.; Marasas, W.F.O.; Rheeder, J.P.; Shephard, G.S.; Wingfield, M.J.; Cardwell, K.F. Fungal infection and mycotoxin contamination of maize in the humid forest and the western highlands of Cameroon. Phytoparacitica 2001, 29, 352–360. [Google Scholar] [CrossRef]
- Devegowda, G.; Raju, M.V.; Nazar, A.; Swamy, H.V. Mycotoxin picture worldwide: Novel solutions for their counteraction. In Biotechnology in the Feed Industry. Proceedings of Alltech’s 14th Annual Symposium; Nottingham University Press: Nottingham, UK, 1998; pp. 241–255. [Google Scholar]
- Soriano, J.M.; Dragacci, S. Occurrence of fumonisins in foods. Food Res. Int. 2004, 37, 985–1000. [Google Scholar] [CrossRef]
- Whitaker, T.B.; Truckess, W.M.; Johansson, A.S.; Giesbrecht, F.G.; Hagler, W.M., Jr.; Bowman, D.T. Variability associated with testing shelled corn for fumonisin. J. Assoc. Off. Anal. Chem. Int. 1998, 81, 1162–1168. [Google Scholar] [CrossRef]
- Iqbal, S.Z.; Rabbani, T.; Asi, M.R.; Jinap, S. Assessment of aflatoxins, ochratoxin A and zearalenone in breakfast cereals. Food Chem. 2014, 157, 257–262. [Google Scholar] [CrossRef]
- World Health Organization (WHO). Principles and Methods for the Risk Assessment of Chemicals in Food; World Health Organization: Geneva, Switzerland, 2009; Volume 240. [Google Scholar]
- Raad, F.; Nasreddine, L.; Hilan, C.; Bartosik, M.; Parent-Massin, D. Dietary exposure to aflatoxins, ochratoxin A and deoxynivalenol from a total diet study in an adult urban Lebanese population. Food Chem. Toxicol. 2014, 73, 35–43. [Google Scholar] [CrossRef]
- Cano-Sancho, G.; Ramos, V.; Marín, S.; Sanchis, V. Micotoxinas. Estudio de dieta Total en Cataluña 2008–2009; Generalitat de Cataluña: Barcelona, Spain, 2012; pp. 135–140. [Google Scholar]

Publisher’s Note: MDPI stays neutral with regard to jurisdictional claims in published maps and institutional affiliations. |
© 2021 by the authors. Licensee MDPI, Basel, Switzerland. This article is an open access article distributed under the terms and conditions of the Creative Commons Attribution (CC BY) license (http://creativecommons.org/licenses/by/4.0/).